Soil moisture and hydrology projections of the permafrost region - a model intercomparison
←
→
Page content transcription
If your browser does not render page correctly, please read the page content below
The Cryosphere, 14, 445–459, 2020
https://doi.org/10.5194/tc-14-445-2020
© Author(s) 2020. This work is distributed under
the Creative Commons Attribution 4.0 License.

Soil moisture and hydrology projections of the permafrost region –
a model intercomparison
Christian G. Andresen1,2 , David M. Lawrence3 , Cathy J. Wilson2 , A. David McGuire4 , Charles Koven5 ,
Kevin Schaefer6 , Elchin Jafarov6,2 , Shushi Peng7,18 , Xiaodong Chen8,19 , Isabelle Gouttevin9,10 , Eleanor Burke11 ,
Sarah Chadburn12 , Duoying Ji13 , Guangsheng Chen14 , Daniel Hayes15 , and Wenxin Zhang16,17
1 Department   of Geography, University of Wisconsin–Madison, Madison, Wisconsin, USA
2 Earth  and Environmental Science Division, Los Alamos National Laboratory, Los Alamos, New Mexico, USA
3 National Center for Atmospheric Research, Boulder, Colorado, USA
4 Institute of Arctic Biology, University of Alaska Fairbanks, Fairbanks, Alaska, USA
5 Climate and Ecosystem Sciences Division, Lawrence Berkeley National Laboratory, Berkeley, California, USA
6 Institute of Arctic and Alpine Research, University of Colorado Boulder, Boulder, Colorado, USA
7 Laboratoire de Glaciologie et Géophysique de l’Environnement (LGGE),

Université Grenoble Alps and CNRS, Grenoble, France
8 Department of Civil and Environmental Engineering, University of Washington, Seattle, Washington, USA
9 IRSTEA-HHLY, Lyon, France
10 IRSTEA-ETNA, Grenoble, France
11 Met Office Hadley Centre, Exeter, UK
12 School of Earth and Environment, University of Leeds, Leeds, UK
13 College of Global Change and Earth System Science, Beijing Normal University, Beijing, China
14 Environmental Sciences Division, Oak Ridge National Laboratory, Oak Ridge, Tennessee, USA
15 School of Forest Resources, University of Maine, Maine, USA
16 Department of Physical Geography and Ecosystem Science, Lund University, Lund, Sweden
17 Center for Permafrost (CENPERM), Department of Geosciences and Natural Resource Management,

University of Copenhagen, Copenhagen, Denmark
18 College of Urban and Environmental Sciences, Peking University, No. 5 Yiheyuan Road,

Haidian District, Beijing 100871, China
19 Atmospheric Sciences and Global Change Division, Pacific Northwest National Laboratory, Richland, WA, USA

Correspondence: Christian G. Andresen (candresen@wisc.edu)

Received: 12 June 2019 – Discussion started: 9 July 2019
Revised: 24 November 2019 – Accepted: 13 December 2019 – Published: 5 February 2020

Abstract. This study investigates and compares soil mois-       plained by infiltration of moisture to deeper soil layers as
ture and hydrology projections of broadly used land models      the active layer deepens or permafrost thaws completely. Al-
with permafrost processes and highlights the causes and im-     though most models agree on drying, the projections vary
pacts of permafrost zone soil moisture projections. Climate     strongly in magnitude and spatial pattern. Land models tend
models project warmer temperatures and increases in pre-        to agree with decadal runoff trends but underestimate runoff
cipitation (P ) which will intensify evapotranspiration (ET)    volume when compared to gauge data across the major Arc-
and runoff in land models. However, this study shows that       tic river basins, potentially indicating model structural limita-
most models project a long-term drying of the surface soil      tions. Coordinated efforts to address the ongoing challenges
(0–20 cm) for the permafrost region despite increases in the    presented in this study will help reduce uncertainty in our ca-
net air–surface water flux (P -ET). Drying is generally ex-     pability to predict the future Arctic hydrological state and as-

Published by Copernicus Publications on behalf of the European Geosciences Union.
446                               C. G. Andresen et al.: Soil moisture and hydrology projections of the permafrost region

sociated land–atmosphere biogeochemical processes across           how differences in process representation affect projections
spatial and temporal scales.                                       of permafrost landscapes.
                                                                      Upgrades in permafrost representation such as freeze and
                                                                   thaw processes in the land component of Earth system mod-
                                                                   els have improved understanding of the evolution of hydrol-
                                                                   ogy in high northern latitudes. Particularly, soil thermal dy-
1   Introduction                                                   namics and active-layer hydrology upgrades include the ef-
                                                                   fects of unfrozen water on phase change, insulation by snow
Hydrology plays a fundamental role in permafrost land-             (Peng et al., 2016), organic soils (Jafarov and Schaefer, 2016;
scapes by modulating complex interactions among biogeo-            Lawrence et al., 2008) and the hydraulic properties of frozen
chemical cycling (Frey and Mcclelland, 2009; Newman                soils (Swenson et al., 2012). Nonetheless, large discrepan-
et al., 2015; Throckmorton et al., 2015), geomorphology            cies in projections remain as the current generation of mod-
(Grosse et al., 2013; Kanevskiy et al., 2017; Lara et al., 2015;   els substantially differ in soil thermal dynamics (e.g., Peng et
Liljedahl et al., 2016), and ecosystem structure and func-         al., 2016; Wang et al., 2016). In particular, variability among
tion (Andresen et al., 2017; Avis et al., 2011; Oberbauer et       current models’ simulations of the impact of permafrost thaw
al., 2007). Permafrost has a strong influence on hydrology         on soil water and hydrological states is not well documented.
by controlling surface and subsurface distribution and the         Therefore, in this study we analyze the output of a collection
storage, drainage and routing of water. Permafrost prevents        of widely used permafrost-enabled land models. These mod-
vertical water flow, which often leads to saturated soil con-      els participated in the Permafrost Carbon Network Model
ditions in continuous permafrost while confining subsurface        Intercomparison Project (PCN-MIP; McGuire et al., 2018,
flow through perennially unfrozen zones (a.k.a. taliks) in dis-    2016) and contained the state-of-the-art representations of
continuous permafrost (Jafarov et al., 2018; Walvoord and          soil thermal dynamics in high latitudes at that time. In par-
Kurylyk, 2016). However, with the observed (Streletskiy et         ticular, we assess how changes in active-layer thickness and
al., 2008) and predicted (Slater and Lawrence, 2013) thawing       permafrost thaw influence near-surface soil moisture and hy-
of permafrost, there is a large uncertainty in the future hydro-   drology projections under climate change. In addition, we
logical state of permafrost landscapes and in the associated       provide comments on the main gaps and challenges in per-
responses such as the permafrost carbon–climate feedback.          mafrost hydrology simulations and highlight the potential
   The timing and magnitude of the permafrost carbon–              implications for the permafrost carbon–climate feedback.
climate feedback is, in part, governed by changes in sur-
face hydrology, through the regulation by soil moisture of
the form of carbon emissions from thawing labile soils and         2     Methods
microbial decomposition as either CO2 or CH4 (Koven et al.,
2015; Schädel et al., 2016; Schaefer et al., 2011). The impact     2.1    Models and simulation protocol
of soil moisture changes on the permafrost carbon feedback
could be significant. Lawrence et al. (2015) found that the        This study assesses a collection of terrestrial simulations
impact of the soil drying projected in simulations with the        from models that participated in the PCN-MIP (McGuire
Community Land Model decreased the overall global warm-            et al., 2018, 2016; Table 1). The analysis presented here is
ing potential of the permafrost carbon–climate feedback by         unique as it focuses on the hydrological component of these
50 %. This decrease was attributed to a much slower increase       models. Table 2 describes the main hydrological characteris-
in CH4 emissions if surface soils dry, which is partially com-     tics for each model. Additional details on participating mod-
pensated for by a stronger increase in CO2 emissions under         els regarding soil thermal properties, snow, soil carbon and
drier soil conditions.                                             forcing trends can be found in previous PCN-MIP studies
   Earth system models project an intensification of the hy-       (e.g., McGuire et al., 2016; Koven et al., 2015; Wang et al.,
drological cycle characterized by a general increase in the        2016; Peng et al., 2016). It is important to note that the ver-
magnitude of water fluxes (e.g., precipitation, evapotranspi-      sions of the models presented in this study are from McGuire
ration and runoff) in northern latitudes (Rawlins et al., 2010;    et al. (2016, 2018) and some additional improvements to in-
Swenson et al., 2012). In addition, intensification of the hy-     dividual models may have been made since then.
drological cycle is likely to modify the spatial and tempo-           The simulation protocol is described in detail in McGuire
ral patterns of water in the landscape. However, the spatial       et al. (2016, 2018). In brief, models’ simulations were con-
variability, timing and reasons for future changes in hydrol-      ducted from 1960 to 2299, partitioned by historic (1960–
ogy in terrestrial landscapes in the Arctic are unclear, and       2009) and future simulations (2010–2299), where future
variability in projections of these features by current terres-    simulations were forced with a common projected climate
trial hydrology applied in the Arctic has not been well doc-       derived from a fully coupled climate model simulation
umented. Therefore, there is an urgent need to assess and          (CCSM4; Gent et al., 2011). Historic atmospheric forcing
better understand hydrology simulations in land models and         datasets (Table 1; e.g., climate, atmospheric CO2 , N depo-

The Cryosphere, 14, 445–459, 2020                                                       www.the-cryosphere.net/14/445/2020/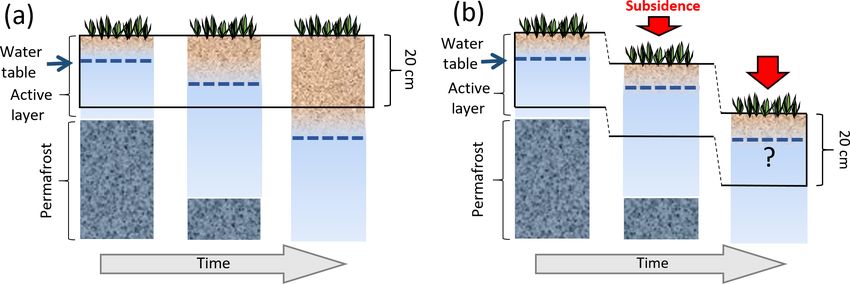
C. G. Andresen et al.: Soil moisture and hydrology projections of the permafrost region                                         447

sition and disturbance) and spin-up time were specific to
each modeling group. The horizontal resolution (0.5–1.25◦ )
and soil hydrological column configurations (depths rang-
ing from 2 to 47 m and 3 to 30 soil layers) also vary across
models (Fig. 1). We focus on results from simulations forced
with climate and CO2 from the Representative Concentration
Pathway (RCP) 8.5 scenario, which represents unmitigated,
business-as-usual emissions of greenhouse gases. Future
simulations were calculated from monthly CCSM4 (Gent et
al., 2011) climate anomalies for the Representative Concen-
tration Pathway (RCP 8.5, 2006–2100) and the Extension
Concentration Pathway (ECP 8.5, 2101–2299) scenarios, rel-
ative to repeating (1996–2005) forcing atmospheric datasets
from the different modeling groups (Table 1).
   The PCN model intercomparison uses the output from a
single Earth system model climate projection and was mo-
tivated by a desire to keep the experimental design simple
and computationally tractable. Clearly, using just one cli-
mate projection does not allow us to explore the impact of
the broad range of potential climate outcomes that are seen
across the CMIP5 (Coupled Model Intercomparison Project
Phase 5) models. Instead, the PCN suite of simulations al-
lows for a relatively controlled analysis of the spread of
model responses to a single representative climate trajectory.
The selection of CCSM4 as the climate projection model was
motivated partly by convenience and also because it was one       Figure 1. Soil hydrologically active column configuration for each
of the only models that had been run out to the year 2300         participating model. Numbers and arrows indicate full soil configu-
at the time of the PCN experiments. Further, as noted in          ration of nonhydrologically active bedrock layers. Colors represent
McGuire et al. (2018), CCSM4 late 20th-century climate bi-        the number of layers.
ases in the Arctic were among the lowest across the CMIP5
model archive. It should be noted that the use of a single cli-
mate projection means that the results presented here should      els with a soil configuration at 3 m or less (UWVIC, CoLM,
be viewed as indicative of just one possible permafrost hy-       JULES and TEM; see Table 1 for descriptions of the models
drologic trajectory. As we will show, even under this single      referenced in this paper) follow the same calculation with an
climate trajectory, the range of hydrologic responses in the      exemption for their bottom depth, where a soil depth temper-
models is broad, indicating high structural uncertainty across    ature threshold of < 273.5 K was applied to be considered
models with respect to this particular aspect of the Arctic       as permafrost; this was based on soil temperature trends ob-
system response to global climate change.                         served for models with soil depths greater than 3 m and al-
                                                                  lows models to have an ALT of 3 m when soil configuration
2.2   Permafrost and hydrology variables analyzed                 is limiting. We assessed how permafrost changes affect near-
                                                                  surface soil moisture, defined here as the soil water content
Our analysis focused on the permafrost regions in the North-      (kg m−2 ) of the 0–20 cm soil layer. We focused on the top
ern Hemisphere north of 45◦ N. This qualitative hydrology         20 cm of the soil column due to its relevance to near-surface
comparison was based on the full permafrost domain for each       biogeochemical processes. We added the weighted fractions
model rather than a common subset among models in order to        for each depth interval to calculate near-surface soil mois-
fully portray the overall changes in permafrost hydrology for     ture (0–20 cm) to account for the differences in the vertical
participating models. For each model, we define a grid cell       resolution of the soil grid cells among models (Fig. 1). To
as containing near-surface permafrost based on soil tempera-      better understand the causes and consequences of changes in
ture where the annual monthly maximum active-layer thick-         soil moisture, we examined several principal hydrology vari-
ness (ALT) is at or less than the 3 m depth layer depending       ables including evapotranspiration (ET), runoff (R; surface
on the model soil configuration (Fig. 1; McGuire et al., 2016;    and subsurface), and precipitation (P ; snow and rain). Rep-
Slater and Lawrence, 2013). We calculated the depth of max-       resentation of ET, R and soil hydrology varies across partic-
imum ALT by identifying the underlying annual permafrost          ipating models and is summarized in Table 2.
table depth of continuous monthly temperatures < 273.15 K            We compared model simulations with long-term (1970–
in the top 3 m or equivalent soil layer depth (Fig. 1). Mod-      1999) mean monthly discharge data from Dai et al. (2009).

www.the-cryosphere.net/14/445/2020/                                                        The Cryosphere, 14, 445–459, 2020
448 C. G. Andresen et al.: Soil moisture and hydrology projections of the permafrost region
Table 1. Model descriptions and driving datasets.
Model Full Climate forcing Model Short-wave Long-wave Vapor
name dataset reference radiationa radiationa pressurea
CLM 4.5 Community Land Model v4.5 CRUNCEP4b Oleson et al. (2013) Yes Yesc Yes
CoLM Common Land Model Princetond Dai et al. (2003), Yes Yes Yes
Ji et al. (2014)
JULES Joint UK Land Environment WATCH (1901–2001)e Best et al. (2011) Yes Yes Yes
Simulator model
ORCHIDEE-IPSL Organising Carbon and Hydrology WATCH (1901–1978)e Gouttevin et al. (2012), Yes Yes Yes
In Dynamic Ecosystems Koven et al. (2009),
Krinner et al. (2005)
LPJGUESS Lund-Potsdam-Jena General CRU TS 3.1f Gerten et al. (2004), Yes No No
Ecosystem Simulator Wania et al. (2009a, b)
SIBCASA Simple Biosphere/Carnegie- CRUNCEP4b Schaefer et al. (2011), Yes Yes Yes
Ames-Stanford Approach model Bonan (1996), Jafarov
and Schaefer (2016)
TEM604 Terrestrial Ecosystem Model CRUNCEP4b Hayes et al. Yes No No
(2014, 2011)
UWVIC University of Washington Variable CRUf , Udelh Bohn et al. (2013) Internally Internally Yes
Infiltration Capacity model calculated calculated
a Simulations driven by temporal variability. b Viovy and Ciais (http://dods.extra.cea.fr/, last access: 13 March 2016). c Long-wave dataset not from CRUNCEPT4.
d Sheffield et al. (2006) (http://hydrology.princeton.edu/data.pgf.php, last access: 13 March 2016).
e http://www.eu-watch.org/gfx_content/documents/README-WFDEI.pdf (last access: 13 March 2016). f Harris et al. (2014). g Mitchell and Jones (2005) for temperature.
h Willmott and Matsuura (2001) for wind speed and precipitation with corrections (see Bohn et al., 2013).
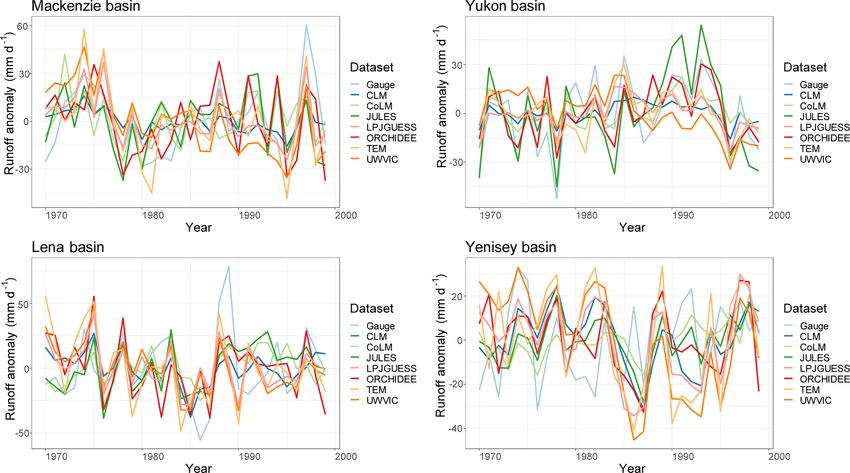
We computed model total annual discharge (sum of surface associated spatial patterns (Figs. 2c, 3). The models’ ensem-
and subsurface runoff) for the main river basins in the per- ble mean indicated a change of −10 % in near-surface soil
mafrost region of North America (Mackenzie, Yukon) and moisture for the permafrost region by the year 2299, but
Russia (Yenisey, Lena). In particular, we compared (i) annual the spread across models was large. CoLM and LPJGUESS
runoff anomalies, (ii) correlation coefficients, and (iii) distri- simulate an increase in soil moisture of 10 % and 48 %, re-
butions of annual discharge between gauge data and mod- spectively. CLM, JULES, TEM and UWVIC exhibit qual-
els’ simulations for the 30-year period of 1970–1999. Gauge itatively similar decreasing trends in soil moisture ranging
stations from major permafrost river basins used for simu- between −5 % and −20 %. SIBCASA and ORCHIDEE pro-
lation comparison include (i) Arctic Red, Canada (67.46◦ N, jected a large soil moisture change of approximately −50 %
133.74◦ W), for Mackenzie River; (ii) Pilot Station, Alaska by 2299. Spatially, models show diverse wetting and drying
(61.93◦ N 162.88◦ W), for Yukon River; (iii) Igarka, Russia patterns and magnitudes across the permafrost zone (Fig. 3).
(67.43◦ N, 86.48◦ E), for Yenisey River; and (iv) Kusur, Rus- Several models tend to get wetter in the colder northern per-
sia (70.68◦ N, 127.39◦ E), for Lena River. mafrost zones and are more susceptible to drying along the
southern permafrost margin. Other models, such as TEM and
UWVIC, show the opposite pattern with drying more com-
3 Results mon in the northern part of the permafrost domain.
3.1 Soil moisture 3.2 Drivers of soil moisture change
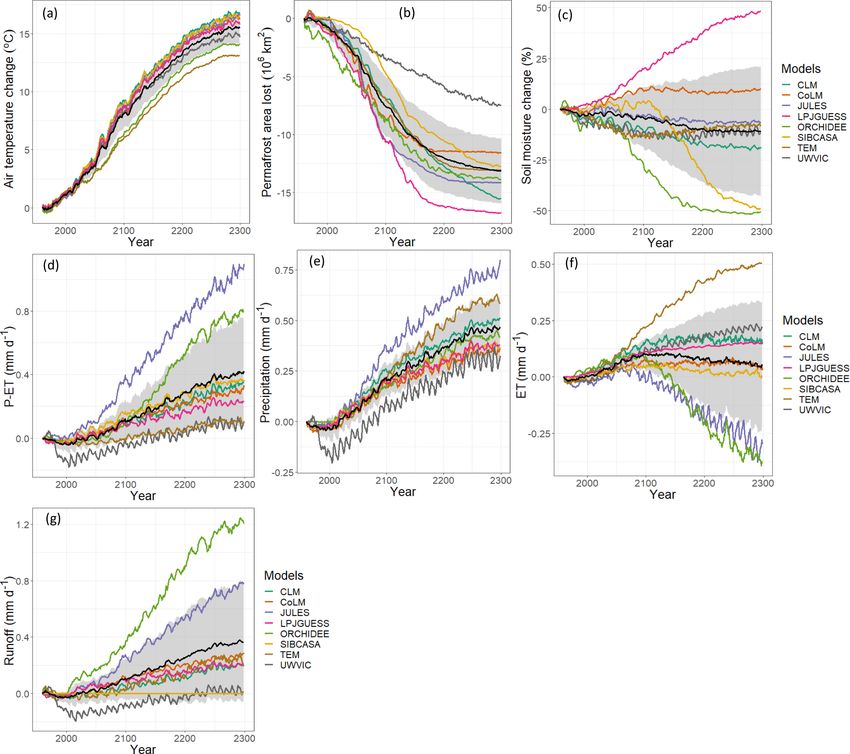
Air temperature forcing from greenhouse-gas emissions To understand why models projected upper soil drying de-
shows an increase of ∼ 15 ◦ C in the permafrost domain spite increases in the net precipitation (P -ET) into the soil,
over the simulation period (Fig. 2a). With increases in air we examined whether or not increases in active-layer thick-
temperature, models project an ensemble mean decrease of ness (ALT) and/or the complete thaw of near-surface per-
∼ 13 000 000 km2 (91 %) of the permafrost domain by 2299 mafrost could be related to surface soil drying of the top 0–
(Fig. 2b). Coincident with these changes, most models pro- 20 cm ALT. We observed a general significant negative cor-
jected a long-term drying of the near-surface soils when av- relation in most models (except SIBCASA and LPJGUESS)
eraged over the permafrost landscape (Fig. 2c). However, where cells with greater increases in active-layer thickness
the simulations diverged greatly with respect to both the have greater drying (decrease) in near-surface soil moisture
permafrost-domain average soil moisture response and their (Fig. 4). However, there is a large spread between soil mois-
The Cryosphere, 14, 445–459, 2020 www.the-cryosphere.net/14/445/2020/Table 2. Hydrology and soil thermal characteristics of participating models.
Hydrology Soil thermal properties
Model Evapotranspiration Root water uptake Infiltration Water table Soil water storage Groundwater Soil–ice impact Snow Soil thermal Unfrozen- Moss Organic
approach and transmission dynamics dynamics approach water insulation soil
effects insula-
on phase tion
change
CLM 4.5 Sum of canopy evapo- Macroscopic Saturation-excess Niu et al. (2007); Richards equation Base flow from Impacts hydrologic Multilayer Multilayer finite- Yes No Yes
ration, transpiration and approach runoff perched water table (Clapp–Hornberger TOPMODEL con- properties through dynamic (5 max) difference heat
soil evaporation Fsat = f (zwt ) possible if ice layer functions) cepts, unconfined power-law ice diffusion
present aquifer (Niu et al., impedance (Swen-
2007) son et al., 2012)
CoLM Biosphere–atmosphere Macroscopic Saturation-excess Simple Richards equation Base flow from Impacts hydrologic Multilayer Multilayer finite- No No No
transfer scheme and approach runoff TOPMODEL (Clapp–Hornberger TOPMODEL properties through dynamic (5 max) difference heat
Philip’s (1957) Fsat = f (zwt ) functions) power-law ice diffusion
www.the-cryosphere.net/14/445/2020/
impedance
JULES Sum of ET, soil evapo- Macroscopic Saturation-excess TOPMODEL Richards equation Base flow from Hydraulic conduc- Multilayer Multilayer finite- Yes No No
ration and moisture approach runoff or probability (Clapp–Hornberger TOPMODEL tivity and suction dynamic (3 max) difference heat
storages (e.g., lakes, ur- Fsat = f (zwt ) or distribution model and van Genuchten determined by diffusion
ban) minus surface re- Fsat = f (θ ) functions) unfrozen-water
sistance content (Brooks
and Corey
functions)
ORCHIDEE-IPSL Sum of bare soil, inter- Macroscopic ap- Saturation-excess TOPMODEL Richards equation None “Drying = freez- Multilayer 1-D Fourier Yes No Yes
ception loss and plant proach, water runoff Fsat = f (θ ) (van Genuchten ing” approximation dynamic (7 max) solution
transpiration for differ- uptake different functions) (Gouttevin et al.,
ent vegetation PFTs in among cell vegeta- 2012)
grid cell tion PFTs
(de Rosnay and
Polcher, 1998)
LPJGUESS Sum of interception Fractional water Depends on soil Uniform and only Analog to Darcy’s Base flow is based Impacts hydrologic Multilayer Multilayer finite- No No No
loss, plant transpiration uptake from moisture and layer for wetland grid law, percolation on the exponential properties through dynamic (3 max) difference heat
and evaporation from different soil layers thickness, declines cell (Wania et al., rate depends on function to estimate power-law ice diffusion
soil (Gerten et al., according to exponentially with 2009a, b) soil texture conduc- percolation rate impedance
2004) prescribed root soil moisture tivity and soil
distribution (Wania wetness (Haxeline
et al., 2009a, b) and Prentice, 1996)
SIBCASA Sum of ground evapo- Macroscopic Infiltration Niu et al. (2007); Richards equation Base flow from Impacts hydrologic Multilayer Multilayer finite- Yes No Yes
ration, surface dew, approach approach in non- perched water table (Clapp–Hornberger TOPMODEL con- properties through dynamic (5 max) difference heat
canopy ET and canopy saturated porous possible if ice layer functions) cepts, unconfined power-law ice diffusion
dew (Bonan, 1996) media described by present aquifer (Niu et al., impedance
C. G. Andresen et al.: Soil moisture and hydrology projections of the permafrost region
Darcy’s law 2007)
TEM-604 Jensen–Haise potential Based on the pro- Field capacity None One-layer bucket None None Multilayer Multilayer finite- No Yes No
ET (PET, Jensen and portion of actual ET excess runoff dynamic (9 max) difference heat
Haise, 1963); actual ET to potential ET (Thornthwaite and diffusion
is calculated based on Mather, 1957)
PET, water availability
and leaf mass
UWVIC Sum of canopy inter- Based on reference Saturation-excess Microtopography From infiltration Base flow from Impacts hydrologic Bulk-layer Multilayer finite- Yes No Yes
ception, vegetation ET and soil wilting runoff Fsat = f (θ ) rate and infiltration Arno model properties through dynamic (2 max) difference solution
transpiration and soil point shape parameter conceptualization power-law ice
evaporation (Liang et (Liang et al., (Francini and impedance
al., 1994) 1994), no lateral Pacciani, 1991)
flow between
model grids
The Cryosphere, 14, 445–459, 2020
449450 C. G. Andresen et al.: Soil moisture and hydrology projections of the permafrost region
Figure 2. Simulated annual mean changes in air temperature, near-surface permafrost area, near-surface soil moisture and hydrology variables
relative to 1960 (RCP 8.5). Annual mean is computed from monthly output values. The black line represents the models’ ensemble mean,
and the gray area is the ensemble standard deviation. Panels (d), (e), (f), and (g) are represented as change from 1960 values. Time series
are smoothed with a 7-year running mean for clarity and calculated over the initial permafrost domain of each model in 1960 for latitude
> 45◦ N.
ture and ALT changes (Fig. 4). This spread may be influ- (Fig. 5) demonstrates that specific representations and pa-
enced by many interacting factors that can be difficult to as- rameterizations for ET and runoff are not consistent across
sess directly and are out of the scope of this study. In addi- models. Though some models maintain a similar R/P ratio
tion, the coarse soil column discretization in UWVIC limited throughout the simulation (e.g., CLM, CoLM, LPJGUESS),
this analysis for this model (Fig. 1). However, most models others show shifts from an ET-dominated system to a runoff-
show some indication that as the active layer deepens, soils dominated system (e.g., JULES) and vice versa (e.g., TEM
tend to get drier at the surface. and UWVIC).
Evapotranspiration from the permafrost area is projected
3.3 Precipitation, ET and runoff to rise in all models driven by warmer air temperatures and
more productive vegetation, but the amplitude of that trend
Models may project surface soil drying, but the hydrologi- varies widely. The average projected evapotranspiration in-
cal pathways through which this drying occurs appear to dif- crease is 0.1 ± 0.1 mm d−1 (mean ±SD hereafter) by 2100,
fer across models. The diversity of precipitation partitioning
The Cryosphere, 14, 445–459, 2020 www.the-cryosphere.net/14/445/2020/C. G. Andresen et al.: Soil moisture and hydrology projections of the permafrost region 451 Figure 3. Spatial variability of projected changes in surface soil moisture (%) among models. Depicted changes are calculated as the differ- ence between the 2071 to 2100 average and the 1960 to 1989 average. Colored area represents the initial simulated permafrost domain of 1960 for each model. Figure 4. Responses of August near-surface (0–20 cm) soil moisture to ALT changes. Each box represents a range of ±0.25 m of ALT change. ALT and soil moisture change are calculated as the 2270–2299 average minus the 1960–1989 average for cells in the initial permafrost domain of 1960. For cells where ALT exceeded 3 m (no permafrost) during the 2270–2299 period, we subtracted the initial active-layer thickness (1960–1989 average) to 3 m. Population Pearson correlations (r) significant at ∗ p < 0.01 and ∗∗ p < 2 × 10⁻¹⁶ . which represents about a 25 % increase over 20th-century runoff changes of 0.2 to 0.3 mm d−1 by 2299. UWVIC ex- levels. Beyond 2100, the ET projections diverge (Fig. 2e). hibits small to null changes in runoff while SIBCASA shows Runoff is also projected to increase with projections across surface runoff only. models being highly variable (Fig. 2g). The change in the Comparison between gauge station data and runoff sim- models’ ensemble mean between 1960 and 2299 was 0.2 ± ulations from the major river basins in the permafrost re- 0.2 mm d−1 . CLM, CoLM, LPJGUESS and TEM simulated gion shows that most models agree on the long-term tim- www.the-cryosphere.net/14/445/2020/ The Cryosphere, 14, 445–459, 2020
452                                  C. G. Andresen et al.: Soil moisture and hydrology projections of the permafrost region

                                                                       Table 3. Correlation coefficients between simulated annual total
                                                                       runoff and gauge mean annual discharge 1970 to 1999. SIBCASA
                                                                       correlations are for surface runoff.

                                                                                                      River basin
                                                                           Model          Mackenzie   Yukon    Yenisey     Lena   Avg.
                                                                           CLM                 0.70    0.64         0.08   0.46   0.47
                                                                           ORCHIDEE            0.57    0.69         0.36   0.37   0.50
                                                                           LPJGUESS            0.68    0.71         0.14   0.35   0.47
                                                                           TEM                 0.66    0.56         0.16   0.40   0.45
                                                                           SIBCASA             0.49    0.21         0.08   0.29   0.27
                                                                           JULES               0.41    0.77         0.34   0.51   0.51
                                                                           CoLM                0.38    0.76         0.27   0.46   0.47
                                                                           UWVIC               0.44    0.38         0.02   0.31   0.29
                                                                           Avg.                0.54    0.59         0.18   0.40

                                                                       4     Discussion

                                                                       This study assessed near-surface soil moisture and hydrology
                                                                       projections in the permafrost region using widely used land
Figure 5. Precipitation partitioning between total runoff and evapo-
                                                                       models that represent permafrost. Most models showed near-
transpiration for participating models. Markers and arrows indicate
the change from initial period (1960–1989 average) to final period     surface drying despite the externally forced intensification of
(2270–2299 average). Diagonal dashed lines represent the ensemble      the water cycle driven by climate change. Drying was gen-
rainfall mean for the initial (0.74 mm d−1 ) and final (1.2 mm d−1 )   erally associated with increases of active-layer thickness and
simulation years. At any point along the dashed diagonals, runoff      permafrost degradation in a warming climate. We show that
and ET sum to precipitation.                                           the timing and magnitude of projected soil moisture changes
                                                                       vary widely across models, pointing to an uncertain future
                                                                       in permafrost hydrology and associated climatic feedbacks.
ing (Fig. 6, Table 3), but the magnitude is generally under-           In this section, we review the role of projected permafrost
estimated (Fig. 7). The gauge discharge mean for the four              loss and active-layer thickening on soil moisture changes and
river basins is 219 ± 36 mm yr−1 compared to the models’               some potential sources of variability among models. In addi-
ensemble mean of 101 ± 82 mm yr−1 for the period 1970–                 tion, we comment on the potential effects of soil moisture
1999. Excluding SIBCASA, the models’ ensemble mean is                  projections on the permafrost carbon–climate feedback. It is
134 ± 69 mm yr−1 . However, models show reasonable corre-              important to note that this study is more qualitative in na-
lations between runoff output and observed annual-discharge            ture and does not focus on the detail of magnitude or spatial
time series (Table 3). SIBCASA horizontal subsurface runoff            patterns of model signatures.
was disabled on the simulation because it tended to drain the
active layer completely, resulting in very low and unrealistic         4.1    Permafrost degradation and drying
soil moisture. Therefore, SIBCASA runoff values shown in
this study are only for surface runoff.                                Increases in net precipitation and the counterintuitive dry-
   The net water balance (P -ET-R) is projected to increase            ing of the top soil in the permafrost region suggest that soil
for most models with precipitation increases outpacing the             column processes such as changes in active-layer thickness
sum of ET and runoff changes. All models except TEM show               (ALT) and activation of subsurface drainage with permafrost
an increase in the net water balance over the simulation pe-           thaw are acting to dry the top soil layers (Fig. 8a). In general,
riod, which suggests that models are collecting soil water             models represent impermeable soils when frozen. Then, as
deeper in the soil column, presumably in response to increas-          soils thaw at progressive depths in the summer, liquid water
ing ALT, even while the top soil layers dry.                           infiltrates further into the active layer, draining deeper into
                                                                       the thawed soil column (Avis et al., 2011; Lawrence et al.,
                                                                       2015; Swenson et al., 2012). However, relevant soil column
                                                                       processes related to thermokarst by thawing of excess ground
                                                                       ice (Lee et al., 2014) are limited in these simulations despite
                                                                       their significant occurrence in the permafrost region (Ole-
                                                                       feldt et al., 2016). As permafrost thaws, ground ice melts, po-
                                                                       tentially reducing the volume of the soil column and chang-
                                                                       ing the hydrological properties of the soil (Aas et al., 2019;

The Cryosphere, 14, 445–459, 2020                                                             www.the-cryosphere.net/14/445/2020/
C. G. Andresen et al.: Soil moisture and hydrology projections of the permafrost region 453 Figure 6. Runoff anomaly comparison between gauge data and models simulations for the period 1970–1999. Nitzbon et al., 2019). This would occur where soil surface over recent decades (Andresen and Lougheed, 2015; Jones et elevation drops through sudden collapse or slow deformation al., 2011; Roach et al., 2011; Smith et al., 2005). These sys- by an amount equal to or greater than the increased depth tems are either lacking in simulations (polygon ponds and of annual thaw (Fig. 8b). This mechanism, not represented small lakes) or assumed to be static systems in simulations in current large-scale models, could result in projected in- (large lakes). The implementation of surface hydrology dy- creases or no change in the water table over time as observed namics and permafrost processes in large-scale land models by long-term studies (Andresen and Lougheed, 2015; Mau- will help reduce uncertainty in our ability to predict the future ritz et al., 2017; Natali et al., 2015). Subsidence of 12–13 cm hydrological state of the Arctic and the associated climatic has been observed in northern Alaska over a 5-year period, feedbacks. It is important to note that all these processes re- which represents a volume loss of about 25 % of the average quire data for model calibration, verification and evaluation ALT for that region (∼ 50 cm; Streletskiy et al., 2008). These that are commonly absent at large scales. Permafrost hydrol- lines of evidence may suggest that permafrost thaw may not ogy will only advance through synergistic efforts between dry the Arctic as fast as simulated by land models but rather field researchers and modelers. maintain or enhance soil water saturation depending on the water balance of the modeled cell column. 4.2 Uncertainty in soil moisture and hydrology Recent efforts have been made to address the high sub- simulations grid heterogeneity of fine-scale mechanisms including soil subsidence (Aas et al., 2019), hillslope hydrology, talik Differences in representations of soil thermal dynamics can and thermokarst development (Jafarov et al., 2018), ice directly affect hydrology through timing of the freezing– wedge degradation (Abolt et al., 2018; Liljedahl et al., 2016; thawing cycle and by altering the rates of permafrost loss Nitzbon et al., 2019), vertical and lateral heat transfer on per- and subsurface drainage (Finney et al., 2012). McGuire et mafrost thaw and groundwater flow (Kurylyk et al., 2016), al. (2016) and Peng et al. (2016) show that these models ex- and lateral water fluxes (Nitzbon et al., 2019). These pro- hibit considerable differences in permafrost quantities such cesses are known to have a major role on surface and subsur- as active-layer thickness and the mean and trends in near- face hydrology, and their implementation in large-scale mod- surface (0–3 m) permafrost extent even though all the mod- els is needed. Other important challenges in land models’ hy- els are forced with observed climatology. However, these drology include representation of the significant area dynam- differences are smaller than those seen across the CMIP5 ics of the ubiquitous smaller, shallow water bodies observed models (Koven et al., 2013). All models except ORCHIDEE www.the-cryosphere.net/14/445/2020/ The Cryosphere, 14, 445–459, 2020
454                                 C. G. Andresen et al.: Soil moisture and hydrology projections of the permafrost region

                                                                     explicitly represented in other models such as LPJGUESS,
                                                                     which has a uniform water table which is only applied for
                                                                     wetland areas. In addition to the water table, the storage and
                                                                     transmission of water in soils is a fundamental component of
                                                                     an accurate representation of soil moisture (Niu and Yang,
                                                                     2006). The representation of soil water storage and trans-
                                                                     mission varies across models from Richards equations based
                                                                     on Clapp–Hornberger (1978) and/or van Genuchten (1980)
                                                                     functions (e.g., CLM, CoLM, SIBCASA and ORCHIDEE)
                                                                     to a simplified one-layer bucket (e.g., TEM). It is also im-
                                                                     portant to note that most models differ in their numerical im-
                                                                     plementations of processes such as water movement through
                                                                     frozen soils (Gouttevin et al., 2012; Swenson et al., 2012) and
                                                                     in the use of iterative solutions and vertical discretization of
                                                                     water transmission (De Rosnay et al., 2000).
                                                                        Differences in representation of vertical fluxes through
                                                                     evapotranspiration (ET) are also likely adding to the high
                                                                     variability in soil moisture projections. ET sources (e.g., in-
                                                                     terception loss, plant transpiration and soil evaporation) were
                                                                     similar across models but had different formulations (Ta-
                                                                     ble 2). The diversity of ET implementations (e.g., evapora-
                                                                     tive resistances from fractional areas) and of vegetation maps
Figure 7. Discharge comparison between gauge station data and        used by the modeling groups (Ottlé et al., 2013) can also con-
model output for each river basin. Dashed line indicates mean        tribute to the big spread on the temporal simulations for ET
annual discharge at gauge station. Boxplots derived from mean        and soil moisture. Along with projected increases in ET, net
annual-discharge (total runoff) simulations for the period of 1970   precipitation (P -ET) is projected to increase for all models,
to 1999.                                                             suggesting that drying is not only attributed to soil evapora-
                                                                     tion, and the increasing net water balance (P -ET-R) proposes
                                                                     that models are storing water more deeply in the soil column
employ a multilayer finite-difference heat diffusion for soil        as permafrost near the surface thaws.
thermal dynamics (Table 2). Organic soil insulation, snow               Despite runoff improvements (Swenson et al., 2012), un-
insulation and unfrozen-water effects on phase change are            derestimation of river discharge has been a challenge in pre-
the most common structural differences among models for              vious versions in models (Slater et al., 2007). The differ-
soil thermal dynamics but do not explain the variability in          ences between models and observations in mean annual dis-
the simulated changes in ALT and permafrost area as shown            charge may stem from several sources, particularly the sub-
by McGuire et al. (2016). Half of the participating mod-             stantial variation in the precipitation forcing for these models
els include organic matter in the soil properties (CLM, OR-          (Fig. 2e). This is attributed, in part, to the sparse observa-
CHIDEE, SIBCASA and UWVIC), which can significantly                  tional networks in high latitudes. River discharge at high lat-
impact soil thermal properties and lead to an increase in the        itudes can differ substantially when different reanalysis forc-
hydraulic conductivity of the soil column, thereby enhanc-           ing datasets are used. For example, river discharge for Arc-
ing drainage and redistribution of water in the soil column.         tic rivers differs substantially in CLM4.5 simulations when
Soil vertical characterization is another important aspect for       forced with GSWP3v1 compared to CRUNCEPv7 reanalysis
soil thermal dynamics and hydrology (Chadburn et al., 2015;          datasets (not shown is runoff for Mackenzie, +32 %; Yukon,
Nicolsky et al., 2007). Lawrence et al. (2008) indicated that        +78 %; Lena, −2 %; and Yenisey, +22 %). Other factors in-
a high-resolution soil column representation is necessary for        clude potential deficiencies in the parameterization and/or
accurate simulation of long-term trends in active-layer depth.       implementation of ET and runoff processes as well as veg-
However, McGuire et al. (2016) showed that soil column               etation processes.
depth did not clearly explain variability of the simulated loss
of permafrost area across models.                                    4.3   Implications for the permafrost carbon–climate
   Water table representation can result in a first-order ef-              feedback
fect on soil moisture. Most models (CLM, CoLM, SIBCASA
and ORCHIDEE) use some version of TOPMODEL (Niu et                   If drying of the permafrost region occurs, carbon losses from
al., 2007), which employs a prognostic water table where             the soil will be dominated by CO2 as a result of increased
subgrid-scale topography is the main driver of soil mois-            heterotrophic respiration rates compared to moist conditions
ture variability in the cell. However, the water table is not        (Elberling et al., 2013; Oberbauer et al., 2007; Schädel et al.,

The Cryosphere, 14, 445–459, 2020                                                         www.the-cryosphere.net/14/445/2020/
C. G. Andresen et al.: Soil moisture and hydrology projections of the permafrost region 455
Figure 8. Schematic of changes in the soil column moisture (a) without subsidence (current models) and (b) with subsidence from thawing
ice-rich permafrost (not represented by models), a process that may accumulate soil moisture and slow down drying over time.
2016). With projected drying, CH4 flux emissions will slow Competing interests. The authors declare that they have no conflict
down by the reduction of soil saturation and inundated areas of interest.
through lowering the water table in grid cells (Fig. 8a). In a
sensitivity study using CLM, the slower increase of methane
emissions associated with surface drying could potentially Acknowledgements. This paper is dedicated to the memory of An-
lead to a reduction in the global warming potential of per- drew G. Slater (1971–2016) for his scientific contributions in ad-
mafrost carbon emissions by up to 50 % compared to sat- vancing Arctic hydrology modeling. This work was performed un-
der the Next-Generation Ecosystem Experiments (NGEE Arctic,
urated soils (Lawrence et al., 2015). However, we need to
DOE ERKP757) project supported by the Biological and Environ-
also consider that current land models lack representation of
mental Research program in the Office of Science, U.S. Depart-
important CH4 sources and pathways in the permafrost re- ment of Energy. The study was also supported by the National
gion such as lake and wetland dynamics that can counteract Science Foundation through the Research Coordination Network
the suppression of CH4 fluxes by projected drying. Seasonal (RCN) program and through the Study of Environmental Arctic
wetland area variation, which is not represented or is poorly Change (SEARCH) program in support of the Permafrost Carbon
represented in current models, can contribute to a third of the Network. We also acknowledge the joint DECC/Defra Met Office
annual CH4 flux in boreal wetlands (Ringeval et al., 2012). Hadley Centre Climate Programme (GA01101) and the European
Although this paper may raise more questions than answers, Union FP7-ENVIRONMENT project PAGE21.
this study highlights the importance of advancing hydrology
and hydrological heterogeneity in land models to help deter-
mine the spatial variability, timing and reasons for changes Financial support. This research has been supported by the Office
in the hydrology of terrestrial landscapes of the Arctic. These of Science, U.S. Department of Energy (grant no. ERKP757).
improvements may constrain projections of land–atmosphere
carbon exchange and reduce uncertainty on the timing and
Review statement. This paper was edited by Ylva Sjöberg and re-
intensity of the permafrost carbon feedback.
viewed by two anonymous referees.
Data availability. The simulation data analyzed in this paper are
available through the National Snow and Ice Data Center (NSIDC;
http://nsidc.org, last access: 24 January 2020). For inquiries please References
contact Kevin Schaefer (kevin.schaefer@nsidc.org).
Aas, K. S., Martin, L., Nitzbon, J., Langer, M., Boike, J., Lee,
H., Berntsen, T. K., and Westermann, S.: Thaw processes in
Author contributions. This paper is a collective effort of the mod- ice-rich permafrost landscapes represented with laterally cou-
eling groups of the Permafrost Carbon Network (http://www. pled tiles in a land surface model, The Cryosphere, 13, 591–609,
permafrostcarbon.org, last access: 24 January 2020). CGA, DML, https://doi.org/10.5194/tc-13-591-2019, 2019.
CJW and ADM wrote the initial draft with additional contributions Abolt, C. J., Young, M. H., Atchley, A. L., and Harp, D.
from all authors. Figures were prepared by CGA. R.: Microtopographic control on the ground thermal regime
in ice wedge polygons, The Cryosphere, 12, 1957–1968,
https://doi.org/10.5194/tc-12-1957-2018, 2018.
Andresen, C. G. and Lougheed, V. L.: Disappearing arctic tundra
ponds: Fine-scale analysis of surface hydrology in drained thaw
www.the-cryosphere.net/14/445/2020/ The Cryosphere, 14, 445–459, 2020456 C. G. Andresen et al.: Soil moisture and hydrology projections of the permafrost region lake basins over a 65 year period (1948–2013), J. Geophys. Res., Frey, K. E. and Mcclelland, J. W.: Impacts of permafrost degrada- 120, 1–14, https://doi.org/10.1002/2014JG002778, 2015. tion on arctic river biogeochemistry, Hydrol. Process., 23, 169– Andresen, C. G., Lara, M. J., Tweedie, C. T., and Lougheed, 182, https://doi.org/10.1002/hyp, 2009. V. L.: Rising plant-mediated methane emissions from Gent, P. R., Danabasoglu, G., Donner, L. J., Holland, M. M., Hunke, arctic wetlands, Glob. Change Biol., 23, 1128–1139, E. C., Jayne, S. R., Lawrence, D. M., Neale, R. B., Rasch, P. https://doi.org/10.1111/gcb.13469, 2017. J., Vertenstein, M., Worley, P. H., Yang, Z. L., and Zhang, M.: Avis, C. A., Weaver, A. J., and Meissner, K. J.: Reduction in areal The community climate system model version 4, J. Climate, 24, extent of high-latitude wetlands in response to permafrost thaw, 4973–4991, https://doi.org/10.1175/2011JCLI4083.1, 2011. Nat. Geosci., 4, 444–448, https://doi.org/10.1038/ngeo1160, Gerten, D., Schaphoff, S., Haberlandt, U., Lucht, W., and Sitch, S.: 2011. Terrestrial vegetation and water balance – hydrological evalua- Best, M. J., Pryor, M., Clark, D. B., Rooney, G. G., Essery, R. L. tion of a dynamic global vegetation model, J. Hydrol., 286, 249– H., Ménard, C. B., Edwards, J. M., Hendry, M. A., Porson, A., 270, https://doi.org/10.1016/j.jhydrol.2003.09.029, 2004. Gedney, N., Mercado, L. M., Sitch, S., Blyth, E., Boucher, O., Gouttevin, I., Krinner, G., Ciais, P., Polcher, J., and Legout, C.: Cox, P. M., Grimmond, C. S. B., and Harding, R. J.: The Joint Multi-scale validation of a new soil freezing scheme for a land- UK Land Environment Simulator (JULES), model description – surface model with physically-based hydrology, The Cryosphere, Part 1: Energy and water fluxes, Geosci. Model Dev., 4, 677–699, 6, 407–430, https://doi.org/10.5194/tc-6-407-2012, 2012. https://doi.org/10.5194/gmd-4-677-2011, 2011. Grosse, G., Jones, B., and Arp, C.: Thermokarst lakes, drainage, Bohn, T. J., Podest, E., Schroeder, R., Pinto, N., McDonald, K. and drained basins, in: Treatise on Geomorphology, 8, 325–353., C., Glagolev, M., Filippov, I., Maksyutov, S., Heimann, M., 2013. Chen, X., and Lettenmaier, D. P.: Modeling the large-scale ef- Harris, I., Jones, P. D., Osborn, T. J., and Lister, D. H.: Up- fects of surface moisture heterogeneity on wetland carbon fluxes dated high-resolution grids of monthly climatic observations in the West Siberian Lowland, Biogeosciences, 10, 6559–6576, – the CRU TS3.10 Dataset, Int. J. Climatol., 34, 623–642, https://doi.org/10.5194/bg-10-6559-2013, 2013. https://doi.org/10.1002/joc.3711, 2014. Bonan, G. B.: A Land Surface Model (LSM v1.0) for Ecological, Hayes, D. J., Mcguire, A. D., Kicklighter, D. W., Gurney, K. R., Hydrological and Atmospheric studies: Technical descripton and Burnside, T. J., and Melillo, J. M.: Is the northern high-latitude user’s guide, 1996. land-based CO2 sink weakening?, Global Biogeochem. Cy., 25, Chadburn, S. E., Burke, E. J., Essery, R. L. H., Boike, J., Langer, 1–14, https://doi.org/10.1029/2010GB003813, 2011. M., Heikenfeld, M., Cox, P. M., and Friedlingstein, P.: Impact Hayes, D. J., Kicklighter, D. W., McGuire, A. D., Chen, M., of model developments on present and future simulations of Zhuang, Q., Yuan, F., Melillo, J. M., and Wullschleger, S. D.: permafrost in a global land-surface model, The Cryosphere, 9, The impacts of recent permafrost thaw on land–atmosphere 1505–1521, https://doi.org/10.5194/tc-9-1505-2015, 2015. greenhouse gas exchange, Environ. Res. Lett., 9, 045005, Dai, Y., Zeng, X., Dickinson, R. E., Baker, I., Bonan, G. B., https://doi.org/10.1088/1748-9326/9/4/045005, 2014. Bosilovich, M. G., Denning, A. S., Dirmeyer P, Houser, P. R., Haxeltine, A. and Prentice, I. C.: A General Model for the Light- Niu, G., Oleson, K. W., Schlosser, C. A., and Yang, Z.: The Com- Use Efficiency of Primary Production, Funct. Ecol., 10, 551–561, mon Land Model (CoLM), B. Am. Meteorol. Soc., 84, 1013– 1996. 1023, https://doi.org/10.1175/BAMS-84-8-1013, 2003. Jafarov, E. and Schaefer, K.: The importance of a surface or- Dai, A., Qian, T., Trenberth, K. E., and Milliman, J. D.: Changes in ganic layer in simulating permafrost thermal and carbon dynam- continental freshwater discharge from 1948 to 2004, J. Climate, ics, The Cryosphere, 10, 465–475, https://doi.org/10.5194/tc-10- 22, 2773–2792, https://doi.org/10.1175/2008JCLI2592.1, 2009. 465-2016, 2016. de Rosnay, P. and Polcher, J.: Modelling root water uptake in a com- Jafarov, E. E., Coon, E. T., Harp, D. R., Wilson, C. J., plex land surface scheme coupled to a GCM, Hydrol. Earth Syst. Painter, S. L., Atchley, A. L., and Romanovsky, V. E.: Mod- Sci., 2, 239–255, https://doi.org/10.5194/hess-2-239-1998, 1998. eling the role of preferential snow accumulation in through De Rosnay, P., Bruen, M., and Polcher, J.: Sensitivity of sur- talik development and hillslope groundwater flow in a transi- face fluxes to the number of layers in the soil model tional permafrost landscape, Environ. Res. Lett., 13, 105006, used in GCMs, Geophys. Res. Lett., 27, 3329–3332, https://doi.org/10.1088/1748-9326/aadd30, 2018. https://doi.org/10.1029/2000GL011574, 2000. Jensen, M. E. and Haise, H. R.: Estimating evapotranspiration from Elberling, B., Michelsen, A., Schädel, C., Schuur, E. A. solar radiation, J. Irrig. Drain. Div. ASCE, 89, 15–41, 1963. G., Christiansen, H. H., Berg, L., Tamstorf, M. P., Ji, D., Wang, L., Feng, J., Wu, Q., Cheng, H., Zhang, Q., Yang, and Sigsgaard, C.: Long-term CO2 production follow- J., Dong, W., Dai, Y., Gong, D., Zhang, R.-H., Wang, X., Liu, ing permafrost thaw, Nat. Clim. Change, 3, 890–894, J., Moore, J. C., Chen, D., and Zhou, M.: Description and ba- https://doi.org/10.1038/nclimate1955, 2013. sic evaluation of Beijing Normal University Earth System Model Finney, D. L., Blyth, E., and Ellis, R.: Improved modelling of (BNU-ESM) version 1, Geosci. Model Dev., 7, 2039–2064, Siberian river flow through the use of an alternative frozen soil https://doi.org/10.5194/gmd-7-2039-2014, 2014. hydrology scheme in a land surface model, The Cryosphere, 6, Jones, B. M., Grosse, G., Arp, C. D., Jones, M. C., Walter An- 859–870, https://doi.org/10.5194/tc-6-859-2012, 2012. thony, K. M., and Romanovsky, V. E.: Modern thermokarst Franchini, M. and Pacciani, M.: Comparative Analysis of Several lake dynamics in the continuous permafrost zone, northern Conceptual Rainfall-Runoff Models, J. Hydrol., 122, 161–219, Seward Peninsula, Alaska, J. Geophys. Res., 116, G00M03, https://doi.org/10.1016/0022-1694(91)90178-K, 1991. https://doi.org/10.1029/2011JG001666, 2011. The Cryosphere, 14, 445–459, 2020 www.the-cryosphere.net/14/445/2020/
C. G. Andresen et al.: Soil moisture and hydrology projections of the permafrost region                                                 457

Kanevskiy, M., Shur, Y., Jorgenson, T., Brown, D. R. N.,                  mafrost and influence on tundra hydrology, Nat. Geosci., 9, 312–
   Moskalenko, N., Brown, J., Walker, D. A., Raynolds,                    319, https://doi.org/10.1038/ngeo2674, 2016.
   M. K., and Buchhorn, M.: Degradation and stabiliza-                  Mauritz, M., Bracho, R., Celis, G., Hutchings, J., Natali, S. M., Pe-
   tion of ice wedges: Implications for assessing risk of                 goraro, E., Salmon, V. G., Schädel, C., Webb, E. E., and Schuur,
   thermokarst in northern Alaska, Geomorphology, 297, 20–42,             E. A. G.: Nonlinear CO2 flux response to 7 years of experimen-
   https://doi.org/10.1016/j.geomorph.2017.09.001, 2017.                  tally induced permafrost thaw, Glob. Change Biol., 23, 3646–
Koven, C., Friedlingstein, P., Ciais, P., Khvorostyanov, D., Krinner,     3666, https://doi.org/10.1111/gcb.13661, 2017.
   G., and Tarnocai, C.: On the formation of high-latitude soil car-    McGuire, A. D., Lawrence, D. M., Koven, C., Clein, J. S., Burke,
   bon stocks: Effects of cryoturbation and insulation by organic         E., Chen, G., Jafarov, E., MacDougall, A. H., Marchenko,
   matter in a land surface model, Geophys. Res. Lett., 36, 1–5,          S., Nicolsky, D., Peng, S., Rinke, A., Ciais, P., Gouttevin, I.,
   https://doi.org/10.1029/2009GL040150, 2009.                            Hayes, D. J., Ji, D., Krinner, G., Moore, J. C., Romanovsky,
Koven, C. D., Riley, W. J., and Stern, A.: Analysis of per-               V., Schädel, C., Schaefer, K., Schuur, E. A. G., and Zhuang,
   mafrost thermal dynamics and response to climate change in             Q.: The Dependence of the Evolution of Carbon Dynam-
   the CMIP5 earth system models, J. Climate, 26, 1877–1900,              ics in the Northern Permafrost Region on the Trajectory of
   https://doi.org/10.1175/JCLI-D-12-00228.1, 2013.                       Climate Change, P. Natl. Acad. Sci. USA, 115, 3882–3887,
Koven, C. D., Lawrence, D. M., and Riley, W. J.: Permafrost carbon-       https://doi.org/10.1073/pnas.1719903115, 2018.
   climate feedback is sensitive to deep soil carbon decomposability    McGuire, D. A., Koven, C. D., Lawrence, D. M., Burke,
   but not deep soil nitrogen dynamics, P. Natl. Acad. Sci. USA,          E., Chen, G., Chen, X., Delire, C., and Jafarov, E.: Vari-
   112, 3752–3757, https://doi.org/10.1073/pnas.1415123112,               ability in the sensitivity among model simulations of per-
   2015.                                                                  mafrost and carbon dynamics in the permafrost region be-
Krinner, G., Viovy, N., de Noblet-Ducoudré, N., Ogée, J., Polcher,        tween 1960 and 2009, Global Biogeochem. Cy., 30, 1015–1037,
   J., Friedlingstein, P., Ciais, P., Sitch, S., and Prentice, I. C.:     https://doi.org/10.1002/2016GB005405, 2016.
   A dynamic global vegetation model for studies of the coupled         Mitchell, T. D. and Jones, P. D.: An improved method of con-
   atmosphere-biosphere system, Global Biogeochem. Cy., 19, 1–            structing a database of monthly climate observations and as-
   33, https://doi.org/10.1029/2003GB002199, 2005.                        sociated high-resolution grids, Int. J. Climatol., 25, 693–712,
Kurylyk, B. L., Hayashi, M., Quinton, W. L., McKenzie, J.                 https://doi.org/10.1002/joc.1181, 2005.
   M., and Voss, C. I.: Influence of vertical and lateral heat          Natali, S. M., Schuur, E. A. G., Mauritz, M., Schade, J. D.,
   transfer on permafrost thaw, peatland landscape transition,            Celis, G., Crummer, K. G., Johnston, C., Krapek, J., Pe-
   and groundwater flow, Water Resour. Res., 52, 1286–1305,               goraro, E., Salmon, V. G., and Webb, E. E.: Permafrost
   https://doi.org/10.1002/2015WR018057, 2016.                            thaw and soil moisture driving CO2 and CH4 release from
Lara, M. J., McGuire, A. D., Euskirchen, E. S., Tweedie, C. E.,           upland tundra, J. Geophys. Res.-Biogeo., 120, 525–537,
   Hinkel, K. M., Skurikhin, A. N., Romanovsky, V. E., Grosse, G.,        https://doi.org/10.1002/2014JG002872.Received, 2015.
   Bolton, W. R., and Genet, H.: Polygonal tundra geomorphologi-        Newman, B. D., Throckmorton, H. M., Graham, D. E., Gu, B.,
   cal change in response to warming alters future CO2 and CH4            Hubbard, S. S., Liang, L., Wu, Y., Heikoop, J. M., Herndon, E.
   flux on the Barrow Peninsula, Glob. Change Biol., 21, 1663–            M., Phelps, T. J., Wilson, C. J., and Wullschleger, S. D.: Mi-
   1651, https://doi.org/10.1111/gcb.12757, 2015.                         crotopographic and depth controls on active layer chemistry in
Lawrence, D. M., Slater, A. G., Romanovsky, V. E., and Nicol-             Arctic polygonal ground, Geophys. Res. Lett., 42, 1808–1817,
   sky, D. J.: Sensitivity of a model projection of near-surface          https://doi.org/10.1002/2014GL062804, 2015.
   permafrost degradation to soil column depth and representa-          Nicolsky, D. J., Romanovsky, V. E., Alexeev, V. A., and Lawrence,
   tion of soil organic matter, J. Geophys. Res., 113, F02011,            D. M.: Improved modeling of permafrost dynamics in a
   https://doi.org/10.1029/2007JF000883, 2008.                            GCM land-surface scheme, Geophys. Res. Lett., 34, L08501,
Lawrence, D. M., Koven, C. D., Swenson, S. C., Riley,                     https://doi.org/10.1029/2007GL029525, 2007.
   W. J., and Slater, A. G.: Permafrost thaw and result-                Nitzbon, J., Langer, M., Westermann, S., Martin, L., Aas, K. S.,
   ing soil moisture changes regulate projected high-latitude             and Boike, J.: Pathways of ice-wedge degradation in polygonal
   CO2 and CH4 emissions, Environ. Res. Lett., 10, 094011,                tundra under different hydrological conditions, The Cryosphere,
   https://doi.org/10.1088/1748-9326/10/9/094011, 2015.                   13, 1089–1123, https://doi.org/10.5194/tc-13-1089-2019, 2019.
Lee, H., Swenson, S. C., Slater, A. G., and Lawrence, D.                Niu, G. and Yang, Z.: Effects of Frozen Soil on Snowmelt Runoff
   M.: Effects of excess ground ice on projections of per-                and Soil Water Storage at a Continental Scale, J. Hydrometeorol.,
   mafrost in a warming climate, Environ. Res. Lett., 9, 124006,          7, 937–952, https://doi.org/10.1175/JHM538.1, 2006.
   https://doi.org/10.1088/1748-9326/9/12/124006, 2014.                 Niu, G.-Y., Yang, Z.-L., Dickinson, R. E., Gulden, L. E., and
Liang, X., Lettenmaier, D. P., Wood, E. F., and Burges, S.: A sim-        Su, H.: Development of a simple groundwater model for use
   ple hydrologically based model of land surface water and en-           in climate models and evaluation with Gravity Recovery and
   ergy fluxes for general circulation models, J. Geophys. Res., 99,      Climate Experiment data, J. Geophys. Res., 112, D07103,
   14415–14418, 1994.                                                     https://doi.org/10.1029/2006JD007522, 2007.
Liljedahl, A., Boike, J., Daanen, R. P., Fedorov, A. N., Frost, G.      Oberbauer, S., Tweedie, C., Welker, J. M., Fahnestock, J. T., Henry,
   V., Grosse, G., Hinzman, L. D., Iijma, Y., Jorgenson, J. C.,           G. H. R., Webber, P. J., Hollister, R. D., Walker, D. A., Kuchy,
   Matveyeva, N., Necsoiu, M., Raynolds, M. K., Romanovsky, V.,           A., Elmore, E., and Starr, G.: Tundra CO2 fluxes in response
   Schulla, J., Tape, K. D., Walker, D. A., Wilson, C., Yabuki, H.,       to experimental warming across latitudinal and moisture gra-
   and Zona, D.: Pan-Arctic ice-wedge degradation in warming per-

www.the-cryosphere.net/14/445/2020/                                                               The Cryosphere, 14, 445–459, 2020
You can also read


