Methane retrieved from TROPOMI: improvement of the data product and validation of the first 2 years of measurements
←
→
Page content transcription
If your browser does not render page correctly, please read the page content below
Atmos. Meas. Tech., 14, 665–684, 2021
https://doi.org/10.5194/amt-14-665-2021
© Author(s) 2021. This work is distributed under
the Creative Commons Attribution 4.0 License.

Methane retrieved from TROPOMI: improvement of the data
product and validation of the first 2 years of measurements
Alba Lorente1 , Tobias Borsdorff1 , Andre Butz2,3 , Otto Hasekamp1 , Joost aan de Brugh1 , Andreas Schneider1 ,
Lianghai Wu1 , Frank Hase4 , Rigel Kivi5 , Debra Wunch6 , David F. Pollard7 , Kei Shiomi8 , Nicholas M. Deutscher9 ,
Voltaire A. Velazco9 , Coleen M. Roehl10 , Paul O. Wennberg10 , Thorsten Warneke11 , and Jochen Landgraf1
1 Earth  science group, SRON Netherlands Institute for Space Research, Utrecht, the Netherlands
2 Institute of Environmental Physics, University of Heidelberg, Heidelberg, Germany
3 Heidelberg Center for the Environment, University of Heidelberg, Heidelberg, Germany
4 Institute of Meteorology and Climate Research (IMK-ASF), Karlsruhe Institute of Technology, Karlsruhe, Germany
5 Greenhouse Gases and Satellite Methods group, Finnish Meteorological Institute, Sodankylä, Finland
6 Department of Physics, University of Toronto, Toronto, Canada
7 National Institute of Water and Atmospheric Research Ltd (NIWA), Lauder, New Zealand
8 Japan Aerospace Exploration Agency (JAXA), Tsukuba, Japan
9 Centre for Atmospheric Chemistry, School of Earth, Atmospheric and Life Sciences,

University of Wollongong, Wollongong, NSW 2522, Australia
10 Division of Geological and Planetary Sciences, California Institute of Technology, Pasadena, California, USA
11 Institute of Environmental Physics, University of Bremen, Bremen, Germany

Correspondence: Alba Lorente (a.lorente.delgado@sron.nl)

Received: 13 July 2020 – Discussion started: 5 August 2020
Revised: 9 November 2020 – Accepted: 24 November 2020 – Published: 28 January 2021

Abstract. The TROPOspheric Monitoring Instrument                    independent of any reference data that is more accurate
(TROPOMI) on board the Sentinel 5 Precursor (S5-P)                  and corrects for the underestimation at low surface albedo
satellite provides methane (CH4 ) measurements with high            scenes and the overestimation at high surface albedo scenes.
accuracy and exceptional temporal and spatial resolution            After applying the correction, the albedo dependence is
and sampling. TROPOMI CH4 measurements are highly                   removed to a large extent in the TROPOMI versus satellite
valuable to constrain emissions inventories and for trend           (Greenhouse gases Observing SATellite – GOSAT) and
analysis, with strict requirements on the data quality. This        TROPOMI versus ground-based observations (Total Carbon
study describes the improvements that we have implemented           Column Observing Network – TCCON) comparison, which
to retrieve CH4 from TROPOMI using the RemoTeC                      is an independent verification of the correction scheme. We
full-physics algorithm. The updated retrieval algorithm             validate 2 years of TROPOMI CH4 data that show the good
features a constant regularization scheme of the inversion          agreement of the updated TROPOMI CH4 with TCCON
that stabilizes the retrieval and yields less scatter in the data   (−3.4 ± 5.6 ppb) and GOSAT (−10.3 ± 16.8 ppb) (mean
and includes a higher resolution surface altitude database.         bias and standard deviation). Low- and high-albedo scenes
We have tested the impact of three state-of-the-art molecular       as well as snow-covered scenes are the most challenging for
spectroscopic databases (HITRAN 2008, HITRAN 2016 and               the CH4 retrieval algorithm, and although the a posteriori
Scientific Exploitation of Operational Missions – Improved          correction accounts for most of the bias, there is a need to
Atmospheric Spectroscopy Databases SEOM-IAS) and                    further investigate the underlying cause.
found that SEOM-IAS provides the best fitting results. The
most relevant update in the TROPOMI XCH4 data product
is the implementation of an a posteriori correction fully

Published by Copernicus Publications on behalf of the European Geosciences Union.
666                                                                          A. Lorente et al.: CH4 retrieved from TROPOMI

1   Introduction                                                   ing Network (TCCON; Hasekamp et al., 2019). However,
                                                                   the CH4 data product can now be further improved using
Methane (CH4 ) is the second most important anthropogenic          real measurements after TROPOMI has been measuring for
greenhouse gas after carbon dioxide (CO2 ). The global             more than 2 years. A detailed analysis of the data provides
warming potential of CH4 for a 20-year horizon is more than        insight into which aspects of the processing chain regarding
80 times higher than that of CO2 (Myhre et al., 2013) and,         the input data or retrieval algorithm can be further improved.
together with its relatively short lifetime of about 10 years,     The long-term record also allows us to explore possibilities
makes it an ideal short-term target for climate change miti-       of correcting biases independent of any reference data (e.g.
gation strategies via reducing CH4 emissions. CH4 has both         ground-based or other satellite measurements).
natural (e.g. wetlands) and anthropogenic sources (e.g. agri-         In this study we present the improvements that we have de-
culture and waste together with fossil fuels), and globally        veloped to retrieve CH4 from TROPOMI measurements us-
60 % of the total emissions are attributed to anthropogenic        ing the full-physics approach, and we validate the TROPOMI
sources (Saunois et al., 2020). Natural sources are the most       CH4 product with satellite and ground-based measurements.
uncertain components of the CH4 budget because of their            Section 2 describes the data and analysis methods that we
magnitude and variability, which at the same time depend           use, and Sect. 3 focuses on the main improvements related
on characteristics that are vulnerable to changes in the state     to the regularization scheme of the inversion, the choice of
of the Earth’s climate. Furthermore, the interpretation of ob-     the spectroscopic database for the absorption cross-sections,
served CH4 trends is hampered by the uncertainties in the          the surface elevation database and an a posteriori bias cor-
estimates of CH4 emissions (Turner et al., 2019).                  rection derived using only TROPOMI data. Finally, Sects. 4
   Satellite observations of CH4 are highly valuable to con-       and 5 show a detailed validation of the improved TROPOMI
strain emission inventories and for trend analysis, not only at    CH4 data. The study concludes in Sect. 6, with an outlook for
global scale but also at regional and local scales. CH4 mea-       future steps regarding CH4 data retrieved from TROPOMI.
surements from satellite instruments like GOSAT (Green-
house gases Observing SATellite) have been used to infer
CH4 emissions from natural sources (e.g. tropical wetlands         2     Retrieval algorithm and validation datasets
Lunt et al., 2019) and anthropogenic sources (e.g. coal min-
                                                                   2.1    TROPOMI CH4 retrieval algorithm
ing in China Miller et al., 2019) and also to map emissions
and trends at global scale (e.g. Maasakkers et al., 2019).         The methane total column-averaged dry-air mole fraction
However, the spatial and temporal resolution at which these        (XCH4 ) is retrieved from TROPOMI measurements of sun-
emissions can be resolved are limited by the capabilities of       light backscattered by Earth’s surface and atmosphere in the
the instrument, preventing daily estimations or source attri-      near-infrared (NIR) and shortwave-infrared (SWIR) spectral
bution at fine scales.                                             bands with the retrieval algorithm RemoTeC. This algorithm
   A unique perspective for the long-term monitoring of CH4        has been extensively used to retrieve both CO2 and CH4 from
is provided by the TROPOMI (TROPOspheric Monitoring                measurements of OCO-2 and GOSAT (e.g. Wu et al., 2018;
Instrument) instrument on board the Sentinel 5 Precursor           Butz et al., 2011), and it is the Sentinel 5-P and Sentinel 5
(S5-P) satellite, with its daily global coverage at an unprece-    operational algorithm for CH4 (Hasekamp et al., 2019; Land-
dented resolution of 7 × 7 km2 since its launch in October         graf et al., 2019).
2017 (upgraded to 5.5 × 7 km2 in August 2019). The high               The S5P RemoTeC algorithm uses the full-physics ap-
resolution together with the high signal-to-noise ratio allows     proach that simultaneously retrieves the amount of atmo-
for the detection and quantification of CH4 emissions from         spheric CH4 and the physical scattering properties of the at-
localized (e.g. Pandey et al., 2019) to larger scale sources       mosphere. The algorithm aims at inferring the state vector
(e.g. Permian basin by Schneising et al., 2020; Zhang et al.,      x that contains all the parameters to be retrieved from the
2020). Furthermore, assimilating TROPOMI CH4 has shown             radiance measurements y in the SWIR (2305–2385 nm) and
great potential (e.g. in the Copernicus Atmosphere Monitor-        NIR (757–774 nm) spectral bands, where the forward model
ing Service (CAMS) ECMWF Integrated Forecasting Sys-               F simulates the TROPOMI measurements,
tem (CAMS-IFS) data assimilation system; Barré et al.,
2020). The main challenge of CH4 remote sensing is that            y = F (x) + y + F .                                      (1)
high data quality is required for data assimilation and flux in-
version applications. For TROPOMI, strict mission require-            Here, y and F are the measurement noise error and the
ments are formulated, with a single sounding precision and         forward model error respectively. The forward model em-
accuracy both below 1 % (Veefkind et al., 2012).                   ploys the LINTRAN V2.0 radiative transfer model in its
   TROPOMI CH4 operational data were already proved to             scalar approximation to simulate atmospheric light scatter-
be of good quality by comparisons shortly after launch with        ing and absorption in a plane parallel atmosphere (Schepers
both GOSAT observations (Hu et al., 2018) and ground-              et al., 2014; Landgraf et al., 2001). Accurate modelling of
based measurements from the Total Carbon Column Observ-            absorption by molecules relies on spectroscopic databases,

Atmos. Meas. Tech., 14, 665–684, 2021                                                 https://doi.org/10.5194/amt-14-665-2021
A. Lorente et al.: CH4 retrieved from TROPOMI                                                                                  667

which provide the absorption cross-section of the target ab-       TROPOMI approximately 5 min earlier. In fewer than 1 % of
sorber CH4 as well as of the interfering gases CO, H2 O and        the cases when VIIRS data are not available, we use a back-
O2 .                                                               up filter based on a non-scattering H2 O and CH4 retrieval
   The inversion to estimate the state vector x requires the       from the weak and strong absorption bands (Hu et al., 2016).
use of regularization methods, as measurements typically           These cases are flagged accordingly by the quality value in-
do not contain sufficient information to retrieve every state      dicator. Table A1 summarizes the filters applied in the re-
vector element independently. The RemoTeC retrieval al-            trieval process and in the TROPOMI data selection used in
gorithm uses the Philips–Tikhonov regularization scheme,           this study.
which aims to find the state vector by solving the minimiza-          The CH4 total column-averaged dry-air mole fraction re-
tion problem                                                       trieved from TROPOMI with the operational retrieval algo-
                                                                 rithm (version 1.2.0) largely complies with the mission re-
            −1/2
x̂ = min ||Sy (F (x) − y)||2 + γ ||W(x − x a )||2 ,       (2)      quirement of precision and accuracy below 1 %, with signif-
                                                                   icantly improved data quality of the bias-corrected product
where || · || describes the Euclidian norm, Sy is the measure-     (Hasekamp et al., 2019). In Sect. 3 we present recent updates
ment error covariance matrix that contains the noise estimate,     that further improve the quality of the data. The TROPOMI
γ is the regularization parameter, W is a diagonal weighting       XCH4 scientific data product from SRON retrieved with the
matrix that renders the side constraint dimensionless and en-      updated algorithm serves as a beta version of the operational
sures that only the target absorber CH4 and the scattering         processing. Another scientific retrieval algorithm using the
parameters contribute to its norm (Hu et al., 2016) and x a is     weighting function modified differential optical absorption
the a priori state vector.                                         spectroscopy (WFM-DOAS) method to retrieve CO and CH4
   The retrieval state vector contains CH4 partial sub-column      from TROPOMI was presented by Schneising et al. (2019).
number densities at 12 equidistant pressure layers. The to-        Comparison of both retrieval approaches is foreseen as part
tal columns of the interfering non-target absorbers CO and         of ongoing verification activities.
H2 O are also retrieved, together with the effective aerosol to-
tal column, size and height parameter of the aerosol power         2.2   TCCON reference dataset
law distribution. A Lambertian surface albedo in both the
NIR and SWIR spectral range together with its first-order          To validate XCH4 retrieved from TROPOMI we use indepen-
spectral dependence is also retrieved, as well as spectral shift   dent ground-based XCH4 measurements from the Total Car-
and fluorescence in the NIR band.                                  bon Column Observing Network (TCCON) (Wunch et al.,
   The TROPOMI CH4 data product is given in the form of            2011a) as a reference (data version GGG2014). Table 1 con-
total column-averaged dry-air mole fraction, XCH4 . It is cal-     tains the information of the 13 different stations located in
culated from the methane vertical sub-column elements xi           North America, East Asia, Europe and Oceania used for the
and the dry-air column Vair,dry calculated with meteorology        validation. In regions where there are multiple TCCON sta-
input from ECMWF (European Centre for Medium-Range                 tions, we have selected those located at flat terrain in rela-
Weather Forecasts) operational analysis product and surface        tively remote areas, which minimizes the errors due to as-
topography from a high-resolution database:                        sumptions on the vertical CH4 distribution used to correct
                                                                   for differences between the surface elevation of TROPOMI
         n                                                         particular pixels and the ground altitude at the TCCON sites.
         X        xi
XCH4 =                   .                                  (3)       To evaluate the quality of the retrieved TROPOMI XCH4 ,
          i=0
                Vair,dry
                                                                   we average TROPOMI XCH4 data within a collocation
   The precision σXCH4 available in the data product is de-        radius around each station of 300 km. The average re-
fined as the standard deviation of the retrieval noise, which      trieved TROPOMI XCH4 within the specific radius is com-
follows from the error covariance matrix Sx that describes         pared with measurements of the matching TCCON station
the effect of the measurement noise on the retrieval (Hu et al.,   within ±2 h of the TROPOMI overpass (XCH4,TROPOMI −
2016):                                                             XCH4,TCCON ). For all paired collocations at each station, we
           qP                                                      compute the mean bias defined as the mean of the difference
                n                                                  of individual collocations (1CH4 ) and its standard deviation
                i,j =0 Sx,i,j
σXCH4 =                       .                             (4)    (σ ) as a measure of the spread in the data. We then compute
                Vair,dry                                           the average of the station biases (b) and its standard devia-
   The algorithm has been designed to provide accurate and         tion (σ (b)) as a measure of the station-to-station variability.
precise retrievals for clear-sky scenes with minor scattering      The station-to-station variability is an important diagnostic
by aerosols and optically thin cirrus. To fulfil this criterion,   parameter as it indicates regional biases in our data, and it
a strict cloud filter is applied based on observations of the      might be used as an overall uncertainty estimate.
Visible Infrared Imaging Radiometer Suite (VIIRS) aboard
the Suomi-NPP satellite that observes the same scene as

https://doi.org/10.5194/amt-14-665-2021                                                Atmos. Meas. Tech., 14, 665–684, 2021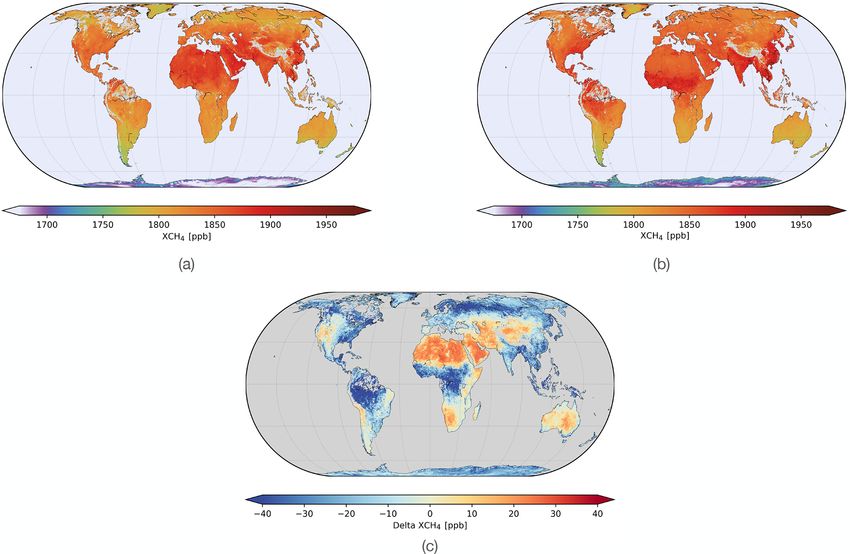
668                                                                                                      A. Lorente et al.: CH4 retrieved from TROPOMI

Table 1. Overview of the stations from TCCON used in this study.

        Site (country)                       Coordinates lat., long. (◦ )          Altitude (m a.s.l.)       Reference
        Sodankylä (Finland)                                  67.37, 26.63                              190   Kivi and Heikkinen (2016), Kivi et al. (2017)
        East Trout Lake (Canada)                          54.36, −104.99                               500   Wunch et al. (2017)
        Karlsruhe (Germany)                                    49.1, 8.44                              110   Hase et al. (2017)
        Orléans (France)                                      47.97, 2.11                              130   Warneke et al. (2017)
        Park Falls (USA)                                   45.94, −90.27                               440   Wennberg et al. (2017a)
        Lamont (USA)                                        36.6, −97.49                               320   Wennberg et al. (2017b)
        Pasadena (USA)                                    34.14, −118.13                               240   Wennberg et al. (2017c)
        Edwards (USA)                                     34.95, −117.88                                30   Iraci et al. (2016)
        Saga (Japan)                                        33.24, 130.29                               10   Kawakami et al. (2017)
        Darwin (Australia)                                −12.46, 130.93                                30   Griffith et al. (2017a)
        Wollongong (Australia)                            −34.41, 150.88                                30   Griffith et al. (2017b)
        Lauder* (New Zealand)                             −45.04, 169.68                               370   Sherlock et al. (2017), Pollard et al. (2019)

      * For the Lauder station, the ll instrument was replaced on October 2018 by the lr instrument.

2.3   GOSAT reference dataset                                                               ments to retrieve XCH4 and concluded that both retrievals
                                                                                            performed similarly with respect to bias variability and preci-
XCH4 measurements by the Thermal and Near Infrared Sen-                                     sion when validating the retrieved XCH4 with ground-based
sor for Carbon Observation Fourier transform spectrometer                                   TCCON measurements. This study also concluded that both
(TANSO-FTS) on board the Greenhouse gases Observing                                         methods can retrieve XCH4 in aerosol-loaded scenes with re-
SATellite (GOSAT) satellite are used for the validation of the                              trieval errors of less than 1 %.
TROPOMI XCH4 data. GOSAT was launched in 2009, and
it performs three-point observations in a cross-track swath of
790 km with 10.5 km resolution on the ground at nadir, which                                3     TROPOMI CH4 retrieval updates
results in global coverage approximately every 3 d.
   We use the GOSAT proxy XCH4 data product produced                                        The TROPOMI XCH4 scientific data product from SRON
at SRON in the context of the ESA GreenHouse Gas Cli-                                       retrieved with the updated algorithm will be suggested for
mate Change Initiative (GHG CCI) project (Buchwitz et al.,                                  use in the operational processing in the next processor up-
2019, 2017). This XCH4 product is retrieved using the                                       date. The updates to the S5P-RemoTeC retrieval algorithm
RemoTeC/proxy retrieval algorithm. The proxy approach                                       relate to the regularization scheme, the selection of the spec-
(Frankenberg et al., 2005) infers a CO2 and CH4 total col-                                  troscopic database, the implementation of a higher resolu-
umn from observations at 1.6 µm, ignoring any atmospheric                                   tion digital elevation map (DEM) for surface altitude and a
scattering in the retrieval. Substantially, the XCH4 product is                             more sophisticated a posteriori correction for the albedo de-
derived by                                                                                  pendence. In this section we present the updates and quantify
                                                                                            the improvements, and we use the comparison with TCCON
                  VCH4                                                                      and GOSAT as a benchmark to test the performance of the
XCH4 proxy =           · XCO2 mod ,                                             (5)
                  VCO2                                                                      retrieval after implementing the updates.
where the column-averaged dry-air mole fraction XCO2 mod                                    3.1        Regularization scheme
is taken from the Carbon Tracker data assimilation system,
and VCH4 and VCO2 are the vertical column densities. This                                   Hu et al. (2016) determined the regularization parameter γ
approach assumes that light path modifications due to scat-                                 in the inversion (Eq. 2) using the L-curve criterion (Hansen,
tering in the atmosphere are the same for the target absorber                               1998; Hu et al., 2016) in each iteration of the TROPOMI
(i.e. CH4 ) and the proxy absorber CO2 , whose prior is as-                                 measurement inversion. As TROPOMI has been measuring
sumed to be known with high accuracy.                                                       for more than 2 years, it is possible to select a constant reg-
   In the validation in Sect. 5 we found that there is no bias                              ularization optimized for real observations. This includes a
between the GOSAT proxy and full-physics products. How-                                     dedicated regularization parameter for the target absorber
ever, for the comparison we have selected the GOSAT proxy                                   CH4 and one for each of the scattering parameters (effective
product over the full-physics because of its higher data yield.                             aerosol distribution height and size parameter, and effective
The proxy approach cannot be applied to retrieve XCH4 from                                  aerosol column). The advantage of the constant regulariza-
TROPOMI since it does not cover the 1.6 µm CH4 and CO2                                      tion is a more stable performance compared to the L-curve
absorption bands. Schepers et al. (2012) compared both the                                  method in which the regularization strength changes at each
physics and proxy retrievals applied to GOSAT measure-                                      iteration for every scene. The regularization parameters are

Atmos. Meas. Tech., 14, 665–684, 2021                                                                             https://doi.org/10.5194/amt-14-665-2021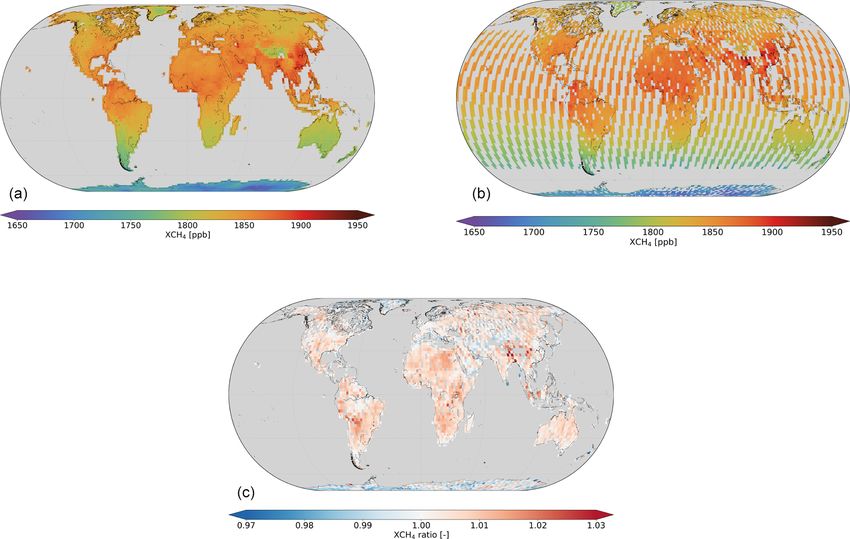
A. Lorente et al.: CH4 retrieved from TROPOMI                                                                                    669

selected such that the degrees of freedom for CH4 are be-
tween 1 and 1.5 and that retrieved scattering parameters fol-
low a distribution that we would expect.
   The main improvement of the constant regularization is
that the dispersion in the retrieved XCH4 is significantly
reduced. This is noticeable in the XCH4 distribution over
small regions where we do not expect large gradients of
XCH4 . At regions with relatively low albedo, the decrease
in the spread of the data can reach 10 %–20 % (e.g. from
18 to 14 ppb over Canada and 11 to 9 over Australia). Fur-
thermore, the validation with TCCON shows a decrease in
the station-to-station variability of 4 ppb (25 % decrease of
the 15 ppb station-to-station variability using the L-curve ap-
proach) when analysing 1 year of data. The comparison with        Figure 1. Latitudinal distribution of TROPOMI XCH4 retrieved
GOSAT shows that the new regularization scheme reduces            using HITRAN 2008 (blue), HITRAN 2016 (pink) and SEOM-
the standard deviation of the difference between collocated       IAS (green), referenced to the value at 0◦ latitude. Daily measure-
GOSAT and TROPOMI XCH4 observations by 9 % (from                  ments from September 2018–September 2019 are gridded into a
21.5 to 19.7 ppb).                                                0.2◦ × 0.2◦ grid, averaged longitudinally and then binned in 1◦ lat-
                                                                  itude.
3.2   Spectroscopy database

The TROPOMI CH4 retrieval uses external spectroscopic in-         ent spectroscopic databases introduce an overall bias, but the
formation to simulate the molecular absorption lines of the       standard deviation of the bias does not change significantly
target absorber CH4 as well as of CO and H2 O. The baseline       (Table 2).
retrieval algorithm employs the HITRAN 2008 spectroscopic            On a global scale, we see that both the rms and χ 2 improve
database (Rothman et al., 2009) with updated spectroscopy         significantly when using the SEOM-IAS database, with HI-
parameters for H2 O from Scheepmaker et al. (2013). In            TRAN 2008 giving the worst fitting results. Global mean χ 2
preparation for the Sentinel 5 Precursor mission, Birk et al.     improves by 19 % with SEOM-IAS cross-section and by 7 %
(2017) established an improved spectroscopic database, the        with HITRAN 2016 with respect to HITRAN 2008. Figure 1
so-called Scientific Exploitation of Operational Missions         shows the latitudinal distribution of XCH4 retrieved with HI-
– Improved Atmospheric Spectroscopy Databases (SEOM-              TRAN 2008, SEOM-IAS and HITRAN 2016, referenced to
IAS hereafter) for the interpretation of TROPOMI observa-         the value at 0◦ latitude. XCH4 retrieved with HITRAN 2016
tions. The release of the HITRAN 2016 database already in-        shows the least latitudinal variation at latitudes higher than
cluded some of the updates from the SEOM-IAS project re-          55◦ where differences between the datasets are largest; how-
garding H2 O (Gordon et al., 2017). We have tested the effect     ever the global distribution does not point to a better perfor-
of the three spectroscopic databases on the retrieved XCH4        mance of any of the spectroscopic databases. The validation
using 1 year of TROPOMI data (September 2018–September            with TCCON observations including Eureka (80.05◦ N) and
2019).                                                            Lauder (45.04◦ S) just reflects the overall bias but does not
   The TCCON validation shows that after substituting HI-         point to any latitudinal bias of XCH4 retrieved with any of
TRAN 2008 by HITRAN 2016 and SEOM-IAS for all the                 the spectroscopic databases (not shown).
molecules in the CH4 retrieval, the station-to-station vari-         The results of the sensitivity tests do not point to an im-
ability does not change significantly (less than 1 ppb; see Ta-   proved data quality when the HITRAN 2016, SEOM-IAS or
ble 2). The change in the mean bias shows that the different      HITRAN 2008 spectroscopic database is used. Each of them
spectroscopy databases introduce an overall bias in the re-       introduces an overall bias that cannot be used as an indepen-
trieved XCH4 with respect to HITRAN 2008 (+20.3 ppb for           dent argument to favour a specific database. In view of the
HITRAN 2016 and −14.7 ppb for SEOM-IAS), but the cor-             better spectral fitting results in the retrieved XCH4 , we have
relation of the bias with other retrieved parameters (surface     decided to use the SEOM-IAS spectroscopy database.
albedo, H2 O) does not improve or worsen with any of the
spectroscopic database. The spectral fitting quality parame-      3.3   Surface elevation
ters (e.g. the root mean square of the spectral fit residuals,
rms, and the corresponding χ 2 ) show a slight improvement        Satellite remote sensing of XCH4 requires accurate knowl-
over TCCON stations when using the SEOM-IAS spectro-              edge of surface pressure and thus of surface elevation, which
scopic database, similar to what was found for the CO re-         is specially relevant for the spatially highly resolved mea-
trieval from TROPOMI (Borsdorff et al., 2019). The compar-        surements of TROPOMI. The effect is twofold: (1) through
ison with XCH4 measured by GOSAT also shows that differ-          the pressure dependence of the absorption cross-sections and

https://doi.org/10.5194/amt-14-665-2021                                                 Atmos. Meas. Tech., 14, 665–684, 2021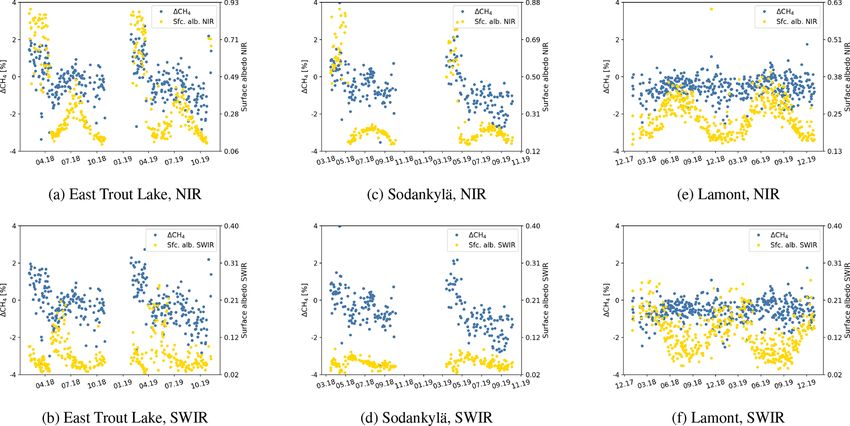
670                                                                        A. Lorente et al.: CH4 retrieved from TROPOMI

Table 2. Overview of the TCCON and GOSAT validation results        fit from this update. Due to its higher resolution, the SRTM
(mean bias and its standard deviation) for the TROPOMI XCH4        DEM is a better representation of elevation not only over
retrieved with different spectroscopic databases.                  mountains, but also close to coastlines and over rough ter-
                                                                   rain (e.g. Greenland, Sahara).
                                 b ± σ (b) CH4 (ppb)∗
                                                                   3.4   Posteriori correction
            TCCON
            HITRAN 2008                 −2.4 ± 11.7                Greenhouse gas concentrations retrieved from satellite in-
            SEOM-IAS                    −17.1± 12.4                struments like TROPOMI generally show systematic biases
            lHITRAN 2016                 17.9 ± 11.1               with different instrumental or geophysical parameters. Re-
            GOSAT                                                  trieved CO2 and CH4 from GOSAT and OCO-2 are typically
                                                                   corrected for dependencies on goodness of fit, surface albedo
            HITRAN 2008                   3.9 ± 20.1               or aerosol parameters (e.g. Guerlet et al., 2013; Inoue et al.,
            SEOM-IAS                     −8.4 ± 22.8               2016; Wu et al., 2018). In the approach that O’Dell et al.
            HITRAN 2016                  23.8 ± 19.7
                                                                   (2018) derived for OCO-2 CO2 retrievals, such parametric
           * b = TROPOMI − ref                                     bias is part of a more complex correction that also accounts
                                                                   for footprint-level and global biases using a set of four “truth
                                                                   proxies” as a reference.
(2) through the dry-air column used to calculate the dry-air          The comparison of TROPOMI and TCCON XCH4 mea-
mixing ratio from the retrieved column (Eq. 3).                    surements shows a dependence of the bias (i.e. difference be-
   In a first preprocessing step of the retrieval, the elevation   tween TROPOMI and TCCON) on surface albedo retrieved
data from a digital elevation map (DEM) are interpolated in        in the SWIR spectral range, while for the other retrieved pa-
space to the ground pixel. Then a correction is applied to the     rameters the dependence is negligible (compared to that of
atmospheric variables (i.e. surface pressure and model pres-       the surface albedo; see Fig. 3 with solar zenith angle and
sure levels) based on the difference between the coarse res-       aerosol optical depth as an example). Figure 3a shows that
olution ECMWF altitude and the surface elevation from the          for low-albedo values, TROPOMI XCH4 strongly underes-
DEM. To minimize errors, a filter is applied on terrain rough-     timates TCCON measurements, while for relatively high-
ness, which excludes scenes with a standard deviation of the       albedo values TROPOMI overestimates TCCON measure-
surface elevation higher than 80 m within the observed area.       ments. The comparison of TROPOMI XCH4 with XCH4 re-
The default source for surface elevation information for all       trieved from measurements of GOSAT shows the same de-
TROPOMI products is the Global multi-resolution terrain el-        pendence of the bias with the retrieved surface albedo. For
evation data 2010 DEM (GMTED2010), with an aggregation             scenes with low-albedo values, generally the retrieval’s sen-
radius of 5 km and a sampling of around 2 km, which results        sitivity is low due to the large measurement noise, therefore
in a resolution of approximately 2 km (S5P-DEM hereafter).         errors from unaccounted light path modification due to scat-
   The updated retrieval scheme uses the Shuttle Radar To-         tering processes can be more significant than for scenes with
pography Mission (SRTM) (Farr et al., 2007) digital ele-           a relatively higher albedo. For low-albedo scenes, this effect
vation map with a resolution of 15 arcsec, approximately           leads to an underestimation in the retrieved trace gas (Guer-
400 m. To match the DEM surface elevation with the ground          let et al., 2013; Aben et al., 2007), resembling the TROPOMI
pixel, we perform a spatial sampling of 0.5 km and com-            XCH4 underestimation in Fig. 3a.
pute the mean altitude and its standard deviation for each            To account for the albedo dependence, we apply an a pos-
scene. Figure 2a shows altitude differences between S5P-           teriori bias correction to the retrieved XCH4 . In the baseline
DEM and SRTM collocated to TROPOMI pixels (before alti-            operational algorithm a few months after TROPOMI was
tude correction) on 5 May 2019 over the United States. In this     operational, we applied a correction based on the compari-
specific area, 5 % of the pixels have differences in altitude      son of TROPOMI XCH4 with GOSAT retrievals (Hasekamp
greater than 45 m, with the highest differences over mountain      et al., 2019). After more than 2 years of measurements, we
regions. For these scenes the differences in retrieved XCH4        have sufficient data to derive a new correction using only
are up to 7 ppb. On a yearly average (and after correction and     TROPOMI XCH4 measurements. We use a similar approach
quality filtering), 1 % of the retrievals present altitude dif-    to the “small area approximation” applied to OCO-2 (O’Dell
ferences greater than 50 m, which result in surface pressure       et al., 2018), assuming a uniform XCH4 distribution as a
differences above 5 hPa and XCH4 differences above 10 ppb          function of albedo in several regions. This approach makes
(Fig. 2b–d). The terrain roughness within TROPOMI pix-             the correction completely independent of any reference data
els has not changed significantly with the SRTM DEM, so            (e.g. GOSAT, TCCON) that could introduce additional bi-
it does not affect the data yield due to the 80 m threshold.       ases when applying the correction and does not allow for an
Although globally the average altitude difference is small,        independent verification of the correction.
the analysis of small-scale XCH4 enhancements will bene-

Atmos. Meas. Tech., 14, 665–684, 2021                                                https://doi.org/10.5194/amt-14-665-2021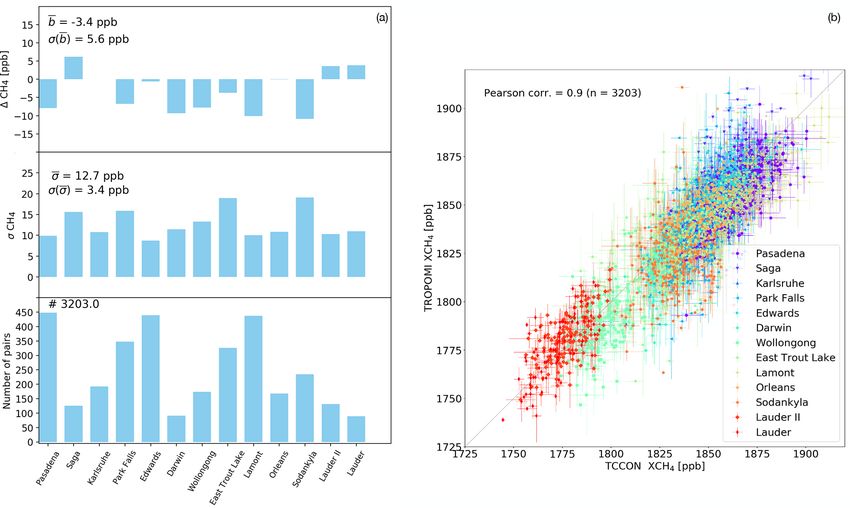
A. Lorente et al.: CH4 retrieved from TROPOMI 671
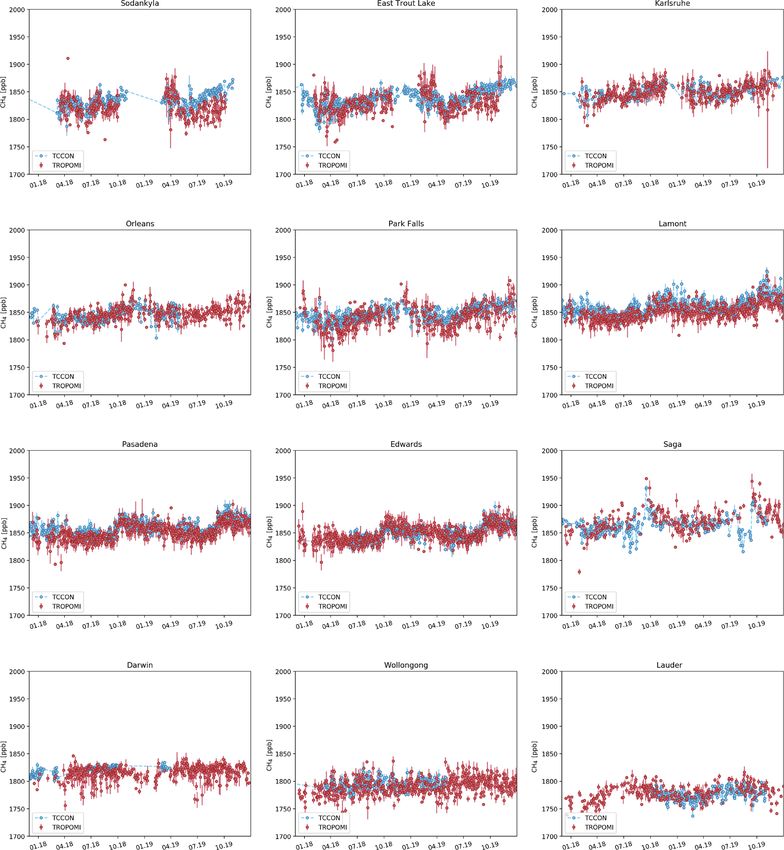
Figure 2. (a) Altitude difference between S5P-DEM and SRTM collocated to TROPOMI pixels on 5 May 2019 (orbits 8077, 8078, 8079).
(b–d) Altitude, surface pressure and XCH4 differences averaged over a year, with custom quality filtering for the TROPOMI XCH4 retrievals,
in a 0.2◦ × 0.2◦ grid over the United States (20–50◦ N, 65–120◦ W).
Figure 3. Ratio of XCH4 measurements by TCCON and TROPOMI as a function of (a) retrieved surface albedo in the SWIR spectral range,
(b) retrieved effective aerosol optical depth (AOD) in the SWIR spectral range and (c) solar zenith angle (SZA).
The new correction is derived as follows: face albedo of 0.2 (e.g. Guerlet et al., 2013; Aben et al.,
2007).
1. We select areas at several latitudes and longitudes
throughout the globe, small enough so we can assume 3. We combine the albedo dependence for all the areas,
that XCH4 does not vary but large enough to cover we fit the curve using B-spline interpolation and least-
scenes with a wide range of albedo values. Figure B1 squares fitting.
shows the different regions. The B-spline method fits piece-wise polynomials that are
continuous at the preselected knots. The knots and the order
2. For each region we estimate a XCH4 reference value of the polynomials are chosen such that the residual rms of
for a surface albedo around 0.2, and then we calculate fit residuals is minimum and that the shape of the fit at the
the ratio of the retrieved XCH4 to the reference value edges of the surface albedo range does not vary sharply.
to obtain the albedo dependence. The specific value for Figure 4 shows the distribution of the reference to
surface albedo is selected because XCH4 retrieval er- TROPOMI XCH4 ratio for all the areas and the result of the
rors are lower in the SWIR for that albedo range: errors B-spline fit. We observe two distinct features: (1) the strong
because of unaccounted light path modifications due to underestimation for low-albedo values (already shown in the
scattering and surface albedo are minimal around a sur- TCCON comparison in Fig. 3a), for which the B-spline fit
https://doi.org/10.5194/amt-14-665-2021 Atmos. Meas. Tech., 14, 665–684, 2021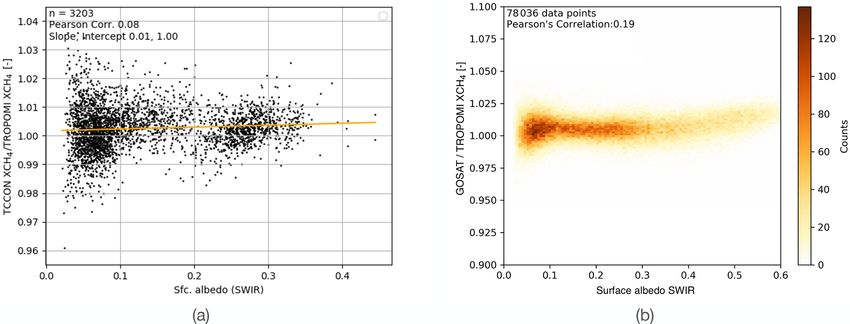
672                                                                             A. Lorente et al.: CH4 retrieved from TROPOMI

                                                                       (Fig. 6b), which reduces by 4 ppb the scatter of the differ-
                                                                       ences in XCH4 measured by the two satellites. In the remain-
                                                                       der of the paper, the corrected XCH4 product will be used.

                                                                       4     Comparison of TROPOMI and TCCON

                                                                       4.1    TCCON validation

                                                                       We perform a detailed comparison of the TROPOMI XCH4
                                                                       corrected with XCH4 measured at 13 TCCON stations se-
                                                                       lected for the validation (Table 1). TROPOMI is able to cap-
                                                                       ture the temporal XCH4 variability, both the seasonal cy-
                                                                       cle and the year-to-year increase. This is clearly visible in
                                                                       the time series (e.g. Pasadena or Lamont) in Fig. 7, which
                                                                       shows the time series of daily average XCH4 measured at
Figure 4. Ratio of reference XCH4 to TROPOMI XCH4 as a func-           each TCCON station and by TROPOMI for the period 1 De-
tion of the retrieved surface albedo as explained in step 3 in the     cember 2018–31 December 2019, with a collocation radius
derivation of the bias correction. Green dots show the average ratio   of 300 km.
in 0.05 albedo bins, and the orange line shows the B-spline fit used      The mean bias is below 1 % for all stations; the validation
to derive the bias correction. Data are averaged from 1 January 2018
                                                                       results are summarized in Table 3. The average bias for all
until 31 December 2019 in a 0.1◦ × 0.1◦ grid.
                                                                       stations is −0.2 % (−3.4 ppb), and the station-to-station vari-
                                                                       ability is 0.3 % (5.6 ppb), both parameters below the mission
corrects more strongly than the regular polynomial fit that            requirements for TROPOMI XCH4 retrievals. Compared to
was previously derived for the operational product and (2) an          the uncorrected TROPOMI XCH4 , the mean bias is reduced
overestimation for high-albedo values, not captured by TC-             significantly (from −3.4 % to 0.2 %), even though the correc-
CON due to the limited albedo range values but reported in             tion approach does not include any term to correct a global
the TROPOMI and GOSAT comparisons.                                     bias. As the overall negative bias is driven by the strong
   The correction applied to the retrieved XCH4 can be ex-             XCH4 underestimation for low-albedo values (Fig. 3a), cor-
pressed as                                                             recting for the albedo bias partly accounts for the overall bias.
                                                                          Figure 8a shows the mean bias and the standard deviation
XCHcorr
   4 i = XCH4 i · f (As i ).                                    (6)    for each of the stations ,and Fig. 8b shows the correlation
                                                                       plot. For a more strict collocation criterion of 100 km radius
   The correction function f depends on the retrieved surface          instead of 300 km, the number of points is reduced signifi-
albedo As in the SWIR spectral range at each pixel i.                  cantly, but the results of the validation do not change.
   Figure 5 shows the global distribution of XCH4 before and
after applying the correction. Distinctive features that corre-        4.2    High-latitude stations
spond with low and high surface albedo areas are visible in
the difference map. After correction, for example, the XCH4            Measurements at high-latitude stations such as East Trout
underestimation for low-albedo values (e.g. over high lati-            Lake (54.36◦ N) and Sodankylä (67.37◦ N) show the high-
tudes over Canada and Russia) is corrected. Similarly, the             est variability and the highest bias in the validation before
XCH4 overestimation for high-albedo values over desert ar-             correction, which is partially reduced by the albedo correc-
eas like Sahara is accounted for in the correction. The change         tion (see validation results in Table 3). There is a seasonality
in XCH4 induced by the bias correction is in the range of 2 %,         in the bias which is positive during the February–April pe-
in agreement with the errors observed in the TCCON com-                riod and changes to a negative bias around May, that then
parison.                                                               increases to reach the highest (negative) values in autumn.
   As the correction is derived using only TROPOMI XCH4                This seasonality can be attributed to the fact that during the
data, the comparison with TCCON and GOSAT is an in-                    winter there is snow in these regions at high latitudes as a
dependent verification of the approach. The validation with            result of cold, dry air, influencing XCH4 measurements by
TCCON shows a reduction of 5.9 ppb (50 %) in the station-              TROPOMI that affect the validation with TCCON measure-
to-station variability and of 13.6 ppb in the bias due to the          ments.
albedo correction. The dependence of the bias on surface                  Figure 9 shows the time series of the bias between
albedo is removed (Fig. 3a vs. Fig. 6a), and the dependence            TROPOMI and TCCON XCH4 , together with the surface
on other parameters remains negligible (not shown). The                albedo retrieved in both the SWIR and NIR spectral range
comparison with GOSAT measurements shows that bias de-                 over East Trout Lake, Sodankylä and Lamont, the latter in-
pendence on albedo is removed after applying the correction            cluded as a mid-latitude reference. Low surface albedo in

Atmos. Meas. Tech., 14, 665–684, 2021                                                     https://doi.org/10.5194/amt-14-665-2021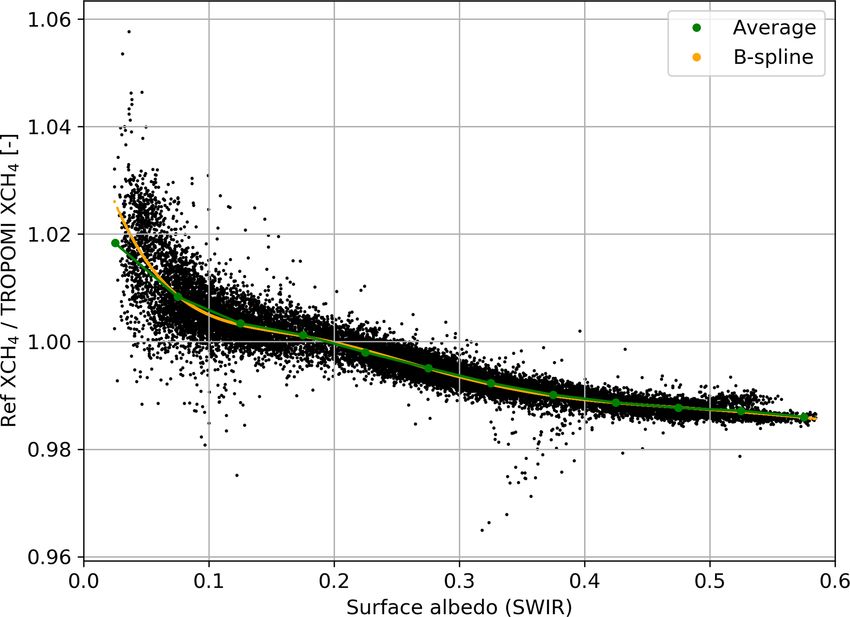
A. Lorente et al.: CH4 retrieved from TROPOMI                                                                                 673

Figure 5. (a) Global TROPOMI XCH4 distribution before correction, (b) after correction and (c) their difference (XCH4 − XCHcorr
                                                                                                                           4 ) for
2019 averaged in a cylindrical equal-area grid with 0.3◦ × 0.5◦ resolution at the Equator.

Figure 6. Ratio of daily XCH4 measurements by (a) TCCON and TROPOMI and (b) GOSAT and TROPOMI as a function of retrieved
surface albedo in the SWIR spectral range. Data for the period 1 December 2018–31 December 2019 are shown.

the SWIR together with high surface albedo in the NIR in-          as a proxy to identify the presence of snow and dry air from
dicates the presence of snow, which is highly correlated with      dynamic meteorological situations at high latitudes.
the seasonality in the bias in East Trout Lake and Sodankylä,         The presence of snow at high-latitude stations shifts the
seasonality that is more pronounced in 2019 than 2018. The         focus to retrieval errors as the most probable cause of the
seasonal bias is also correlated with high hydrogen fluoride       seasonal bias between TCCON and TROPOMI rather than
(HF) and low H2 O concentrations (not shown). High HF con-         errors due to collocation or influence of the different priors.
centrations are an indication of the influence of the vortex       Scenes covered by snow are characterized by low spectrum
in a specific location, as HF is mostly found in the strato-       intensity in the SWIR, so signal-to-noise ratio is a limiting
sphere; HF together with the contrast between surface albedo       factor. On the other hand, the high TROPOMI signal in the
retrieved in the SWIR and NIR spectral ranges can be used          NIR suggests that the weighting of each band might not be
                                                                   optimal in the inversion. As the optical properties are differ-

https://doi.org/10.5194/amt-14-665-2021                                                Atmos. Meas. Tech., 14, 665–684, 2021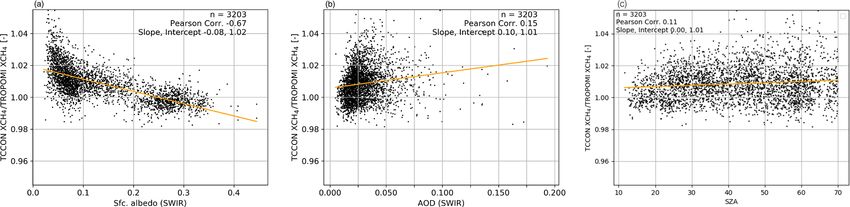
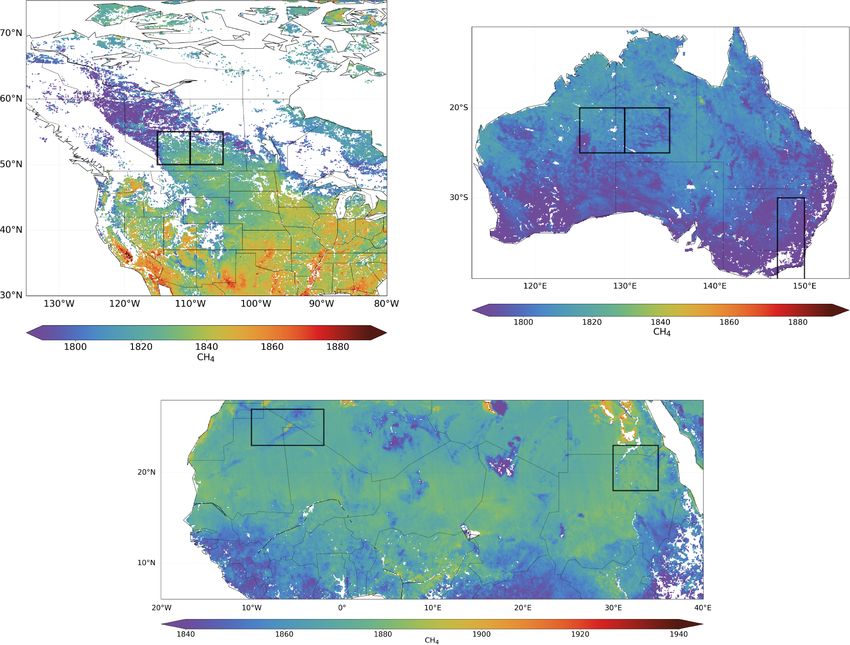
674                                                                       A. Lorente et al.: CH4 retrieved from TROPOMI

Figure 7. Time series of daily averaged XCH4 measurements from TROPOMI (red) and TCCON (blue) over the selected stations for the
period 1 December 2018–31 December 2019. TROPOMI measurements around a circle of 300 km radius around each station have been
selected for the comparison.

ent in the NIR and SWIR bands, errors in the quantification       not be as effective in winter as in spring–autumn, causing the
of light path modifications over snow-covered scenes can          seasonality on the bias. A high bias in high latitudes corre-
lead to an overestimation of retrieved XCH4 . Furthermore, if     lated with H2 O columns was also found in H2 O/HDO re-
H2 O may compensate for any radiometric offset in the strong      trievals from TROPOMI by Schneider et al. (2020). Note that
CH4 absorption bands, then in such dry conditions this would

Atmos. Meas. Tech., 14, 665–684, 2021                                               https://doi.org/10.5194/amt-14-665-2021
A. Lorente et al.: CH4 retrieved from TROPOMI                                                                                         675

Figure 8. (a) Mean differences between TROPOMI and TCCON XCH4 (1XCH4 ), the standard deviation of the differences (σXCH4 ) and the
number of collocations for each of the stations selected for the validation. (b) Correlation of daily average XCH4 measured by TROPOMI
and TCCON for all the stations.

Table 3. Overview of the validation results of TROPOMI XCH4 with measurements from TCCON at selected stations. The table shows
the number of collocations, mean bias and standard deviation for each station and the mean bias for all stations and the station-to-station
variability (in ppb and in percentages between parenthesis). Results are shown for TROPOMI XCH4 with and without the albedo bias
correction applied.

                                                                       Corrected TROPOMI            Uncorrected TROPOMI
                                                                        XCH4 and TCCON               XCH4 and TCCON
            Site, country, lat., long. coord.              No. of            Bias     Standard              Bias     Standard
                                                           points       (ppb) (%)     deviation        (ppb) (%)     deviation
                                                                                     (ppb) (%)                      (ppb) (%)
            Pasadena (USA) (34.14, −118.13)                  399     −8.0 (−0.4)      9.8 (0.5)       0.6 (0.03)     9.3 (0.5)
            Saga (Japan) (33.24, 130.29)                     117        6.2 (0.3)    15.6 (0.8)    −17.6 (−0.9)     13.0 (0.7)
            Karlsruhe (Germany) (49.1, 8.44)                 196       0.02 (0.0)    10.8 (0.6)    −19.2 (−1.0)     10.1 (0.5)
            Darwin (Australia) (−12.46, 130.93)               93     −9.3 (−0.5)     11.4 (0.6)    −16.5 (−0.9)     11.8 (0.7)
            Wollongong (Australia) (−34.41, 150.88)          132     −7.8 (−0.4)     13.3 (0.7)    −19.6 (−1.1)     14.9 (0.8)
            Lauder I (New Zealand) (−45.04, 169.68)           99        3.6 (0.2)    10.3 (0.6)    −12.3 (−0.7)     10.4 (0.6)
            Lauder II (New Zealand) (−45.04, 169.68)          93        3.8 (0.2)    11.0 (0.6)   −11.8 (−0.67)     10.8 (0.6)
            Park Falls (USA) (45.94, -90.27)                 325     −6.8 (−0.4)     15.9 (0.9)    −29.3 (−1.6)     17.4 (0.9)
            East Trout Lake (Canada) (54.36, −104.99)        315     −3.7 (−0.2)     19.0 (1.0)    −27.1 (−1.5)     21.4 (1.2)
            Lamont (USA) (36.6, −97.49)                      388    −10.1 (−0.5)     10.0 (0.5)    −19.6 (−1.1)     11.2 (0.6)
            Orléans (France) (47.97, 2.11)                   139     −0.07 (0.0)     10.8 (0.6)    −16.0(−0.9)      12.0 (0.7)
            Edwards (USA) (34.95, −117.88)                   373    −0.6 (−0.03)      8.7 (0.5)        7.1 (0.4)     8.8 (0.5)
            Sodankylä (Finland) (67.37, 26.63)               234    −10.9 (−0.6)     19.1 (1.0)    −39.4 (−2.1)     18.6 (1.0)
            Mean bias, station-to-station variability                −3.4 (−0.2)      5.6 (0.3)     −17.0 (−0.9)    11.5 (0.6)

https://doi.org/10.5194/amt-14-665-2021                                                      Atmos. Meas. Tech., 14, 665–684, 2021
676 A. Lorente et al.: CH4 retrieved from TROPOMI
Figure 9. Daily mean relative differences (blue, left axis) between TROPOMI and TCCON XCH4 (1CH4 ) and surface albedo in the NIR
(yellow, secondary axis, a, c, e) and surface albedo in the SWIR (yellow, secondary axis, b, d, f) at East Trout Lake (54.3◦ N) (a, b),
Sodankylä (67.4◦ N) (c, d) and Lamont (36.6◦ N) (e, f).
the seasonal bias is also present when XCH4 is retrieved us- to 1 %) compared to other regions, with areas of underesti-
ing the spectroscopic databases discussed in Sect. 3.2. mation as well as overestimation. The overall underestima-
To filter for scenes covered with snow or ice, Wunch et al. tion is stronger by about 2 % in the non-corrected XCH4 , re-
(2011b) introduced the so-called “blended albedo”, which flecting that the albedo correction improves the TROPOMI
combines the surface albedo in the NIR and SWIR to be XCH4 that is too low in areas where the surface albedo is
used as a filter. By applying it to Sodankylä and East Trout low (e.g. forests around the Equator). For higher latitudes, the
Lake, we found that a threshold value of 0.85 is optimal to underestimation is less strong, and in some areas TROPOMI
remove these scenes that cause the seasonality on the bias. overestimates XCH4 compared to GOSAT (e.g. Greenland
The influence of snow needs to be further investigated from and Antarctica), in agreement with the high bias in XCH4
the retrieval algorithm perspective, and it should be con- reported in the TCCON validation at East Trout Lake and
sidered when interpreting the validation results and when Sodankylä.
analysing TROPOMI XCH4 data over snow-covered scenes, The latitudinal distribution of XCH4 from TROPOMI,
most prevalent at high latitudes. GOSAT and TROPOMI collocated with TCCON stations is
shown in Fig. 11, summarizing the validation of TROPOMI
XCH4 and showing the good agreement between the three
5 Comparison with GOSAT satellite datasets. Similar to Fig. 10, it shows that TROPOMI underes-
timates GOSAT at most latitudes but both overlap within the
We compare XCH4 retrieved from TROPOMI and GOSAT
XCH4 variability. It also shows the shift to an overestimation
measurements for a period of 2 years (January 2018–
at high latitudes where TROPOMI retrieves higher XCH4 .
December 2019). The comparison yields a mean bias of
This agrees with the conclusion that over snow TROPOMI
−10.3 ± 16.8 ppb (−0.6 ± 0.9 %) and a Pearson’s correlation
XCH4 is too high, and although this distribution resembles
coefficient of 0.85. The overall comparison yields a mean
the latitudinal distribution of XCH4 shown in Fig. 1, it cannot
bias of −12.5 ± 14.9 ppb if we use the GOSAT XCH4 prod-
be attributed to the selection of the spectroscopic database.
uct retrieved with the full-physics approach. Figure 10 shows
TROPOMI and GOSAT XCH4 and their ratio averaged to a
2◦ ×2◦ grid. Overall compared to GOSAT, TROPOMI under- 6 Conclusions
estimates XCH4 , specially in the regions around the tropics
in South America (−0.6 ± 0.8 %) and in the African conti- We have presented several improvements that have been im-
nent (−0.9 ± 0.8 %). In Asia there is higher variability (up plemented in the retrieval of XCH4 from TROPOMI mea-
Atmos. Meas. Tech., 14, 665–684, 2021 https://doi.org/10.5194/amt-14-665-2021A. Lorente et al.: CH4 retrieved from TROPOMI 677
Figure 10. Global distribution of XCH4 measured by (a) TROPOMI and (b) GOSAT and (c) the ratio of GOSAT to TROPOMI XCH4 . Daily
collocations are averaged to a 2◦ × 2◦ grid for the period 1 January 2018–31 December 2019.
the TROPOMI XCH4 data compared to the operational data
product (version 1.2.0; Hu et al., 2016). We have investigated
the effect of the horizontal resolution of the surface eleva-
tion database by replacing GMTED2010 S5P with the SRTM
1500 database, relevant in the XCH4 retrieval for which accu-
rate knowledge of surface pressure is necessary. The higher
resolution database results in a more realistic representation
of surface altitude, particularly for mountainous regions and
places with rough surfaces, where differences in surface pres-
sure above 5 hPa result in retrieved XCH4 that varies up to
10 ppb for specific scenes.
We have tested three state-of-the-art spectroscopic
databases (HITRAN 2008 with updates from Scheepmaker
et al., 2013, HITRAN 2016 and SEOM-IAS). Using the
Figure 11. Latitudinal distribution of XCH4 measured by SEOM-IAS database results in the best spectral fitting qual-
TROPOMI and GOSAT and the TROPOMI and TCCON colloca- ity parameters in the retrieved XCH4 . Each of the differ-
tions over the selected stations for validation in Sect. 4. The shaded ent spectroscopic databases introduces a bias in the distri-
bands indicate the scatter (i.e. 1σ standard deviation) around the bution of XCH4 with respect to each other, but there is not
mean. any additional bias (e.g. latitudinal, albedo bias) that could
point to the fitness for purpose of any of the databases. In
view of the best fitting results, we decided to use the SEOM-
surements in the NIR and SWIR spectral range. Now that IAS database, which was derived specifically for TROPOMI.
TROPOMI has been measuring for more than 2 years, the However, there is a need for a thorough and detailed analysis
amount of data allows for the implementation of a series of of these databases, focusing on the different absorbers that
updates that were not previously possible without the use of are relevant in the CH4 absorption bands to learn about the
any reference data (i.e. regularization scheme and an a poste- underlying processes that are driving the overall bias.
riori correction derived using only TROPOMI XCH4 data). One of the most relevant updates is the implementation of
The regularization scheme with constant regularization pa- an a posteriori correction that is fully independent of any ref-
rameters stabilizes the retrieval and yields less scatter in erence data. We have derived a correction for the bias depen-
https://doi.org/10.5194/amt-14-665-2021 Atmos. Meas. Tech., 14, 665–684, 2021678 A. Lorente et al.: CH4 retrieved from TROPOMI dence on albedo using only TROPOMI XCH4 data. This has been possible due to the high resolution of TROPOMI and its global coverage. We select regions around the globe which cover different albedo ranges and dependencies to estimate the albedo bias. The new correction is more accurate than the regular polynomial fit for the strong XCH4 underestimation at low surface albedo scenes and also corrects for the positive bias in scenes with high surface albedo. After applying the correction, the albedo dependence in the TROPOMI-GOSAT and TROPOMI-TCCON comparison is removed, which is an independent verification of the correction scheme. The change in XCH4 induced by the bias correction is in the range of 2 %, and although we attribute it mostly to unaccounted for light path modification due to scattering processes, Butz et al. (2012) predicted residual scattering errors to be mostly be- low 1 %, which suggests that other errors might exist, which needs to be further investigated. The good agreement of TROPOMI XCH4 with TCCON (−3.4 ± 5.6 ppb) and GOSAT (−10.3 ± 16.8 ppb) highlights the high quality of the TROPOMI measurements. Low- and high-albedo scenes are the most challenging for the XCH4 retrieval algorithm, and although the a posteriori correction accounts for most of the bias, there is a need to further un- derstand the underlying cause and whether it originates in the instrument or in the retrieval algorithm. Also the overes- timation of XCH4 over snow-covered scenes requires further investigation from the retrieval algorithm perspective. With respect to the validation, additional sites would be benefi- cial to cover the under-sampled regions and conditions. The network is currently limited to relatively low-albedo values, so there is a lack of reference data for high-albedo scenes, particularly around the Equator. Furthermore, there is a clear imbalance between the number of stations in the Northern and Southern Hemisphere, as well as a lack of stations be- low 45◦ S. This is not only relevant for a complete validation of current and future satellite instruments, but also to have a complete global network to monitor concentrations of CH4 in the atmosphere. Atmos. Meas. Tech., 14, 665–684, 2021 https://doi.org/10.5194/amt-14-665-2021
A. Lorente et al.: CH4 retrieved from TROPOMI                                                                                                      679

Appendix A: Filtering criteria

Table A1. Overview of the filters applied to ensure high-quality TROPOMI XCH4 retrievals.

                           Parameter                                                                                        Range
                           Cloud fraction∗ from VIIRS inner field of view (IFOV)                                          < 0.001
                           Cloud fraction∗ from VIIRS outer field of view (OFOV) (up-                                     < 0.001
                           scaled FOV by 10 %, 50 % and 100 %) (OFOVa, b, c)
                           Ratio of XCH4 retrieved from strong and weak absorption                                 0.85 < x < 1.15
                           bands with the non-scattering retrieval using H2016 cross-
                           sections
                           Standard deviation of XCH4 ratio within SWIR pixel plus 8                                       < 0.05
                           neighbouring pixels
                           Signal-to-noise ratio                                                                             > 50
                           Precision (noise-related error)                                                                   < 10
                           χ2                                                                                               < 100
                           Retrieved aerosol optical thickness (AOT) (SWIR)                                                 < 0.1
                           Surface albedo                                                                                  > 0.02
                           Solar zenith angle (◦ )                                                                           < 70
                           Viewing zenith angle (◦ )                                                                         < 60
                           Terrain roughness (m) standard deviation of surface elevation                                     < 80
                           within ground pixel

                         * Cloud fraction defined as the fraction of VIIRS pixels classified as confidently clear sky.

https://doi.org/10.5194/amt-14-665-2021                                                                           Atmos. Meas. Tech., 14, 665–684, 2021
680 A. Lorente et al.: CH4 retrieved from TROPOMI Appendix B: Regions selected for the a posteriori correction The regions selected to estimate the a posteriori correction are shown in Fig. B1. Figure B1. Black boxes over North Africa, Australia and Canada correspond to the different regions selected to estimate the a posteri- ori correction (see Sect. 3.4). Global distribution of XCH4 averaged to a 0.1◦ × 0.1◦ grid for the period 1 January 2018–31 December 2019. Atmos. Meas. Tech., 14, 665–684, 2021 https://doi.org/10.5194/amt-14-665-2021
A. Lorente et al.: CH4 retrieved from TROPOMI                                                                                              681

Data availability. The SRON S5P-RemoTeC scientific TROPOMI                  cuss. [preprint], https://doi.org/10.5194/acp-2020-550, in review,
CH4 dataset from this study is available for download at                    2020.
https://doi.org/10.5281/zenodo.4447228 (Lorente et al., 2021)             Birk, M., Wagner, G., Loos, J., Wilzewski, J., Mondelain, D., Cam-
or at https://ftp.sron.nl/open-access-data-2/TROPOMI/tropomi/               pargue, A., Hase, F., Orphal, J., Perrin, A., Tran, H., Daumont,
ch4/14_14_Lorente_et_al_2020_AMTD/ (last access: 27 January                 L., Rotger-Languereau, M., Bigazzi, A., and Zehner, C.: Methane
2021). TCCON data are available from the TCCON Data Archive:                and water spectroscopic database for TROPOMI Sentinel 5 Pre-
Total Carbon Column Observing Network (TCCON), available at                 cursor in the 2.3 µm region, vol. 19, p. 4652, EGU General As-
https://tccondata.org/ (last access: 12 January 2021).                      sembly, 2017.
                                                                          Borsdorff, T., aan de Brugh, J., Schneider, A., Lorente, A., Birk, M.,
                                                                            Wagner, G., Kivi, R., Hase, F., Feist, D. G., Sussmann, R., Ret-
Author contributions. AL, TB, OH, JdB, AS, AB and JL provided               tinger, M., Wunch, D., Warneke, T., and Landgraf, J.: Improv-
the TROPOMI CH4 retrieval and data analysis. The TCCON part-                ing the TROPOMI CO data product: update of the spectroscopic
ners provided the validation datasets. AL wrote the original draft          database and destriping of single orbits, Atmos. Meas. Tech., 12,
with input from TB and JL. All authors discussed the results and            5443–5455, https://doi.org/10.5194/amt-12-5443-2019, 2019.
reviewed and edited the paper.                                            Buchwitz, M., Reuter, M., Schneising, O., Hewson, W., Detmers,
                                                                            R. G., Boesch, H., Hasekamp, O., Aben, I., Bovensmann, H.,
                                                                            Burrows, J., Butz, A., Chevallier, F., Dils, B., Frankenberg,
Competing interests. The authors declare that they have no conflict         C., Heymann, J., Lichtenberg, G., De Mazière, M., Notholt, J.,
of interest.                                                                Parker, R., Warneke, T., Zehner, C., Griffith, D. W. T., Deutscher,
                                                                            N., Kuze, A., Suto, H., and Wunch, D.: Global satellite obser-
                                                                            vations of column-averaged carbon dioxide and methane: The
                                                                            GHG-CCI XCO2 and XCH4 CRDP3 data set, Remote Sens. En-
Disclaimer. The presented work has been performed in the frame of
                                                                            viron., 203, 276–295, https://doi.org/10.1016/j.rse.2016.12.027,
Sentinel-5 Precursor Validation Team (S5PVT) or Level 1/Level 2
                                                                            2017.
Product Working Group activities. Results are based on preliminary
                                                                          Buchwitz, M., Aben, I., Armante, R., Boesch, H., Crevoisier, C.,
(not fully calibrated or validated) Sentinel-5 Precursor data that will
                                                                            Di Noia, A., Hasekamp, O. P., Reuter, M., Schneising-Weigel,
still change. The results are based on S5P L1B version 1 data. Plots
                                                                            O., and Wu, L.: Algorithm Theoretical Basis Document (ATBD)
and data contain modified Copernicus Sentinel data, processed by
                                                                            – Main document for Greenhouse Gas (GHG: CO2 and CH4 )
SRON.
                                                                            data set CDR 3 (2003–2018), C3S project, 2019.
                                                                          Butz, A., Guerlet, S., Hasekamp, O., Schepers, D., Galli, A.,
                                                                            Aben, I., Frankenberg, C., Hartmann, J.-M., Tran, H., Kuze,
Acknowledgements. The TROPOMI data processing was carried                   A., Keppel-Aleks, G., Toon, G., Wunch, D., Wennberg, P.,
out on the Dutch National e-Infrastructure with the support of the          Deutscher, N., Griffith, D., Macatangay, R., Messerschmidt,
SURF Cooperative.                                                           J., Notholt, J., and Warneke, T.: Toward accurate CO2 and
                                                                            CH4 observations from GOSAT, Geophys. Res. Lett., 38, 14,
                                                                            https://doi.org/10.1029/2011GL047888, 2011.
Financial support. Funding through the TROPOMI national pro-              Butz, A., Galli, A., Hasekamp, O., Landgraf, J., Tol, P., and
gram from the NSO and Methane+ is acknowledged. Darwin and                  Aben, I.: TROPOMI aboard Sentinel-5 Precursor: Prospec-
Wollongong TCCON sites are funded by the Australian Research                tive performance of CH4 retrievals for aerosol and cirrus
Council (DP140101552, DP160101598, LE0668470) and NASA                      loaded atmospheres, Remote Sens. Environ., 120, 267–276,
(NAG5-12247, NNG05-GD07G). Nicholas M. Deutscher is sup-                    https://doi.org/10.1016/j.rse.2011.05.030, 2012.
ported by an ARC Future Fellowship (FT180100327).                         Frankenberg, C., Meirink, J. F., van Weele, M., Platt, U., and
                                                                            Wagner, T.: Assessing Methane Emissions from Global
                                                                            Space-Borne Observations, Science, 308, 1010–1014,
Review statement. This paper was edited by Dominik Brunner and              https://doi.org/10.1126/science.1106644, 2005.
reviewed by two anonymous referees.                                       Gordon, I., Rothman, L., Hill, C., Kochanov, R., Tan, Y., Bernath,
                                                                            P., Birk, M., Boudon, V., Campargue, A., Chance, K., Drouin,
                                                                            B., Flaud, J.-M., Gamache, R., Hodges, J., Jacquemart, D.,
                                                                            Perevalov, V., Perrin, A., Shine, K., Smith, M.-A., Tennyson,
References                                                                  J., Toon, G., Tran, H., Tyuterev, V., Barbe, A., Császár,
                                                                            A., Devi, V., Furtenbacher, T., Harrison, J., Hartmann, J.-M.,
Aben, I., Hasekamp, O., and Hartmann, W.: Uncertainties in the              Jolly, A., Johnson, T., Karman, T., Kleiner, I., Kyuberis, A.,
  space-based measurements of CO2 columns due to scattering in              Loos, J., Lyulin, O., Massie, S., Mikhailenko, S., Moazzen-
  the Earth’s atmosphere, J. Quant. Spectrosc. Ra., 104, 450–459,           Ahmadi, N., Müller, H., Naumenko, O., Nikitin, A., Polyan-
  https://doi.org/10.1016/j.jqsrt.2006.09.013, 2007.                        sky, O., Rey, M., Rotger, M., Sharpe, S., Sung, K., Starikova,
Barré, J., Aben, I., Agustí-Panareda, A., Balsamo, G., Bousserez,           E., Tashkun, S., Auwera, J. V., Wagner, G., Wilzewski, J.,
  N., Dueben, P., Engelen, R., Inness, A., Lorente, A., McNorton,           Wcisło, P., Yu, S., and Zak, E.: The HITRAN 2016 molecu-
  J., Peuch, V.-H., Radnoti, G., and Ribas, R.: Systematic detection        lar spectroscopic database, J. Quant. Spectrosc. Ra., 203, 3–69,
  of local CH4 emissions anomalies combining satellite measure-             https://doi.org/10.1016/j.jqsrt.2017.06.038, 2017.
  ments and high-resolution forecasts, Atmos. Chem. Phys. Dis-

https://doi.org/10.5194/amt-14-665-2021                                                         Atmos. Meas. Tech., 14, 665–684, 2021
You can also read