Creating a Map of the Social Functions of Urban Green Spaces in a City with Poor Availability of Spatial Data: A Sociotope for Lodz - MDPI
←
→
Page content transcription
If your browser does not render page correctly, please read the page content below
land
Article
Creating a Map of the Social Functions of Urban
Green Spaces in a City with Poor Availability of
Spatial Data: A Sociotope for Lodz
Edyta Łaszkiewicz * , Piotr Czembrowski and Jakub Kronenberg
 Social-Ecological Systems Analysis Lab, Department of Regional Economics and Environment, Faculty of
 Economics and Sociology, University of Lodz, 90-237 Lodz, Poland; piotr.czembrowski@uni.lodz.pl (P.C.);
 jakub.kronenberg@uni.lodz.pl (J.K.)
 * Correspondence: edyta.laszkiewicz@uni.lodz.pl

 Received: 15 April 2020; Accepted: 1 June 2020; Published: 2 June 2020

 Abstract: Many cities lack complex spatial databases that can answer the question “What does a given
 green space offer?” This complicates the lives of inhabitants, planners, and local authorities. One of
 the ways to obtain a complex picture of urban green spaces is to link multiple data sources. This article
 presents such an attempt to link multiple data sources to obtain a map of the social functions of urban
 green spaces in a city without a comprehensive spatial database on urban green spaces. We do so by
 adapting a method of mapping the social functions of urban green spaces—sociotope mapping—to
 the Central-Eastern European city of Lodz (Poland). Our results feature a map of the main social
 functions of urban green spaces (divided into five categories: nature, physical activity, social, play, and
 aesthetics) and GIS databases, with spatially explicit information on the 48 attributes of 196 urban green
 spaces in Lodz. According to our results, the greatest effort in sociotope mapping involves collecting
 data from different sources as it requires collaborating with various stakeholders—the owners of
 the data. Our study fits into the general trend of linking official data from municipal records with
 additional data on inhabitants’ preferences for urban green space planning and management.

 Keywords: GIS; spatial databases; sociotope mapping; green space management; urban planning

1. Introduction
     Where is the nearest playground to where I live? Do people in this particular district have enough
green spaces that cater to the needs of dog walkers? These and other questions are often asked by
urban inhabitants and decision-makers alike. There is a growing need to provide access to the in-depth
spatial data on urban green spaces, which could support decisions made by urban planners [1,2]
and assist urban inhabitants in their recreational activities [3]. Meanwhile, in spite of the increasing
availability of various data sources on green space coverage—often free of charge—both processed
(such as Urban Atlas) and unprocessed (such as remote sensing images from Landsat or Sentinel),
we can still observe several obstacles in the practical use of these data. None of them, used as a single
data source, can guarantee a complex picture of urban green spaces [1]. In addition, these databases
do not offer any supporting information on urban green space features, such as their social functions,
which are important from the perspective of potential green space users.
     The lack of one spatial database, which could inform, “what does a given green space offer/what
is there?” has several consequences for everyone: the inhabitants, the planners, and the authorities.
When it comes to the potential users of green spaces, scarce and dispersed information may affect their
willingness to use these places for recreational purposes and decrease the perceived attractiveness of
certain green spaces. Therefore, easy and free access to comprehensive information about the social

Land 2020, 9, 183; doi:10.3390/land9060183                                         www.mdpi.com/journal/land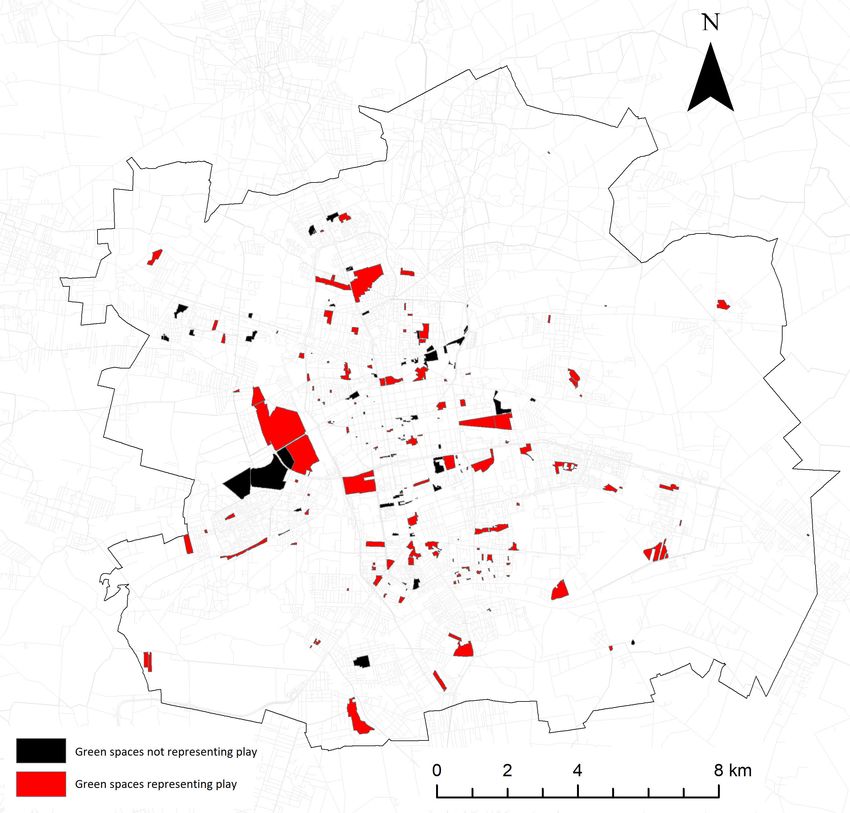
Land 2020, 9, 183                                                                                   2 of 24

functions of urban green spaces is as important for encouraging people to use green spaces as their
physical or psychological accessibility [3].
      From the perspective of planners and authorities, a spatial database which combines all of the
information about urban green space functions could support the planning and management of urban
green spaces to respond better to the users’ needs, and ensure equitable access to urban ecosystem
services and green space amenities and facilities [4,5]. Additionally, it could facilitate communication
between city authorities and inhabitants, and between different units within local administrations.
Among other things, by using such a database, the authorities could inform inhabitants about activities
planned in the green spaces. Furthermore, this database could improve the exchange of information
and further strengthen cross-sectoral collaboration and even cooperation within the same institution
responsible for urban green space management [6–8]. This is because different people would use the
same inventory, offering a clear view of who has already done what within a given space (assuming
a clear division of responsibilities for different aspects of urban green space management), or at
least providing information on what is there (or in the case of the unclear division of responsibilities,
indicating the need to coordinate activities with other actors that would potentially need to be
identified).
      In response to the above, more recently, the emphasis has been on combining different data
sources to obtain a complex picture of urban green spaces, including volunteered geographic
information such as OpenStreetMap or social media data [9–11] and data collected using the public
participation GIS approach [12,13]. As was recently demonstrated, the use of multiple data sources
may improve the mapping of urban green spaces [1,14] and support urban green space classification
and management [15–17]. Linking different data sources into one complex spatial database that
covers different types of urban green spaces should go beyond the basic information on the spatial
distribution of green spaces and towards the exact location of their diverse biotic, abiotic, and man-made
components. This would further support an understanding of the spatial distribution of the social
functions and recreational values of urban green spaces. Indeed, such a combination of different sources
of information has been followed in the case of new applications of public participation GIS [18].
      When it comes to mapping the social/recreational functions of urban green spaces in a city,
otherwise characterised by a poor availability of data, one way to demonstrate the usefulness of using
multiple data sources regarding urban green space features is through the application of different
mapping methods. Our article presents an attempt to link multiple data sources to obtain a map of
the social functions of urban green spaces in a local context. We did so by adapting and applying
a method of mapping the social functions of urban green spaces—sociotope mapping [19]—to the
Central-Eastern European city of Lodz (Poland), which is characterised by scattered and fragmented
data on urban green spaces, and so far has lacked a comprehensive spatial database on the social
functions of these spaces. In particular, we created a map of the social functions of parks and green
squares in Lodz and, based on the process of building this map, we discuss how a sociotope map can
benefit from linking multiple data sources, and in what way it provides a particularly comprehensive
picture of urban green spaces.
      The rest of the paper is organised as follows: Section 2 contains an overview of the methods
used for mapping the social/recreational functions of urban green spaces, with a focus on combining
different data sources; in Section 3, we introduce sociotope mapping, starting with its origins, through
the first application in Stockholm, and ending with how we adapted it in the case of Lodz; Section 4
describes the procedure of data collection and processing; in Section 5 we present the map of the
social functions of parks and green squares in Lodz; in Section 6, we discuss our findings from the
perspective of increasing the availability of data on urban green spaces in Lodz and, more generally,
linking multiple data sources for an enhanced picture of urban green spaces to support urban planning
and management; Section 7 concludes.
Land 2020, 9, 183                                                                                    3 of 24

2. Methods of Mapping the Social Functions of Urban Green Spaces
      Over the past 30 years, describing urban green spaces from the perspective of their recreational or
social functions has gained popularity among researchers and urban planners, especially in the Nordic
countries [20]. Therefore, several methods for mapping these functions have been proposed and
implemented, such as park character analysis [21], mapping positive recreational experiences in urban
green spaces (REC-mapping [22], social value mapping [23], or sociotope mapping [19], to mention
just a few). However, they all differ in their definition of ‘social/recreational function’, which further
affects the mapping procedure, including the data collection and the usefulness of the map for urban
planners and citizens.
      Some of these methods, such as REC-mapping or social value mapping, refer to the perception
of recreational experience in urban green spaces expressed by the city’s inhabitants. In these cases,
the necessary data come from GIS surveys and self-reported information on the presence and strength of
recreational experiences regarding selected green spaces or parts of them. These potential experiences
may be pre-grouped into general items, as in the REC-mapping [22] or described using the respondents’
own language, as can be done in softGIS [12]. Although these methods can be used to map what
is really important for green space users, they do not necessarily provide reliable or comprehensive
answers regarding the amenities and functions present in the given green spaces. Besides, they require
complex programming and typically involve problems with recruiting statistically representative
samples of respondents.
      Other methods, such as sociotope mapping or the relative importance score for structural elements
of urban green spaces [24], combine users’ perceptions/evaluations with multiple sources of secondary
data on urban green space attributes/characteristics. The latter may be chosen based on spatial data
availability and by the importance of the social/recreational function derived from the literature or
elicited from experts [19,24]. For example, the relative importance score measure, applied to 547 green
space polygons in Oslo, was based on 30 different attributes of green spaces, which represented biotic,
abiotic, and man-made elements that appear in a given green space [24].
      Combining information on the physical attributes of a green space from secondary spatial databases
with users’ perceptions has advantages, regardless of the mapping method [25]. The users’ perceptions
may be used to evaluate the importance of the known attributes of green spaces. For example,
the relative importance score involves assessing 30 preselected green space features [24]. Alternatively,
such as in sociotope mapping [19], information elicited from users may be used to extend the list of green
space attributes. Linking these data sources makes it possible to capture several green space features
that determine the social functions of these spaces, but which cannot be easily captured by secondary
data (in some cases, they cannot even be imagined by green space planners). Such examples include
the uniqueness of a green space, the feeling of silence, the possibility of watching birds, or even the
best spots to fly drones. For many users, these features are no less important than physical equipment
when it comes to creating the social functions of green spaces. After all, the users’ perceptions are one
of the key filters which mediate the flow of benefits from urban ecosystems, along with the relevant
infrastructure and institutions [26].
      Finally, urban green space attractiveness is perhaps most typically assessed based on composite
indicators or systems of indicators that are completely based on expert assessments (e.g., ParkIndex
measures factors, ranging from how to get to a park, its equipment, and appearance, to factors that
negatively affect the perception of a given green space and its surroundings [27]). In Lodz, all parks
and green squares were recently mapped from the perspective of barriers limiting their availability,
accessibility, and attractiveness [4]. In the case of attractiveness, the focus was on expert-defined
aspects, such as the existence of park infrastructure, leisure equipment, water, loud and crowded
outdoor events, transportation noise, air pollution, the share of paved area, and the size of a given park.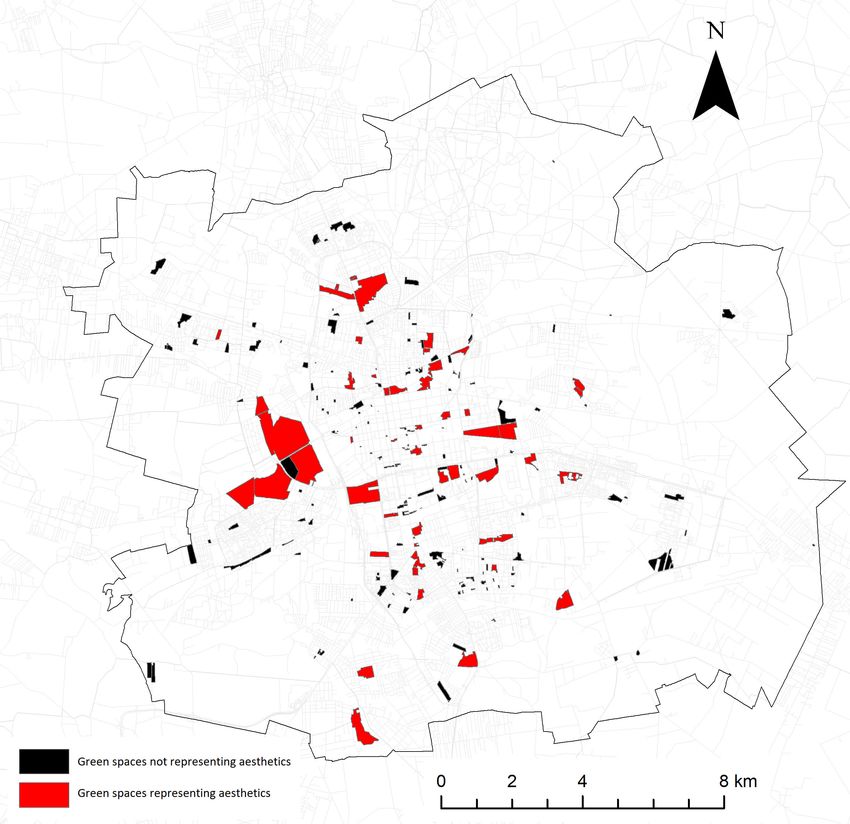
Land 2020, 9, 183                                                                                    4 of 24

3. Sociotope Mapping
     The “sociotope” concept was proposed by Alexander Ståhle and Anders Sandberg at the Stockholm
City Urban Planning Administration in 2000. It was meant as an extension of the previously
created “biotope” map, which focused on the ecological characteristics of public spaces, to cover
human-related issues. While a biotope is “a small area with uniform biological conditions such as
climate, soil or altitude” [28], a sociotope is understood as a space that is uniform in its use values and
social meanings to a specific culture or group, such as a city’s inhabitants. In particular, “sociotope”
refers to the value of open space in the context of urban planning, assessment, and decision-making [19].
     The first sociotope map of the social functions (or “use values” and “use value concepts”, as referred
to by the authors [19]) of open spaces in Stockholm was completed in 2002. Since then, the sociotope
map for Stockholm has evolved and has been updated twice, in 2009 and 2014. In particular, the list of
“use value concepts” and the number of open spaces evaluated in every subsequent sociotope mapping
was extended. In addition, since the initial work of Ståhle and Sandberg, other Swedish municipalities
have conducted sociotope mapping (e.g., Gothenburg [29], Östervåla [30], and Kungsbacka [31]).
Our study is based on the sociotope mapping procedure used in Stockholm and adapted to the local
conditions in Lodz.
     The sociotope was initially developed as a tool to inform urban densification projects. Nevertheless,
it gained broader popularity and became a common concept among Swedish urban planners who
started to use sociotopes to increase their knowledge of the social functions of urban landscapes and
to create guidelines for open space planning. For example, the sociotope mapping of the Annedal
brownfield in Stockholm enabled urban planners to uncover social values, such as spaces for picnics
and soccer, which were desired by the inhabitants living close to Annedal but which were missing [19].

3.1. Sociotope Mapping in Stockholm
     Sociotope mapping in Stockholm was described in detail in the Sociotope Handbook [32]. The map
was created in five steps and involved different stakeholders, such as the local authorities, researchers,
and inhabitants. The procedure started by defining the spaces for which the social functions were to be
investigated, followed by an evaluation of the listed spaces by local experts (e.g., landscape architects),
then by the inhabitants, and ending with a synthesis of all the collected data and the creation of a
GIS-based map featuring the social functions of these spaces.
     In Stockholm, the map was created for every publicly accessible open space larger than 0.5 ha,
the majority of which were green areas. These included parks and green natural areas and playgrounds,
sports fields, etc. They were named and geographically located using existing spatial databases.
The most recent 2014 map covered 1377 publicly accessible open spaces.
     Each open space was assessed by the municipality’s experts, including landscape architects, park
historians, and the city’s ecologists. These experts used multidimensional protocols based on scientific
research and professional experience, along with their own observation of the spaces [19]. Furthermore,
the social functions of open spaces were assessed by their users with the use of surveys, focus groups,
and in-depth interviews. In particular, the inhabitants were asked to mark their favourite open spaces
and assess their quality, accessibility, and potential deficiencies [32].
     In the next step, all of the information collected from the experts and inhabitants was synthesised
and compiled into a number of discrete “use value concepts” (20 in the first sociotope map, and 30
in 2014). The use value concepts referred to the broadly defined equipment, functions, and perceived
features of open spaces. Examples included the possibility of contact with water, the availability of
playgrounds or picnic areas, and the occurrence of events and they were further classified into six main
categories: aesthetics, nature, physical activity, play, social, and water.
     The last step of the sociotope mapping was to create a GIS-based map of the use values of
open spaces, and it was possible to assign several different functions to each open space. The final
map was published not only in paper format, but also on the administration’s intranet, and as a
web-publication on the internet to ensure easy access to the map for different stakeholders, most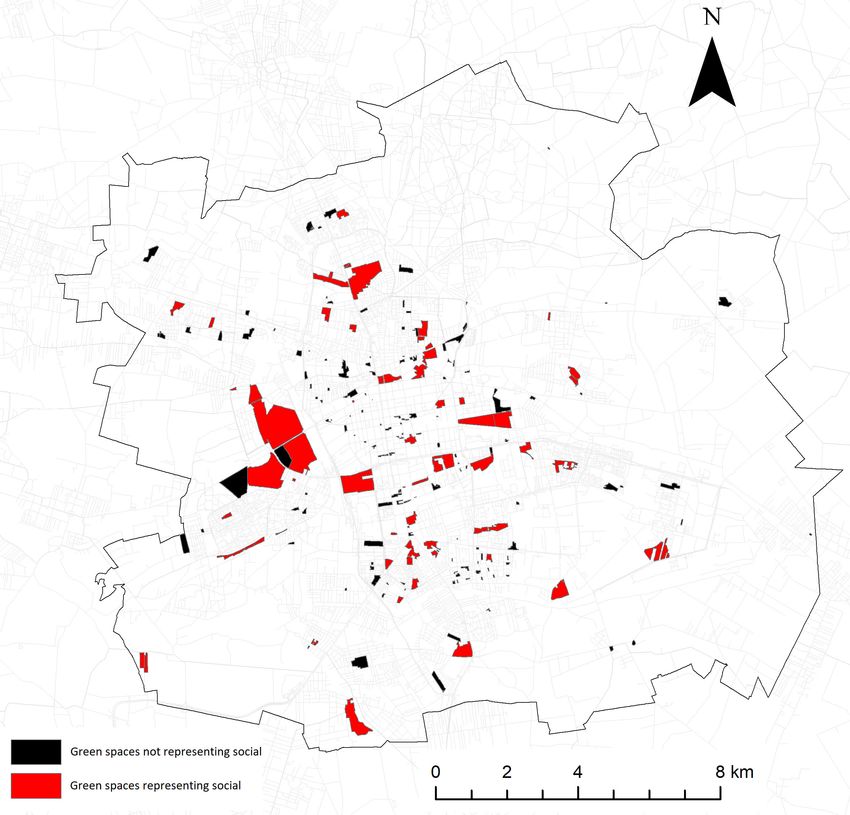
Land 2020, 9, 183                                                                                    5 of 24

notably, the inhabitants [19]. The above procedure ensured that the sociotope became a useful tool that
brought the seemingly qualitative topic of the attractiveness of publicly available open spaces for the
inhabitants to a quantitative format.

3.2. Sociotope Mapping in Lodz
     Our study is highly influenced by the Stockholm sociotope map, although it had to be adapted to
a local context. We followed the five-step procedure used in Stockholm and describe each step in the
following subsections.
     Throughout the project, we collaborated with the local authorities responsible for the maintenance
and management of the green spaces covered by our study. Our collaboration started in June 2018 with
an initial meeting with the Urban Green Space Authority (ZZM). We proposed the idea of creating a
sociotope map for Lodz, and we also discussed its basic tenets. A series of working meetings were
held in autumn 2018, which focused on assessing individual green spaces, and they were followed
by a workshop at the University of Lodz in December 2018, during which we discussed the draft
version of the map with several stakeholders. Finally, in April 2019, there was a consultation of the
pre-final online version of the map. Apart from ZZM, the list of the involved stakeholders included the
Department of Municipal Management (WGK), the Municipal Sports and Recreation Center (MOSiR),
the Municipal Planning Office (MPU), the Department of Revitalization of the City Office, the City
Centre of Geodesy (LOG), and the Department of Project Management of the City Office. This was
related to the complex management structure of urban green spaces in Lodz [7]. Collaborating with
the local authorities was particularly important at the stage of the expert evaluation of urban green
spaces, as described in Section 3.2.2.

3.2.1. Definition of Green Spaces to Be Investigated
     Similar to the Stockholm sociotope map, we started by defining and listing the objects to be mapped.
We decided to conduct an analysis for all of the formal green spaces managed by the city, such as parks,
green squares, and recreational sites, with no limitation regarding their size. The initial list of formal
green spaces was verified during the workshop in December 2018 and supplemented based on the
suggestions of the workshop participants (in particular, we extended the list of green spaces by adding
recreational sites). In the face of inadequate green space data in Lodz, to obtain the boundaries of these
green spaces, we had to combine multiple spatial databases, as described in Section 4.1.

3.2.2. Expert Evaluation
      We used scientific and expert knowledge to adapt the list of 30 “use value concepts” from the
Stockholm sociotope map to the local context. Instead of “use value concepts”, we prefer to refer
to them as “attributes”, a term that better serves the purpose of describing green spaces and their
social functions.
      In collaboration with the abovementioned local stakeholders, in particular during the direct
meetings with the representatives of the relevant authorities responsible for the different green spaces,
we verified the relevance of each green space attribute used in Stockholm and adapted it to the
local context. In addition, after obtaining the initial sociotope map for Lodz, the respective stakeholders
were asked for feedback regarding the assessment of the green space attributes. Their suggestions
were used to improve the sociotope map, which was sent back to the officials who took an active part
in its creation for verification. Their feedback informed the final corrections before the map was made
publicly available.
      Based on such a collaborative process, we decided to omit those attributes from Stockholm which
were unique to Swedish culture and were not relevant to the green spaces in Lodz (e.g., folklife,
outdoors markets, or cultivation). In addition, we decided to limit the number of aggregated categories
to five: aesthetics, nature, physical activity, play, and social, omitting water. While water is abundant
in Stockholm, the same cannot be said about Lodz. Although its name (“boat”) harks back to the days
Land 2020, 9, 183 6 of 24
when numerous small rivers allowed its textile industry to flourish in the 19th century [33], nowadays,
there are very few water bodies which can be used for recreational purposes.
Our expert assessment resulted in 28 new attributes being added to the list used in Stockholm,
which were important to reflect the social functions of the green spaces in Lodz. These 28 attributes
included elements of infrastructure, such as amphitheatres, fountains, ping pong tables, chess tables,
and sculptures, as well as the characteristics of green spaces identified by the inhabitants of Lodz:
silence, wildness, spaciousness, and uniqueness, as described in the following subsection. The full list
of the 48 attributes (20 taken from the Stockholm study and 28 city-specific) can be found in Table 1.
Table 1. The sociotope attributes in Lodz.
No Category Attribute Data Format Data Source
1 Aesthetics Archaeological objects Spatial point NID
2 Aesthetics Flowerbeds Spatial point ZZM
3 Aesthetics Fountains Spatial point ZZM
Historic architectural objects
(sculptures, villas, monuments,
4 Aesthetics Spatial point NID
remains of cemeteries, workers’
settlements, factories, etc.)
5 Aesthetics Sculptures, monuments Spatial point ZZM
Attribute of the
6 Aesthetics Silence softGIS
polygon
Attribute of the
7 Aesthetics Spaciousness, open space softGIS
polygon
Attribute of the
8 Aesthetics Interesting topographic features softGIS
polygon
Attribute of the
9 Aesthetics Uniqueness softGIS
polygon
Attribute of the
10 Aesthetics View, landscape softGIS
polygon
11 Aesthetics Water Spatial point ZZM, MOSiR
Attribute of the
12 Nature Animals softGIS
polygon
Attribute of the
13 Nature Greenness softGIS
polygon
14 Nature Nature monuments Spatial point MPU
Attribute of the
15 Nature Sounds of nature softGIS
polygon
Attribute of the
16 Nature Wildness softGIS
polygon
Other unique objects (e.g., single
17 Other places to play table football and Spatial point ZZM, WGK
pétanque)
Physical Fenomen
18 Bicycle stands Spatial point
activity foundation
Physical Stations of the public bicycle Fenomen
19 Spatial point
activity scheme foundation
Physical
20 Bicycle paths Spatial polyline LOG
activity
Physical
21 Ice rinks Spatial point MOSiR
activity
Physical
22 Indoor pools Spatial point MOSiR
activityLand 2020, 9, 183 7 of 24
Table 1. Cont.
No Category Attribute Data Format Data Source
Physical ZZM, MOSiR,
23 Outdoor gyms Spatial point
activity WGK
Physical
24 Paths for runners Spatial polyline ZZM
activity
Physical ZZM, MOSiR,
25 Table tennis tables Spatial point
activity WGK
Physical Sports fields (football, basketball, ZZM, MOSiR,
26 Spatial point
activity volleyball, etc.), tennis courts WGK
Physical
27 Routes for cross-country skiing Spatial polyline ZZM
activity
Physical Attribute of the
28 Sports events Zielona Łódź
activity polygon
Physical Water equipment rental (pedalos,
29 Spatial point MOSiR
activity kayaks, etc.)
Amusement parks (recreation
30 Play Spatial point ZZM, MOSiR
areas)
Natural playgrounds (including
31 Play rope courses, parks with wooden Spatial point ZZM, MOSiR
infrastructure, etc.)
32 Play Outdoor swimming Spatial point MOSiR
ZZM, MOSiR,
33 Play Playgrounds for children Spatial point
WGK
34 Play Pump tracks Spatial point MOSiR
35 Play Skateparks Spatial point MOSiR, WGK
Sledging infrastructure (e.g., ZZM, MOSiR,
36 Play Spatial point
artificial hills) WGK
The possibility of practising water
37 Play Spatial point MOSiR
sports
Amphitheatres, bowers, art
38 Social Spatial point ZZM
galleries
39 Social BBQ spots Spatial point ZZM, MOSiR
Cafes, other catering facilities
40 Social Spatial point ZZM, MOSiR
(all-year-round)
41 Social Baby changing facilities Spatial point ZZM
ZZM, MOSiR,
42 Social Chess tables Spatial point
WGK
Attribute of the
43 Social Dog-friendliness softGIS
polygon
Entertainment events, concerts, Attribute of the
44 Social Zielona Łódź
etc. polygon
45 Social Graduation towers Spatial point ZZM
Mobile gastronomy (e.g., food
46 Social Spatial point ZZM, MOSiR
trucks, coffee bikes)
Paths for night walks (equipped
47 Social Spatial point GESUT
with lamp posts)
48 Social Toilets Spatial point ZZM, MOSiR
3.2.3. Evaluation by Society
As an equivalent of the user evaluation performed in Stockholm, information on the additional
attributes was derived from the public participation GIS study—the “Licz na zieleń” Internet-based
softGIS questionnaire. The study was conducted by the Sendzimir Foundation in 2014. In this study,Land 2020, 9, 183 8 of 24
1640 respondents from three large Polish cities (including 418 from Lodz) marked the green spaces
which they considered particularly valuable on the respective maps of their cities. They were also
asked to explain their assessments [12]. The verbal responses were then coded and aggregated into 21
categories from which we chose 10 to represent the different relevant attributes, as shown in Table 1.
3.2.4. Synthesis
The evaluations by the experts and the members of the public resulted in GIS-based files in
three data formats: spatial points, spatial polylines, and attributes of polygons. The first two data
formats indicate the exact spatial location of selected sociotope attributes within a given green space
polygon, and they typically represent amenities and facilities, such as infrastructure or equipment.
Polygon attributes characterise the whole green space rather than a specific location within it.
Information gathered in these three data formats was synthesised in two ways. First, to create the
GIS-based map, as detailed in Section 3.2.5 and Section 4.5, we acknowledged the different characteristics
of the sociotope attributes and adjusted how they are represented on the map accordingly. The sociotope
attributes (e.g., outdoor gyms or table tennis tables) for which the direct spatial location within green
spaces could be indicated were presented in this way. Other sociotope attributes, such as greenness
or uniqueness, were presented as general features of a whole green space. Second, to synthesise the
results, we prepared a list of all parks, green squares, and recreational sites, indicating whether each of
them could be characterised by a given sociotope attribute. As a result, we obtained a database with
the full list of 196 green spaces, each of them with “yes”/”no” assignation to all 48 sociotope attributes.
These databases were used to create the sociotope map for Lodz. Based on our knowledge,
we assigned each sociotope attribute to one of the five main sociotope categories: aesthetics, nature,
physical activity, play, and social, as shown in Table 1. Then, we assigned the urban green spaces to the
abovementioned sociotope categories, based on the number of sociotope attributes which belonged
to a given category and which appeared in a given urban green space. The number of sociotope
attributes necessary for a given urban green space to represent aesthetics, nature, physical activity, play,
or social was established independently for each of these categories, and it depended on the number of
sociotope attributes in each category, as detailed in Section 4.4.
3.2.5. Creation of a GIS-Based Map
The next step of the sociotope mapping in Lodz was to create a GIS-based map of the social
functions of green spaces. The map was a working document, and it was instantly updated during the
meetings with the respective stakeholders. Within the iterative process described above, we collected
feedback from the stakeholders and finally delivered the complete map to the City Centre of Geodesy
to make it publicly available. As part of our discussions with the local stakeholders, we also covered
the potential for the dissemination of the map among the city’s inhabitants and local authorities, and its
broader usefulness in urban planning.
4. Data Collection and Processing
4.1. Green Space Boundaries
The City Office of Lodz lacks a central database of green spaces. The data are likely to differ
among the different sources, even when they pertain to the same categories of green spaces and the
basic issues of their boundaries. The different institutions keep the data for their own purposes only,
which reflects a broader problem of poor collaboration between the different actors involved in urban
green space management in Lodz [7].
Therefore, the initial phase of data collection was to obtain a complete list of parks, green
squares, and recreational sites with their boundaries in the GIS format. For this purpose, we took
the boundaries of 115 formal green spaces, such as parks and green squares, provided by MPU and
LOG. The boundaries of recreational sites were not included in the data from MPU or LOG, norLand 2020, 9, 183 9 of 24
any other available data source. Therefore, with the collaboration of the WGK—the city’s authority
responsible for managing the recreational sites in Lodz—we drew the polygons of the respective 81
recreational sites. The sociotope map for Lodz covers 196 green spaces.
4.2. Green Space Attributes—Expert Evaluation
The collection of data on green space attributes involved several challenges as well. The main challenge
was to identify and combine scattered and fragmented information from multiple sources. As indicated
above, in Lodz, there is no single organisation responsible for the maintenance of all formal green spaces
and no comprehensive spatial database of the social functions of urban green spaces. The parks and green
squares are managed by ZZM, while most small recreational sites are managed by WGK. In addition,
some other sites equipped with recreational and sports infrastructure are managed by MOSiR.
The data gathered from these units were mostly not georeferenced and not digitised. Therefore,
obtaining information on selected attributes, such as elements of park infrastructure, was connected
with digitising and geocoding the data. Furthermore, the institutions responsible for the management
of a certain green space category did not have information regarding all of the predefined attributes.
This required the involvement of other institutions which offered access to data on the missing attributes,
such as LOG and the National Institute of Heritage (NID).
We collected the geographic data from ZZM on 20 attributes for 115 parks, as shown in Table 1.
This mainly included information on recreational and sports infrastructure, such as routes for
cross-country skiing or outdoor gyms. As the data were not stored in an electronic format, they had to
be collected through interviews with separate officials responsible for the different parks. This resulted
in a GIS-based map with the exact spatial location of the selected social functions in the form of spatial
points and polylines within green space polygons.
ZZM also provided us with information on the cultural and sports events that take place in
parks and green squares. This information came from the project “Green Łódź” (“Zielona Łódź”),
developed within the ZZM and aimed at animating the social aspect of green spaces. We obtained
the list of cultural and sports events, such as family picnics, photographic workshops, and botanical
or historical walks, which had taken place in green spaces between 2013 and 2017. Most of them
were organised only once, while others were organised systematically but in a different green space
each year. In our map, we only indicated those events which reoccurred in a given space over time with
some regularity—at least once a year for at least three consecutive years. We assigned this information
to the seven respective green spaces in the form of the attributes of the polygons.
The information on the attributes of 81 recreational sites was mainly provided by WGK. The small
recreational sites were mainly equipped with playgrounds, but some of them also had chess and table
tennis tables or outdoor gyms. In addition, WGK provided information on the toilets in all formal
green spaces. All of the data from WGK required digitisation and geocoding.
Additional information was obtained during interviews conducted with representatives
from MOSiR. They provided us with information about sports equipment in additional recreational
sites, including pump tracks and the possibility to rent water equipment such as pedalos and kayaks.
As with the information gathered from ZZM and WGK, we had to digitise and geocode the data to
obtain a GIS-based map with these attributes.
We linked the abovementioned data with those obtained from LOG and NID. Although these
institutions are not responsible for green space management, they manage the data on
additional attributes. In particular, LOG provided us with shapefiles of bicycle infrastructure:
bicycle paths, bicycle stands, and the stations of the public bicycle scheme. These data were generated
by the Fenomen Foundation. Additionally, LOG provided us with the locations of lamp posts,
which allow for evening walks, which are part of the GESUT database (Geodetic Records of the Terrain
Armaments Network), maintained at the national level by the Head Office of Geodesy and Cartography.
NID provided shapefiles with registered monuments and archaeological sites. The locations of natural
monuments were provided by MPU.Land 2020, 9, 183 10 of 24
4.3. Green Space Attributes—Evaluation by Members of the Public
In the “Licz na zieleń” softGIS survey, 418 respondents from Lodz marked 399 spots in 51 green
spaces considered in our database (many other spots fell outside of formal green spaces). These marks
represented the places which, in the respondents’ opinions, were characterised by silence, interesting
topographic features, etc. The markings were unevenly distributed—two-thirds of them were located
in 10 large parks, while the number of marks in the other parks was limited. The uneven distribution of
marks might have resulted in the under-representation of some green spaces in terms of a given attribute.
To avoid a given attribute appearing only in a few well-known green spaces characterised by a high
number of markings in general, we decided to credit attributes to green spaces where at least one
marking was made related to a given softGIS attribute. We put this information on the map in the
form of the attributes of green space polygons.
4.4. Synthesis
Spatial data on sociotope attributes were synthesised in two ways, detailed in Section 3.2.4. We stored
the sociotope attributes in the GIS-based data format separately for parks and green squares and
recreational sites, divided into spatial points, polylines, and attributes of polygons. To avoid a high
number of GIS-based files with scattered information, we allowed all sociotope attributes that represented
one main sociotope category, as shown in Table 2, to be stored in one GIS-based file. The files synthesised
in this way are available as Supplementary Material accompanying the present article.
Table 2. The synthesis of sociotope attributes for urban green spaces in Lodz. Shaded cells represent
the number of sociotope attributes required to assign a given urban green space to a respective main
sociotope category. For example, a green space is assigned to the sociotope category “aesthetics” if
there are two, three, or more (up to eleven) sociotope attributes located within such a green space.
The zero value means there could be the given number of sociotope attributes, but it was not observed
in any green spaces.
Number of Number of Urban Green Spaces with a Given Number of Sociotope Attributes
Sociotope Physical
Attributes Aesthetics Nature Play Social
Activity
12 0
11 0 0 0
10 0 0 0
9 1 1 1
8 4 0 1 0
7 0 0 0 0
6 2 0 3 1
5 5 2 3 3 3
4 9 0 1 7 10
3 7 8 2 12 16
2 16 8 16 25 20
1 22 32 111 83 38
0 130 146 63 61 107
In addition, we synthesised information on the sociotope attributes by assigning them to the main
sociotope categories for each urban green space, respectively. In particular, based on the database
with the binary assignation of each sociotope attribute to each green space (“it is present in this green
space”/”it is not present in this green space”), we calculated the total number of attributes that could
potentially be recorded in a given green space within each of the main sociotope categories. In Table 2,
this is the highest number in the first column that corresponds to the row with a non-missing value for
the respective sociotope category. This number varied from five for the “nature” category to twelve
for the “physical activity”. In addition, we calculated the real number of sociotope attributes located
in each urban green space. In four out of the five main sociotope categories, no urban green spaceLand 2020, 9, 183 11 of 24
was characterised by all sociotope attributes possible in a given main sociotope category. For example,
for the “play” sociotope category, the total potential number of sociotope attributes was eight, but in
reality, the highest number of sociotope attributes assigned to the “play” category in a given green
space was five, and this was observed in three urban green spaces only.
Subsequently, we set the number of attributes necessary to assess each urban green space as
representing a given main sociotope category. For “aesthetics”, “social”, and “physical activity”
(i.e., categories characterised by the highest number of attributes), we classified urban green space as
representing a given sociotope category when at least two different sociotope attributes were located
within this green space, represented by the shaded cells in Table 2. In the case of “nature” and “play”,
the total number of sociotope attributes was lower than for the other sociotope categories. Hence, only
one sociotope attribute was sufficient to characterise a given urban green space as “nature”/”play”.
The results of the abovementioned classification are described in Section 5.
4.5. Creation of a GIS-Based Map
We stored the sociotope attributes in the respective GIS-based files. Those sociotope attributes for
which the exact spatial location within a given urban green space was known (e.g., outdoor gyms or
routes for cross-country skiing) were stored as spatial points and polylines. Other sociotope attributes,
which provided the general characteristics of a given urban green space (e.g., all sociotope attributes
derived from the softGIS survey), were stored as attributes of the respective green space polygons.
The publicly available map of the social functions of parks, green squares, and recreational sites
was published as one of the thematic maps in the official online Land Information System for
Lodz (InterSIT) managed by LOG at: https://mapa.lodz.pl/portal/apps/webappviewer/index.html?id=
944f90f93e354c92ae7f9b1974fbae61.
5. Results Regarding the Social Functions of Urban Green Spaces in Lodz
In this section, we present maps showing the synthesised results for the five main sociotope
categories, shown in Figures 1–5. The detailed map showing each sociotope function is available on the
InterSIT web page indicated in Section 4.5, while the shapefiles with the mapped sociotope attributes
are available as Supplementary Material accompanying the present article.
Figure 1. Urban green spaces in Lodz representing the “aesthetics” sociotope category.Land 2020, 9, 183 12 of 24
Figure 2. Urban green spaces in Lodz representing the “physical activity” sociotope category.
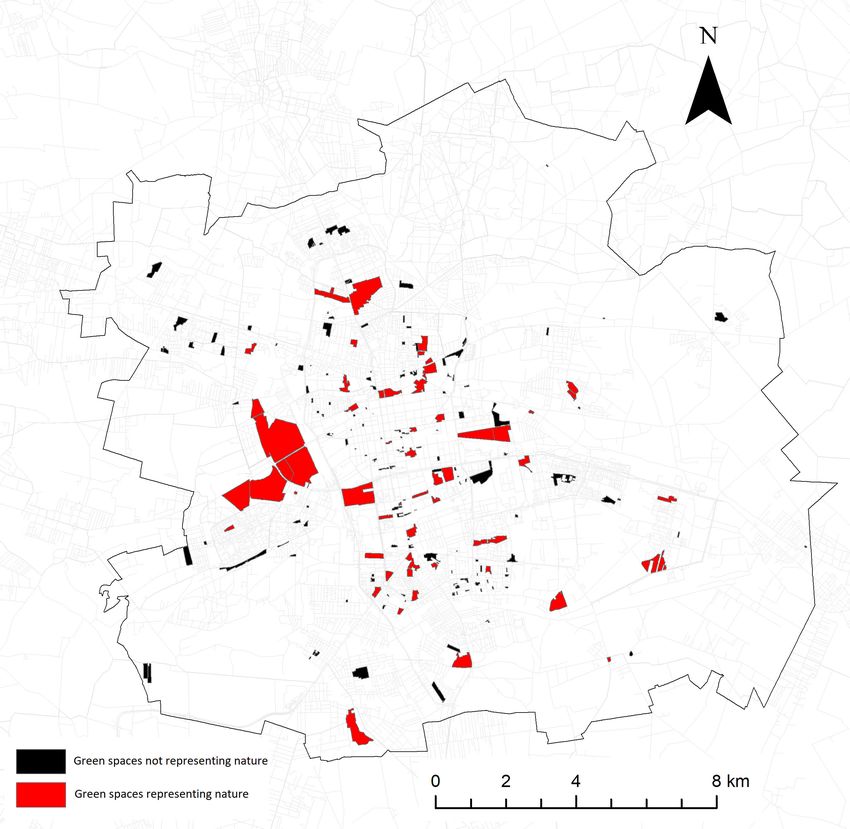
Figure 3. Urban green spaces in Lodz representing the “play” sociotope category.Land 2020, 9, 183 13 of 24
Figure 4. Urban green spaces in Lodz representing the “social” sociotope category.
Figure 5. Urban green spaces in Lodz representing the “nature” sociotope category.
5.1. General Findings
The full list of sociotope attributes with the number of urban green spaces where these attributes
appear can be found in the Appendix A. The parks (along with green squares) and recreational sites
differ in the most frequent sociotope attributes. The parks and green squares are most frequently
equipped with paths for night walks (96 out of 115 parks and green squares), playgrounds forLand 2020, 9, 183 14 of 24
children (50), outdoor gyms (37), flowerbeds (34), toilets (34), chess tables (30), bicycle paths (29),
sculptures and monuments (27), and sports fields (26). Additionally, 38 are characterised by their
greenness. When it comes to recreational sites, playgrounds for children represent the most popular
amenities (75 out of 81 recreational sites), followed by paths for night walks (31). The share of
recreational sites equipped with playgrounds is higher than the analogous share for parks and green
squares because many of them are established specifically to offer this amenity. Conversely, flowerbeds,
toilets, bicycle paths, and sculptures—popular in parks—do not appear in any recreational sites.
We found that 18 sociotope attributes appear in at least 15 parks and green squares, while only
three sociotope attributes are listed in at least 15 recreational sites. This may mean that the size of a
green space is one of the factors which influences the variety of social functions offered by a given
green space. We checked if the area of a park or green square (due to their uniqueness, we eliminated
recreational sites from this test) is correlated with the number of different functions listed in such an
urban green space. Indeed, the Pearson’s correlation equal to 0.3 signifies that the bigger the green
space, the more social functions it offers.
5.2. Maps Showing the Main Sociotope Categories
According to our results, the number of parks and green squares that represent each sociotope
category was similar and varied from 41 for “physical activity” to 57 for “play” (from a total of 115).
The situation differed when it came to recreational sites. None of them represented “aesthetics”, only
three had “social” functions, and two had “nature” functions. From the total of 81 recreational sites,
10 represented “physical activity”, 76 represented “play”, and 2 represented “nature”. Interestingly,
5 recreational sites and 33 parks and green squares could not be assigned to any of the main sociotope
categories as they did not have enough sociotope attributes located in their area. On the other hand,
20 parks and green squares were classified as having all five main sociotope functions, and these were
the largest parks in Lodz.
In Lodz, 44 parks and green squares had at least two attributes belonging to “aesthetics”, hence
they could represent this category, shown in Figure 1. The most popular “aesthetics” attributes were:
flowerbeds, sculptures, monuments, and the feeling of silence. None of the “aesthetics” attributes
appeared in recreational sites.
In Lodz, 41 parks and green squares and 10 recreational sites represented “physical activity”,
with at least two different attributes belonging to this category, shown in Figure 2. The most popular
attributes representing “physical activity” were: outdoor gyms, bicycle paths, sports fields (football,
basketball, volleyball, etc.), as well as tennis courts and table tennis tables.
Although the “play” function was assigned to the highest number of parks and green squares (57
out of 115, and 76 recreational sites out of 81), 111 of them only had one sociotope attribute from this
category, shown in Figure 3. The most common were playgrounds for children (present in 50 parks
and green squares, and 76 recreational sites). Sledging infrastructure (e.g., an artificial hill) was another
popular attribute in this category.
Forty-nine parks and green squares represented the “social” category (with at least two attributes),
as shown in Figure 4, with the following most common attributes: paths for night walks (equipped
with lamp posts) and chess tables. At the opposite end of the scale, only one or two parks were
equipped with graduation towers and baby changing facilities.
Forty-eight parks and green squares and two recreational sites represented “nature”, as shown in
Figure 5. The most frequent attribute was greenness—as assessed by the softGIS respondents—which
was characteristic of 38 urban green spaces. Other attributes, such as wildness or sounds of nature,
characterised only a few parks and green squares (five and three parks, respectively).Land 2020, 9, 183 15 of 24
6. Discussion
6.1. The Usefulness of Sociotope Mapping
Our study fits into the general trend of using multiple sources of data for urban green space planning
and management. Sociotope mapping provides an example of such an approach, which combines
official data from municipal records with additional data on inhabitants’ preferences or social values
attached to urban, green, and public spaces. For our study, we not only combined datasets that
represented these two groups, but we also compiled and digitised a large amount of data which were
previously stored in paper format only. Although the data we collected and digitised pertained to
public spaces, until now, these data were not publicly available. Such information may be useful
for researchers and urban inhabitants, the users of the green spaces we described, but also for urban
planners and the authorities in Lodz. In many countries, and post- socialist countries in particular,
if they do it at all, local authorities in their planning documents set simple targets regarding urban
green space availability, but not necessarily attractiveness [34]. Our dataset (similar to other maps
of the social functions of green spaces in other cities) offers opportunities to manage green space
attractiveness more effectively.
In the present discussion, we refer to how the map and the underlying dataset could potentially
be used in urban green space planning and management, and why it has not been used in real life
(at least as of yet). We also argue that the data we provide offers opportunities for many other uses,
beyond formal applications by the local authorities. The dataset is far more comprehensive than any
other dataset compiled so far for urban green spaces in Lodz, as discussed in the following subsection,
which, at the very least, offers multiple opportunities for use by other researchers, as discussed in
Section 6.3. Nevertheless, let us start with the local authorities.
The dataset could potentially be of use to the local authorities, and indeed they did express
an interest in creating a sociotope map for urban green spaces in Lodz when we approached them.
As discussed in the initial meetings, the map could help to overcome barriers that prevent successful
management, such as insufficient information [1] and the sector silos, or even lack of collaboration
between different actors involved in urban green space management, even within the same units or
institutions [7,8].
However, as time went by, as in the case of many similar endeavours, the initial enthusiasm
seemed to evaporated, and new doubts emerged. One potential problem was that the respective
authorities did not really see how they could use the map. Having a map—and the underlying data
readily available—is one thing, but being able to use it is another. Public authorities in Poland often
lack the technical skills, equipment, or software and management systems that would benefit from
a sociotope map [1]. The employees may even feel comfortable in the existing system, where one
person is responsible for a given park, or at least for a given scope of the park’s social functions,
with all the data safely stored in files kept on shelves rather than in a computer, and with a clear
division of responsibilities and a safe operating space for each individual. The authorities may not
necessarily imagine (or want to imagine) how the goals and duties of their units could be facilitated
by the new dataset and the digital opportunities that it brings about. The above indicates a path
dependence problem. Additionally, to be useful, the dataset needs to be updated, and with dispersed
responsibility for urban green spaces in Lodz, there is no single unit interested in taking on the task of
updating and managing the whole dataset.
The Polish central statistical office—Statistics Poland—collects information on quality of life
indicators, such as “satisfaction with recreational and green spaces”, “exposure to excessive noise
levels”, and “exposure to pollution and other local environmental problems” [35]. These indicators
are based on subjective opinions expressed in pan-European surveys. In our opinion, the responses
to these questions may be partly related to the citizens’ awareness of what green spaces offer; hence,
if the local authorities were to more actively participate in promoting green space use (and shareLand 2020, 9, 183 16 of 24
the information regarding what they offer) among the inhabitants, they could potentially positively
influence such indicators.
Interestingly, in general, green spaces are increasingly used for city branding and other city
marketing purposes, with cities competing against each other for the preferred inhabitants [36].
This trend is also emerging in Poland, and Lodz seems to be one of the leading examples, with a
previous—failed—attempt to obtain the European Green Capital Award [37]. It can currently boast that
it has been chosen to organise the International Horticultural Exhibition 2024, with a focus on “Nature
in the City”. The Exhibition would affect a complex of three neighbouring parks in Lodz, allegedly
increasing these parks’ attractiveness. However, the nearby inhabitants have not been consulted
on the decisions, and it seems that the exhibition would likely to lead to the gentrification of these
parks, by furnishing them with cafes, galleries, and exposition spaces, but not necessarily addressing
other social functions highlighted as relevant in our study. The exhibition could also provide an
excellent opportunity to attract the inhabitants and tourists to other green spaces in Lodz, and our
map—especially if developed into a mobile app and updated—would fit this objective perfectly.
The above example of the Horticultural Exhibition being organised in a complex of three
neighbouring parks in Lodz illustrates another aspect of sociotope mapping. In Stockholm, it was
originally meant to be supplementary to biotope mapping, indicating the dominant ecological
importance of urban green spaces. The exhibition neglects ecological and biological aspects and
entirely focuses on social ones. Our map indicates some ecological functions, but they are necessarily
dwarfed by the social ones, which is as if we had started the whole process of mapping the green
spaces from the reverse. Meanwhile, in general, the ecological functions of green spaces in Lodz
have not attracted enough attention yet, and any attempts to use them for broader purposes, such as
nature-based solutions, seem to have brought little success so far [38,39]. It is absolutely vital to create
a map of the biological and ecological functions of urban green spaces in Lodz and to create an active
system of urban green space management based on a digital green space inventory.
As indicated above, our map and the whole process behind its preparation illustrate broader
challenges related to urban green space management in Lodz, or post-socialist cities in general [40,41].
Additionally, the process of promoting the sociotope map for Lodz illustrates broader challenges
related to the acknowledgement of place values that are revealed through various methods of mapping
the social functions of green spaces in land-use decisions [42]. The key problem seems to be that the
initiative emerged on the part of researchers, and the local authorities seem to have been reluctant to
take the initiative further. In an ideal situation, the authorities would come up with an idea and then
ask researchers and other external experts to support the idea, and not the other way around, as in our
case. In an ideal world, the authorities would actively promote the map and use it for communication
with the inhabitants, while in our case, seven months passed from when the map was available on
the official GIS site of Lodz to it being linked by the Urban Green Space Authority on its website.
The only promotional materials that went out were through our university’s official press releases.
In an ideal world, the authorities should actively use the map, while in our case, the map has not
been used for official purposes in any other form, apart from being posted on the Authority’s website.
Clearly, the authorities responsible for urban green space management have other, more pressing
needs and act on limited budgets, which translates into numerous inefficiencies and institutional
failures [40]. Meanwhile, although we do see the potential use for the map for research purposes,
as explained in Section 6.3, we were also hoping that the authorities would take up this work. Indeed,
multiple examples are available from various cities where different local stakeholders’ inputs are
carefully integrated into local green space planning and management, spanning far beyond the already
highlighted case of Stockholm [43–47].
6.2. Increased Availability of Information on the Attractiveness of Urban Green Spaces in Lodz
Despite the problems discussed above, the largest effort involved in this study (i.e., to collect data
from different sources), would not have been possible without the openness to collaboration on theLand 2020, 9, 183 17 of 24
part of the relevant stakeholders—the owners of the data. The data had not been stored in digital
format and—even within the different organisations—the data had not been stored in a single file.
Quite the opposite; the data had been dispersed, and only the individual employees responsible for the
different aspects of green space management or maintenance kept them in their own paper files. Hence,
what we obtained was a completely new and comprehensive dataset regarding formal urban green
spaces in Lodz, which can be used further in research, planning, communication, and maintenance.
The analysed data indicated the numerous social functions available in formal urban green spaces
in Lodz, many of which seem not to be known to the general public. For the time being, the information
is up-to-date and comprehensive, and it represents a useful update and complement to other sources
of information on formal green spaces in Lodz. Indeed, our study is far more comprehensive than any
study carried out so far in Lodz, in terms of the number of green spaces covered and the breadth of the
functions included.
So far, the attractiveness of urban green spaces in Lodz has been explicitly addressed principally
through the lens of barriers that prevent attractiveness, with a focus on the lack of park infrastructure
or factors such as air pollution and other nuisances [3,4,48]. The attractiveness of urban green spaces
in Lodz was also investigated through the lens of user perceptions with the use of participatory
GIS [12], the results of which, as explained in Section 3.2.3, were partly incorporated into our map
as well. Other relevant publications focused on historical parks in the city centre and investigated
their attractiveness from the point of view of historical and natural features [49–53], or they provided
a broader and yet still selective overview of the parks in Lodz [54] and in the region of Lodz [55].
Most of these studies focused on a historical description of the respective parks, and the historical
and natural monuments which could be found in them. As such, they can serve as good sources of
detailed information for local inhabitants, but they lack a broader overview of the modern functions
of the described parks. Yet other publications focus on the selected features of parks in Lodz, such
as fountains [56,57] or water bodies [58]. These studies necessarily focus on those parks where such
amenities are available. Eventually, one can also find more specific information on urban green spaces
in Lodz in specialised publications, such as a bird atlas that indicates which species of bird nest in
which parks in Lodz [59].
The functions of the 42 parks in Lodz (altogether 54 parks in the whole metropolitan region)
were thoroughly analysed and discussed by Durecka [60], who investigated not only their genesis
and original functions, but also their modern attractiveness based on what they offer. Although the
author inventoried many functions based on publicly available datasets, she only provided descriptive
information and tables; hence, the information remained difficult to access for other researchers.
Durecka’s [60] inventories resulted in park typologies for the Lodz metropolitan region, which included
parks that were divided based on both natural and cultural features. Although our study is more
comprehensive and based on more thorough evidence, it largely confirms the results of the park
comparisons performed by Durecka [60].
The functions offered by parks in Lodz and the inhabitants’ willingness to benefit from them were
also studied by Olbińska [61]. The dominant activities in parks in Lodz, identified by Olbińska [61],
were walking, resting on a bench, walking the dog, observing nature, running, meeting with friends,
riding a bicycle, and playing with children, but our map provides a much more nuanced picture,
which can be useful, in particular, for more specialist users interested in relatively less popular activities.
Olbińska [61] suggested that the lower frequency of practising sports may be related to the lack of
adequate sites and facilities; however, in our opinion, it may result from the lack of information on the
availability of such sites and facilities. This is where our map might prove particularly useful.
6.3. Further Research
We add new geographically explicit information which can be used by urban planners and
inhabitants interested in what parks and other green spaces in Lodz offer in terms of recreational
and cultural potential, but which can also be used in further analyses of urban green spaces in Lodz.You can also read