ScMC learns biological variation through the alignment of multiple single-cell genomics datasets
←
→
Page content transcription
If your browser does not render page correctly, please read the page content below
Zhang and Nie Genome Biology        (2021) 22:10
https://doi.org/10.1186/s13059-020-02238-2

 METHOD                                                                                                                                           Open Access

scMC learns biological variation through
the alignment of multiple single-cell
genomics datasets
Lihua Zhang1,2 and Qing Nie1,2,3*

* Correspondence: qnie@uci.edu
1
 Department of Mathematics,              Abstract
University of California, Irvine, CA
92697, USA                               Distinguishing biological from technical variation is crucial when integrating and
2
 NSF-Simons Center for Multiscale        comparing single-cell genomics datasets across different experiments. Existing
Cell Fate Research, University of        methods lack the capability in explicitly distinguishing these two variations, often
California, Irvine, CA 92697, USA
Full list of author information is       leading to the removal of both variations. Here, we present an integration method
available at the end of the article      scMC to remove the technical variation while preserving the intrinsic biological
                                         variation. scMC learns biological variation via variance analysis to subtract technical
                                         variation inferred in an unsupervised manner. Application of scMC to both simulated
                                         and real datasets from single-cell RNA-seq and ATAC-seq experiments demonstrates
                                         its capability of detecting context-shared and context-specific biological signals via
                                         accurate alignment.
                                         Keywords: Single-cell genomics data, Data integration, Biological variation, Technical
                                         variation, Batch effect removal

                                       Background
                                       The number and the variety of single-cell genomics datasets have grown tremendously
                                       in recent years [1]. Due to rapid technological development, single-cell datasets have
                                       been generated under different experiments and sometimes produced by different
                                       technological platforms. Particularly, an increasing number of single-cell datasets have
                                       been collected under different biological conditions, e.g., control vs. perturbation. Dir-
                                       ect comparisons of those datasets are important for better understanding how distinct
                                       cell states respond to perturbation or disease. However, such integrative comparison
                                       analysis remains challenging due to the inevitable mixture of technical variation (or
                                       batch effects) and biological variation [2–4].
                                         Different batch effect correction or data integration methods have been recently de-
                                       veloped for single-cell RNA sequencing (scRNA-seq) data [5–16]. For example,
                                       mnnCorrect removes batch effects using the Gaussian smoothing of batch vectors,
                                       which are estimated by computing mutual nearest neighbors (MNNs) [6]. LIGER infers
                                       shared and dataset-specific factors based on an integrative non-negative matrix
                                       © The Author(s). 2021 Open Access This article is licensed under a Creative Commons Attribution 4.0 International License, which
                                       permits use, sharing, adaptation, distribution and reproduction in any medium or format, as long as you give appropriate credit to
                                       the original author(s) and the source, provide a link to the Creative Commons licence, and indicate if changes were made. The
                                       images or other third party material in this article are included in the article's Creative Commons licence, unless indicated otherwise
                                       in a credit line to the material. If material is not included in the article's Creative Commons licence and your intended use is not
                                       permitted by statutory regulation or exceeds the permitted use, you will need to obtain permission directly from the copyright
                                       holder. To view a copy of this licence, visit http://creativecommons.org/licenses/by/4.0/. The Creative Commons Public Domain
                                       Dedication waiver (http://creativecommons.org/publicdomain/zero/1.0/) applies to the data made available in this article, unless
                                       otherwise stated in a credit line to the data.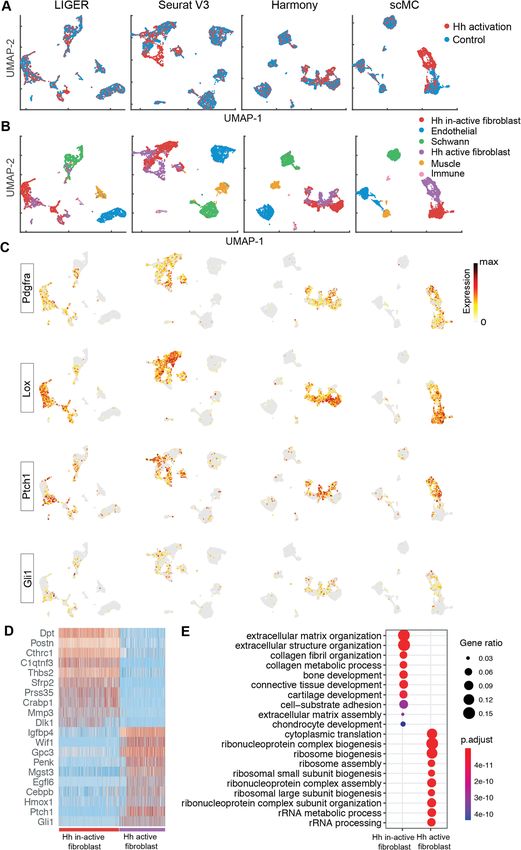
Zhang and Nie Genome Biology    (2021) 22:10                                                                      Page 2 of 28

                factorization method and performs alignment using the shared factors after quantile
                normalization [8]. Seurat V3 uses canonical correlation analysis (CCA) to identify
                shared correlation structures across different datasets [9]. CCA maximizes the correl-
                ation between different datasets after projection, and the aligned basis vectors are ap-
                plied to all datasets to mitigate both technical and biological differences. Harmony
                groups cells into multi-dataset clusters and iteratively learns cell-specific linear correc-
                tion factors, producing a shared embedding in which batch effects are removed [10]. A
                benchmarking study showed that LIGER, Seurat V3, and Harmony perform better than
                other existing methods through comprehensive comparisons among 14 state-of-the-art
                methods [17]. However, recent large-scale benchmarking studies [18, 19] suggested that
                method performance is dependent on the complexity of the integration task and mul-
                tiple batches introduce additional difficulties for those methods that perform well for
                two batches. Moreover, these methods did not explicitly distinguish technical variation
                from biological variation when aligning multiple single-cell datasets, which might miti-
                gate biological variation as well when removing technical variation. In such case, these
                methods might favor the removal of batch effects over conservation of biological vari-
                ation, leading to failure in detecting cell populations that only exist in one biological
                condition.
                  In this study, we introduce a novel single-cell data integration method to match and
                compare (scMC) multiple single-cell genomics datasets. scMC first detects putative cell
                clusters for each dataset separately, then deconvolutes technical and biological variation
                for each pair of cell clusters across any two datasets, and finally learns correction vec-
                tors by using variance analysis to subtract the inferred technical variation. The cor-
                rected data outputted from scMC is a shared reduced dimensional embedding of cells
                that retains biological variation while removing technical variation. This corrected data
                facilitates other major tasks of single-cell analysis such as low-dimensional visualization,
                cell clustering, and pseudotemporal trajectory inference. We compare scMC with three
                data integration methods, including LIGER, Seurat V3, and Harmony, on both simu-
                lated and real datasets from single-cell RNA-seq and ATAC-seq experiments. We dem-
                onstrate the superior performance of scMC, in particular in detecting context-specific
                cellular heterogeneity. scMC is freely available as an R package at the GitHub reposi-
                tory (https://github.com/amsszlh/scMC).

                Results
                Overview of scMC
                scMC takes as input multiple single-cell datasets, which may be single-cell transcrip-
                tomic or epigenomic data from different conditions, individuals, or time points (Fig. 1a).
                scMC first respectively groups cells into putative clusters for each dataset using a Lei-
                den community detection method [20] (Fig. 1b). A consensus strategy is developed to
                assign cells into clusters, to account for the different resolution parameters in the Lei-
                den algorithm (“Methods”). Second, scMC detects confident cells that exhibit high
                similarity with other cells in each cell cluster (Fig. 1b). The cell-cell similarity is quanti-
                fied by the fraction of shared nearest neighbors between a cell and its neighbors, and
                the average similarity associated with each cell is computed (“Methods”). Confident
                cells are defined as the set of cells with its average similarity greater than the third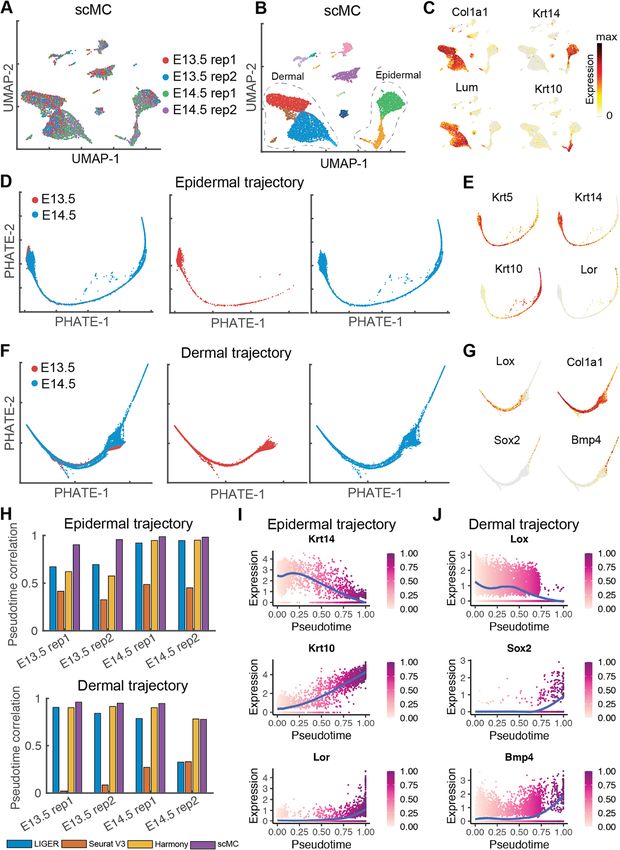
Zhang and Nie Genome Biology (2021) 22:10 Page 3 of 28
Fig. 1 Overview of scMC. a scMC takes multiple single-cell genomics datasets as input. Datasets and cell
types are represented by different shapes and colors, respectively. b scMC identifies putative cell clusters for
each dataset using a Leiden algorithm-based consensus approach and defines a set of confident cells in
each cell cluster, as indicated by the cells inside the dashed lines. c scMC deconvolutes technical variation
by identifying all pairs of shared cell clusters across any two datasets based on their similarity. The
differences between any other pairs of cell clusters are attributed to both technical and biological variation,
as indicated by the dashed lines. d scMC learns a shared embedding of cells by subtracting the inferred
technical variation using variance analysis. In this shared embedding space, cells are grouped by cell types
rather than dataset batches, allowing detection of dataset-shared and dataset-specific biological signals
quantile of average similarities of all cells within each cluster. Third, scMC infers
shared cell clusters between any pair of datasets by learning a weighted complete bi-
partite graph connecting different cell clusters. The edge weight of the graph represents
the similarity between two cell clusters, which is dependent on the similarity of the
transcriptomic or epigenomic profiles and the shared features for the identified
confident cells (“Methods”). A pair of shared cell clusters is then identified if they have
high similarity (“Methods”). Any differences between these shared cell clusters are con-
sidered as technical variation (i.e., batch effects), while differences between any other
pairs of cell clusters are attributed to both technical and biological variation (Fig. 1c).
Fourth, scMC unveils a set of correction vectors by explicitly subtracting the technical
variation using variance analysis for the identified confident cells (“Methods”). Finally, a
corrected data is obtained by projecting the original data onto the learned correction
vectors, in which the biological variation is retained while removing the technical vari-
ation (Fig. 1d). We emphasize that this correction is performed for all cells rather than
confident cells only. This corrected data is a shared embedding of cells from multiple
datasets and can be used for various downstream analysis such as low-dimensional
visualization, cell cluster identification and pseudotemporal trajectory inference.
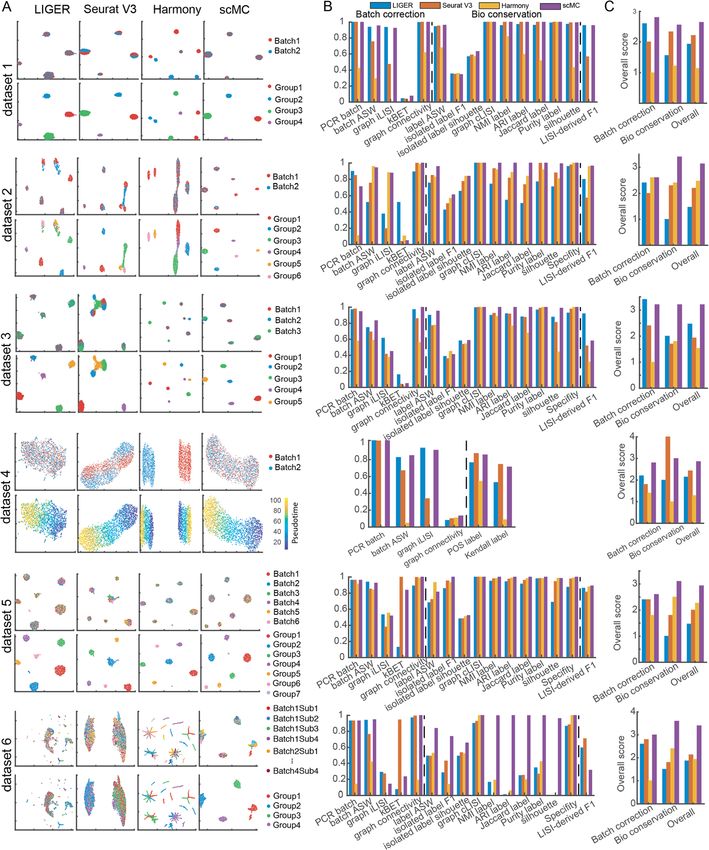
scMC outperforms other state-of-the-art methods under different simulation scenarios
We first benchmark scMC against three other state-of-the-art integration methods, in-
cluding LIGER, Seurat V3, and Harmony, by simulating six single-cell datasets using
Splatter package [21]. Detailed descriptions of the simulated datasets are shown in
Additional file 1. Each dataset is one of the six scenarios with different properties: data-
set 1 contains two batches with the same cell subpopulation compositions; dataset 2
contains two batches with imbalanced cell subpopulation compositions; dataset 3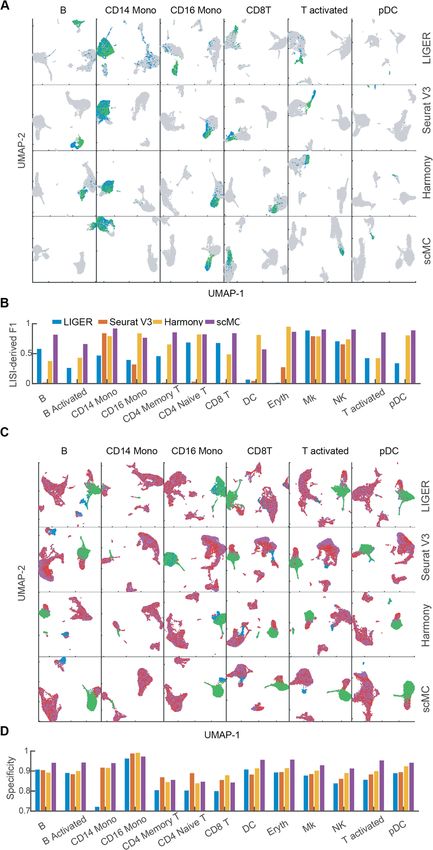
Zhang and Nie Genome Biology    (2021) 22:10                                                                   Page 4 of 28

                contains three batches with imbalanced cell subpopulation compositions; dataset 4 con-
                tains two batches and describes a continuous cell trajectory; dataset 5 and dataset 6 are
                large-scale datasets with tens of thousands of cells across multiple batches: dataset 5
                contains six batches and dataset 6 has high batch complexity with 16 nested sub-
                batches (four sets of four sub-batches).
                  Using 16 evaluation metrics, we evaluated these four methods in terms of their ability
                to remove batch effects while maintaining cell subpopulation separation. Similar to a
                recent benchmarking study [19], these 16 metrics were divided into two categories
                assessing batch effect removal and biological variation conservation respectively
                (“Methods”). Batch effect removal was assessed by 5 metrics, including PCR batch,
                batch ASW, graph iLISI, kBET, and graph connectivity [19]. Biological variation conser-
                vation, which can be captured based on the cell identity labels, was measured via 10
                metrics, including label ASW, isolated label F1, isolated label silhouette, graph cLISI,
                NMI label, ARI label, Jaccard label, Purity label, silhouette score, and specificity score
                [19] (“Methods”). A LISI-derived F1 score was defined to assess both batch effect re-
                moval and biological variation conservation (“Methods”). Moreover, we defined an
                overall accuracy score by averaging the rank of each integration method based on three
                categories of metrics, including batch effect removal metrics, biological conservation
                metrics, and both batch effect removal and biological conservation metrics. A larger
                overall score indicates better performance (“Methods”).
                  On dataset 1 with the same number of cell subpopulations across two batches, both
                Seurat V3 and scMC successfully removed batch effects and separated distinct cell sub-
                populations, as shown in the Uniform Manifold Approximation and Projection
                (UMAP) [22] space and reflected in their relatively high batch removal and biological
                conservation scores (the first row of Fig. 2a–c). However, LIGER showed a mixture of
                cells between different cell subpopulations, leading to lower biological conservation
                scores and Harmony failed to merge different batches, leading to lower batch effect re-
                moval scores. As expected, scMC showed consistently higher biological conservation
                scores as well as the highest overall scores in both batch effect removal and biological
                conservation (the first row of Fig. 2b, c). On dataset 2 with imbalanced cell subpopula-
                tion compositions across two batches, i.e. six subpopulations in batch 1 and four sub-
                populations in batch 2, LIGER and Seurat V3 removed batch effects at the expense of a
                strong loss of biological variation, where they incorrectly aligned the imbalanced cell
                subpopulations (the second row of Fig. 2a), leading to consistently lower biological con-
                servation scores, in particular for the isolated label F1 and Specificity scores (the second
                row of Fig. 2b). In contrast, Harmony and scMC showed a good compromise between
                removal of batch effects and conservation of biological variation, as reflected in their
                moderate batch removal and higher biological conservation scores. Of note, Harmony
                changed the data structure and made the various cell subpopulations more compact
                with some mixed cell labels, leading to lower label ASW, NMI, ARI, Jaccard, and Purity
                scores (the second row of Fig. 2b). Together, scMC has comparable performance with
                some existing methods on the balanced datasets; however, it exhibits superior perform-
                ance on the imbalanced datasets.
                  scMC integrates multiple single-cell datasets independent of the order of input data-
                sets. On dataset 3 with three batches and imbalanced cell subpopulations, i.e., four sub-
                populations in batch 1, five subpopulations in batch 2, and three subpopulations in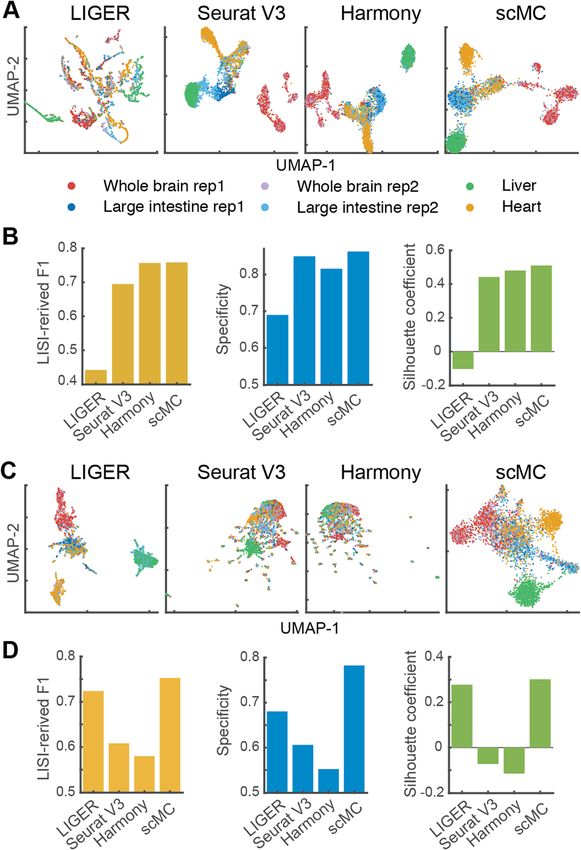
Zhang and Nie Genome Biology      (2021) 22:10                                                                                 Page 5 of 28

                 Fig. 2 Comparisons of scMC against other methods on six simulation scenarios. a UMAP visualization of the
                 corrected data from LIGER, Seurat V3, Harmony, and scMC. For each dataset, cells are colored by batch
                 labels (top row) and gold standard cell labels or pseudotime (bottom row). b Evaluation of integration
                 methods using 16 metrics in two categories for measuring batch effect removal (i.e., Batch correction) and
                 biological variation conservation (i.e., Bio conservation). LISI-derived F1 score is a summarized metric
                 assessing both batch mixing and cell type separation. The consistency between the inferred pseudotime
                 from the corrected data and the gold standard pseudotime is computed using two metrics POS and
                 Kendall rank correlation coefficient. c Comparison of the overall scores among different methods calculated
                 based on batch effect removal metrics, biological variation conservation metrics, and both batch effect
                 removal and biological variation conservation metrics

                batch 3, both Seurat V3 and Harmony partially merged cells from different batches,
                whereas LIGER and scMC succeeded in removing batch effects from all these three
                batches, leading to higher batch removal scores (the third row of Fig. 2a–c). When
                assessing the conservation of cell subpopulations, LIGER showed a mixture of cell la-
                bels, leading to lower subpopulation conservation scores compared to scMC.
                  We also evaluated the conservation of cell trajectory using dataset 4 with two
                batches. In comparison to Seurat V3 and Harmony that either partially merged or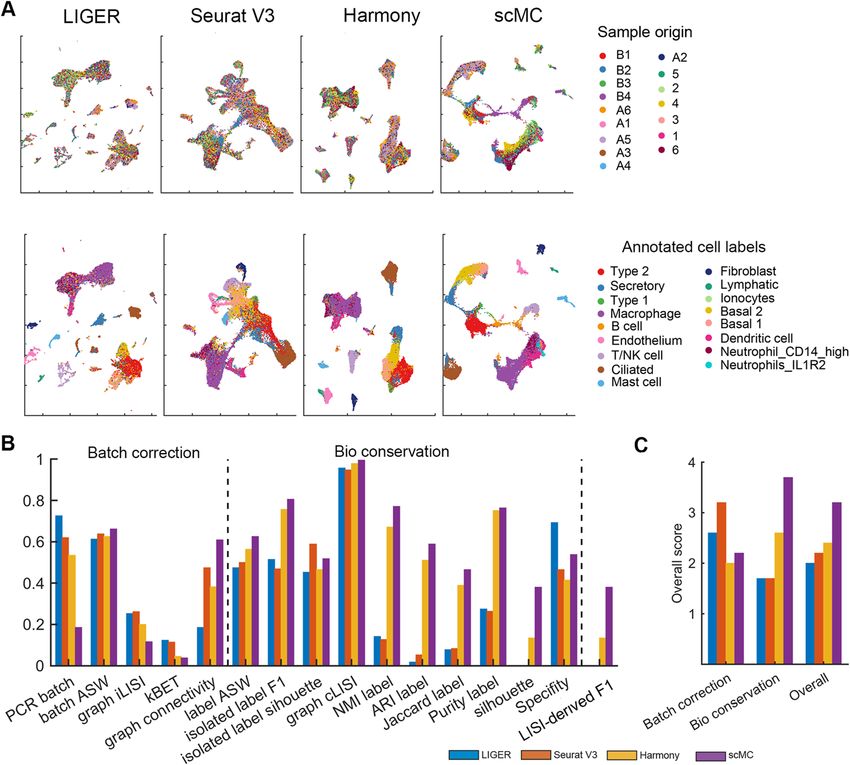
Zhang and Nie Genome Biology   (2021) 22:10                                                                  Page 6 of 28

                completely retained the two batches, LIGER and scMC successfully removed the batch
                effects, leading to higher batch removal scores (the fourth row of Fig. 2a–c). Neverthe-
                less, LIGER lost the trajectory structure and did not correctly reflect the pseudotem-
                poral order of cells (the fourth row of Fig. 2a). This observation was further confirmed
                when we computed the consistency between the pseudotime inferred from the cor-
                rected data and the gold standard pseudotime, which was evaluated by two metrics:
                POS and Kendall rank correlation coefficient (“Methods”, the fourth row of Fig. 2b).
                   To evaluate the ability of dealing with multiple batches in large-scale datasets, we
                tested these methods on simulation datasets 5 and 6. By visually scrutinizing the pro-
                jected cells in the integrated UMAP space, on simulation dataset 5, all integration
                methods including LIGER, Seurat V3, Harmony, and scMC could remove batch effects
                and detect real cell subpopulations. However, scMC exhibits better performance in pre-
                serving cell identity labels than other methods. LIGER, Seurat V3, and Harmony clearly
                misplaced some cells in the integrated UMAP space (the fifth row of Fig. 2a). Quantita-
                tively, comparing to LIGER, Seurat V3, and Harmony, scMC consistently showed
                higher biological conservation scores using various metrics (the fifth row of Fig. 2b)
                and had the highest overall scores in both batch effect removal and biological conserva-
                tion (the fifth row of Fig. 2c). On simulation dataset 6 with complex batch effects in-
                cluding 16 nested sub-batches, LIGER and Seurat V3 removed batch effects but
                showed a complete mixture of cell subpopulations (the sixth row of Fig. 2a), leading to
                higher batch removal scores and lower biological conservation scores (the sixth row of
                Fig. 2b, c). Harmony partially merged different batches and retained biological variation
                with some mixed cell labels (the sixth row of Fig. 2a). Nevertheless, scMC could retain
                cell identify labels while removing batch effects, leading to moderate batch removal
                scores and consistently higher biological conservation scores. Based on the overall
                scores, scMC shows the highest scores in both batch effect removal and biological con-
                servations (the sixth row of Fig. 2c). Together, scMC exhibits superior performance in
                removing batch effects while conserving biological variation at the cell subpopulation
                and trajectory level. Such performance is particularly noticeable for the batches with
                imbalanced cell subpopulation compositions.
                   To evaluate the computational cost of scMC, we created five simulation datasets with
                1000, 5000, 10,000, 20,000, and 30,000 cells using Splatter package [21] (Additional file
                1). Among the compared methods, Harmony and Seurat V3 need less runtime com-
                pared to other two algorithms. The runtimes for scMC and LIGER are comparable
                (Additional file 2: Figure S1). For example, for a dataset with 10,000 cells, the runtimes
                of LIGER, Seurat V3, Harmony, and scMC are 26, 4.63, 1.72, and 9.9 min, respectively.

                scMC robustly predicts PBMC subpopulation perturbation across conditions
                To assess the ability of scMC on aligning cell subpopulations across different biological
                conditions on real datasets, we integrated scRNA-seq data from 13,999 human periph-
                eral blood mononuclear cells (PBMCs) for both control and interferon β-stimulated
                conditions (denoted by control condition and stimulated condition hereafter) [23]. Pre-
                vious studies revealed the same cell subpopulation compositions across the two condi-
                tions, including 13 subpopulations in both conditions [24]. For this case, scMC had
                comparable performance with LIGER, Seurat V3, and Harmony in removing batch
Zhang and Nie Genome Biology    (2021) 22:10                                                                   Page 7 of 28

                effects and preserving biological variation (Additional file 2: Figure S2). Besides evaluat-
                ing the integration performance using all the cells in both conditions, we also made
                comparisons on 26 in silico datasets derived directly from PBMC datasets, which simu-
                late vast differences in cell subpopulation compositions across conditions.
                   To assess the ability of alignment in merging few shared cell subpopulations across
                conditions, we first created 13 datasets by retaining one of the 13 subpopulations in
                control (e.g., removal of all cells except for DC cells from control condition) but keep-
                ing all cell subpopulations in stimulated condition. Ideally, a good alignment method
                should merge the cells from control condition with the cells of the same cell subpopu-
                lation from stimulated condition. By visualizing the aligned data in the UMAP space,
                we found that scMC, compared to LIGER, Seurat V3, and Harmony, better aligned the
                cell subpopulation from control condition (green) and the corresponding cell subpopu-
                lation from stimulated condition (blue) on most of the perturbed datasets (Fig. 3a, Add-
                itional file 2: Figure S3A). Moreover, we used LISI-derived F1 score to quantitatively
                assess both batch mixing and cell type separation (“Methods”). scMC had a higher
                LISI-derived F1 score than other methods on 10 out of 13 perturbed datasets (Fig. 3b,
                Additional file 2: Figure S4). These results demonstrate the scMC’s ability in removing
                batch effects and retaining biological variation for the datasets with only few shared cell
                types.
                   To assess the ability of alignment in preserving subtle biological differences across
                conditions, we created another 13 perturbed datasets by removing one cell subpopula-
                tion from control condition and two cell subpopulations from stimulated condition, to
                ensure each condition with at least one specific cell subpopulation in all perturbed
                datasets. For the stimulated condition, we removed CD14 Mono and DC cell subpopu-
                lations, representing larger (31%) and smaller (3.6%) cell populations. By visualizing the
                aligned data in the UMAP space, we found that only scMC robustly separated the
                condition-specific cell subpopulations from other cells. Nevertheless, LIGER merged
                the stimulated-specific cell subpopulation with other cells from both conditions, and
                Seurat V3 and Harmony merged the control-specific cell subpopulations (i.e., either
                CD14 Mono or DC) with other cells from stimulated condition, on most of the per-
                turbed datasets (Fig. 3c, Additional file 2: Figure S3B). Additionally, we quantitatively
                evaluated the ability of preserving condition-specific cell types by defining a specificity
                score, which assesses the overlap ratio between the cells within condition-specific cell
                types with other cells based on their nearest neighbors in a low-dimensional space
                (“Methods”). scMC had higher specificity scores than other methods on 9 out of 13
                perturbed datasets (Fig. 3d). Together, scMC exhibits better performance in preserving
                condition-specific cell types than other compared methods, which often favor the re-
                moval of batch effects over conservation of biological variation.

                scMC predicts a specific fibroblast subpopulation upon Hedgehog activation during
                mouse skin wound healing
                We further assessed the ability of scMC in detecting condition-specific cell subpopula-
                tions using a mouse skin scRNA-seq dataset. This dataset included cells from control
                and Hedgehog (Hh) activation conditions during skin wound healing [25]. Although
                LIGER strongly removed the batch effects across conditions (Fig. 4a), it was unable to
Zhang and Nie Genome Biology (2021) 22:10 Page 8 of 28
Fig. 3 scMC aligns and preserves condition-specific cell subpopulations on perturbed PBMC datasets. a
UMAP of the corrected data from LIGER, Seurat V3, Harmony, and scMC across control and stimulated
conditions in the perturbed PBMC datasets. Each row represents one method, and each column represents
one perturbed dataset in which only one cell subpopulation was retained in the control condition
(indicated on the top). See Additional file 2: Figure S3A for other 7 perturbed datasets. Green: cells retained
in the control condition; blue: cells from the corresponding same cell subpopulation in the stimulated
condition; gray: other cells in the stimulated condition. b LISI-derived F1 scores of LIGER, Seurat V3,
Harmony, and scMC on all 13 perturbed datasets. c UMAP of the corrected data from LIGER, Seurat V3,
Harmony, and scMC across control and stimulated conditions. Each column represents one perturbed
dataset, where the cell subpopulation removed in the control condition is labeled on the top, and CD14
Mono and DC cell subpopulations were also removed in the stimulated condition for all cases. See
Additional file 2: Figure S3B for other 7 perturbed datasets. Green: CD14 Mono and DC cells from the
control condition. Red: other cells from the control condition. Blue: cells of the cell subpopulation removed
from the control condition in the stimulated condition. Purple: other cells in the stimulated condition. d
Specificity scores of LIGER, Seurat V3, Harmony, and scMC on all 13 perturbed datasetsZhang and Nie Genome Biology (2021) 22:10 Page 9 of 28
Fig. 4 (See legend on next page.)Zhang and Nie Genome Biology (2021) 22:10 Page 10 of 28
(See figure on previous page.)
Fig. 4 scMC reveals specific fibroblast subpopulations in control and Hedgehog activation during mouse skin wound
healing. a, b UMAP of the corrected data from LIGER, Seurat V3, Harmony, and scMC across two conditions. a Cells
are colored by experimental conditions. b Cells are colored based on the annotated cell labels determined based on
the cell clusters identified by scMC by examining the expression patterns of known markers (Additional file 2: Figure
S5). c Overlay the expression levels of fibroblasts pan-markers (Pdgfra and Lox) and Hh-active fibroblast markers (Ptch1
and Gil1) onto the UMAP space of LIGER, Seurat V3, Harmony, and scMC, respectively. Dark red and gray colors
represent the high and zero expression, respectively. d Heatmap showing the expression patterns of the top 10
marker genes enriched in Hh-inactive and Hh-active fibroblast subpopulations. e The top 10 enriched GO biological
processes of the marker genes associated with the Hh-inactive and Hh-active fibroblast subpopulations
preserve the biologically meaningful subpopulations (Fig. 4b). For example, the fibro-
blast cells, marked by high expression of Pdgfra and Lox, were mixed with the Schwann
cells in the UMAP space, not showing cell-type-specific localization (Fig. 4b, c). In con-
trast, Seurat V3, Harmony, and scMC were able to separate broad cell types, including
Immune, Schwann, Muscle, Fibroblast, and Endothelial cells, marked by the high ex-
pression of Cd68, Plp1, Myh11, Pdgfra, and Pecam1 (Fig. 4b, c, Additional file 2: Figure
S5). Fibroblast cells from control and Hh activation conditions were not completely
mixed and showed condition-specific localization in the UMAP space, suggesting the
existence of condition-specific fibroblast subpopulations (Fig. 4b). Intriguingly, scMC
was able to differentiate the Hh-active from Hh-inactive fibroblast populations, in
which the Hh-active fibroblasts were enriched for markers such as Ptch1 and Gil1,
whereas other methods failed to do so with a number of mixed cells (Fig. 4b, c). To-
gether, through integration across conditions, scMC detects a specific fibroblast sub-
population upon Hh activation during mouse skin wound healing.
To investigate biological differences between the new identified Hh-active fibroblast
subpopulation and the Hh-inactive fibroblast subpopulation (i.e., the classic fibroblasts),
we performed differential expression analysis between these two subpopulations as well as
functional enrichment analysis of the marker genes associated with each subpopulation
using ClusterProfiler R package [26]. These two fibroblast subpopulations are not only
enriched for very different signature genes (Fig. 4d) but also vast different biological pro-
cesses (Fig. 4e). The Hh-inactive fibroblasts are involved in typical processes such as extra-
cellular matrix (ECM) and collagen formation associated with effective wound healing.
Nevertheless, Hh-active fibroblasts are involved in processes such as ribosome biogenesis/
assembly and rRNA processing (Fig. 4e), implying active RNA dynamics and cell fate tran-
sition. Indeed, Hh-active fibroblasts also express dermal papilla signature genes such as
Igfbp4 and Wif1, suggesting that these fibroblasts are likely undergoing transition to der-
mal papilla. This is in agreement with the observation that dermal fibroblasts could give
rise to dermal papilla cells during hair follicle formation [27, 28]. These results suggest
the potential role of Hh activation in inducing fibroblasts into dermal papilla cells. To-
gether, we demonstrated scMC’s capability in preserving biological variation and revealing
biologically meaningful insights through accurate integration.
scMC reveals integrated developmental trajectories through simultaneous integration
across replicates and time points
We next evaluated scMC’s ability to integrate time-course datasets with continuous tra-
jectories, rather than discrete cell types. We analyzed 25,719 cells from mouse skinZhang and Nie Genome Biology (2021) 22:10 Page 11 of 28
embryonic development at embryonic day E13.5 and E14.5, where each time point con-
sisted of two biological replicates [29]. We performed two integration tasks: integrating
the replicate samples of each time point individually and integrating all the four sam-
ples at once. First, for each time point, we integrated the scRNA-seq datasets across
replicates. After integration by LIGER, Seurat V3, Harmony, and scMC, all these
methods removed the batch effects between the two replicates and revealed major cell
populations in embryonic skin, such as epidermal and dermal populations (Additional
file 2: Figure S6-S7).
Next, we reconstructed the integrated epidermal and dermal trajectories using all the
four samples, which were potentially challenging due to the need of simultaneous inte-
gration across replicates and time points. By integrating all the four samples from
E13.5 and E14.5 using LIGER, Seurat V3, Harmony, and scMC, we were able to extract
the epidermal and dermal cells based on their known makers such as Col1a1, Lum,
Krt14, and Krt1 (Fig. 5a–c, Additional file 2: Figure S8-S10A-C). We then recon-
structed the epidermal and dermal trajectories by applying a diffusion-based manifold
learning method PHATE [30, 31] to the corrected data from each integration method.
For the epidermal trajectory, LIGER, Harmony, and scMC were able to produce an in-
tegrated global trajectory structure starting from basal epidermal cells and progressing
toward Lor-high suprabasal epidermal cells (Fig. 5d, e, Additional file 2: Figure S8 and
S10D-E). However, the trajectory structure was lost when visualizing the corrected data
from Seurat V3 (Additional file 2: Figure S9D-E). For the dermal trajectory, scMC
placed cells in an expected differentiation trajectory, which recapitulates sequential
stages of dermal cell lineage differentiation process from an undifferentiated dermal
state to differentiated Sox2-high dermal condensate (DC) cells (Fig. 5f–g). Notably, this
integrated trajectory showed that both E13.5 and E14.5 dermal cells were concentrated
toward the origin of the trajectory, but E14.5 dermal cells exclusively made up the
terminus of the trajectory, suggesting the specific cell fate at E14.5, which was consist-
ent with prior knowledge [29]. However, other methods, including LIGER and Seurat
V3, tended to strongly remove both batch effects and biological variation, leading to a
loss of trajectory structure and failure of detecting specific cell states at E14.5 (Add-
itional file 2: Figure S8-S9D-G). Harmony appeared to place the dermal cells in the cor-
rect order in the PHATE space although the detailed trajectory structure is unclear
(Additional file 2: Figure S10D-G).
To compare the recovered trajectories in a quantitative fashion, we used a similar method
from Luecken et al. [19], which assumed that trajectories found in the unintegrated data for
each batch gave the most accurate biological signal. Thus, we computed Pearson correlation
coefficients between the pseudotime values of cells in each replicate sample before and after
integration (“Methods”). Consistent with our visual observation, LIGER, Harmony, and scMC
performed well in preserving cell pseudotime for the epidermal trajectory, in particular for the
cells from E14.5 at which cells can progress toward the suprabasal cell state (Fig. 5h). For the
dermal trajectory, although Harmony did not produce a clear trajectory in the PHATE space
(Additional file 2: Figure S10F), it showed comparable correlation values with scMC (Fig. 5h).
However, LIGER and Seurat V3 produced lower correlation values for the dermal trajectory
due to the loss of trajectory structure (Fig. 5h).
In addition, we investigated the pseudotemporal dynamics of several marker genes
based on the scMC-derived integrated developmental trajectories. As expected, duringZhang and Nie Genome Biology (2021) 22:10 Page 12 of 28
Fig. 5 scMC reveals integrated epidermal and dermal trajectories by simultaneous integration across
replicates and time points during skin embryonic development. a, b UMAP of the corrected data from
scMC on the time-course scRNA-seq datasets from E13.5 to E14.5. a Cells are colored by the replicates and
time points. b Cells are colored by the identified cell subpopulations from the corrected data. Cells inside
the dashed line were identified as dermal and epidermal cells based on their known markers. c Overlay the
expression levels of markers of dermal (Col1a1 and Lum) and epidermal cells (Krt14 and Krt10) onto the
UMAP space. Dark red and gray colors represent the high and zero expression, respectively. d PHATE
visualizations for the epidermal cells from both E13.5 and E14.5, only E13.5, and only E14.5, respectively. e
Overlay the expression levels of markers of epidermal cells (Krt5, Krt14, Krt10, and Lor) onto the PHATE
space. f PHATE visualizations for the dermal cells from both E13.5 and E14.5, only E13.5, and only E14.5,
respectively. g Overlay the expression levels of markers of dermal cells (Lox and Col1a1) and DC cells (Sox2
and Bmp4) onto the PHATE space. h Comparison of the recovered trajectories by computing Pearson
correlation coefficients between the pseudotime values of cells from each replicate sample before and after
integration. i, j Pseudotemporal dynamics of un-differentiation and differentiation marker genes
reconstructed from the integrated trajectories. Cells are colored based on the pseudotime values. Blue lines
represent the locally weighted smoothing expression. Color bar represents the scaled pseudotime valuesZhang and Nie Genome Biology (2021) 22:10 Page 13 of 28
epidermal and dermal differentiation, the temporal dynamics of undifferentiated (e.g.,
Krt14 and Lum) and differentiated (e.g., Krt10, Lor, Sox2 and Bmp4) markers were
downregulated and upregulated over pseudotime, respectively (Fig. 5i, j). scMC cor-
rectly captures the developmental process using datasets from different time points and
replicates, showing meaningful gene dynamics.
scMC is able to deal with multiple batches in complex datasets
To further assess the ability of scMC in integrating complex scRNA-seq dataset with
multiple batches, we applied scMC to a mouse lung scRNA-seq dataset with 32,472
cells across 16 batches, which was used in a recent benchmarking study [19]. The batch
labels (i.e., sample origins) and annotated cell labels were used to compute evaluation
metrics. All the tested methods performed well in batch effect removal. In particular,
Seurat V3 had the highest overall batch removal score while scMC exhibited a moder-
ate batch removal score in comparison with other methods (Fig. 6a–c). However, Seu-
rat V3 performed poorly in preserving the biological variation, making various cell
subpopulations more compact in the UMAP space along with some mixed cell labels
and leading to lower biological conservation scores. Seurat V3 significantly reduced the
biological variation among different cell types, such as epithelial cells (i.e., ciliated cells,
basal 1 and basal 2), fibroblasts, and immune cells (i.e., B cells, endothelial cells and
mast cells). Nevertheless, LIGER, Harmony, and scMC succeeded in separating these
broad cell types. Compared to scMC with the highest biological conservation scores,
LIGER separated the ciliated cells into different groups and was not able to discrimin-
ate basal 1 from basal 2 cells and neutrophils from macrophage, leading to the lowest
biological conservation scores, in particular for ASW label and ARI label. Harmony ex-
hibited good separation of different cell types, but showed an overlap between neutro-
phils, dendritic cells, and macrophage, leading to relatively lower biological
conservation scores compared to scMC. scMC can not only separate different broad
cell types, but also discriminate biologically similar cell states, such as basal 1 and basal
2, macrophage, and dendritic cells. Quantitatively, scMC showed moderate batch re-
moval scores, but also the highest biological conservation scores as well as the overall
score (Fig. 6c).
scMC consistently performs well in integrating single-cell ATAC-seq data
We next assessed whether the capability and performance of scMC can transfer to
other modalities, such as single-cell ATAC-seq data. Additional challenge here is the
extremely sparse and near-binary characteristics in scATAC-seq data, for which we first
transformed the chromatin accessibility data into other informative feature matrix, in-
cluding k-mers and genes (“Methods”). These two feature matrices were constructed
using k-mer-based chromVAR [32] and Gene Scoring [33]. We gathered single-cell
chromatin profiles from four adult mouse tissues (whole brain, large intestine, heart,
and liver), in which the whole brain and large intestine had two replicates [34]. A good
alignment method should merge cells from different replicates in the same tissue as
well as preserve biological variation among different tissues. To evaluate the ability of
preserving condition-specific cells, we treated cells from the whole brain replicate 1,Zhang and Nie Genome Biology (2021) 22:10 Page 14 of 28
Fig. 6 scMC is able to integrate a complex mouse lung scRNA-seq dataset across 16 batches. a UMAP of
the corrected data from LIGER, Seurat V3, Harmony, and scMC on a mouse lung scRNA-seq dataset across
16 batches. Cells are colored by known sample origins (top panel) and annotated cell labels (bottom panel),
respectively. b Evaluation of integration methods using 16 metrics, grouped into two categories: batch
effect removal (i.e., Batch correction) and biological variation conservation (i.e., Bio conservation). LISI-
derived F1 score is a summarized metric assessing both batch mixing and cell type separation. c
Comparison of over scores among different methods
large intestine replicate 1, heart, and liver as condition 1, and cells from the whole brain
replicate 2 and large intestine replicate 2 as condition 2.
First, we applied the integration methods to the chromVAR-transformed feature
matrix (“Methods”) and analyzed the corrected data in the UMAP space. scMC re-
moved the batch effects between different replicates from the same tissue while retain-
ing the biological differences among different tissues (Fig. 7a, Additional file 2: Figure
S11A), leading to the higher batch effect removal and biological conservation scores
(Additional file 2: Figure S12A-B). Both LIGER and Harmony merged the liver and
heart cells with the whole brain and large intestine cells, suggesting that biological vari-
ation was also removed along with the batch effects. Seurat V3 neither clearly distin-
guished liver cells from large intestine cells nor merged the two replicates from large
intestine tissue (Fig. 7a), leading to the lower batch effect removal and biological con-
servation scores compared to scMC (Additional file 2: Figure S12A-B). Moreover, we
used LISI-derived F1 metric to assess replicate mixing as well as tissue separation, and
specificity metric to evaluate the ability of preserving condition-specific tissues
(“Methods”). Harmony and scMC had the higher LISI-derived F1 scores than LIGER
and Seurat V3 (Fig. 7b, Additional file 2: Figure S12C), suggesting better performanceZhang and Nie Genome Biology (2021) 22:10 Page 15 of 28
Fig. 7 scMC performs well in integrating scATAC-seq datasets. a UMAP of the corrected data from LIGER,
Seurat V3, Harmony, and scMC on an scATAC-seq dataset with the feature matrix transformed by
ChromVAR. Cells are colored by known tissue origins. b Quantitative evaluation of removing batch effects,
preserving condition-specific tissues, and separating different tissues on the aligned UMAP space from four
methods using LISI-derived F1, specificity, and silhouette metrics. The feature matrix was constructed using
ChromVAR. c, d The four integration methods applied to the feature matrix transformed by Gene Scoring
of Harmony and scMC in removing batch effects. However, Harmony had lower speci-
ficity score than scMC, indicating better performance of scMC in preserving condition-
specific tissues than Harmony (Fig. 7b). Additionally, we assessed tissues separability in
the UMAP space using the silhouette score (“Methods”) to quantify how well each
method groups and separates the cells from other groups of cells. scMC showed the
largest silhouette score compared to other three methods (Fig. 7b).
scMC identified four cell subpopulations in the brain tissue (Additional file 2: Figure
S13A). To investigate the biological roles of these cell subpopulations, we aggregated
chromatin accessible signals across each cell subpopulation and identified differential
loci of these four cell subpopulations (Additional file 1). By performing gene ontologyZhang and Nie Genome Biology (2021) 22:10 Page 16 of 28
enrichment analysis using GREAT [35] and motif enrichment analysis by chromVAR
[32], we found different enriched biological processes and motif patterns across these
four different cell subpopulations (Additional file 2: Figure S13B-C). For example, Sub-
cluster 1 was enriched for ectoderm development and cell differentiation, Subcluster 2
was enriched for defense response, and Subcluster 3 was enriched for T cell differenti-
ation (Additional file 2: Figure S13C).
Second, we applied the integration methods to the Gene Scoring-transformed feature
matrix (“Methods”) and found that scMC merged cells from the same tissues, distin-
guished condition-specific tissues, and separated different tissues in the UMAP space
(Fig. 7c). LIGER was also able to separate different tissues, leading to higher biological
conservation scores (Additional file 2: Figure S12D-F). Seurat V3 and Harmony com-
pletely merged cells from all tissues together (Fig. 7c), producing lower biological con-
servation scores (Additional file 2: Figure S12D-F). Moreover, except for scMC, other
three methods completely mixed the cells from the two conditions (Additional file 2:
Figure S11B). Together, scMC consistently exhibits superior performance in removing
batch effects and preserving biological variation when integrating scATAC-seq datasets.
Discussion
A rapid increase in single-cell genomics datasets collected from different conditions,
experiments, and labs presents a major challenge in comparing datasets due to batch
effects [6, 19]. The inevitable mixture of batch effects and biological variation, which is
inherent to biological systems, introduces further challenges for comparing among dif-
ferent single-cell genomics datasets. For example, the three state-of-the-art integration
methods LIGER, Seurat V3, and Harmony are found to often remove or reduce bio-
logical variation due to their strong batch removal capability, as shown on both simula-
tion and real datasets. This is particularly noticeable for the batches with imbalanced
cell subpopulation compositions.
Unlike existing methods, scMC can explicitly differentiate batch variation from bio-
logical variation, by inferring the batch variation in an unsupervised manner and learn-
ing the biological variation by subtracting the inferred technical variation from the total
variation. In contrast, other methods, such as Seurat V3, learn a set of shared correc-
tion vectors by considering all available cells in the datasets, potentially lacking the abil-
ity in discriminating technical variation from biological variation. Together, scMC
provides a reliable way to identify true biological differences from multiple datasets.
Reconstruction of integrated pseudotemporal trajectories is important yet challenging
for joint analysis of developmental dynamics across datasets. Comparisons of pseudo-
temporal trajectories across diverse conditions measured by different datasets require
specialized methods due to batch effects [36]. Dynamic time warping has been used to
align two pseudotemporal trajectories: pseudotemporal trajectories of each dataset are
inferred separately and then aligned to reveal timing differences across conditions [37,
38]. Such alignment might fail to detect signals that are weak in each dataset and might
be sensitive to the inaccurate inference of individually inferred pseudotemporal trajec-
tories. Reconstructing integrated pseudotemporal trajectories in a shared embedding
space across datasets could really improve such temporal analysis. As shown in the
mouse embryonic skin development dataset, the scMC-derived integrated trajectory
showed that both E13.5 and E14.5 epidermal and dermal cells were concentratedZhang and Nie Genome Biology (2021) 22:10 Page 17 of 28
toward the origin of the trajectory, but E14.5 cells exclusively made up the terminus of
the trajectory, suggesting that the full range of epidermal and dermal differentiation
program might be already established as early as E13.5. For this case, reconstructing an
integrated trajectory is critical when comparing time-course datasets. However, for the
time-course datasets, most integration methods including scMC do not incorporate
temporal information into the inference of correction vectors. Including such temporal
information will likely better align the cells in time for more faithful integrated pseudo-
temporal trajectories.
As seen in the above time-course datasets, our alignment method could provide bio-
logical insights that are difficult to obtain if only analyzing datasets individually. An-
other example is the Hedgehog-active fibroblast subpopulation identified by scMC in
the mouse skin wound system. While this subpopulation could be uncovered by analyz-
ing the datasets individually, the question on whether this subpopulation is a specific
fibroblast subpopulation upon Hedgehog activation would be challenging to answer
without using alignment approach. In general, many results obtained by joint analysis
might be obtained by individual analysis of each dataset with additional careful effort in
comparing them; however, the apparent differences seen between two individual ana-
lysis might be caused by technical variation. The capability of distinguishing technical
variation from biological variation in scMC is crucial when comparing cellular compo-
sitions and trajectories across conditions and time points, which are often measured in
different batches with potential technical variation.
To predict technical variation, scMC needs to detect putative cell clusters for each
dataset. To enhance robustness of integration with respect to this initial clustering, two
strategies have been employed. First, a consensus clustering approach is used by com-
bining multiple clustering solutions, obtained by varying the resolution parameter
values in the Leiden algorithm. Such approach allows high accuracy and robustness in
clustering, similar to the SC3 method for consensus clustering of scRNA-seq data [39].
Second, a set of confident cells in each putative cell cluster are determined to filter out
the cells that might be assigned into multiple clusters by different resolutions or clus-
tering methods. Such sketching strategy not only enables robustness of the method
with respect to the initial clustering but also helps to reduce computational cost.
The computing cost of scMC is dominated by solving the main optimization problem
in the algorithm, which is equivalent to calculating k largest eigenvectors (default k =
40) associated with the real positive eigenvalues of a n × n matrix, where n is the num-
ber of all confident cells. Therefore, the computational complexity is O (kn2). scMC
can analyze large-scale datasets, e.g., 100 K cells within 2 h. To reduce the run time,
users can use fewer confident cells by adjusting the quantile cutoff parameter (e.g.,
from 0.75 to 0.9) or perform subsampling of single-cell datasets using a “geometric
sketching” approach [40], which allows to maintain the transcriptomic heterogeneity
within a dataset with a smaller subset of cells. More efficient methods and packages for
calculating eigenvalues will significantly enhance the computational speed of scMC.
The correction vectors from scMC can be directly used for correcting batch effects
when additional datasets become available. For the simulation dataset 2 with three
batches, we run scMC on the cells from the first two batches, and then projected the
cells from the third batch onto the shared UMAP space learned for the first two
batches using the learned correction vectors. As expected, the cells with the same labelsZhang and Nie Genome Biology (2021) 22:10 Page 18 of 28
from the third batch are correctly placed onto this shared UMAP space (Additional file
2: Figure S14). However, projecting cells from very different sources with strong batch
effects into a shared low-dimensional space may require a more advanced transfer
learning approach, such as scArches [41].
Using highly variable genes (HVGs) instead of all the genes can improve the perform-
ance of integration analysis and reduce the computational cost [19]. The correction
learned from selected HVGs is often sufficient to project all cells in the shared space.
Sometimes, correcting more or all genes is needed in order to study details of those
genes in the shared space, for example, visualization of expression profiles of individual
genes in the integrated UMAP space. While the corrected data are appropriate for
studying gene expression profiles in the shared space, one should be careful about
whether biological signals are removed during integration [2]. Our analysis indicates
that some integration methods might remove the biological signals while removing
technical variation, producing corrected data with a less accurate representation of the
underlying biology. To obtain more genes in the corrected data, one usually needs to
select more HVGs. To study this issue, we tested two more thresholds for HVG selec-
tion when analyzing simulation dataset 1 (leading to 4457 or 10,000 genes) and the
mouse skin wound healing dataset (leading to 4792 or 17,912 genes). Consistent results
have been found among the three thresholds for HVG selection (Additional file 2: Fig-
ure S15). In general, more efficient methods are required if one prefers to correct all
genes when analyzing their expression profiles across datasets.
The interrelated biological conditions, such as different developmental stages or nor-
mal vs. disease, usually result in biological differences in cell states and their interac-
tions [42]. With the increasing number of the single-cell transcriptomics datasets, such
as the Human Cell Atlas and the Pediatric Cell Atlas, and the availability of other
single-cell genomics data, such as scATAC-seq data [43–45], robust and accurate inte-
gration methods are particularly important when dissecting how distinct cell states re-
spond to perturbations, diseases, and evolution.
Conclusions
We presented a new method together with an R toolkit scMC for integrating multiple
single-cell genomic data across conditions, time points, tissues, and studies. scMC is
particularly effective to address the over-alignment issue existing in previous integra-
tion methods. The superior alignment performance of scMC is particularly noticeable
for the datasets with imbalanced cell population compositions across interrelated bio-
logical conditions. The capability of scMC in preserving biological signals while remov-
ing batch effects will facilitate biological discoveries from the ever-growing number of
single-cell studies.
Methods
scMC algorithm
scMC, designed to integrate single-cell transcriptomic or epigenomic data across dis-
tinct datasets, includes the following main steps in its algorithm: (1) data preprocessing;
(2) feature matrix construction; (3) identification of putative cell clusters for each data-
set separately; (4) detection of confident cells in each putative cell cluster; (5) inferenceZhang and Nie Genome Biology (2021) 22:10 Page 19 of 28
of shared cell clusters between any pair of datasets; (6) learning the confounding
matrix; (7) learning the correction vectors; and (8) construction of corrected data for
downstream analysis. Below, we describe each of these steps in detail.
Data preprocessing
For each dataset, features expressed in less than 3 cells and cells with expressed fea-
tures less than 200 are removed. For scRNA-seq data, the data is normalized as follows:
expression of each gene is divided by the total expression in each cell, multiplied by a
scale factor (10,000 by default) and log-transformed with pseudocount 1.
Feature matrix construction
For scRNA-seq data, the feature matrix is constructed by selecting a set of highly vari-
able genes (HVGs), through calculating the average expression and Fano factor for each
gene, binning the average expression of all genes into 20 evenly sized groups and then
normalizing the Fano factor within each bin. The Fano factor, defined as the variance
divided by the mean, is a measure of dispersion. Genes with normalized Fano factor
value greater than 0.05 and average expression larger than 0.01 are selected. The num-
ber of HVGs that are selected as features is typically around 2000–3000.
For scATAC-seq data, the feature matrix is constructed by transforming features
based on two methods, including ChromVAR [32] and Gene Scoring [33], to deal with
the inherent sparsity and high dimensionality of scATAC-seq data [46]. ChromVAR es-
timates the dispersion of chromatin accessibility within peaks sharing the same k-mers.
Gene Scoring constructs a peaks-by-cells count matrix, defines regions of interest as
the 50 kb upstream and downstream of gene transcription start site (TSS), and assigns
each gene an accessibility score by summarizing peaks near its TSS and weighting them
by an exponential decay function based on their distances to the TSS. Therefore, the
chromatin accessibility data matrix is transformed into either k-mers-by-cells or genes-
by-cells matrix.
Identification of putative cell clusters for each dataset separately
For each dataset, cells are grouped into putative clusters using a consensus approach
based on the Leiden community detection algorithm. First, for a given resolution par-
ameter value in the Leiden algorithm, the putative cluster memberships are identified
by applying Leiden algorithm [20] to a shared nearest neighbor (SNN) graph. This
SNN graph is constructed by calculating the k-nearest neighbors (20 by default) for
each cell based on the first 40 principle components after performing principle compo-
nent analysis (PCA) on the feature matrix. The fraction of shared nearest neighbors be-
tween the cell and its neighbors is then used as weights of the SNN graph. Second, for
a range of resolution parameter values (e.g., from 0.1 to 0.5 with an increment being
0.1), a set of cluster memberships are obtained, and then a consensus matrix is con-
structed to represent the probability of two cells being in the same cluster across mul-
tiple values of the resolution parameter. Finally, the putative cell clusters are identified
by applying hierarchical clustering with average linkage to the computed consensus
matrix. The number of putative cell clusters is determined by the number of larger sin-
gular values that capture the larger variance of the consensus matrix via singular valueZhang and Nie Genome Biology (2021) 22:10 Page 20 of 28
decomposition. Specifically, we calculate the ratio of each singular value to the sum of all
the singular values, which indicates the percentage of variance each singular value con-
tributes to. The number of singular values that have the ratio higher than 1% is used to es-
timate the number of the putative cell clusters. In the studied datasets, the number of
clusters ranges from 3 to 20. A single cluster usually corresponds to one cell subpopula-
tion. It is worth noting that some cell populations might be divided into multiple clusters
due to the inherit heterogeneity and the existence of different cellular states.
Detection of confident cells in each putative cell cluster
For each putative cluster, a set of confident cells, defined as cells with high similarity
with other cells in the cluster, are obtained. The similarities of a cell with other cells
are quantified by the weights of the computed SNN. For each cell, we define its average
similarity by computing the average of its similarities with all other cells within the
same cluster. The third quantile of the average similarities associated with all cells
within a cluster is denoted by Q3. Then confident cells are the set of cells with its aver-
age similarity higher than Q3 in each cluster.
Inference of shared cell clusters between any pair of datasets
For a pair of dataset i and dataset j, we build a complete bipartite graph, in which each
vertex represents a cell cluster and edge weight represents the similarity between two
cell clusters. The similarity between two cell clusters p and q is defined by the combin-
ation of the following two strategies. First, the similarity between clusters p and q is
quantified based on the overlap fraction of the marker genes associated with each cell
cluster. The marker genes of a cell cluster are selected if (i) the p values from
likelihood-ratio tests [47] are less than 0.05, (ii) the log fold-changes are higher than
0.25, and (iii) the percentage of expressed cells in the cluster is higher than 25%. The
likelihood-ratio tests are performed by comparing the gene expression of confident cells
in a particular cell cluster with all other cell clusters. This method can simultaneously
test for changes in mean expression (conditional on the gene being expressed) and in
the percentage of expressed cells [47]. Of note, the marker genes are identified using
confident cells in the cluster. Then the similarity between clusters p and q is computed
by s/min(n1, n2), where s is the number of marker genes shared by the clusters p and q,
and n1 and n2 are respectively the number of marker genes associated with clusters p
and q. Second, the similarity between clusters p and q is quantified by the cosine simi-
larity of their average expression level of the union of their marker genes. Finally, the
similarity between clusters p and q (i.e., the weight of the edge connecting vertices p
and q in the bipartite graph) is defined as the average of the similarity values obtained
from these two strategies. A pair of shared cell clusters between two datasets is identi-
fied if their similarity is greater than a threshold value T (0.6 by default). Note that
clustering matching is performed on the confident cells, and it is possible that cluster p
is shared by more than one cluster.
Learning the confounding matrix
The confounding matrix Y containing the information of technical variation is con-
structed based on all the shared cell clusters between any pair of datasets as follows.You can also read