HSPCs display within-family homogeneity in differentiation and proliferation despite population heterogeneity - eLife
←
→
Page content transcription
If your browser does not render page correctly, please read the page content below
RESEARCH ARTICLE

                                      HSPCs display within-family homogeneity
                                      in differentiation and proliferation despite
                                      population heterogeneity
                                      Tamar Tak1†, Giulio Prevedello2,3†, Gaël Simon1, Noémie Paillon1,
                                      Camélia Benlabiod4,5,6, Caroline Marty3,4,5, Isabelle Plo3,4,5, Ken R Duffy7,
                                      Leı̈la Perié1*
                                      1
                                       Institut Curie, Université PSL, Sorbonne Université, CNRS UMR168, Laboratoire
                                      Physico Chimie Curie, Paris, France; 2Institut Curie, PSL Research University, CNRS,
                                      Orsay, France; 3Université Paris-Saclay, Saclay, France; 4INSERM, UMR1287,
                                      Gustave Roussy, Villejuif, France; 5Gustave Roussy, Villejuif, France; 6Université de
                                      Paris, Paris, France; 7Hamilton Institute, Maynooth University, Co Kildare, Ireland

                                      Abstract High-throughput single-cell methods have uncovered substantial heterogeneity in the
                                      pool of hematopoietic stem and progenitor cells (HSPCs), but how much instruction is inherited by
                                      offspring from their heterogeneous ancestors remains unanswered. Using a method that enables
                                      simultaneous determination of common ancestor, division number, and differentiation status of a
                                      large collection of single cells, our data revealed that murine cells that derived from a common
                                      ancestor had significant similarities in their division progression and differentiation outcomes.
                                      Although each family diversifies, the overall collection of cell types observed is composed of
                                      homogeneous families. Heterogeneity between families could be explained, in part, by differences
                                      in ancestral expression of cell surface markers. Our analyses demonstrate that fate decisions of
                                      cells are largely inherited from ancestor cells, indicating the importance of common ancestor
*For correspondence:                  effects. These results may have ramifications for bone marrow transplantation and leukemia, where
leila.perie@curie.fr                  substantial heterogeneity in HSPC behavior is observed.
†
 These authors contributed
equally to this work

Competing interests: The              Introduction
authors declare that no
                                      The hematopoietic system has long since served as a reference model for stem cell biology, with
competing interests exist.
                                      understanding garnered from the study of hematopoietic stem cells (HSCs) successfully transferred
Funding: See page 17                  to the clinic. In order to maintain blood cell production, rare self-renewing HSCs produce differenti-
Received: 01 July 2020                ated cells called multi-potent progenitors (MPPs), which proliferate and differentiate through an
Accepted: 17 May 2021                 amplifying cascade of increasingly committed progenitors, ultimately resulting in all mature blood
Published: 18 May 2021                cell types. Underpinning this traditional model is the assumption that the HSC pool is maintained
                                      through a process of asymmetric division that results in one HSC and one MPP, while MPPs form a
Reviewing editor: Utpal
Banerjee, University of California,
                                      transient cell type that cannot persist indefinitely and must ultimately differentiate.
Los Angeles, United States                Recent studies have challenged this theory in multiple distinct directions. It is well-established
                                      that HSCs can sequentially reconstitute the blood system of several hosts (Ross et al., 1982), leading
   Copyright Tak et al. This
                                      to the inference that HSCs must be able to maintain themselves (Morrison and Kimble, 2006).
article is distributed under the
                                      When observed with time-lapse imaging, self-renewal has been seen to occur through both symmet-
terms of the Creative Commons
Attribution License, which            ric and asymmetric cell division (Wu et al., 2007; Brummendorf et al., 1998; Ema et al., 2000;
permits unrestricted use and          Punzel et al., 2003), which can be influenced by extrinsic signals (Ema et al., 2000; Punzel et al.,
redistribution provided that the      2003). Steady-state in situ lineage-tracing studies have also suggested that MPPs are capable of
original author and source are        self-renewal (Sun et al., 2014; Busch et al., 2015). In addition, HSCs have been shown to differenti-
credited.                             ate without division into megakaryocytes in vitro (Roch et al., 2015), and common myeloid,

Tak, Prevedello, et al. eLife 2021;10:e60624. DOI: https://doi.org/10.7554/eLife.60624                                               1 of 21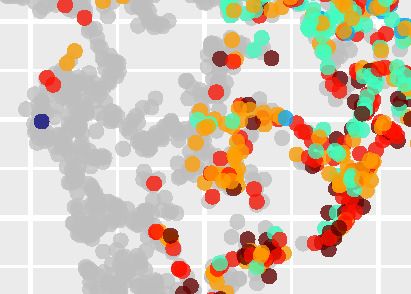
Research article                                                                              Stem Cells and Regenerative Medicine

                                    megakaryocyte, and erythroid progenitors in vivo (Grinenko et al., 2018). Together, these findings
                                    not only questioned the necessity for HSCs to undergo asymmetric division, but they also queried
                                    the explicit link between division and differentiation. Evidence for the multi-potency of HSCs and
                                    MPPs has historically derived from in vitro colonies assays and transplantation experiments
                                    (Morrison and Weissman, 1994; Osawa et al., 1996; Nakahata and Ogawa, 1982;
                                    Christensen and Weissman, 2001). Recent single-cell transplantation and cellular barcoding experi-
                                    ments have revealed that only a few HSCs reconstitute all of the blood lineages, with the rest being
                                    either restricted in the number of lineages they produce (Yamamoto et al., 2013; Sanjuan-
                                    Pla et al., 2013; Rodriguez-Fraticelli et al., 2018; Carrelha et al., 2018) or having a bias or imbal-
                                    ance in the proportion of cell types they create (Dykstra et al., 2007; Mu€ller-Sieburg et al., 2004).
                                    As examples of lineage restriction, it has been reported that some HSCs produce only megakaryo-
                                    cytes (Rodriguez-Fraticelli et al., 2018; Carrelha et al., 2018), while others produce only myeloid
                                    cells, megakaryocytes, and erythrocytes (Yamamoto et al., 2013). Furthermore, single-cell trans-
                                    plantations have revealed that HSCs are heterogeneous in differentiation and proliferative output
                                    (Benz et al., 2012; Mu€ller-Sieburg et al., 2002; Sieburg et al., 2011), and transplantation experi-
                                    ments using populations of HSCs labeled with different fluorescent proteins have suggested that
                                    this heterogeneity might be epigenetically determined (Vwc et al., 2017). Taken together, HSCs
                                    have been shown to be a heterogeneous population, where each one of them may be committed to
                                    the production of only a few lineages, possibly through lineage priming or externally through instruc-
                                    tion from a niche. Similarly, transplanted barcoded MPPs have been reported to produce heteroge-
                                    neous patterns of restricted cell types (Naik et al., 2013), suggesting that lineage restriction may
                                    occur early in the hematopoietic tree, in the pool of HSCs and MPPs (Perié and Duffy, 2016).
                                        Altogether, it is presently unclear how symmetric and asymmetric division combines with early
                                    lineage commitment to generate downstream diversity, and a fundamental question is how much
                                    instruction is inherited by offspring from an ancestral HSC or MPP. That matter has not been
                                    addressed previously due to technical limitations. Tackling it requires an experimental system that
                                    enables the simultaneous identification of cells that are descendent from a common ancestor, the
                                    number of divisions that has led to each of them, and their differentiation status. Towards that end,
                                    we developed a division-dye multiplex system (Horton et al., 2018) for the study of hematopoietic
                                    system.
                                        The data from our study revealed that cells that derived from a common ancestor were highly
                                    concordant in their division progression and similar in their differentiation pattern. This similarity is
                                    primarily propagated through divisions resulting in siblings of the same cell type. These data estab-
                                    lish that early lineage commitment can be inherited from individual HSCs and MPPs, and that the
                                    resulting diversity of lineages is produced by a heterogeneous collection of cell families that are indi-
                                    vidually homogeneous. Our data suggests that common ancestor effects are significant and call for a
                                    revision of the assumption of independent fate decisions by cells along the hematopoietic tree.

                                    Results
                                    High-throughput simultaneous tracking of the common ancestor,
                                    number of divisions, and differentiation status of HSPCs
                                    Defining a family as all descendants from an individual marked ancestor cell, we developed a new
                                    high-throughput method that simultaneously determines for each cell’s family membership, genera-
                                    tion (i.e., number of cell divisions), and phenotype (Horton et al., 2018Figure 1) in hematopoietic
                                    stem cells and progenitors (HSPCs). We focused our investigation on familial division and differentia-
                                    tion in early hematopoietic differentiation to elucidate how symmetric and asymmetric fates combine
                                    with early lineage commitment to generate downstream diversity and how much instruction is inher-
                                    ited by offspring from single ancestral HSPC.
                                       To this end, we isolated bone marrow (BM) cells, labeled them with four distinguishable combina-
                                    tions of 5-(and 6)-carboxyfluorescein diacetate succinimidyl ester (CFSE) and CellTrace Violet (CTV),
                                    and used fluorescent antibody staining of cell surface markers to determine three HSPC populations,
                                    c-Kit+Sca-1+CD150+Flt3- (SLAM-HSC), c-Kit+Sca-1+CD150-Flt3- (ST-HSC), and c-Kit+Sca-1-
                                    +
                                      CD150-Flt3+ (MPP) (Figure 1). Wells in a 96-well plate were then seeded with four cells of a single
                                    ancestral type (SLAM-HSC, ST-HSC, or MPP), one from each of the four CFSE/CTV combinations to

Tak, Prevedello, et al. eLife 2021;10:e60624. DOI: https://doi.org/10.7554/eLife.60624                                                2 of 21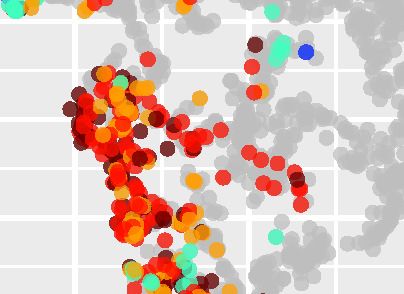
Research article Stem Cells and Regenerative Medicine
Cell staining and sor!ng Analysis
Isolate c-Kit+ An!body
BM cells staining & Concatenate data
measure on
An!body FACS
staining
[CTV] µM 2.5 2.5 1.25 0 Set differen!a!on gates Set genera!on gates
[CFSE] µM 0 1.25 2.5 2.5 5 5 5
10 10 10
CellTrace SLAM+
c-Kit (CD117)
Flt3 (CD135)
staining 10
4
10
4
MPP /FLT3+
10
4
CFSE
3
10
3
3 10
10
2
10
5 5 0
10 10 0
C-Kit (CD117)
MPP
0
Flt3 (CD135)
LSK ST-HSC SLAM-HSC
4 4 2 3 4 5
10 10 3 4 5 3 4 5 0 10 10 10 10
0 10 10 10 0 10 10 10
SLAM- Sca-1 (Ly6A/E) SLAM (CD150) CellTrace Violet
HSC
FcγRII/III (CD16/32)
3 3
10 10
5 5
10 10
0 0
ST-HSC 4
GMP 4 40
10 10
40
30
30
3 3 4 5 4 5
-10 0 10 10 10 0 10 10
Sca-1 (Ly6A/E) SLAM (CD150) 10
3
PreMegE 10
3 20
10
20
10
0 0
2 2
10 10 2 3 4 5 2 3 4 5
0 10 10 10 10 0 10 10 10 10
CFSE CTV/CFSE
0 0
-10
2 CMP/MEP -10
2
3 3 4 5 3 50 3 4 5 60
-10 0 10 10 10 -10 0 10 10 10
SLAM (CD150) 40
30
40
FcγRII/III (CD16/32)
20
5
10
lateMP 20
CFSE
10
0 0
2 3 4 5 2 3 4 5
4 0 10 10 10 10 0 10 10 10 10
10
CTV CFSE/CTV CellTrace Violet
3
10
Index sort 1 cell of
each color per well
2
10
0
2 c-Kit- Apply gates to data from
-10
Culture -10
3
0 10
3
10
4
10
5
each single-cell culture well
TPO/SCF SLAM (CD150)
+/-IL-3/6
Figure 1. High-throughput simultaneous division and differentiation tracking per ancestor. A single-cell suspension was obtained by flushing femurs,
tibia, and iliac crests. Cells were stained with fluorescently labeled antibodies for phenotypic identification. After this first antibody staining, the cell
suspension was then split into four equal parts, each of which was stained with a distinct 5-(and 6)-carboxyfluorescein diacetate succinimidyl
ester (CFSE) and CellTrace Violet (CTV) combination. From each of these CTV/CFSE preparations, a single cell was index sorted into 90 wells of a 96-
well plate, resulting in four distinctly CTV/CFSE-colored cells per well. In addition, for each ancestor type, a small bulk of 100 cells of each color
combination were sorted into a single well as a control. After 24 or 48 hr of culture, cells were stained with fluorescently labeled antibodies for
phenotypic identification and analyzed on a flow cytometer. The data from all wells and the small 100 cell bulks were combined and used to set gates
for determination of generation number and phenotypic cell type. Those gates were then applied to the data from each well to obtain lineage, division,
and differentiation information for each cell.
The online version of this article includes the following source data for figure 1:
Source data 1. Cell type assignment based on cell surface marker.
increase the throughput of the assay, and incubated in one of two classic cytokine cocktails (SCF and
TPO, ±IL-3 and IL-6). At 24 or 48 hr, cells were harvested from each well and stained with fluorescent
antibodies to determine their phenotypic cell type based on the expression of CD150, Flt3, Sca-1,
c-Kit, and CD16/32 (Figure 1). By examining each cell’s CFSE and CTV profile, its ancestral cell and
generation number was determined (Figure 1 and Materials and methods). By index sorting labeled
cells, we could relate downstream familial fate and division to ancestral cell surface expression.
The method allows easily to assess a large collection of single ancestor cells. For each ancestor
type, 360 initial cells were sorted for analysis at 24 hr and 240 initial cells for analysis at 48 hr
Tak, Prevedello, et al. eLife 2021;10:e60624. DOI: https://doi.org/10.7554/eLife.60624 3 of 21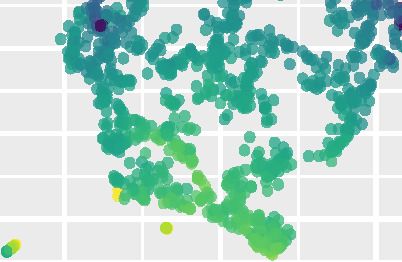
Research article                                                                                                                                                                                                                                                                                             Stem Cells and Regenerative Medicine

   A                                                SLAM-HSC                                                                                                                            ST-HSC                                                                                                       MPP
                                      24 h                                           48 h                                                                      24 h                                                48 h                                                                    24 h                      48 h
                                  -             +                    -                                +           IL3/6                                    -       +                                -                                +               IL3/6                             -       +          -                       +              IL3/6

                                                                                                                                                                                                                                                                                                                     01 2     3       4          5 6
                                                                                                                                                                                                                                                                                                    01 2 3 45

                                                                                                                                                                                                                   01 2          3           4        56
                                                                                                                                                                                                                                                                      012
                                                        01 2             3 46
                                                                                                                                                                                        01 2            3 4
     Family

                                                                                    01 2      3               4     56                                                                                                                                                                      01 2

                                                                                                                                                                                                                                             Cell type
                                                                                                                                                                                                                                                SLAM-HSC                                        SLAM+Flt3+            GMP
                              0123                                                                                                                    0123
                                                                                                                                                                                                                                                ST-HSC                                          CMP/MEP               lateMP
                                                                                                                                                                    0123                                                                        MPP                                             PreMegE               c-Kit-
                                           01 23

                                                    Generation
   B                                                                                                                                                                  C                                                                                      D 100                                 n.s.              p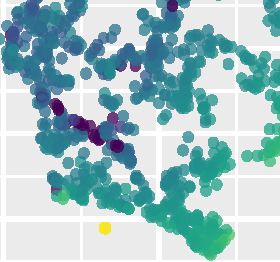
Research article                                                                                       Stem Cells and Regenerative Medicine

Figure 2 continued
number of each recovered cell, with their phenotypic cell type indicated by color coding. Rows are sorted in increasing order of the difference between
maximum and minimum generations in each ancestor’s family (generational range). (B) To test the differentiation pattern of our cell phenotypes after
culture, sorted cell types as shown in Figure 1 were cultured in methylcellulose cultures and evaluated for colony forming units (CFUs) formation for
megakaryocytic (MK), granulocytic/monocytic (GM), erythroid burst-forming (BFU-E), or mixed colony formation of all types (CFU-MK, CFU-GM, and
BFU-E) with or without MK. Late MP did not produce any colonies in methylcellulose culture (C) The percentages of MK, CFU-MK, and mixed colony
formation are indicated from the culture in serum-free fibrin clot. GMP did not produce any colonies as expected. (D) Percentage of each recovered cell
type. (E) Distribution of the maximum generation per family, as indicated by color coding. (F) Proportions of recovered cell types for ancestors that have
not yet divided. (G) For ancestors that have divided only once and for whom two offspring are recovered, percentage having symmetric and asymmetric
fates with and without differentiation. (H) Percentage of families with each generational range. The 48 hr data (red bars) is compared to a mathematical
model parameterized by a single coefficient, r, which encodes the correlation in whether cells in the same generation within a family divide or cease to
divide (Materials and methods). Shown is prediction for both the maximum likelihood best-fit value of r (value and blue/white bars) and, as a reference,
a range of other values of r (solid blue bars). For (D–H), error bars indicate 95% confidence intervals calculated via basic bootstrap
(Materials and methods). Sample sizes and p-values (from permutation tests, see Materials and methods) from the panels can be found in Figure 2—
source data 1 and 2.
The online version of this article includes the following source data and figure supplement(s) for figure 2:
Source data 1. Number of families per progenitor and condition.
Source data 2. Significance values from permutation testing procedures.
Figure supplement 1. Cloning efficiency.
Figure supplement 2. Fluorescence from antibody staining is not retained during culture.
Figure supplement 3. Proportions of recovered cell types for ancestors that have divided only once.

                                     (Figure 2A). From the 600 seeded SLAM-HSCs, we recovered 358 families (71%) constituting 648
                                     cells, while 343 ST-HSC families (69%) were recovered with 592 cells, and 246 MPP families (49%)
                                     with 362 cells (Figure 2A). Over all conditions, 27 families (2.8% of recovered families) had cell num-
                                     bers that could not have originated from a single ancestor, and so were excluded from analysis, illus-
                                     trating the fidelity of the single-cell sorting.

                                     Characterization of differentiation outcomes at the population level
                                     At the population level, some offspring underwent no differentiation from their ancestor type while
                                     others differentiated. In both culture conditions and for each ancestor type, we obtained a diversity
                                     of myeloid cell types ranging from the initial ancestor to c-Kit- differentiated cells, including c-Kit+-
                                     Sca-1-CD16/32+ (GMP), c-Kit+Sca-1-CD150-CD16/32- (CMP/MEP), c-Kit-CD16/32+ (late myeloid pro-
                                     genitor, late MP), and c-Kit-CD16/32 cell types (Figure 2A). We also detected c-Kit+Sca-1-CD16/
                                     32CD150+ (PreMegE) cells, previously described as megakaryocyte and erythroid progenitors
                                     (Pronk et al., 2007). As the phenotypic definitions we used after culture were originally defined on
                                     freshly isolated progenitors, we functionally tested the differentiation of the progenitors as defined
                                     phenotypically after 48 hr of culture with SCF, TPO, IL-3, and IL-6 using semi-solid cultures
                                     (Figure 2B, C and Figure 2—figure supplement 1) and observed a similar differentiation outcome
                                     as previously published (Pronk et al., 2007).
                                        Although all hematopoietic cells have been reported to go through a Flt3 expressing stage
                                     (Boyer et al., 2011), we found that no offspring of SLAM-HSCs, and those of very few ST-HSCs, dif-
                                     ferentiated into Flt3 expressing MPPs in our culture conditions (Figure 2D). Some ST-HSC and MPP
                                     acquired CD150 expression after culture, making them resemble SLAM-HSCs, but this was not fur-
                                     ther investigated. This CD150 expression cannot be due to residual fluorescence from antibodies
                                     used for cell sorting as no fluorescence was measured for any of the markers in cells kept for 24 hr in
                                     culture after sorting without further antibodies staining (Figure 2—figure supplement 2). The addi-
                                     tion of IL-3 and IL-6 had no impact on the pattern of cell types produced by SLAM-HSCs
                                     (Figure 2D). It did, however, change the pattern of cell types produced by ST-HSCs and MPPs in a
                                     statistically significant way as determined by a permutation test (Materials and methods), with an
                                     increased number of early progenitors as opposed to more differentiated progenitors as previously
                                     shown (Lui et al., 2014).

Tak, Prevedello, et al. eLife 2021;10:e60624. DOI: https://doi.org/10.7554/eLife.60624                                                            5 of 21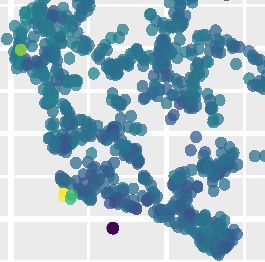
Research article                                                                               Stem Cells and Regenerative Medicine

                                    Heterogeneity between HSPC families in division and differentiation
                                    At the level of individual families, we observed substantial heterogeneity in division history
                                    (Figure 2E) from families that did not proliferate to those with cells that had undergone six divisions.
                                    Consistent with earlier observations (Roch et al., 2017), after 24 hr most cells either remained undi-
                                    vided or had divided once, with a few cells having undergone two or more divisions (Figure 2A). At
                                    48 hr, over 90% of the cells had undergone at least one division. For all three sorted ancestor cell
                                    types, we found that addition of IL-3 and IL-6 led to a statistically significant increase in proliferation
                                    (Figure 2E), as previously described (Domen and Weissman, 2000; Bordeaux-Rego et al., 2010).
                                    Exploring the relationship between division and differentiation, in the culture without IL-3 and IL-6,
                                    the proportion of undivided ancestors that differentiated were 36.5% from SLAM-HSCs, 61.1% from
                                    ST-HSCs, and 35.6% from MPPs (Figure 2F), which was in agreement with previous reports
                                    (Roch et al., 2015; Grinenko et al., 2018). The addition of IL-3 and IL-6 did not drastically change
                                    those values. SLAM-HSCs preferentially differentiated without dividing into PreMegEs, as reported
                                    previously (Grinenko et al., 2018). On comparing the surface marker expression of differentiated
                                    and not-differentiated non-divided cells (Figure 2—figure supplement 3), Sca-1high SLAM-HSCs
                                    were more likely not to differentiate, in agreement with a previous report (Schulte et al., 2015). The
                                    addition of IL-3 and IL-6 only significantly impacted the differentiation pattern of the progeny of
                                    MPPs. These results show that families are heterogeneous in their division pattern, and that a non-
                                    negligible fraction of ancestors differentiates without dividing.

                                    Both symmetric and asymmetric fate occurred within families after the
                                    first division
                                    Our experimental system can capture a large number of siblings after a single division, enabling the
                                    quantification of symmetric versus asymmetric fates. We defined four distinct types of symmetric or
                                    asymmetric fates depending on whether the offspring included a differentiated cell (Figure 2G). A
                                    symmetric undifferentiated fate produces two cells of the ancestor type. An asymmetric undifferenti-
                                    ated fate, which would be the classically defined asymmetric fate in the stem cell community, produ-
                                    ces one cell of the ancestor type and one differentiated cell. Similarly, a symmetric differentiated
                                    fate produces two cells of the same differentiated type, and an asymmetric differentiated fate pro-
                                    duces two cells of the distinct differentiated type. Note that an asymmetric fate cannot be distin-
                                    guished from a symmetric fate followed by differentiation without division of one of the daughter
                                    cells. Pooling data over ancestor types, 70.7% of the cells had a symmetric fate after their first divi-
                                    sion, with the fate of MPPs being mostly symmetric undifferentiated (51.4%), and of ST-HSC being
                                    mostly symmetric differentiated (59.5%). SLAM-HSCs self-renewed with symmetric undifferentiated
                                    fates (32.1%), but also with asymmetric undifferentiated fates (10.7%). Asymmetric fates occurred for
                                    28.6% of SLAM-HSCs, 28.6% of ST-HSCs, and 31.4% of MPPs, consistent with previous
                                    reports (Suda et al., 1984). No statistical difference was found between ancestors cultured with or
                                    without IL-3 and IL-6. The pattern of cell types produced after one division (Figure 2 and Figure 2—
                                    figure supplement 3B) was similar to the pattern including all divisions (Figure 2D), suggesting that
                                    the diversity of cell types can be produced by a heterogeneous collection of cell families through
                                    symmetric fates.

                                    HSPC family members were concordant in division
                                    To investigate familial effects on division progression, we examined the generation numbers of cells
                                    derived from single ancestors. We found that families are highly concordant, with 81% of the 223
                                    families that divided more than once having all of their cells in the same generation (range = 0,
                                    Figure 2H), and only four of those families (1.8%) containing cells that were more than one genera-
                                    tion apart (range >1, Figure 2H). As not all cells are necessarily recovered from wells and sampling
                                    effects could potentially make families look more concordant, a mathematical model that accounts
                                    for that sampling was fitted to the 48 hr data to estimate the correlation in division progression deci-
                                    sions among cells within a family (Materials and methods). High correlation coefficients (70–90%)
                                    (Figure 2H) resulted in the best fit to the measured familial ranges, with the exception of MPPs cul-
                                    tured in medium without IL-3 and IL-6 for which no reliable estimate could be made. For guidance,
                                    the pattern of range values from the model for different correlation coefficients is also illustrated in

Tak, Prevedello, et al. eLife 2021;10:e60624. DOI: https://doi.org/10.7554/eLife.60624                                                  6 of 21
Research article Stem Cells and Regenerative Medicine
Figure 2H. Thus, this analysis establishes that division progression is highly concordant within SLAM-
HSC, ST-HSC, and MPP families, while being heterogeneous between them.
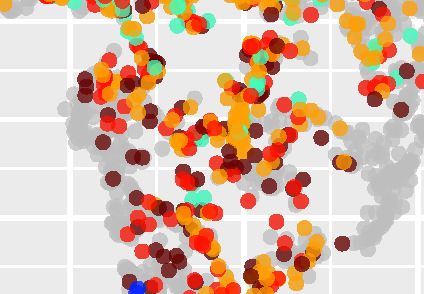
Differentiation occurred though a diversity of paths and progressed
with division
Although differentiation without division was observed, in general differentiation progressed in tan-
dem with division (Figure 3A), as published previously (Upadhaya et al., 2018). To visualize changes
in cell surface marker expression, we used the Uniform Manifold Approximation and Projection
(UMAP) algorithm (McInnes and Healy, 2018) on the combined surface marker expressions of all
cells obtained at both 24 and 48 hr (Figure 3B and Figure 3—figure supplement 1). When we
mapped cell types determined by traditional gating onto the UMAP (Figure 3C), a smooth transition
was observed from SLAM-HSCs at the bottom, with further differentiated cells towards the top, indi-
cating a gradual transition from one cell type to another. GMPs and c-Kit-Sca-1-CD16/32+ (myeloid
progenitors [MPs]) appear on the top left, and CMP/MEP and PreMegE on the top right. More
numerous GMPs, MPs, and CMP/MEPs were seen at the top of the UMAP at 48 hr than 24 hr, sug-
gesting that it takes between 24 and 48 hr to fully differentiate into Sca1- progenitors. In addition,
all three ancestral cell types remain present at 48 hr, demonstrating, in particular, that HSCs can
remain in an undifferentiated state for the duration of the experiment, even if their offspring experi-
ence three rounds of division. On plotting the generation numbers of offspring from each ancestor
cell type on the UMAP (Figure 3D and Figure 3—figure supplement 2), SLAM-HSCs appeared to
be primed towards the production of CMP/MEPs and PreMegEs while still generating some ST-
HSCs, whereas MPPs were more primed towards GMPs, and ST-HSCs showed a more even distribu-
tion between the two lineages. Differentiation without proliferation appeared as dark red dots out-
side of the regions of the sorted ancestor cells, and self-renewal divisions as red, orange, and blue
dots in the region of ancestor cells. PreMegEs were observed to be generated without division, as
well as in 1–3 divisions from SLAM-HSCs.
HSPC family members displayed similar differentiation outcome
Descendants from a common ancestor were not only highly concordant in their generation numbers,
but they also exhibited significant similarity in differentiation outcome. At 24 hr, most families were
composed of only one cell type (Figure 4A), but at 48 hr more families produced several cell types
(Figure 4B), indicating that downstream asymmetries in the fate occur after a largely symmetric first
division (Figure 2G). Permutation tests on phenotypically defined cell types revealed that families
exhibited significantly more similarity than would be expected if there was no family component,
both at 24 hr (Figure 4A) and at 48 hr (Figure 4B). This within-family similarity in fate is visible by
the co-localization of cells from the same family on the UMAP (Figure 4C). Thus, SLAM-HSC, ST-
HSC, and MPP families are highly concordant in division and share similar differentiation outcomes
in vitro, while population-level diversity in proliferation and cell types arises from heterogeneity
across families.
The within-family homogeneity in division and differentiation could be intrinsically present in
ancestor cells or extrinsically instructed by cytokines in the cocktail. Comparison of the median fluo-
rescent intensities of markers from ancestors during sort with those obtained from daughters at
each of the two time points (Figure 4—figure supplement 1A) revealed clear correlation between
the two, supporting the hypothesis that ancestor surface expression markers were instructive in the
within-family homogeneity in division progression and differentiation. To further investigate that
hypothesis, we first explored the relationship between cell surface expression on the ancestor and
division progression. Rank ordering ancestors from the least to greatest expression level for a given
marker (Figure 4D, Figure 4—figure supplement 1B), the cumulative sum of the maximum division
of their offspring would be expected to fall near the diagonal if there were no relationships between
an ancestral expression level and division progression. If there was a negative relationship, where
low expression of a given marker on the ancestor corresponded to more division progression, the
cumulative sum of the maximum division would be expected to initially overshoot above the diago-
nal. The contrary would happen if there was a positive relationship. The statistical significance of
divergence from the diagonal was tested using Jonckheere’s trend test (Figure 4—source data
1). Across both cocktails and time points, only cell surface markers on ancestral SLAM-HSCs were
Tak, Prevedello, et al. eLife 2021;10:e60624. DOI: https://doi.org/10.7554/eLife.60624 7 of 21Research article Stem Cells and Regenerative Medicine
SLAM-HSC ST-HSC MPP Cell type
SLAM-HSC
ST-HSC
MPP
Cells (%)
Cells (%)
SLAM+Flt3+
Cells (%)
PreMegE
CMP/MEP
GMP
lateMP
c-Kit-
B c-Kit Sca-1 SLAM
log10 log10 log10
(FI) (FI) (FI)
5 5 5
4 4
4
3 3
3 2
2
2 1
1
0
1 0
Flt3 CD48 CD16/32
log10 log10 log10
(FI) (FI) (FI)
5 4 5
4
4 3
3
3 2
2
2 1 1
UMAP2
0
UMAP1
C 24 & 48 h 24 h 48 h
Cell type
SLAM-HSC
ST-HSC
MPP
SLAM+Flt3+
PreMegE
CMP/MEP
GMP
lateMP
c-Kit-
UMAP2
UMAP1
D SLAM-HSC ST-HSC MPP
Generation
0
1
2
3
4
5
6
UMAP2
UMAP1
Figure 3. Differentiation and division progress in tandem. (A) Percentage of cells at each differentiation stage for each generation for each ancestor
type. Error bars indicate basic bootstrap 95% confidence intervals (Materials and methods). Sample sizes for this panel can be found in source data. (B)
The Uniform Manifold Approximation and Projection (UMAP) algorithm was applied to the phenotypic data pooled from all time points, conditions,
and ancestor cell types. Each cell is projected into the UMAP coordinates and color-coded according to the log of their fluorescence intensity for c-Kit,
Figure 3 continued on next page
Tak, Prevedello, et al. eLife 2021;10:e60624. DOI: https://doi.org/10.7554/eLife.60624 8 of 21Research article Stem Cells and Regenerative Medicine
Figure 3 continued
Sca-1, CD150, Flt3, CD48, and CD16/32 at the time of analysis (see also Figure 3—figure supplement 2; and for each ancestor cell type plotted
separately on the UMAP, see Figure 4—figure supplement 1). (C) Projection of traditionally gated data onto the UMAP, pooled data (left), 24 hr
(middle), and 48 hr (right). (D) Projection of cell generation number data onto the UMAP for each ancestor type (see also Figure 3—figure supplement
3). Sample sizes for panel (A) can be found in Figure 3—source data 1.
The online version of this article includes the following source data and figure supplement(s) for figure 3:
Source data 1. Number of cells per generation from a given progenitor.
Figure supplement 1. Additional information plotted onto the differentiation of Uniform Manifold Approximation and Projection (UMAP).
Figure supplement 2. Generation numbers projected onto the Uniform Manifold Approximation and Projection, fractionated by ancestor type and
time point.
Figure supplement 3. Per ancestor type fluorescence intensities during sort projected on the Uniform Manifold Approximation and Projection.
consistently instructive for division progression. CD48 correlated positively, with its strongest effect
at 24 hr, and Sca-1 correlated negatively, while at 48 hr c-Kit correlated positively (Figure 4D, Fig-
ure 4—figure supplement 1B, and Figure 4—source data 1). Notably, for both ST-HSCs and
MPPs, even though the family data clearly indicate that there is a familial component to division pro-
gression (Figure 2H), none of the phenotypic markers exhibited strong correlation (Figure 4—figure
supplement 1B), indicating the need to identify other markers.
Ancestral phenotype correlated with familial differentiation outcome
We then explored the relationship between fluorescence intensity of ancestral marker expression
and familial differentiation (Figure 4E, Figure 4—figure supplement 2, and Figure 4—source data
2 and 3; for a summary of findings in table format, see Figure 4—source data 4). For SLAM-HSCs,
at 24 and 48 hr in both cocktails, Sca-1 expression provided a strong positive correlation to self-
renewal and a negative one to production of PreMegE. At 48 hr, c-Kit presented the inverse depen-
dency to Sca-1. At 24 and 48 hr, CD48 correlated negatively to self-renewal and positively to pro-
duction of PreMegE when IL-3 and IL-6 are added. As cocktail composition did not have a major
impact on the relationship between familial fate and ancestral expression, these results were sugges-
tive that c-Kit and Sca-1 expression levels of SLAM-HSCs act as intrinsic markers for both familial
progression and differentiation with high Sca-1 expression and low c-Kit expression leading to less
division (Wilson et al., 2015; Grinenko et al., 2014; Morcos et al., 2017) and less differentiation
(Shin et al., 2014), and potentially resulting in better engraftment (Wilson et al., 2015;
Grinenko et al., 2014; Shin et al., 2014). While low ancestral CD48 expression level has been
reported to result in less division (Pietras et al., 2015; Akinduro et al., 2018), our data indicates its
relationship to differentiation is dependent on extrinsic signals.
For ST-HSCs and MPPs, we found little evidence of correlation of ancestral expression to division
progression or self-renewal, but the same was not true of differentiation. For ST-HSCs, the ancestral
level of CD48 and Sca-1 consistently correlated negatively and positively, respectively, with de-dif-
ferentiation to SLAM-HSC in the cocktail with IL-3 and IL-6 at both time points (Figures 4E and Fig-
ure 4—figure supplement 2). Differentiation to GMP, which occurred only in 48 hr data, correlated
positively and negatively with the ancestral level of CD48 and Sca-1, respectively (Figure 4E;
Morcos et al., 2017). Therefore, differentiation to GMP from ST-HSC was dependent on the paren-
tal level of CD48 and Sca-1, whereas the de-differentiation to SLAM-HSC is dependent on both
extrinsic factors (IL-3 and IL-6) and the intrinsic ancestral level of CD48 and Sca-1. The differentiation
from MPPs to GMPs that was observed to occur by 48 hr correlated negatively with Sca-1 ancestral
expression (Morcos et al., 2017) in both cocktails. It also negatively correlated with Flt3 ancestral
expression, but only in the cocktail without IL-3 and IL-6 (Figure 4E). In the presence of IL-3 and IL-
6, instead, differentiation from MPP to GMP positively correlated with c-Kit ancestral expression. Dif-
ferentiation from MPP to CMP/MEP occurred only at 48 hr in the cocktail without IL-3 and IL-6, and
then correlated positively with c-Kit (Figure 4E). Thus, differentiation to GMP from MPP is depen-
dent on the intrinsic ancestral level of Sca-1, whereas the differentiation to CMP/MEP is dependent
on both extrinsic factors (IL-3 and IL-6) and the intrinsic ancestral level of c-Kit. Overall, the concor-
dance in division and similarity in fate within families is partially explained by the surface expression
marker used to phenotype ancestors, but both intrinsic and extrinsic factors act to direct familial
fate.
Tak, Prevedello, et al. eLife 2021;10:e60624. DOI: https://doi.org/10.7554/eLife.60624 9 of 21Research article Stem Cells and Regenerative Medicine
A 24h C
pResearch article Stem Cells and Regenerative Medicine
Figure 4 continued
rank-ordered by their expression level (fluorescence intensity) of CD48 (blue) or Sca-1 (red) during sort. (E) The cumulative percentage of offspring,
presenting a given cell type, from ancestor cells rank-ordered by increasing cell surface marker expression. * indicates a significant deviation from the
diagonal (black) as determined by Jonckheere’s trend test (p-values in Figure 4—source data 1). Sample sizes for all panels can be found in
Figure 4—source data 2.
The online version of this article includes the following source data and figure supplement(s) for figure 4:
Source data 1. Significance values from the Jonckheere’s rend test between expression levels at sort and offspring maximum generation as shown in
Figure 4D.
Source data 2. 95% confidence intervals of Spearman r and p-values of correlations.
Source data 3. Significance values from the Jonckheere’s trend test between expression levels at sort and presence of a given cell type among offspring.
Source data 4. Summary of significant findings as shown in Figure 4E.
Figure supplement 1. fluorescence intensity correlation within families and correlation with division for additional markers and ancestor types.
Figure supplement 2. The cumulative sum of the offspring presenting a given cell type from ancestor cells rank-ordered by cell surface marker
expression as in Figure 4E, without normalizing the offspring count, and plotted for each ancestor cell type, time point, culture condition, and marker.
Discussion
We developed a high-throughput method that enables simultaneously determination of common
ancestor, generation, and differentiation status of a large collection of single cells. Its use with
HSPCs revealed that despite substantial population-level heterogeneity amongst offspring cells
derived from a single ancestor are highly concordant in their division progression and exhibit familial
effects on differentiation. The restriction in differentiated cell types within each family is propagated
primarily through symmetric first divisions. Although each family is composed of several cell types,
the overall collection of cell types observed in a population is composed of homogeneous families
from heterogeneous ancestors. This finding opens new avenues and challenges for the hematopoi-
etic field. The generation of a diversity of cell types is presently assumed to result from a diversifica-
tion within every family, and methods for inferring differentiation trajectories using single-cell RNA
sequencing data from snapshot data assume that cells all behave independently (Trapnell et al.,
2014; Bendall et al., 2014). Consistent with previous observations of early lineage priming (Mu€ller-
Sieburg et al., 2002; Perié and Duffy, 2016; Paul et al., 2016; Hoppe et al., 2016), our findings
establish that familial dependencies that are currently unmeasured exist within the population and
call for a revision of the assumption of independent fate decision by cells along the hematopoietic
tree. Ancestral cell surface expression of markers used for phenotyping serves as correlates that par-
tially predict some of these familial properties, but, in particular, a correlate that explains the highly
heritable division progression of ST-HSC and MPP families is not contained within them. It is also the
case that extrinsic properties such as cytokine signaling can play an instructive role, altering and
reshaping the observed familial effects.
As HSPCs are cultured before BM transplantation in gene therapy, our results indicate that the
broad range of engraftment and proliferation capacities of HSPCs could be consequences of the
heterogeneity in their engrafted families. That suggests that altered culture conditions might reduce
or enhance heterogeneity between families and possibly improve transplantation outcomes if this
leads to more self-renewal divisions. Indeed, changing the composition of the population of commit-
ted HSPC might be a mechanism to directly alter the balance of lineage production, with therapeutic
applications that could benefit the treatment of leukemia and genetic immune disorders.
Materials and methods
Mice and cell isolation
All the experimental procedures were approved by the local ethics committee (Comité d’Ethique en
expérimentation animale de l’Institut Curie) under approval number DAP 2016 006. BM cells were
obtained from wild-type C57BL/6 of 8–16 weeks of age by bone flushing of femur tibia and iliac
crest. BM cells were MACS enriched for c-Kit+ cells using CD117 MicroBeads Ultrapure (Miltenyi Bio-
tec cat #130-091-224) according to the manufacturer’s protocol.
Division tracking and surface marker labeling of HSPC c-Kit-enriched BM cells were stained with
CD135 (Flt3) PE (eBiosciences 12-1351-82), Sca-1 PE-CF594 (BD Biosciences, 562730), CD117 (c-Kit)
Tak, Prevedello, et al. eLife 2021;10:e60624. DOI: https://doi.org/10.7554/eLife.60624 11 of 21Research article Stem Cells and Regenerative Medicine
APC (Biolegend 105812), CD150 (SLAM) PC7 (Biolegend 115914), and CD48 APC-Cy7 (Biolegend
103432) in RPMI1640 supplemented with 10% FCS. Subsequently, cells were stained in PBS with
either 2.5 mM CellTrace CFSE (ThermoFisher Scientific C34554), 2.5 mM CTV (ThermoFisher Scientific
C34557), and 2.5 mM CFSE together with 1.25 mM CTV or 2.5 mM CTV together with 1.25 mM CFSE
(see Figure 1A) as adapted from.
Single c-Kit+Sca-1+CD150+Flt3- (SLAM-HSC), c-Kit+Sca-1+CD150-Flt3- (ST-HSC), and c-Kit+Sca-
1 CD150-/Flt3+ (MPP) were sorted directly into U-bottom 96-well plates containing cell culture
+
media using an Aria III cell sorter (BD Biosciences). For each cell type, we sorted four single cells,
one for each of the CellTrace stain combinations, into each well. Sorting four ancestor cells per well
is a critical step in the method to ensure that at time of analysis there are enough cells in the well,
which could not be obtained when sorting one ancestor cell per well. In total, 30 wells (120 single
cells) were sorted per cell type per plate, with three replicates for analysis at 24 hr and two replicates
for analysis at 48 hr. In addition, we sorted 100 cells of each cell type into one well for both culture
conditions in order to collect enough events for reliable gate definition for cell type and generation
assignment. During the sort of single cells, fluorescence intensities of each surface marker were
recorded using the index sorting function.
In vitro cell culture
Cells were cultured at 37˚C under 5% CO2 in 100 ml of StemSpan serum-free expansion medium
(Stemcell Technologies 9650) supplemented with 50 ng/ml murine recombinant thrombopoietin
(TPO, Sigma-Aldrich SRP3236-10UG) and 100 ng/ml stem cell factor (SCF) or 50 ng/ml TPO, 100 ng/
ml SCF, 20 ng/ml IL-3, and 100 ng/ml IL-6 (Ema et al., 2000; Roch et al., 2017).
Division and expression marker analysis of cell progeny
After 24 or 48 hr of incubation, cells in each well were stained as for sorting except for the use of
CD48 BUV395 (BD Biosciences 740236), Sca-1 APC-Cy7 (Biolegend 108125), and CD16/32 BV711
(BD Biosciences 101337). Cells from each well were analyzed at 4˚C using a ZE5 Flow cytometer (Bio-
Rad) with a recovery estimate of circa 70% per well (beads-based estimate, data not shown).
Cell type and generation assignment
For data analysis of FACS data, we pooled all the data from a single experiment using the concate-
nate function in FlowJo (FlowJo, LLC version 10.4.2). For cell type assignment, gates were set on
concatenated data of both single-cell and bulk sorted samples and then applied to the single-cell
data (Figure 1). Cells were separated from debris by their forward and size scatter (FSC/SSC) profile
and assigned to a cell type (see Figure 1—source data 1). The generation (i.e., the number of divi-
sions since labeling) of cells was determined on histograms of CellTrace dye fluorescence in FlowJo.
For cells stained with both CFSE and CTV, we rotated the CTV/CFSE coordinates, on a logarithmic
scale, by 45˚ degrees anticlockwise so that division dilution proceeded in parallel to the horizontal.
That is, with x and y denoting the coordinates of CTV and CFSE levels, the histogram was calculated
over a new x-axis coordinate
pffiffiffi
0 2ðIn x þ In yÞ
x ¼ : (1)
2
Generation gating was then determined based on the florescence histogram on the new x0 -axis
on the merged data of wells from the same experiment.
Data visualization by UMAP
UMAP (McInnes and Healy, 2018) was performed on arcsinh(x/100) transformed fluorescence inten-
sity values of surface expression markers from all experiments using the R implementation in the
UMAP package (version 0.2.0.0) with default parameters. The UMAP output was visualized using the
ggplot two package (version 3.0.0) in R (version 3.4.3).
Progenitor assays in semi-solid cultures
SLAM-HSC (150–200 cells), MPP (700–1500 cells), CMP/MEP (1000 cells), GMP (300–1000), PreMegE
(1000 cells), and late MP (5000 cells) were plated in duplicate or triplicate in methylcellulose
Tak, Prevedello, et al. eLife 2021;10:e60624. DOI: https://doi.org/10.7554/eLife.60624 12 of 21Research article Stem Cells and Regenerative Medicine
MethoCult 32/34 (Stemcell Technologies) with 10 ng/ml TPO (a generous gift from Kirin, Tokyo,
Japan), 1 U/ml EPO (PreproTech), 10 ng/ml IL-3 (Miltenyi Biotec), 10 ng/ml IL-6 (Miltenyi Biotec),
100 ng/ml SCF (PreproTech), and 20 ng/ml G-CSF (Miltenyi Biotec). Colonies derived from erythroid
progenitors (colony forming unit-erythroid [CFU-E]) were counted after 2 days, but no CFU-E was
detected in any of the cell populations tested. Colonies derived from erythroid progenitors (burst
forming unit-erythroid [BFU-E]), granulo-monocytic (colony forming unit-granulocyte
macrophage [CFU-GM]), and multilineage colonies (mixed) progenitors were counted after 9 days.
For megakaryocytic progenitor (CFU-MK) assay, SLAM-HSC (150–200 cells), MPP (2000 cells), CMP/
MEP (2000 cells), GMP (2000), PreMegE (2000 cells), and late MP (5000 cells) were plated in tripli-
cate in serum-free fibrin clot assays with SCF, IL-6, and TPO. MKs and CFU-MKs were evaluated at
day 7 by acetylcholinesterase staining.
Confidence intervals
The confidence intervals at 95% level shown in Figures 2B–F and 3D were calculated via basic boot-
strap (Davison and Hinkley, 1997) with 250,000 bootstrap datasets. Following this procedure, each
bootstrap dataset is constructed by sampling with replacement as many cellular families
(Figures 2B–H and 3D) as were in the original data. The distribution of the statistics, each calculated
from one bootstrap dataset, then provided a reference from which the confidence interval was
derived. Formally, given the statistic calculated from the original data, and ð0:025Þ and ð0:975Þ the
0.025 and 0.975 percentiles, respectively, derived from the bootstrapped distribution, the confi-
dence interval of at 95% level was calculated as follows:
CI ð95%Þ ¼ 2 ð0:975Þ ; 2 ð0:025Þ
Statistical testing framework
To perform the statistical analysis, we adapted the permutation test (Lehmann and Romano, 2006)
framework proposed in Horton et al., 2018. This framework was preferred over classical statistical
tests as their assumptions were violated by the presence of familial dependencies in the data.
The objective of this framework was to challenge the hypothesis of independence between one
or more variables in the data. For example, to test if the differentiation pattern was changed by cul-
ture conditions in Figure 2D, we challenged the null hypothesis that differentiation pattern per
ancestor type (e.g., SLAM-HSC) was independent of culture conditions. If that null hypothesis held
true, then the pattern of differentiation would not statistically change on swapping families between
the culture conditions. Thus, the first step in the procedure consists in computing a statistic for the
measured data that captures a key characteristic related to the variables to be tested. In this exam-
ple, we chose the statistic to be the G-test statistic (or G-value) for contingency tables
(Lehmann and Romano, 2006); therefore, the differentiation pattern data was transformed into the
cellular frequencies from each cell type (columns) for each culture condition (rows). The second step
is to perform randomization of the data, the permutation, that will be compared to the measured
data. Each randomly selected permutation captures how the data would look if the differentiation
pattern and the culture condition were independently assigned. Indeed, if these two variables were
independent, we could shuffle cellular families between culture conditions and the composition of
the resulting permuted dataset would be statistically similar to the original measured data. If one
shuffled cells instead of families, then any familial dependence of cells would break down and so
interfere with the testing of the independency between the differentiation pattern and the culture
condition. The ability to manage familial dependencies is the reason why this statistical framework is
well suited to these data. In Figure 2D, cellular families derived from the same ancestor type were
permuted between the two culture conditions 250,000 times, and the G-value was then computed
for each permuted dataset. Finally, the proportion of the G-values of the permuted datasets that
were as, or more, extreme than the G-value from the original dataset determined the p-value of the
hypothesis test. This in turn indicated whether the differentiation pattern significantly varied with the
culture condition. In general, for each test performed in this paper, a test statistic and data permuta-
tion class must be defined to characterize the hypothesis to be challenged and to compute the
p-value. Below, a more formal explanation is provided, followed by a paragraph with a description
of the statistics and the permutation strategies specifically used throughout this work.
Tak, Prevedello, et al. eLife 2021;10:e60624. DOI: https://doi.org/10.7554/eLife.60624 13 of 21Research article Stem Cells and Regenerative Medicine
In more mathematical terms, a typical example of permutation testing proceeds in the following
manner. A null hypothesis concerning the independence of the data, D, on one or more variables is
first determined. Then, a collection, Q, of permutations of the data is identified such that, under the
null hypothesis, the permuted data Dp , for any p 2 Q, is equal in distribution to D: In this way, for
any a real-valued statistic T of the data, T ðDÞ and T ðDp Þ are equal in distribution given the data D.
Therefore, the distribution of T ðDÞ, and its associated p-values, can be approximated by the distribu-
tion of fTðDp1 Þ; . . . ; TðDpB Þg, which is obtained by sampling a large number B of permutations pi
from Q, for i ¼ 1; . . . ; B. Of note, the statistic T should be chosen to present good sensitivity with
respect to the departure of the data from the null hypothesis, a property often exhibited by classical
statistics.
To further clarify the framework described above, we make explicit how the null hypothesis of
independence between culture condition and differentiation pattern was challenged in Figure 2D.
Under this hypothesis, the frequencies of cell types from the two culture conditions each from a dif-
ferent cell culture were equal in distribution. In particular, under the null hypothesis the distribution
of the data in each culture condition would not change upon the shuffling of cellular families
between culture conditions, which identifies a suitable set of permutations Q. As the variables to be
tested were either discrete or categorical, the independence of cell-type frequency from the culture
condition was tested selecting T to be the G-test statistic for contingency tables (Lehmann and
Romano, 2006). Following this rationale, the same choice for the set of permutations, Q, and the
test statistics, T, was made to challenge the hypotheses of independence between culture condition
and the other discrete variables: maximum division number per family (Figure 2E), differentiation
pattern without division (Figure 2F), and pattern of first division (Figure 2G).
In Figure 4B, we sought to challenge the null hypothesis that differentiation diversity among cells
from the same ancestor type was independent of familial membership, effectively testing whether a
cell’s familial membership was independent of its type. Under this null hypothesis, the naı̈ve assump-
tion would be to define Q as the set of permutations that swap cells between or within families, but,
as cell type appeared to correlate with cell generation (Figure 3D), permuting cells with different
division number would return a dataset Dp that is not equal in distribution to D, the original.
Leveraging the flexibility of the testing framework, it sufficed to instead restrict the set Q to be per-
mutations that leave the generations of cells unaltered, effectively solely swapping cells (between or
within families) having the same division number. For this test, T was set as the average number of
cell types per family since this statistic is expected to decrease under the alternative hypothesis that
cells with a common ancestor diversify into a smaller collection of cell types.
Finally, we tested whether the ancestor’s expression levels were independent of an ordinal vari-
able of its offspring: division (Figure 4D) and differentiation pattern (Figure 4E). Under each null
hypothesis, Q was defined as the set of permutations of families amongst ancestors, which embodies
the assumption that a family is assigned independently at random to an ancestor. To assess such null
hypothesis when compared against the alternative that the families ranked by their ancestors’
expression levels established a trend (either increasing or decreasing) in the other familial
variable, Jonckheere’s trend test was chosen as the test statistic T.
Statistical testing formulae
To challenge the null hypotheses that differentiation was independent of the culture condition, using
the data underlying Figure 2D we compared the population proportion per cell type. For notational
purposes, the data were represented as a sequence D ¼ ðt i ; ci ; sðci ÞÞNi¼1 of N cells, where the ith cell
was identified by cell type t i , family ci , and culture condition of the family sðci Þ. To assess the inde-
pendence of cell types J ¼ ft i ; i ¼ 1; . . . ; N g from partition labels l 2 f1; . . . ; Lg (relative to culture
condition), the statistic T of the data D was defined as the log-likelihood statistic of the G-test for
the contingency table O, such that Ojl ¼ Ni¼1 ðt i ¼ j; sðci Þ ¼ lÞ with ð AÞ ¼ 1 if the event A holds
P
true and 0 otherwise. The G-test statistic is classically used for the testing of independence between
two sets of categories (J and f1; . . . ; Lg) partitioning the data counts. Therefore,
L X
X Ojl N
T ðDÞ ¼ 2 Ojl In (2)
l¼1 j
Ejl
Tak, Prevedello, et al. eLife 2021;10:e60624. DOI: https://doi.org/10.7554/eLife.60624 14 of 21Research article Stem Cells and Regenerative Medicine
P PL
where Ejl ¼ i2J Oil i¼1 Oji .
Under the null hypothesis that differentiation was not impacted by culture condition, D is equally
likely as a dataset Dp ¼ ðt i ; pðci Þ; sðpðci ÞÞÞNi¼1 transformed by the action of any permutation p 2 Q of
the set of family labels fci ; i ¼ 1; . . . ; N g. As a consequence, using Monte Carlo approximation we
estimated the p-value for the right-tailed test as
B
ðT ðD Þ T ðD p i ÞÞ
P
1þ
i¼1
prB
^ ¼ ; (3)
1þB
where B ¼ 250; 000 and p1 ; . . . ; pB were uniformly and independently sampled from Q.
To challenge the null hypotheses that familial division was independent of the culture condition,
for the data underlying Figure 2E we compared the distribution of the maximum generation
reached by each family. For these procedures, it sufficed to follow the same rationale as for the tests
related to Figure 2D, but for the dataset D ¼ ðt i ; ci ; sðci ÞÞNi¼1 of N families, where t i is the maximum
generation of the i th family. In particular, the testing statistic T was defined as in Equation 2, and
the subsequent p-value was estimated as in Equation 3.
To challenge the null hypotheses that differentiation without division was independent of the cul-
ture condition for the data underlying Figure 2F, we compared the proportions of cell types of undi-
vided cells (i.e., those in generation 0). For these procedures, it sufficed to follow the same rationale
as for the tests related to Figure 2D, E, with D ¼ ðt i ; ci ; sðci ÞÞNi¼1 the sequence of N families in gener-
ation 0, where t i identifies the type of the unique cell in family ci . In particular, the testing statistic
T was defined as in Equation 2, and the subsequent p-value was estimated as in Equation 3.
To challenge the null hypotheses that the pattern of first division was independent of the culture
condition, for the data underlying Figure 2G we compared the proportion of division types among
families recovered with two cells in generation 1. For these procedures, it sufficed to follow the
same rationale as for the tests in Figure 2D–F, with D ¼ ðt i ; ci ; sðci ÞÞNi¼1 as the dataset of N families
with two cells generation 1, where t i records the pattern of division of the family ci as one out of
four possibilities (outlined in Figure 2G). The test statistic T was defined as in Equation 2, and the
subsequent p-value was estimated as in Equation 3.
For the data in a given time point (24 or 48 hr) underlying Figure 4B, we investigated the family
effect on differentiation by challenging the null hypotheses that differentiation diversity among cells
from the same ancestor type was independent of familial membership. In particular, as the cells from
the data were found in different generations, we sought to take into account that division may have
had an impact on differentiation (Figure 3D). These data were identified by the sequence
D ¼ ðt i ; gi ; ci ÞNi¼1 of the N cells from the same progenitor, with t i ; gi ; ci recording the type, the gener-
ation, and the family label, respectively, of the i th cell. To test the null hypothesis by permutation,
the set of invariant transformations Q for D should permute, across families, only cells that were
found in the same generation. To this end, Q was generated by the functions pg
for g 2 G ¼ fgi ; i ¼ 1; . . . ; N g, such that
~
pg ðiÞ if gi ¼ g
p g ði Þ ¼ ; (4)
i otherwise
~ N
where pg is any permutation of the set fi ¼ 1; . . . ; N:gi ¼ gg. Then Dp ¼ t i ; gi ; cpðiÞ i¼1 . To measure
family differentiation diversity, we defined the statistic T for the average number of cell types per
family, that is,
M P
P
j2J ðj 2 T c Þ
TðDÞ ¼ c¼1 ; (5)
M
where f1; . . . ; M g is the set of all family labels, J ¼ ft i :i ¼ 1; . . . ; N g is the set of all cell types observed,
and T c ¼ ft i ; i ¼ 1; . . . ; N:ci ¼ cg. In this case, the alternative hypothesis posited that familial relation-
ship induced a more homogeneous differentiation in terms of cell types, leading to a decreased
Tak, Prevedello, et al. eLife 2021;10:e60624. DOI: https://doi.org/10.7554/eLife.60624 15 of 21You can also read