IDENTIFIED MINERAL RESOURCES 2017 - APO
←
→
Page content transcription
If your browser does not render page correctly, please read the page content below
AU STR ALIA’S
IDENTIFIED
MINERAL
RESOURCES
2017
AU STR ALIA’S
IDENTIFIED
MINERAL
RESOURCES
2017
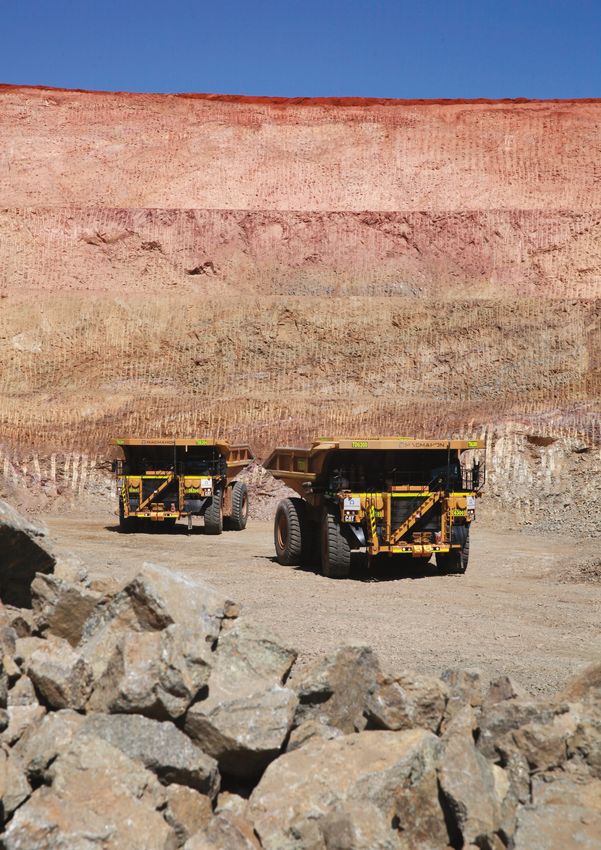
Contact Details
mineral.promotions@ga.gov.au
Department of Industry, Innovation and Science
Minister for Resources and Northern Australia: Senator the Hon Matthew Canavan
Secretary: Dr Heather Smith PSM
Geoscience Australia
Chief Executive Officer: Dr James Johnson
This document is published with the permission of the CEO, Geoscience Australia

© Commonwealth of Australia (Geoscience Australia) 2017.
With the exception of the Commonwealth Coat of Arms and where otherwise noted, this product is provided under a Creative
Commons Attribution 4.0 International Licence.
http://creativecommons.org/licences/by/4.0/legalcode
Geoscience Australia has tried to make the information in this product as accurate as possible. However, it does not guarantee
that the information is totally accurate or complete. Therefore, you should not solely rely on this information when making a
commercial decision.
Geoscience Australia is committed to providing web accessible content wherever possible. If you are having difficulties
accessing this document please email clientservices@ga.gov.au
ISSN 1327-1466
eCat ID: 116001
GA PP-1368

Bibliographical Reference
Britt, A., Summerfield, D., Senior, A., Kay, P., Huston, D., Hitchman, A., Hughes, A., Champion, D., Simpson, R., Sexton, M. and
Schofield, A. Geoscience Australia 2017. Australia’s Identified Mineral Resources 2017. Geoscience Australia, Canberra.
http://dx.doi.org/10.11636/1327-1466.2017

Cover Image
Gold mining in the Havana Pit at Tropicana, Western Australia. Photograph courtesy of AngloGold Ashanti Australia Ltd.

Australia’s Identified Mineral Resources 2017

Minister’s Foreword

By almost any measure, Australia is a world leader in mineral     Government, and the continued optimal management of our
resources. We hold the largest identified resources and are       nation’s valuable mineral resources.
the major producer of many commodities essential to our
                                                                  Although AIMR 2017 tells us Australia has the potential to
everyday lives. We also lead the way internationally in mining
                                                                  continue supplying the world with mineral resources for
innovation and are exporting more mining services around
                                                                  decades to come, the type of world-class mineral deposits
the globe than ever before.
                                                                  that have helped build our nation are not discovered
The importance of mineral resources and the mining industry       overnight. From the first gold rushes of the 1850s to the
sector to our economy, and to regional Australia in particular,   2000s commodities boom, much of our economic prosperity
cannot be overstated. In 2016–17, mineral resources made          has been underpinned by the discovery of world-class
up around 37 per cent of Australia’s exports. Overall, the        mineral deposits. While mineral exploration activity continually
mining industry sector currently accounts for 7.4 per cent of     unearths new deposits, it has been more than a decade since
our gross domestic product. It directly employs approximately     a new tier-one discovery in Australia.
230,000 people in high-value jobs and indirectly supports the
                                                                  To remain internationally competitive as an investment
employment of many more.
                                                                  destination for resource companies, we must continue to
Compiled by Geoscience Australia and its predecessors             explore. Only the highest quality deposits with low operating
since 1975, Australia’s Identified Mineral Resources (AIMR)       costs will attract the investment needed for development and
reaffirms Australia’s reputation as a world leading destination   insure our future economic prosperity. Through programs
for investment in mineral resources. The 2017 edition             such as Exploring for the Future, led by the Geoscience
includes: assessments of reserves and resources at operating      Australia, the Australian Government remains committed to
mines and other deposits; evaluations of long-term trends         ensuring we have world-class mineral deposits for decades—
for major commodities; and comparative world rankings for         in fact, for generations—to come.
mineral resources.
Figures included in AIMR 2017 show that Australia has the
world’s largest identified resources of nine commodities,
including extremely valuable mineral resources such as
gold. We are also the world’s largest producer of five
commodities—including lithium, a mineral resource with
potential that is just beginning to be unlocked through new
and emerging technologies.
Collected directly from the mining industry sector, the
statistics in AIMR 2017 provide a strong evidence base for        Senator the Hon Matt Canavan
the development of policy, investment by the Australian           Minister for Resources and Northern Australia

                                                                                                                www.ga.gov.au        iii
iv Australia’s Identified Mineral Resources 2017
Contents
1. Introduction 1
2. Australia’s Estimated Ore Reserves 3
Reserve Life of Major Commodities 3
Trends in Reserve Life 4
3. Australia’s Identified Mineral Resources 9
Trends in EDR 12
Mine Inventories as a Proportion of EDR 12
Ore Reserves as a Proportion of EDR 13
Distribution of EDR 14
4. World Rankings 17
5. Identified Resources of Major Commodities since 1975 19
Bauxite19
Black Coal 21
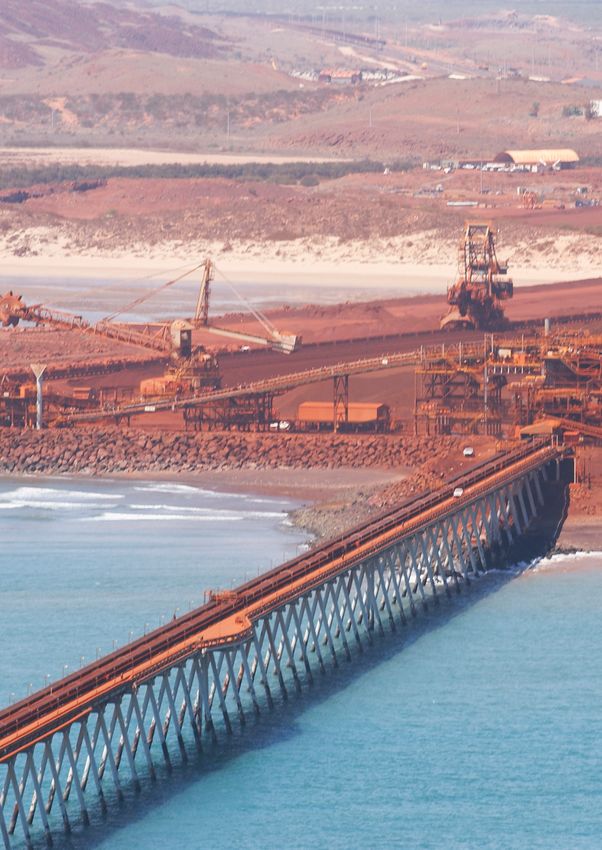
Iron Ore 24
Gold26
Copper28
Uranium30
Nickel32
Lead and Zinc 34
Mineral Sands 37
6. Identified Resources of Other Commodities 43
7. Value of Australian Mineral Exports 45
Major Mines and Mineral Deposits in Australia 47
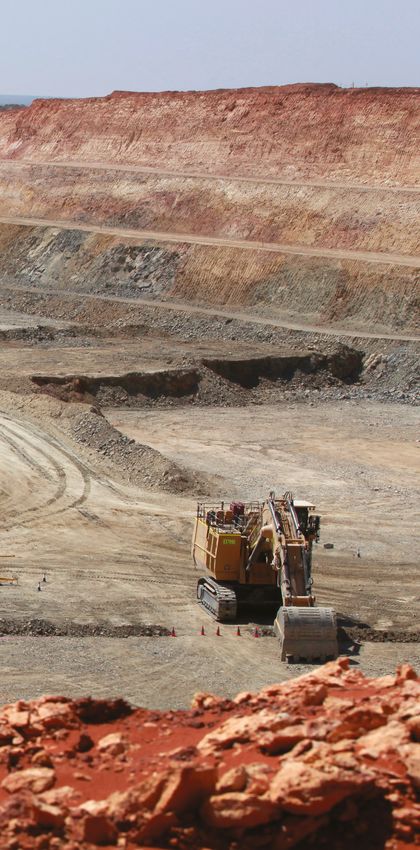
www.ga.gov.au vGold mining at Tropicana, Western Australia. Photograph courtesy of AngloGold Ashanti Australia Ltd. vi Australia’s Identified Mineral Resources 2017
1. Introduction
Australia has a robust and world-leading mining industry                           • EDR for brown coal, chromium, copper, fluorine, lead,
evidenced by a top five position as a producer for some 19                           magnesite, nickel, niobium, oil shale, PGEs, phosphate, rare
commodities including gold, aluminium, iron ore, rare earths,                        earths, thorium and zinc remained at levels similar to those
mineral sands, zinc, lead and coal. In 2016, Australia’s mineral                     previously reported.
exports (excluding petroleum products) amounted to more than                       • Australia’s EDR decreased for antimony, bauxite, diamond,
$151 billion which was almost 58% of all export merchandise and                      iron ore, manganese ore, tungsten and uranium. The most
46% of all exported goods and services. In the 2016–17 financial                     significant fall in EDR was diamond (-45%) as the Argyle
year, mining accounted for 7.4% of gross domestic product1.                          mine in Western Australia winds down.
In addition, the mining industry employed more than 230 000
                                                                                   • Australia’s EDR of gold, iron ore, lead, nickel, rutile,
people in 2016, with many more employed by related industries2.
                                                                                     tantalum, uranium, zinc and zircon are the world’s largest.
Given the importance of mineral resources to the Australian                        • Australia’s EDR of antimony, bauxite, black coal, brown
economy, Geoscience Australia publishes an annual                                    coal, cobalt, copper, diamond, ilmenite, lithium, magnesite,
assessment of the nation’s mineral reserves (Table 1 and                             manganese ore, niobium, silver, thorium, tin, tungsten and
Table 2) and resource estimates (Table 3) for all major,                             vanadium all rank in the top five worldwide.
and some minor, commodities. This assessment provides
useful long-term indicators of potential resource life and                         • Australia is also the top global producer for bauxite, iron ore,
future supply capability. Its broad outlook should assist                            rutile and zircon.
with government policy decisions as well as programs                               • Australia is the second largest producer of gold, lead, rare
and planning associated with the minerals sector and the                             earths and diamonds, the third largest producer of ilmenite,
sustainable development of Australia’s mineral resources.                            uranium and zinc, the fourth largest producer of antimony,
                                                                                     black coal and manganese ore and fifth for brown coal,
This publication also provides useful comparisons of reserves
                                                                                     cobalt, copper, nickel and silver.
and resources at operating mines as proportions of the national
inventory (Table 4, Table 5) and insights into the distribution of                 • Australia had a large number of mines producing gold (130),
Australia’s mineral wealth (Table 6). It is also of interest to note                 black coal (93), copper (34), iron ore (29) and silver (22).
Australia’s position as a global source of minerals as many                        • Australia had few operating mines producing nickel (13),
countries are dependent on reliable supply from Australia for                        zinc (13), lead (13), zircon (8), ilmenite (7), rutile (7), bauxite (6),
their own economies (Table 7).                                                       uranium (3), manganese ore (1) and diamond (1).
Australia’s Identified Mineral Resources 2017 presents                             • Using 2016 rates of production at operating mines, Australia’s
estimates of Australia’s mineral reserves and resources as at                        Measured and Indicated Resources of bauxite, black coal,
31 December 2016. The data in the national minerals inventory                        copper, lead, manganese ore, silver, uranium and zinc could
is mainly sourced from published company reports, but                                potentially last more than 40 years.
includes some confidential and historical data. The highest                        • Using 2016 rates of production at operating mines, Australia’s
category in the national inventory is Economic Demonstrated                          Measured and Indicated Resources could have a life of 18 to
Resources (EDR) which, in essence, combines the Joint Ore                            33 years for mineral sands, 32 years for nickel, 22 years for
Reserves Committee (JORC) Code categories of Proved and                              gold, 19 years for iron ore, but only 8 years for diamond.
Probable Ore Reserves and most of Measured and Indicated                           • At 2016 rates of production, operating gold mines have
Mineral Resources.                                                                   enough Measured and Indicated Resources to last an
Mine production data are based on figures from the Office of                         average of 22 years. However, operating lode-gold deposits,
the Chief Economist at the Department of Industry, Innovation                        which provide most of the gold production, have an average
and Science. World rankings of Australia’s mineral resources                         resource life of 8 years.
have been calculated mainly using information published by                         • The main mineral export earners in 2016 were iron ore
the United States Geological Survey (USGS).                                          (36% of $151 billion), black coal (26%), gold (12%), copper
Geoscience Australia and its predecessors have prepared                              (5%), alumina (4%), aluminium (2%), nickel and zinc (both
the annual assessment of Australia’s mineral resources since                         1.5%). These same minerals were the main income earners
1975. Thus, this publication is able to draw on 40 years of data to                  in 2015 but only iron ore and gold earned greater income in
reveal trends in reserve estimates, resource estimates and mine                      2016 than in 2015. Iron ore export income improved by 10%
production over both short and long periods of time.                                 and gold by 28%.

As at 31 December 2016:                                                            • The price of most commodities has generally decreased
                                                                                     since peak prices in 2011. The exception is gold which, in
• Australia’s EDR increased for black coal, cobalt, gold,                            Australian dollars, has remained high resulting in strong
  ilmenite, lithium, molybdenum, potash, rutile, tantalum,                           production and export income.
  tin, vanadium and zircon. The strongest gains in EDR were
  mineral sands (11%), lithium (70%), potash (73%), cobalt                         • Lower iron ore prices have been offset by increased
  (13%), tantalum (9%) and tin (12%) as improved markets                             production, resulting in increased export income in
  for these commodities, particularly for those associated                           2016 and reversing the decline of recent years.
  with battery technology, has stimulated exploration and
  resource delineation.

¹ Office of the Chief Economist (Resources and Energy Quarterly, December 2017).
² Australian Bureau of Statistics. Labour Force, Australia, Detailed, Quarterly.

                                                                                                                                          www.ga.gov.au         1
JORC CODE
The following terminology and definitions are used by the Joint Ore Reserves Committee (JORC)
Code for reporting of Mineral Resources and Ore Reserves (2012 Edition). A full copy of the JORC
Code can be found at www.jorc.org.
Mineral Resource: A ‘Mineral Resource’ is a Measured Resource: A ‘Measured Mineral
concentration or occurrence of solid material of Resource’ is that part of a Mineral Resource for
economic interest in or on the Earth’s crust in such which quantity, grade (or quality), densities, shape,
form, grade (or quality), and quantity that there and physical characteristics are estimated with
are reasonable prospects for eventual economic confidence sufficient to allow the application of
extraction. The location, quantity, grade (or quality), Modifying Factors to support detailed mine planning
continuity and other geological characteristics and final evaluation of the economic viability of
of a Mineral Resource are known, estimated or the deposit. Geological evidence is derived from
interpreted from specific geological evidence and detailed and reliable exploration, sampling and
knowledge, including sampling. Mineral Resources testing gathered through appropriate techniques
are sub-divided, in order of increasing geological from locations such as outcrops, trenches, pits,
confidence, into Inferred, Indicated and Measured workings and drill holes, and is sufficient to confirm
categories. geological and grade (or quality) continuity between
Inferred Mineral Resource: An ‘Inferred Mineral points of observation where data and samples
Resource’ is that part of a Mineral Resource for are gathered. A Measured Mineral Resource has
which quantity and grade (or quality) are estimated a higher level of confidence than that applying to
on the basis of limited geological evidence and either an Indicated Mineral Resource or an Inferred
sampling. Geological evidence is sufficient to imply Mineral Resource. It may be converted to a Proved
but not verify geological and grade (or quality) Ore Reserve or under certain circumstances to a
continuity. It is based on exploration, sampling and Probable Ore Reserve.
testing information gathered through appropriate Modifying Factors: ‘Modifying Factors’ are
techniques from locations such as outcrops, considerations used to convert Mineral Resources to
trenches, pits, workings and drill holes. An Inferred Ore Reserves. These include, but are not restricted
Mineral Resource has a lower level of confidence to, mining, processing, metallurgical, infrastructure,
than that applying to an Indicated Mineral Resource economic, marketing, legal, environmental, social
and must not be converted to an Ore Reserve. It is and governmental factors.
reasonably expected that the majority of Inferred
Ore Reserve: An ‘Ore Reserve’ is the economically
Mineral Resources could be upgraded to Indicated
mineable part of a Measured and/or Indicated
Mineral Resources with continued exploration.
Mineral Resource. It includes diluting materials
Indicated Mineral Resource: An ‘Indicated Mineral and allowances for losses, which may occur when
Resource’ is that part of a Mineral Resource for the material is mined or extracted and is defined
which quantity, grade (or quality), densities, shape by studies at Pre-Feasibility or Feasibility level as
and physical characteristics are estimated with appropriate that include application of Modifying
sufficient confidence to allow the application of Factors. Such studies demonstrate that, at the time
Modifying Factors in sufficient detail to support mine of reporting, extraction could reasonably be justified.
planning and evaluation of the economic viability
Probable Ore Reserve: A ‘Probable Ore Reserve’
of the deposit. Geological evidence is derived
is the economically mineable part of an Indicated,
from adequately detailed and reliable exploration,
and in some circumstances, a Measured Mineral
sampling and testing gathered through appropriate
Resource. The confidence in the Modifying
techniques from locations such as outcrops,
Factors applying to a Probable Ore Reserve is
trenches, pits, workings and drill holes, and is
lower than that applying to a Proved Ore Reserve.
sufficient to assume geological and grade (or quality)
continuity between points of observation where data Proved Ore Reserve: A ‘Proved Ore Reserve’ is the
and samples are gathered. An Indicated Mineral economically mineable part of a Measured Mineral
Resource has a lower level of confidence than that Resource. A Proved Ore Reserve implies a high
applying to a Measured Mineral Resource and may degree of confidence in the Modifying Factors.
only be converted to a Probable Ore Reserve.
2 Australia’s Identified Mineral Resources 20172. Australia’s Estimated Ore Reserves
Over 2200 companies and securities are listed on the 288 t of gold produced, 182 t came from lode-gold deposits,
Australian Securities Exchange (ASX) of which nearly 900 which accounted for 830 t of the Ore Reserves and 1464 t of
(40%) are categorised as belonging to the materials and the Measured and Indicated Resources. At this continued rate
energy sectors. Recognising that confidence in such a large of production, operating lode-gold deposits have an average
part of the Australian economy is paramount, the Joint Ore reserve life of less than 5 years and a resource life of 8 years
Reserves Committee (JORC) of The Australasian Institute of compared to 10 years and 22 years, respectively, for all gold-
Mining and Metallurgy, the Australian Institute of Geoscientists producing mines (Table 1).
and the Minerals Council of Australia has developed a world-
Australia also has a large number of operating black coal mines
class code, the JORC Code, for reporting Exploration Results
(Table 1), nearly all of which occur in New South Wales and
and estimates of Mineral Resources and Ore Reserves to the
Queensland. Black coal Reserves at operating mines could last
public. The JORC Code has been adopted by the ASX as part
22 years at 2016 rates of production and, when all Reserves are
of its listing rules and is mandatory for all mining companies
considered (Table 2), this figure extends to 35 years.
listed on the ASX and New Zealand Stock Exchange.
Variations of the JORC Code have been adopted in many There were 29 operating iron ore mines in 2016 producing 38%
other parts of the world and the code is compatible with the of the global supply (Table 7). At 2016 rates of production, these
international United Nations Framework Classification for mines have enough Ore Reserves for another seven years but
Fossil Energy and Mineral Reserves and Resources. longer (22 years) when the Mineral Resources of these mines
are included. When non-operating mines are included, the 2016
As part of the Australian Government’s regular annual
ratio of Ore Reserves to production is 27 years.
assessment of the national minerals inventory, Geoscience
Australia compiles all known estimates of Ore Reserves and Of the other bulk commodities—bauxite, manganese ore and
Mineral Resources reported publicly by mining companies. In minerals sands—manganese ore has the longest reserve
addition, some private companies and some foreign companies (24 years) and resource life (44 years) largely because there is
operating in Australia also use the JORC Code, or equivalent now only one operating mine in Australia (Table 1). The mine
codes, for reserve and resource estimation and this information at Groote Eylandt in the Northern Territory produced 3.2 Mt
is also included in the annual compilation wherever possible. of ore in 2016, positioning Australia as the fourth largest
producer of manganese ore in the world (Table 7). Mine
Determining how much of a particular mineral commodity is
closures at Woodie Woodie and Nicholas Downs in Western
in the ground and how much is extractable is not an exact
Australia and at Bootu Creek in the Northern Territory have
science, hence Ore Reserves and Mineral Resources are
resulted in Australia’s ranking slipping in recent years.
always referred to as estimates, never calculations. Mineral
Resources and Ore Reserves are categorised by confidence Bauxite mining remains strong in Australia with Australia
in both the geology of the deposit and the economic viability ranking number one as a bauxite producer (Table 7). Of the
of production. Of all the different categories (see description six operating mines (Table 1), the four large mines of Gove
of JORC Code on page 2), an Ore Reserve is the category of (Northern Territory), Weipa (Queensland), Worsley and Huntly
highest confidence and, from a commercial point of view, is (both Western Australia) account for almost all production.
the most applicable to the current state of Australia’s minerals At 2016 rates of production, Ore Reserves at these mines
industry and the near future (say, the next five years). could last an average of 10 years and when developing mines
(e.g. the large Amrun project south of Weipa) are considered,
Reserve Life of Major Commodities reserve life could potentially be 28 years.
It is useful to look at the number of operating mines and their Seven mines produced ilmenite, rutile and zircon in 2016,
associated Ore Reserves and Mineral Resources (Table 1) as with an eighth (Keysbrook, Western Australia) recording just
these are the deposits that produced all of Australia’s minerals zircon and leucoxene production. In 2016, Australia produced
in 2016. Some of these mines have since closed or been the largest amount of rutile and zircon in the world and
placed on care and maintenance but most will continue mining third largest amount of ilmenite (Table 7). At 2016 rates of
for the foreseeable future, subject to favourable economic, production, Ore Reserves at these operating mines could last
environmental and regulatory conditions. An impression 11 years for ilmenite, 7 years for rutile and 8 years for zircon.
of future viability can be gained by determining the ratio of The reserve life of all deposits using 2016 rates of production
current reserves and resources to the latest production figures is much greater at 40 years for ilmenite, 22 years for rutile and
(Table 1). The resulting reserve and resource “life” must be 33 years for zircon.
treated with caution as production rates vary from year to year The nonferrous metals of copper, lead, zinc and nickel all
and mining companies typically upgrade resources to replace have potential reserve lives of 20 years or greater at 2016
ore depletion. Nonetheless, this ratio provides a snapshot of rates of production (Table 1). Copper, of course, is dominated
the current situation and a glimpse of one potential future (in by the huge Olympic Dam deposit which produced nearly
which exploration and resource upgrades have ceased and 20% of Australia’s copper output in 2016. If Olympic Dam
mining activity has remained static). were removed from the calculations, and assuming the lost
Gold has by far the largest number of mines (Table 1), production was made up elsewhere, then Australia’s copper
although many companies have multi-mine operations so a Reserve at the remaining 33 operating mines would drop by
single company failing could potentially affect the exploitation more than 10 Mt and the reserve life would be just 12 years.
of a greater number of individual deposits. In addition, gold The resource life of operating copper mines is 73 years, again
reserves and resources are dominated by large multi-element skewed strongly by Olympic Dam.
deposits such as Olympic Dam (Cu-Au-U) in South Australia Lead and zinc resources at operating mines could potentially
and Cadia (Cu-Au) in New South Wales, whereas production last around 60 years at 2016 rates of production (Table 1).
is dominated by lode-gold deposits such as those of the Lead-zinc(-silver) deposits are widely dispersed in Australia
Kalgoorlie goldfields of Western Australia. In 2016, out of the
www.ga.gov.au 3with lead and zinc produced in Queensland (Cannington, these mines have an average reserve life of 43 years and a
Dry River, Mount Garnet, George Fisher, Mount Isa), potential resource life of 152 years (Table 1), strongly skewed
New South Wales (Broken Hill, Rasp, Endeavour, Hera), the by Olympic Dam which is the world’s largest uranium deposit.
Northern Territory (McArthur River), Tasmania (Rosebery) and In 2016, Olympic Dam alone produced more than 50% of
Western Australia (Gossan Hill). The Dry River mine was, Australia’s uranium with reserves that could last about 80 years.
however, placed on care and maintenance during 2016. In
Australia has very few diamond deposits with only Argyle in
addition, the Bentley mine (Western Australia) produced zinc
the Kimberley region of Western Australia and Merlin in the
and the Peak mines (New South Wales) produced lead.
Northern Territory having current Ore Reserves. In 2016, only
Nickel is mined at 13 deposits (Table 1), all in Western Argyle was fully operational (Table 1). After pilot production in
Australia, from either sulphide or lateritic ores. The reserve life 2013, diamond mining at Merlin restarted at the end of 2016
of operating mines at 2016 rates of production is potentially but without significant production (hence it is not included
20 years (Table 1) but almost 50% greater at 29 years when all in Table 1). The Argyle diamond mine (Rio Tinto Ltd) is a
deposits are included in the calculation. This is because low leading global supplier and the largest supplier of naturally
nickel prices in recent years have led to some nickel mines coloured diamonds. It is particularly famous for its pink stones,
being placed on care and maintenance and delayed the producing more than 90% of all pink diamonds in the world.
development of others. Consequently there is a relatively large Argyle is expected to close in 2021.
Ore Reserve of nickel that is not currently being exploited but
is still published as current by the owners. Trends in Reserve Life
Silver was produced at 22 mines in 2016 and these mines have Figure 1 shows that many commodities experience long
a potential reserve life of 14 years and a possible resource life periods of time with little variation in each year’s reserves
of 46 years, at 2016 rates of production (Table 1). Reserve life to production ratio. Gold is a particularly good example
of all deposits is 18 years. Australia is richly endowed in silver, with a reserve life that has varied little (from 12 to 16 years)
ranking second globally (Table 7). Much of it is associated since 2002. It reflects ongoing industry practice of steadily
with lead- zinc deposits, but silver is also commonly found with replenishing depleted Ore Reserves by upgrading a similar
gold and other deposit types. It is widely dispersed in Australia, quantity from Measured and Indicated Resources. In turn,
with all states having Ore Reserves (Figure 2), dominated by Inferred Resources are upgraded to Measured and Indicated
Queensland (45%), the Northern Territory (20%), South Australia and new resources are added through exploration.
(14%) and New South Wales (12%). Despite this dispersion, just
Odd variations to the reserve to production ratio occur from
six deposits—the McArthur River (Northern Territory), George
year to year for some commodities (e.g. lead and zinc;
Fisher and Cannington (Queensland), Olympic Dam and
Figure 1) mostly explained by mine closures (sometimes
Carrapateena (South Australia) and Cadia (New South Wales)
temporary) with accompanying loss of production; companies
—hold 75% of Australia’s silver deposits between them.
upgrading or downgrading Ore Reserves as individual
Australia has a large uranium Ore Reserve (329 kt; Table 2) of projects succeed or fail; or companies reducing or ramping
which more than 80% is associated with three mines (Table up production in response to price fluctuations. Lead and
1). These mines are located in South Australia (Olympic Dam zinc have both seen an uptick in reserve life in 2016 reflecting
and Four Mile) and the Northern Territory (Ranger). In 2016, reduced production at Mount Isa and McArthur River but are
mining took place at the South Australian properties with expected to return to trend as Dugald River comes online.
Ranger producing from stockpiles. At 2016 rates of production,
80
70
60
50
Years
40
30
20
10
PP-1366-13
0
2002 2003 2004 2005 2006 2007 2008 2009 2010 2011 2012 2013 2014 2015 2016
Year
Bauxite Copper Ilmenite Lead Rutile Zinc
Black coal Gold Iron ore Nickel Uranium Zircon
Figure 1 Trends in reserve life for major commodities from 2002 to 2016.
4 Australia’s Identified Mineral Resources 2017Larger trend changes are seen for nickel, uranium and mineral For about ten years from 2002, the reserve life of mineral
sands (Figure 1). Nickel reserve life decreased from 2002 sands ranged from 13 to 22 years for ilmenite and 15 to 24
to 2009 as production was not matched by new reserve years for rutile with zircon generally trending up (Figure 1).
delineation. Production subsequently fell as some mines became From 2011 to 2013, reserve life increased strongly for
uneconomic at lower nickel prices post the global financial crisis each commodity. For ilmenite and rutile this was mainly
of 2007–08 which, along with lagging reserve increases, resulted a result of falling production outpacing new Ore Reserve
in greater reserve life. Uranium reserve life, while always large, estimates. Production fell in response to lower prices for these
has been volatile over the last 15 years (Figure 1). With so few commodities after the global financial crisis. Zircon production
existing mines and the difficulty of developing new mines, any did not fall, rather it has generally increased since 2011, but
reassessment of reserves or change in production can result in a reserve estimates have risen faster resulting in an increased
large variation in reserve life from year to year. reserve life overall.
Table 1 Australia’s Ore Reserves and Mineral Resources of Major Commodities at Operating Mines in 2016.
Measured and
No. of Ore Reserves2 Mine Average Average
Indicated Mineral
Commodity Unit Operating at Operating Production Reserve Life Resource
Resources3 at
Mines1 Mines 20164 (years) Life (years)
Operating Mines
Bauxite Mt 6 806.5 3399 82.152 10 41
Black Coal Mt 93 12 243 33 7745 566.3⁶ 22 60
Copper Mt Cu 34 19.37 69.15 0.948 20 73
Diamond Mc 1 66.7 114.7 13.958 5 8
Gold t Au 130 2750 6221 288 10 22
Iron Ore Mt 29 6368 16 224 858 7 19
Lead Mt Pb 13 10.06 29.84 0.45 22 66
Manganese Ore Mt 1 79.6 144.4 3.2⁷ 24 44
Mineral Sands
Ilmenite Mt 7 14.70 45.03 1.4 11 32
Rutile Mt 7 2.10 5.03 0.3 7 18
Zircon Mt 8 4.78 11.8 0.6 8 21
Nickel Mt Ni 13 4.18 6.47 0.204 20 32
Silver kt Ag 22 19.22 65.37 1.418 14 46
Uranium kt U 3 269.79 960.93 6.314 43 152
Zinc Mt Zn 13 18.53 51.48 0.884 21 58
Abbreviations
t=tonne; kt=kilotonnes (1000 t); Mt=million tonnes (1 000 000 t); Mc=million carats (1 000 000 carats).
Where an element symbol follows the unit it refers to contained metal content.
Notes
1. The number of operating mines counts individual mines that operated during 2016 and thus contributed to production. Some of these mines may belong to larger,
multi-mine operations and some may have closed during or since 2016.
2. The majority of Australian Ore Reserves and Mineral Resources are reported in compliance with the JORC Code, however there are a number of companies that
report to foreign stock exchanges using other reporting codes, which are largely equivalent. In addition, Geoscience Australia may hold confidential information for
some commodities. Ore Reserves are as at 31 December 2016.
3. Mineral Resources are inclusive of the Ore Reserves. Mineral Resources are as at 31 December 2016.
4. Source: Resources and Energy Quarterly, June 2017 published by the Office of the Chief Economist, Department of Industry, Innovation and Science unless
otherwise stated.
5. Measured and Indicated Resources for black coal are presented on a recoverable basis (these are Geoscience Australia estimates unless provided by the company).
6. Mine production refers to raw coal.
7. Production figures from South32 Ltd (Annual Report 2016).
www.ga.gov.au 5Table 2 Australia’s Estimated Ore Reserves as at December 2016.
Commodity Unit Ore Reserve1 Mine Production 20162
Antimony kt Sb 65 5.5*
Bauxite Mt 2319 82.152
Black Coal Mt 19 800 566.3*
Brown Coal Mt n.a. 63.3*
Chromium kt Cr 0 0
Cobalt kt Co 386 *
Copper Mt Cu 24.0 0.948
Diamond Mc 67.31 13.958
Fluorine kt F 0 0
Gold t Au 3826 288
Iron
Iron ore Mt 23 532 858
Contained iron Mt Fe 10 470 531
Lead Mt Pb 11.52 0.45
Lithium kt Li 1361 14*
Magnesite Mt MgCO₃ 37.5 *
Manganese Ore Mt 110.2 3.2*
Mineral Sands
Ilmenite Mt 56.5 1.4
Rutile Mt 6.7 0.3
Zircon Mt 20.0 0.6
Molybdenum kt Mo 3.6 0
Nickel Mt Ni 6.0 0.204
Niobium kt Nb 116 0
Oil Shale GL 0 0
PGE (Pt, Pd, Os, Ir, Ru, Rh) t metal 0 *
Phosphate
Phosphate rock* Mt 289 *
Contained P₂O₅ Mt P₂O₅ 51
Potash Mt K₂O 0 0
Rare Earths (REO & Y₂O₃) Mt 2.1 0.014*
Silver kt Ag 25.74 1.418
Tantalum kt Ta 36.7 *
Thorium kt Th 0 0
Tin kt Sn 258 6.635
Tungsten kt W 215.8 0.11*
Uranium kt U 329 6.314
Vanadium kt V 1341 0
Zinc Mt Zn 24.26 0.884
6 Australia’s Identified Mineral Resources 2017Abbreviations
t=tonne; kt=kilotonnes (1000 t); Mt=million tonnes (1 000 000 t); Mc=million carats (1 000 000 carats); GL=gigalitre (1 000 000 000 L); n.a.=not available.
Where an element symbol follows the unit it refers to contained metal content.
Notes
1. Ore Reserves predominantly comprise Proved and Probable Ore Reserves that have been publicly reported in compliance with the JORC Code to the ASX.
Some Ore Reserves have been reported using other reporting codes to foreign stock exchanges but are included when regarded as equivalent to the JORC
Code. In addition, Geoscience Australia may hold confidential data for some commodities.
2. Source: Resources and Energy Quarterly, June 2017 published by the Office of the Chief Economist, Department of Industry, Innovation and Science unless
otherwise stated.
*
Antimony: Mine production (Costerfield operation) reported by Mandalay Resources Corp to Toronto Stock Exchange 23 February 2017.
Black Coal: Mine production refers to raw coal.
Brown Coal: Mine production is a Geoscience Australia estimation.
Cobalt: The Western Australian Department of Mines and Petroleum (Statistics Digest 2015–16) reported 5.47 kt of production in 2015–16.
Lithium: Mine production is not reported for the Greenbushes Mine. Production figures are based on reported production of concentrates for
Greenbushes (Lithium: investment opportunities, Western Australia. Commodity Summary, Geological Survey of Western Australia, 2016), and ASX
reported tonnages of concentrates for Mount Marion and Mount Cattlin. Concentrates are assumed to contain 6% Li2O.
Magnesite: The Department of State Development, South Australia (Report Book 2017/00014) reported magnesite production of 6554 t in 2016. The
Queensland Department of Natural Resources and Mines (Annual mineral and metal statistics) reported magnesite production of 462 901 t in 2015–16.
Manganese: Production figures from South32 Ltd (Annual Report 2016).
Platinum Group Elements: The Western Australia Department of Mines and Petroleum (Statistics Digest 2015–16) reported 687 kg of platinum and
palladium
by-product was produced during 2015–16.
Phosphate: Phosphate rock is reported as being economic at grades ranging from 8.7% to 30.2% P2O5. Christmas Island mined 508 201 t in 2016.
The Queensland Department of Natural Resources and Mines (Annual mineral and metal statistics) reported phosphate production of 1 034 957 t in
2015–16.
Minor production (1972 t) was recorded in South Australia (Report Book 2017/00014).
Rare Earths: Mount Weld in Western Australia supplies rare earth mineral concentrates to the Lynas Advanced Materials Plant (LAMP) in Malaysia.
Lynas Corporation Ltd (Quarterly Reports to the ASX) reported that LAMP produced 13 872 t of ready-for-sale rare earth oxides.
Tantalum: The Western Australian Department of Mines and Petroleum (Statistics Digest 2015–16) reported tantalite production of 183 t in 2015–16.
Tungsten: Mine production estimated at approximately 108 t, based on figures released by Tasmania Mines Ltd for the Kara operation (Quarterly
Reports to the ASX) and by the Department of Natural Resources and Mines, Queensland for 2015–16 (Annual mineral and metal statistics).
www.ga.gov.au 7N AT I O N A L C L A S S I F I C AT I O N S Y S T E M
The following terminology and definitions are used in Australia’s National Classification System
for Identified Mineral Resources.
Resource: A concentration of naturally occurring likely to be available for mining (potential supply).
solid, liquid, or gaseous materials in or on the It does not include Inferred Resources which do
Earth’s crust and in such form that its economic not have enough geological confidence to support
extraction is presently or potentially (within a mine planning. For shorter term, commercial
20–25 year timeframe) feasible. viewpoints of the economic category see Table 1
(Ore Reserves and Mineral Resources at Operating
Identified Resource: A specific body of
Mines) and Table 2 (Australia’s Ore Reserves).
mineral-bearing material whose location, quantity
and quality are known from specific measurements Subeconomic: This term refers to those resources
or estimates from geological evidence for which that are geologically demonstrated but which do
economic extraction is presently or potentially not meet the criteria of economic at the time of
(within a 20–25 year timeframe) feasible. determination. Subeconomic Resources include
paramarginal and submarginal categories:
To reflect degrees of geological assurance,
Identified Resources can be divided into • Paramarginal: That part of Subeconomic
Measured Resources, Indicated Resources and Resources which, at the time of determination,
Inferred Resources where Measured Resources could be produced given postulated limited
have the most geological confidence and Inferred increases in commodity prices or cost-
Resources the least. The National Classification reducing advances in technology. The main
System's definitions for Measured, Indicated and characteristics of this category are economic
Inferred Resources are consistent with those of the uncertainty and/or failure (albeit just) to meet the
JORC Code. criteria of economic.
Under the JORC Code, with the application • Submarginal: That part of Subeconomic
of Modifying Factors and mine planning, Resources that would require a substantially
Measured Resources can be converted into higher commodity price or major cost-
Proved Ore Reserves or Probable Ore Reserves reducing advance in technology to render them
and Identified Resources can be converted into economic.
Probable Ore Reserves. Accessible Economic Demonstrated Resource
Demonstrated Resource: A collective term for (AEDR): Some resources have enough geological
the sum of Measured and Indicated Resources, confidence to be considered a demonstrated
including Proved and Probable Ore Reserves. resource and, in normal circumstances, would also
be regarded as economic but they are not currently
Economic: This term implies that, at the time of available for development because of legal and/or
determination, profitable extraction or production land-use restrictions. They are included in EDR but
under defined investment assumptions has been not in AEDR.
established, analytically demonstrated, or assumed
with reasonable certainty.
Economic Demonstrated Resource (EDR):
A Demonstrated Resource that is regarded as
economic under the definition above. The EDR
category provides a long-term view of what is
8 Australia’s Identified Mineral Resources 20173. Australia’s Identified Mineral Resources
The National Classification System for Identified Mineral All of Australia’s EDR for gold, silver, tin, zinc, lead, iron and
Resources has been used by the Australian Government since any number of commodities will be mined. At first glance,
1975 for classifying mineral resources for regional and national this statement might seem somewhat astonishing because,
assessments. It provides a long-term view on what is likely to obviously, not every deposit with an EDR will have all of that
be available for mining. EDR brought into production. Indeed, some deposits currently
contributing to EDR will never produce an ounce of metal.
The National Classification System uses two general criteria for
However, the National Classification System is not meant
classifying Australia’s national inventory of mineral resources:
for individual mine assessments but as a way of estimating
1. the geological certainty of the existence of the mineral regional and national totals. So, from an agglomerated point
resource, and of view, it is a reasonable proposition that over time people
2. the economic feasibility of its extraction over the long term. will mine all of current EDR and more. This is seen in the data
The National Classification System uses reports on mineral presented in the figures for each of the major commodities in
resources published by companies using the JORC Code Section 5 (e.g. Figure 13).
(or equivalent foreign codes) and, to a lesser extent, Australia is yet to run out of EDR because, to use JORC
confidential information, to compile national total resources for Code terminology, as individual Ore Reserves are depleted,
the classification categories set out in Table 3 (see page 8 for Measured and Indicated Resources are reassessed into
terminology and definitions). Both the National Classification Proved and Probable Categories, Inferred Resources are
System and the JORC Code are based on the McKelvey worked on to bring them to Measured and Indicated status
resource classification system used by the United States and new drilling at existing mines as well as new greenfield
Geological Survey (USGS). Thus Australia’s national system discoveries add to the resource inventory. In addition,
is compatible with the JORC Code and remains comparable extractive technologies improve over time and if a commodity
to the USGS system as published in the annual USGS Mineral becomes rare then the laws of supply and demand result in
Commodity Summaries. previously subeconomic deposits becoming profitable. Thus
Economic Demonstrated Resources (EDR) is the category EDR fundamentally differs from Ore Reserves under the JORC
used for the national totals of economic resources and Code because it is not meant to provide a picture of what is
provides a basis for meaningful comparisons of Australia’s currently commercial to mine but rather an outlook on what
economic resources with those of other nations. For major is likely to be available for mining over the long term, i.e. of
commodities, Section 5 presents long-term trends in EDR as opportunity for supply.
well as trends in Ore Reserves, total resources and production,
and also comparisons to cumulative production, with
accompanying notes on significant changes.
Estimating the total amount of each commodity likely to
be available for mining is not a precise science. For mineral
commodities, the long-term perspective takes account of
the following:
• Ore Reserves reported in compliance with the JORC Code
(or equivalent foreign codes) will all be mined,
but they only provide a short-term view on what is likely
to be available for mining.
• Most current Measured and Indicated Resources reported
in compliance with the JORC Code are also likely to be
mined.
• Some current Inferred Resources will be transferred to
Measured and Indicated Resources and Ore Reserves.
• New discoveries will add to the resource inventory.
www.ga.gov.au 9Table 3 Australia’s Identified Mineral Resources as at December 2016.
Australia World
Demonstrated Resources
Mine Economic Mine
Inferred Accessible
Commodity Unit Economic Subeconomic Production Resources Production
Resources² EDR³
(EDR)¹ 2016⁴ 2016⁵ 2016⁶
Paramarginal Submarginal
Antimony kt Sb 138.9 8.8 0 190.6 138.9 5.5* 1500 130
Bauxite Mt 6005 144 1429 1942 6005 82.152 28 000 271.5*
Black Coal
In situ Mt 85 753 1370 4421 104 151
Recoverable Mt 70 927 1018 3815 81 864 64 045 566.3* 712 000* 7795*
Brown Coal
In situ Mt 92 887 44 069 234 987 124 326
Recoverable Mt 76 508 41 112 215 449 103 579 66 439 63.3* 317 000* 783.3*
Chromium kt Cr 0 302 0 6786 0 0 500 000* 30 400*
Cobalt kt Co 1164 426 25 1238 1164 * 7000 123
Copper Mt Cu 87.78 1.27 1.09 48.15 87.78 0.948 720 19.4
Diamond Mc 115.84 0 0 20.93 115.84 13.958 750* 127
Fluorine kt F 343 505 6 2301 343 0 126 000 3100*
Gold t Au 9830 213 67 4389 9800 288 57 000 3255*
Iron
Iron ore Mt 49 588 10 939 1433 90 123 49 588 858 173 769 2230
Contained Iron Mt Fe 23 771 3672 480 40 342 23 771 531 82 986 1360
Lead Mt Pb 35.09 3.00 0.14 31.92 24.09 0.45 88 4.82
Lithum kt Li 2730 0 0 966 2730 14* 15 130 34.7*
Mt
Magnesite 320.48 21.90 35.00 849.74 320.48 * 8500 27.7*
MgCO₃
Manganese Ore Mt 219 2.8 190.2 379.7 219 3.2* 1790 44
Mineral Sands
Ilmenite Mt 276.9 26.2 0.03 235.1 247.0 1.4 1523.2 11.6
Rutile Mt 33.0 0.3 0.06 34.1 29.1 0.3 64.6 0.7
Zircon Mt 78.6 1.1 0.07 61.3 72.1 0.6 118.2 2.4
Molybdenum kt Mo 210 1220 0.5 614 210 0 15 133 227
Nickel Mt Ni 18.5 4.1 0.1 23.3 18.5 0.204 78 2.25
Niobium kt Nb 286 15 0 418 286 0 >4500 64
Oil Shale GL 0 213 2074 1472 0 0 760 934* n.a.
PGE
(Pt, Pd, Os, Ir, Ru, t metal 5.3 140.4 1.4 168.6 2.6 * 67 000 380
Rh)
Phosphate
Phosphate Mt 1072 312 0 2461 1072 * 68 000 261
rock*
Contained Mt P2O 5 180 61 0 403 188
P2 O 5
Potash Mt K 2O 56 7 0 91 56 0 4300 39
Rare Earths Mt 3.43 0.35 29.22 25.81 3.43 0.014* 120 0.126
(REO & Y2 O 3)
Silver kt Ag 89.29 1.79 0.49 52.00 89.29 1.418 570 27.0
Tantalum kt Ta 75.7 7.4 0.2 32.9 75.7 * >100 1.1
Thorium kt Th 0 129.9 0 644.2 0 0 n.a. n.a.
Tin kt Sn 486 65 31 319 486 6.635 4657 278
Tungsten kt W 391.0 0.4 4.5 240.0 391.0 0.11* 3484 86.5
Uranium kt U 1270 13 19 915 1212 6.314 3472* 62.0*
Vanadium kt V 2111 14 677 1376 17 002 2111 0 19 000 76
Zinc Mt Zn 63.5 0.59 0.75 38.44 63.5 0.884 220 11.9
10 Australia’s Identified Mineral Resources 2017Abbreviations
t=tonne; kt=kilotonnes (1000 t); Mt=million tonnes (1 000 000 t); Mc=million carats (1 000 000 carats); GL=gigalitre (1 000 000 000 L); n.a.=not available.
Where an element symbol follows the unit it refers to contained metal content.
Notes
1. Economic Demonstrated Resources (EDR) predominantly comprises Ore Reserves and most Measured and Indicated Mineral Resources that have been
reported in compliance with the JORC Code to the ASX. In addition, some reserves and resources have been reported using other reporting codes to foreign
stock exchanges and Geoscience Australia may hold confidential data for some commodities.
2. Total Inferred Resources in economic, subeconomic and undifferentiated categories.
3. Accessible Economic Demonstrated Resources (AEDR) is the portion of total EDR that is accessible for mining. AEDR does not include resources that are
inaccessible for mining because of environmental restrictions, government policies or military lands.
4. Source: Resources and Energy Quarterly, June 2017 published by the Office of the Chief Economist, Department of Industry, Innovation and Science unless
otherwise stated.
5. Source: Mineral Commodity Summaries 2017 published by the United States Geological Survey (USGS) and adjusted with Geoscience Australia data,
unless otherwise stated.
6. Source: Mineral Commodity Summaries 2017 (USGS) unless otherwise stated.
*
Antimony: Mine production (Costerfield operation) reported by Mandalay Resources Corp to Toronto Stock Exchange 23 February 2017.
Bauxite: World bauxite production sourced from the Office of the Chief Economist (Resources and Energy Quarterly, June 2017).
Black Coal: Australian mine production refers to raw coal. World economic resources dated 2015, sourced from the Federal Institute for Geosciences
and Natural Resources, Germany (Energy Study 2016). World mine production sourced from the Office of the Chief Economist (Resources and Energy
Quarterly, June 2017).
Brown Coal: Australian mine production is a Geoscience Australia estimation. World mine production sourced from International Energy Agency
(Coal Information 2017 Overview). World economic resources dated 2015, sourced from the Federal Institute for Geosciences and Natural Resources,
Germany (Energy Study 2016).
Chromium: World resources and mine production presented as chromite ore.
Cobalt: The Western Australian Department of Mines and Petroleum (Statistics Digest 201516) reported 5.47 kt of production in 2015–16.
Diamond: World resource figures are for industrial diamonds only, no data provided for resources of gem diamonds.
Fluorine: World mine production excludes the USA.
Gold: World mine production sourced from the Office of the Chief Economist (Resources and Energy Quarterly, June 2017).
Lithium: Australian mine production is not reported for the Greenbushes Mine. Production figures are based on reported production of concentrates
for Greenbushes (Lithium: investment opportunities, Western Australia. Commodity Summary, Geological Survey of Western Australia, 2016), and ASX
reported tonnages of concentrates for Mount Marion and Mount Cattlin. Concentrates are assumed to contain 6% Li₂O. World mine production excludes
the USA.
Magnesite: The Department of State Development, South Australia (Report Book 2017/00014) reported magnesite production of 6554 t in 2016. The
Queensland Department of Natural Resources and Mines (Annual mineral and metal statistics) reported magnesite production of 462 901 t in 2015–16.
World mine production excludes the USA.
Manganese: Production figures from South32 Ltd (Annual Report 2016).
Oil Shale: World resources from World Energy Council (Survey of Energy Resources 2013).
PGE: The Western Australia Department of Mines and Petroleum (Statistics Digest 2015–16) reported 687 kg of platinum and palladium by-product was
produced during 2015–16.
Phosphate: Phosphate rock is reported as being economic at grades ranging from 8.7% to 30.2% P₂O₅. Christmas Island mined 508 201 t in 2016.
The Queensland Department of Natural Resources and Mines (Annual mineral and metal statistics) reported phosphate production of 1 034 957 t in
2015–16.
Minor production (1972 t) was recorded in South Australia (Report Book 2017/00014).
Rare Earths: Mount Weld in Western Australia supplies rare earth mineral concentrates to the Lynas Advanced Materials Plant (LAMP) in Malaysia.
Lynas Corporation Ltd (Quarterly Reports to the ASX) reported that LAMP produced 13 872 t of ready-for-sale rare earth oxides.
Tantalum: The Western Australian Department of Mines and Petroleum (Statistics Digest 2015–16) reported tantalite production of 183 t in 2015–16.
Tungsten: Mine production estimated at approximately 108 t, based on figures released by Tasmania Mines Ltd for the Kara operation (Quarterly
Reports to the ASX) and by the Department of Natural Resources and Mines, Queensland for 2015–16 (Annual mineral and metal statistics).
Uranium: World economic resources sourced from the International Atomic Energy Agency estimate for Reasonable Assured Resources (RAR)
recoverable at costs of less than US$130/kg U and Geoscience Australia. World production sourced from the Office of the Chief Economist (Resources
and Energy Quarterly, June 2017).
www.ga.gov.au 11Trends in EDR This dominance of operating mines as a proportion of EDR
leads to a number of potential susceptibilities in the minerals
Australia’s EDR of the following 12 mineral commodities
sector. Many commodities, such as manganese ore, bauxite,
increased during 2016: black coal, cobalt, gold, ilmenite,
uranium and mineral sands have relatively large EDR but few
lithium, molybdenum, potash, rutile, tantalum, tin, vanadium
mines (Table 1). Price shocks or other circumstances leading
and zircon. EDR for brown coal, chromium, copper, fluorine,
to the permanent closure of one or more of these mines would
lead, magnesite, nickel, niobium, oil shale, PGEs, phosphate,
dramatically impact EDR, i.e., Australia’s potential to supply of
rare earths, thorium and zinc remained at levels similar to
these minerals over the long term. If there is no foreseeable
those previously reported. The EDR of seven commodities
possibility of a mine reopening, then the deposit is removed
decreased in 2016: antimony, bauxite, diamond, iron ore,
from EDR. For some operations, the mine simply runs out of
manganese ore, tungsten and uranium.
ore but EDR will only be replaced from new deposits if mining
The trends in EDR for Australia’s major mineral commodities and exploration companies can attract the capital necessary
have undergone significant and sometimes dramatic changes for exploration, drilling and development.
over the period 1975 to 2016 (see Section 5). Changes for
Other commodities with large EDR, such as gold, black coal
each commodity can be attributed to one, or a combination,
and iron ore, have many mines. Thus, Australia’s EDR of these
of the following factors:
commodities do not appear to be particularly vulnerable to
• Increases in resources resulting from discoveries of new the fortunes of individual mines. Certainly, black coal has
deposits and delineation of extensions of known deposits. one of the lowest proportions of EDR at operating mines as a
• Depletion of resources as a result of mine production. proportion of total EDR (48%; Table 4). In 2016, there were 290
• Advances in mining and metallurgical technologies, e.g. coal deposits with EDR and 93 operating mines (Table 4); if
carbon-based processing technologies for gold have even a sizeable proportion of coal mines were inaccessible in
enabled economic extraction from low-grade deposits that the future, a large resource could potentially still be exploited.
were previously uneconomic. This is not necessarily the case for gold. Australia has the
• Adoption of the JORC Code for resource classification largest EDR of gold in the world (Table 7) but most of it is
and reporting by the Australian minerals industry and the associated with large, low-grade, multi-commodity deposits
subsequent impacts on re-estimation of Ore Reserves such as Olympic Dam and Cadia. The majority of production,
and Mineral Resources to comply with the requirements however, comes from lode-gold deposits which produced
of the JORC Code. The impacts of the JORC Code on 63% of Australia’s gold in 2016. At this rate of production, all
EDR occurred at differing times for each of the major lode-gold deposits have a potential resource life of 22 years
commodities. based on EDR, but the operations mining lode gold only have
• Significant changes in the prices of mineral commodities a resource life of 8 years (based on Measured and Indicated
driven largely by both escalating and cooling demand from Resources). With depletion of these high-grade mines, it is
China over the past decade. unlikely that production at the other types of deposit could
make up the shortfall in the same time period, thus Australia’s
In 2016, there were significant increases of EDR for mineral gold production, and export income, would inevitably decline.
sands (11%), lithium (70%), potash (73%), cobalt (13%),
tantalum (9%) and tin (12%) as improved markets for these This circumstance is, of course, based on the very unlikely
commodities in recent years, particularly for those associated scenario that future rates of production will be unchanged
with battery technology, has stimulated exploration and resource from those of 2016 and that companies will not replace
delineation. Significant falls were seen for diamond (-45%) as depleted gold resources. The gold EDR from these lode-gold
the Argyle mine in Western Australia winds down and antimony deposits will most likely be replaced by successful mineral
(-13%) as the Costerfield project in Victoria was reassessed. exploration. (Advances in extractive technologies or substantial
price rises could also contribute to future EDR.) Some of this
exploration will occur in and around existing mines (brownfield
Mine Inventories as a Proportion exploration) but the most important contributions to Australia’s
of EDR future EDR of gold, and other commodities, is more likely to
While the national inventory is an agglomeration of individual come from successful exploration in new and under explored
resources, it is a useful exercise to compare the national areas of the continent (greenfield exploration). It is through the
total with the EDR attributable to currently operating mines discovery of large, globally significant mineral deposits such
(Measured and Indicated Resources in Table 1) as, in most as Broken Hill, Mount Isa, Olympic Dam and the Kalgoorlie
cases, operating mines dominate the minerals inventory goldfields, that Australia has become a mining “superpower”.
(Table 4). With the exception of mineral sands, black coal, iron If Australia wishes to remain globally competitive then new
ore and nickel, operating mines of all other major commodities discoveries are essential as only the very best deposits will
make up more than 50% of EDR (Table 4). And when all mines attract the investment necessary for development in an
are considered (adding those on care and maintenance and internationally competitive investment environment.
under development), these mines (still excepting mineral
sands, black coal, iron ore and nickel) make up more than 60%
of EDR and, in some cases, 90–100% of EDR (Table 4).
12 Australia’s Identified Mineral Resources 2017You can also read