Carpooling Platforms as Smart City Projects: A Bibliometric Analysis and Systematic Literature Review - MDPI
←
→
Page content transcription
If your browser does not render page correctly, please read the page content below
sustainability

Article
Carpooling Platforms as Smart City Projects: A Bibliometric
Analysis and Systematic Literature Review
Leonidas G. Anthopoulos *                  and Dimitrios N. Tzimos

                                          Department of Business Administration, University of Thessaly, GR41500 Larissa, Greece; tzimosdim@gmail.com
                                          * Correspondence: lanthopo@uth.gr

                                          Abstract: Carpooling schemes for mutual cost benefits between the driver and the passengers has
                                          a long history. However, the convenience of driving alone, the increasing level of car ownership,
                                          and the difficulties in finding travelers with matching timing and routes keep car occupancy low.
                                          Technology is a key enabler of online platforms which facilitate the ride matching process and
                                          lead to an increase in carpooling services. Smart carpooling services may be an alternative and
                                          enrichment for mobility, which can help smart cities (SCs) reduce traffic congestion and gas emissions
                                          but require the appropriate architecture to support connection with the city infrastructure such as
                                          high-occupancy vehicle lanes, parking space, tolls, and the public transportation services. To better
                                          understand the evolution of carpooling platforms in SCs, bibliometric analysis of three separate
                                          specialized literature collections, combined with a systematic literature review, is performed. It
                                          is identified that smart carpooling platforms could generate additional value for participants and
                                          SCs. To deliver this value to an SC, a multi-sided platform business model is proposed, suitable
                                for a carpooling service provider with multiple customer segments and partners. Finally, after

                                          examining the SC structure, a carpooling platform architecture is presented, which interconnects
Citation: Anthopoulos, L.G.;
                                          with the applicable smart city layers.
Tzimos, D.N. Carpooling Platforms
as Smart City Projects: A Bibliometric
                                          Keywords: carpooling; business model; smart mobility; smart city; project; platform
Analysis and Systematic Literature
Review. Sustainability 2021, 13, 10680.
https://doi.org/10.3390/
su131910680
                                          1. Introduction
Academic Editor:                                The continuous increase in cities’ populations leads to a rise in the number of cars,
Manuela Tvaronaviciene                    which creates traffic, makes it difficult to find a parking space, negatively affects the quality
                                          of life, and increases fuel consumption and production of exhaust gases [1]. The problem is
Received: 9 August 2021                   exacerbated by the low utilization of the car, as in most commutes it is used by one person,
Accepted: 14 September 2021               the driver [2].
Published: 26 September 2021
                                                Cities, taking advantage of the evolution of technology, are becoming smart, aiming
                                          to improve the quality of life in the urban environment. The internet empowers online
Publisher’s Note: MDPI stays neutral      platforms, which facilitate direct access to services and solves the problem of matching
with regard to jurisdictional claims in
                                          supply with demand.
published maps and institutional affil-
                                                In the field of smart mobility, there is a shift from focus on objects and infrastructure
iations.
                                          to providing value to end users with integrated mobility services. In recent years, there has
                                          been a transition from private car ownership to mobility as a service (MaaS) with services
                                          like carpooling, ride-hailing, ridesharing, and carsharing [3,4]. Car ownership is under
                                          question due to challenges such as traffic, parking, and costs, while the alternatives of
Copyright: © 2021 by the authors.         individual transportation through technology are increasing.
Licensee MDPI, Basel, Switzerland.              The benefits from carpooling are important both from the participants’ perspective,
This article is an open access article
                                          who share the trip costs, and from the city’s perspective, where the traffic congestion,
distributed under the terms and
                                          parking demand, and gas emissions are reduced. However, the integration of carpooling
conditions of the Creative Commons
                                          services in the context of smart cities appears limited. This paper extends [2] and its
Attribution (CC BY) license (https://
                                          aim is to analyze the literature on the knowledge area resulting from the intersection of
creativecommons.org/licenses/by/
                                          smart carpooling value generation, platform business models, and smart city platform
4.0/).

Sustainability 2021, 13, 10680. https://doi.org/10.3390/su131910680                                   https://www.mdpi.com/journal/sustainability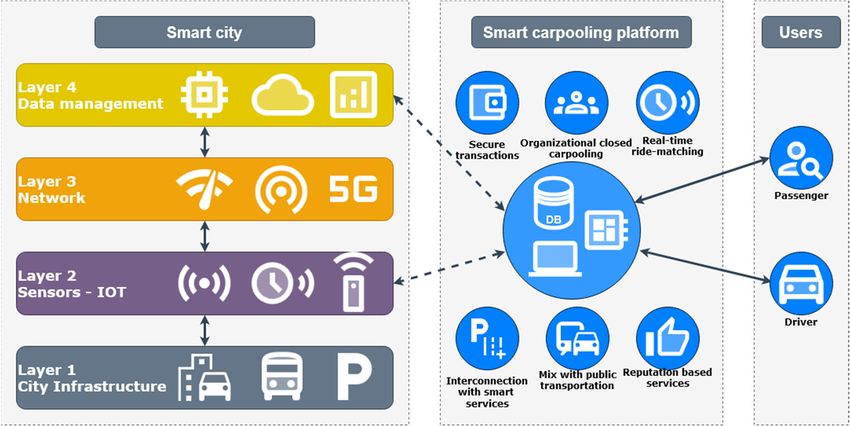
carpooling value generation, platform business models, and smart city platform architec-
tures areas as shown in Figure 1. To reach this goal, a bibliometric analysis (BA) is com-
bined with a systematic literature review (SLR) about the following research questions:
RQ1: “How is value being generated, captured, and transferred from smart carpool-
Sustainability 2021, 13, 10680 ing services?” 2 of 29
RQ2: “What is the business model for a carpooling platform provider to approach a
smart city and deliver its services?”
architectures areas as shown in Figure 1. To reach this goal, a bibliometric analysis (BA) is
RQ3: “What is the architecture of a carpooling platform project within the smart
combined with a systematic literature review (SLR) about the following research questions:
city?”
Figure1.1.Intersection
Figure Intersectionofofthematic
thematicareas.
areas.
The remainder
RQ1: “How is of this paper
value being isgenerated,
structuredcaptured,
as follows:and Section 2 brieflyfrom
transferred presentssmart the
background of
carpooling services?”the thematic areas related to the research questions. Section 3 describes the
research methodology. Section 4 presents and discusses the results,
RQ2: “What is the business model for a carpooling platform provider to approach a while Section 5 sum-
marizes
smart citythe
and conclusions.
deliver its services?”
RQ3: “What is the architecture of a carpooling platform project within the smart city?”
2. Background
The remainder of this paper is structured as follows: Section 2 briefly presents the
background
There areof themanythematic areasfor
definitions related to thecity,
the smart research
such questions.
as “A Smart Section
City is3 describes
a city well
the research methodology. Section 4 presents and discusses
performing in a forward-looking way in these six characteristics (economy, the results, while Section
people, 5
gov-
summarizes the conclusions.
ernance, mobility, environment, living), built on the ‘smart’ combination of endowments
and activities of self-decisive, independent and aware citizens” [5] and “A city can be de-
2. Background
fined smart when investments in human and social capital and traditional (transport) and
There
modern are communication
(ICT) many definitions for the smartfuel
infrastructure city, such as “A
sustainable Smart City
economic is a and
growth city awell
high
performing
quality of life, with a wise management of natural resources, through participatorygov-
in a forward-looking way in these six characteristics (economy, people, gov-
ernance,
ernance”mobility,
[2,6]. Allenvironment,
definitions ofliving), built on
smart cities the ‘smart’
found combination
in the literature of endowments
recognize the key en-
and activities
abler of self-decisive,
role of information independent and
and communication aware citizens”
technologies (ICTs).[5]One and
of “A city can
the main be
bench-
defined
marking smart when investments
dimensions of the complexin human and social capital
and multidimensional and traditional
concept (transport)
of smart cities is smart
and modern (ICT) communication infrastructure fuel sustainable economic
mobility, which includes, among others, smart mobility services (e.g., parking guidance growth and a
high quality of life, with a wise management of natural
information systems, cars, or bike sharing) and carpooling [7]. resources, through participatory
governance”
Carpooling[2,6].isAll definitions
defined of smart cities
as a non-profit common found in thewhere
journey literature recognize
drivers the key
offer vacancies
enabler role of information and communication technologies (ICTs).
in their car while passengers share the cost of the trip with the driver. A successful One of the maincar-
benchmarking dimensions of the complex and multidimensional concept of smart cities
pooling route requires identifying the route and the time and the location of departure
is smart mobility, which includes, among others, smart mobility services (e.g., parking
guidance information systems, cars, or bike sharing) and carpooling [7].
Carpooling is defined as a non-profit common journey where drivers offer vacancies in
their car while passengers share the cost of the trip with the driver. A successful carpooling
route requires identifying the route and the time and the location of departure and arrival
between passengers. Coordination is facilitated by carpooling platforms which are offered
free of charge when operated by local government agencies or by paying an amount
for use [8].
Sustainability 2021, 13, x FOR PEER REVIEW 3 o
Sustainability 2021, 13, 10680 3 of 29
and arrival between passengers. Coordination is facilitated by carpooling platforms wh
are offered free of charge when operated by local government agencies or by paying
Two types ofamount for use
carpooling [8].
can be found: periodic travel (e.g., daily commuting to work)
and ad hoc travel in which a usercarpooling
Two types of requests acan be found:
journey fromperiodic travel
one place (e.g., daily
to another [9].commuting
Often, to wo
and ad hoc travel in which a user requests a journey from one place to
in the United States, the term casual carpooling is used, which refers to the user-run form ofanother [9]. Of
in the United States, the term casual carpooling is used, which refers to the user-run fo
ridesharing, formed with three or more commuters per vehicle. It provides participants
of ridesharing, formed with three or more commuters per vehicle. It provides participa
with time and cost benefits through access to a high-occupancy vehicle (HOV) lane and
with time and cost benefits through access to a high-occupancy vehicle (HOV) lane a
often tolling discounts [10]. However, by looking into the yearly percentages of commute
often tolling discounts [10]. However, by looking into the yearly percentages of comm
mode in the USA [11] shown in Figure 2, it appears that carpooling usage throughout the
mode in the USA [11] shown in Figure 2, it appears that carpooling usage throughout
years is steady and limited.
years is steady and limited.
Figure
Figure 2. Commute mode in USA 2. Commute mode in USA (2000–2019).
(2000–2019).
Low carpooling Low usagecarpooling usage has in
has been identified been identified
European in European
countries as well,countries as well, where s
where several
attempts have been made to stimulate carpooling. For example, initiatives funded by the funded
eral attempts have been made to stimulate carpooling. For example, initiatives
European Unionthe European
such Union
as Increase ofsuch
Car as Increase of(ICARO
Occupancy Car Occupancy
in 1997)(ICARO in 1997) and City-VIT
and City-VITAlity-
ity-Sustainability (CIVITAS in 2002 and 2005) aimed
Sustainability (CIVITAS in 2002 and 2005) aimed at reducing the number of cars at reducing theused
number
and of cars u
increasing the carand increasingrate.
occupancy the car
Evenoccupancy
though rate. Even thoughmade
the investments the investments made by the Eu
by the European
pean Union in these projects were great, their results
Union in these projects were great, their results remain modest and their overall impact remain modest and
ontheir ove
impact on carpooling
carpooling in Europe remains very low [12]. in Europe remains very low [12].
A business model A business
describes model describesof
the rationale thehow
rationale of how an organization
an organization creates, deliv
creates, delivers,
and captures value. A business model is often visualized through the business model c
and captures value. A business model is often visualized through the business model
vas (BMC). The BMC provides the basis for a commonly accepted language for the b
canvas (BMC). The BMC provides the basis for a commonly accepted language for the
ness model concept, which is used by a variety of organizations. According to the BM
business model concept, which is used by a variety of organizations. According to the
the business model of an organization can be presented through nine building blocks t
BMC, the business model of an organization can be presented through nine building
present the logic of how the organization aims to create value. The nine building blo
blocks that present the logic of how the organization aims to create value. The nine
cover the four areas of a business: customers, offer, infrastructure, and financial viabi
building blocks cover the four areas of a business: customers, offer, infrastructure, and
[13].
financial viability [13].
Travel is changing rapidly thanks to the advent of online platforms between serv
Travel is changing
providers rapidly thanks
and users. to the advent
Although of online
there is no commonly platforms
accepted between
definitionservice
of an online p
providers and users. Although there is no commonly accepted definition
form, a platform is essentially the interface between two or more categories of an online of differ
platform, a platform
users.is For
essentially
example, the
theinterface
newspaper between two or more
is a platform categories
that allows of different
interaction between read
users. For example, the newspaper is a platform that allows interaction
and advertisers. The key to the success of the platform is the number of between readers
users on each s
and advertisers. that
The is,
key togreater
the the success of the platform
the number is the
on one side, thenumber of users
greater the on on
interest eachtheside,
other side.
that is, the greater theOnline
number on onehave
platforms side,been
the greater the interest
instrumental on the carpooling
in increasing other side.since 2010, as t
Online platforms
automate havethebeen instrumental
matching of supply inand
increasing
demandcarpooling since 2010,
with algorithms. as they
The large number of p
automate the matching
viders and of consumers
supply andindemandcarpooling with algorithms.
platforms createsThethelarge number
necessary of
conditions for
providers and consumers in carpooling platforms creates the necessary conditions for the
success of a platform. In addition, the platforms allow the building of trust, as participants
are registered users who are rated by the user network [14].
Even though carpooling is an efficient transportation method to reduce traffic jams
and emissions, its use remains low. It is mainly focused on long city to city journeys or
urban commuting of employees of the same organization with similar starting points.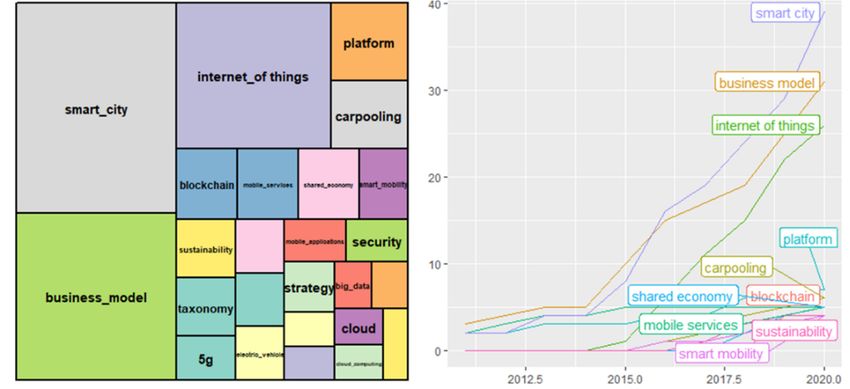
Sustainability 2021, 13, 10680                                                                                                4 of 29

                                 However, it appears that the digital technology is mature enough to boost carpooling by
                                 enabling easier ride matching and by providing incentives in smart cities.
                                       From the literature review thus far, it is found that there is an extensive recent literature
                                 for the individual research areas, while literature for the smart carpooling platforms, their
                                 business models, and their architecture within the scope of smart city is limited.

                                 3. Methodology
                                       To answer the research questions of this paper, a combination of BA and SLR is
                                 chosen [2]. The goals are to ensure high-quality results, to maximize objectivity, and to
                                 make the research reproduceable. BA focuses on the statistical analysis of the literature
                                 published in a specific subject area. This method is used to classify information into
                                 specific variables, such as scientific journals, academic institutions, authors, and countries.
                                 BA is an important tool for quantitative evaluation and analysis of published scientific
                                 literature [15]. It is useful for classifying and providing an overview of the literature,
                                 through the visualization and quantification of the evolution of specific thematic areas.
                                 The SLR aims at mapping and evaluating the main literature to identify research gaps
                                 and present the limits of knowledge of the subject area. SLR differs from a traditional
                                 narrative review by adopting a systematic process that can be reproduced, is scientific and
                                 transparent, aims to minimize bias through exhaustive bibliographic searches of studies,
                                 and provides concrete steps for decision control [16].
                                       The choice of the combination of the two methodologies aims at exploiting the advan-
                                 tages that each one offers individually. More specifically, BA allows a dynamic analysis to
                                 identify the literature that has contributed the most to the scientific knowledge of a field.
                                 The SLR provides a reliable technique that can be easily applied to a wide range of research
                                 to select the most relevant literature.

                                 3.1. Bibliometric Analysis
                                       The number of academic publications is growing rapidly, and it is becoming increas-
                                 ingly difficult to keep track of everything that is published. This prevents the accumulation
                                 of knowledge and the collection of data from previous research work. Therefore, literature
                                 reviews play the crucial role of synthesizing previous research findings to effectively use
                                 the existing knowledge base and promote new research. Researchers use qualitative and
                                 quantitative literature review approaches to understand and organize previous findings.
                                 Among them, BA introduces a systematic, transparent, and reproducible process based on
                                 statistical analysis of science, scientists, or the scientific activity of a particular field [15].
                                 Unlike other methodologies, BA provides more objective and reliable analyses. It enables
                                 a structured analysis of a large body of information, identifies trends over time, topics
                                 researched, and the most productive scholars and institutions, and presents the big picture
                                 of the existing research. To facilitate the BA, the bibliometrix R-Tool [17] is used, which
                                 is an open-source tool for quantitative research and includes all the main bibliometric
                                 methods of analysis. The analysis is conducted in R Studio [18] using the R language [19].

                                 3.2. Systematic Literature Review
                                      As with all research, the value of a systematic review depends on the rigor of the
                                 method, the clarity of reporting the results, and the application of scientific strategies to
                                 reduce potential errors and biases [20]. A systematic review involves a thorough search
                                 of defined databases (for example, Web of Science and Scopus) and requires a thorough
                                 process for analyzing and synthesizing the data. Although systematic reviews are not
                                 common in the management sciences, suggestions are made for the desired steps [16]. SLR
                                 was originally used in medical science studies but is now also applied in areas such as
                                 management [16,21] and engineering [22].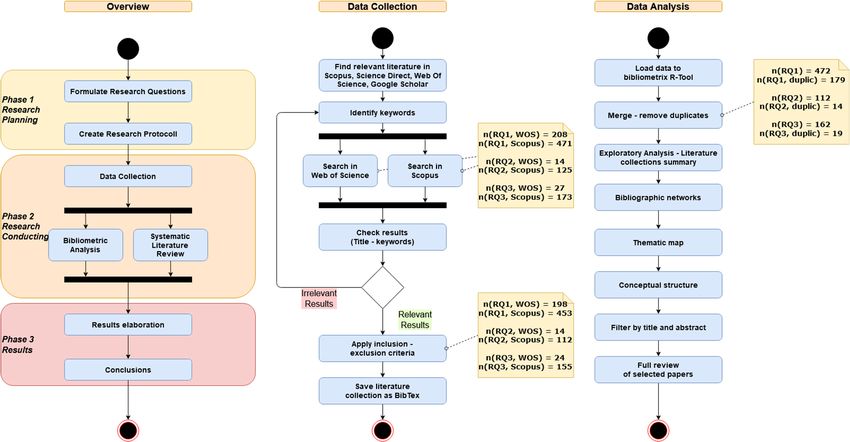
defined databases (for example, Web of Science and Scopus) and requires a thorough pro-
cess for analyzing and synthesizing the data. Although systematic reviews are not com-
mon in the management sciences, suggestions are made for the desired steps [16]. SLR
was originally used in medical science studies but is now also applied in areas such as
Sustainability 2021, 13, 10680 5 of 29
management [16,21] and engineering [22].
3.3.3.3.
Research Protocol
Research Protocol
The research
The researchprotocol
protocol of
of aa systematic
systematicstudy
study is is a documented
a documented planplan
that that describes,
describes, as as
farfar
as as
possible,
possible,allallthe
thedetails
detailsofof how
how the researchisisconducted.
the research conducted.The Theresearch
research protocol is
protocol
particularly useful
is particularly usefulbecause it helps
because reduce
it helps reducethethelikelihood
likelihood ofof the researcher
researcherbias
biasinin the se-
the
selection
lection of individual
of individual primarystudies
primary studies or
or in the
thesynthesis
synthesis ofof
results andand
results can can
be evaluated
be evaluated
by by other
other researchers[23].
researchers [23]. The
The research
research protocol
protocol ofofthis paper
this is presented
paper in Figure
is presented 3.
in Figure 3.
Figure
Figure3.
3. Research protocol.
Research protocol.
3.4.3.4.
Data Collection
Data Collection
ToTo find
findthe
the main bibliography
main bibliography of of
thethe research
research fields,
fields, many many trial searches
trial searches have beenhave
per- been
formed onon
performed Google
GoogleScholar, Scopus,
Scholar, and Web
Scopus, of Science
and Web (WoS). (WoS).
of Science The keyword combinations
The keyword combina-
thatthat
tions returned the most
returned relevant
the most resultsresults
relevant are: are:
“businessmodel”,
“business model”,(“business
(“business model”
model”AND
AND“carpooling”),
“carpooling”),(“business model”
(“business ANDAND
model”
“smart mobility”), (“business model” AND “smart transportation”)
“smart mobility”), (“business model” AND “smart transportation”)
ByBystudying the the
studying keywords of the
keywords ofmain bibliography
the main and after
bibliography andtests and
after redefinition,
tests the
and redefinition,
following set of keywords is defined:
the following set of keywords is defined:
• Literature collection #1 for RQ1: ((carpooling OR “smart mobility” OR “smart trans-
• Literature collection
portation”) #1 for
AND (value ORRQ1: ((carpooling
incentive OR “smart mobility” OR “smart trans-
OR benefit))
• portation”)
Literature AND (value
collection #2 OR
for incentive OR benefit))
RQ2: (“business model” AND (platform OR applica-
• tion) AND
Literature (carpooling
collection #2OR
for“smart mobility” OR
RQ2: (“business “smartAND
model” transportation”
(platform OR
OR“shared
application)
economy”
AND OR “smart
(carpooling city”)) mobility” OR “smart transportation” OR “shared econ-
OR “smart
• omy”
Literature collection
OR “smart #3 for RQ3: (architecture AND (platform OR application) AND
city”))
project AND “smart city”)
• Literature collection #3 for RQ3: (architecture AND (platform OR application) AND
It is important
project to note
AND “smart that two-word concepts are enclosed in quotation marks to
city”)
maintain the combined meaning of the words. In addition, the logical operators “AND”
and “OR” are used for the appropriate combination of keywords.
To perform the analysis, data were retrieved from the two databases, Scopus and WoS,
which represent a traditional approach to indexing and tracking referrals [24]. The search
was performed on 18 December 2020.
To filter the results, inclusion and exclusion criteria are applied to the literature
collections of both databases.
Inclusion criteria: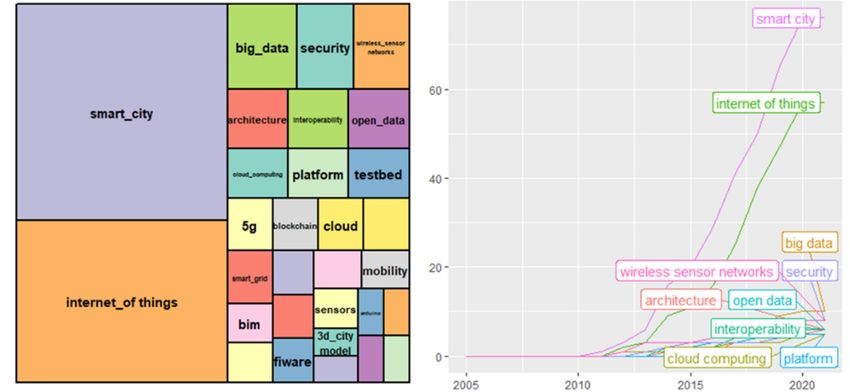
Sustainability 2021, 13, 10680                                                                                                     6 of 29

                                 •    Articles in scientific journals (articles)
                                 •    Conference Papers
                                 •    Reviews
                                 •    Book chapters
                                      Exclusion criteria:
                                 •    Conference reviews
                                 •    Documents not written in English
                                      The raw data are extracted from Scopus and WoS as BibTeX files, which are suitable
                                 for bibliographic analysis, as they include all the basic information, such as title, author
                                 names, summary, keywords, and references.

                                 3.5. Data Analysis
                                       The BibTeX files from each literature collection are loaded to R Studio with the bib-
                                 liometrix R-Tool [17]. Two bibliographic data-frames for each literature collection are
                                 created with document records and bibliographic metadata, such as author names, ti-
                                 tle, keywords, and other information. The two data-frames are merged and duplicate
                                 documents in both databases are removed from the results.
                                       To summarize the main results, a table with the most important information is created
                                 including details such as the annual scientific production, the most important articles
                                 by number of citations, the most productive authors, the most productive countries, the
                                 number of citations per country, the most relevant sources, and the most relevant keywords.
                                 In addition, various co-authorship indicators appear. The author collaboration index is
                                 calculated as the total number of articles per the total number of authors ratio. The co-
                                 authors per document index is calculated as the average number of co-authors per article.
                                 The collaboration index is calculated as the ratio of the total number of authors of multiple
                                 articles and the total number of articles of multiple authors [25,26].

                                 3.5.1. Bibliographic Networks
                                       One of the most important techniques of BA is the network analysis. Various ap-
                                 proaches have been developed using different methods, such as co-word analysis which
                                 uses the most important words or keywords in articles to study the conceptual structure
                                 of a research field. This method uses the actual content of the articles to create a measure
                                 of similarity. Co-word analysis produces semantic maps of a research field that facilitate
                                 its understanding.
                                       To create networks, the properties of an article are linked together (e.g., author to journal, key-
                                 words to publication date). These links can be represented by a Document × Attribute matrix.
                                 An attribute of an article is the information associated with the article (e.g., authors, journal,
                                 keywords, citations). The connections of characteristics create bipartite Document × Attribute
                                 networks that can be represented as two-dimensional networks. Various matrices can be
                                 computed such as: Document × Citation, Document × Author, Document × Country,
                                 Document × Authors’ keyword [17].

                                 3.5.2. Thematic Map
                                      Co-word analysis creates keyword clusters, which are considered as themes. It is
                                 performed using a word co-occurrence network to map and cluster terms extracted from
                                 keywords. The network can be obtained from a Document × Keyword matrix [17]. Each
                                 cluster is considered as a theme with two parameters, the density and centrality. The
                                 clusters can be used to classify topics and map them into a two-dimensional diagram
                                 named a strategic diagram, where on the x-axis is the centrality and on the y-axis is the
                                 density. The themes are classified as: motor themes in the upper-right quadrant, highly
                                 developed and isolated themes in the upper-left quadrant, emerging or declining themes
                                 in the lower-left quadrant, and basic or transversal themes in the lower-right quadrant [27].
Sustainability 2021, 13, 10680                                                                                             7 of 29

                                 3.5.3. Conceptual Structure
                                       Factorial analysis creates the conceptual map of a scientific field by performing multi-
                                 ple correspondence analysis and clustering of words or a summary of the articles included
                                 in a bibliographic collection. The bibliometrix R-Tool performs multiple correspondence
                                 analysis (MCA) to draw a conceptual structure of the field and K-means clustering to iden-
                                 tify clusters of documents that express common concepts. In co-word analysis, MCA is ap-
                                 plied to a Document × Keyword matrix and the keywords are plotted on a two-dimensional
                                 map. The results are interpreted based on the relative positions of the points [17].

                                 3.5.4. Full Review
                                       The last phase involves filtering of the documents based on the relevance of the title
                                 and the abstract to the research questions, the total number of citations, and citations
                                 per year. For the selection of the most influential papers, the most referenced in the
                                 literature collections are examined according to the same criteria as well. During this
                                 phase, additional papers may be identified. Finally, a full review and taxonomy of the most
                                 important papers for each knowledge area is performed.

                                 4. Results
                                 4.1. Bibliometric Analysis
                                      The number of documents per search query is presented in Table 1, which concerns
                                 an exploratory analysis and a summary of literature collections [2].

                                 Table 1. Number of documents per search query.

                                                               Collection #1          Collection #2           Collection #3
                                      Web of Science               198                     14                      26
                                         Scopus                    453                     112                     155
                                       Duplicates                  −179                    −14                     −19
                                          Total                    472                     112                     162

                                      The scientific production in all thematic areas related to each one of the literature
                                 collections is quite recent, except for the collection #1, which includes 45 papers from 1977
                                 to 2010. All documents in the literature collection #2 were published after 2011 and only
                                 two documents in the collection #3 were published prior to 2011. A summary of the key
                                 indicators for each one of the three literature collections is presented in Table 2, Figures 4–6.

                                 4.1.1. Literature Collection #1
                                       Source growth: Analyzing the evolution of the sources of the bibliographic collection
                                 #1, documents from 332 different sources are identified. One hundred and five documents
                                 (22%), come from 16 sources. It is noteworthy that the “Transportation Research Record”
                                 has published 15 documents from 1983 to 2019, presenting a continuous production over
                                 time. “Lecture Notes in Computer Science” has published 13 documents from 2012 to 2020.
                                 “IEEE Access” presents a particularly high production in a short period of time with 11
                                 articles from 2018 to 2020.
                                       Analyzing the citations of the sources, it is identified that the “Transportation Research
                                 Part C: Emerging Technologies” has five articles in the bibliographic collection # 1 and has
                                 279 citations. The next highest source is “Transport Reviews” which has 265 citations from
                                 just two articles, followed by the “Transportation Research Part A: Policy and Practice”
                                 with 175 citations from eight articles.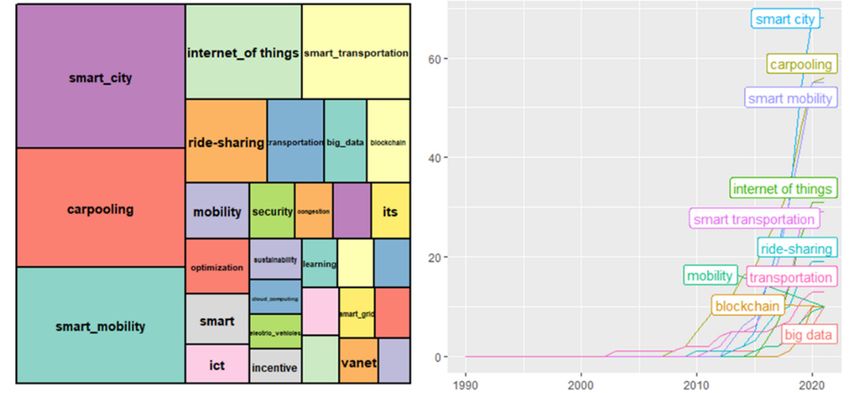
Sustainability 2021, 13, 10680 8 of 29
Sustainability 2021, 13, x FOR PEER REVIEW 8 of 31
Table 2. Main indicators for each one of the 3 literature collections.
#1 #2 #3
Table 2. Main indicators for each one of the 3 literature collections.
Main Information
#1 #2 #3
Timespan 1977:2021 2011:2020 2005:2020
Main Information
Sources (journals, books, etc.) 332 103 120
Timespan 1977:2021 2011:2020 2005:2020
Documents 472 112 162
Sources (journals, books, etc.) 332 103 120
Average years from publication 4.08 2.78 2.97
Documents 472 112 162
Average citations per documents 10.37 12.18 26.27
Average years from publication 4.08 2.78 2.97
Average citations per year per doc 2.308 3.841 5.074
Average citations per documents 10.37 12.18 26.27
References 14,727 4559 4949
Average citations per year per doc 2.308 3.841 5.074
Document
References
Types 14,727 4559 4949
Article
Document Types
235 35 44
Book chapter
Article 235 20 35 8 44 14
Conference
Book chapterpaper 20 191 8 60 14 96
Review
Conference paper 191 15 60 4 96 4
Document
ReviewContents 15 4 4
Keywords
Document Contentsplus 2417 807 1189
Author’s
Keywordskeywords
plus 2417 1383 807 3921189 563
Authors
Author’s keywords 1383 392 563
Authors
Authors 1417 316 656
Author appearances
Authors 1417 1683 316 338656 751
Authors Author
of single-authored
appearances documents 1683 37 338 16 751 11
Authors
Authors ofofsingle-authored
multi-authored documents 37
documents 1380 16 300 11 645
AuthorsAuthors Collaboration
of multi-authored documents 1380 300 645
Single-authored documents
Authors Collaboration 41 20 11
Documents per
Single-authored author
documents 41 0.333 20 0.35411 0.247
Authors per
Documents perdocument
author 0.333 3 0.354 2.820.247 4.05
Co-authors
Authors perper documents
document 3 3.57 2.82 3.024.05 4.64
Collaboration
Co-authors index
per documents 3.57 3.2 3.02 3.264.64 4.27
Collaboration index 3.2 3.26 4.27
Sustainability 2021, 13, x FOR PEER REVIEW 9 of 31
Figure 4. Documents per year and per country in literature collection #1.
Figure 4. Documents per year and per country in literature collection #1.
Figure 5. Documents per year and per country in literature collection #2.
Figure 5. Documents per year and per country in literature collection #2.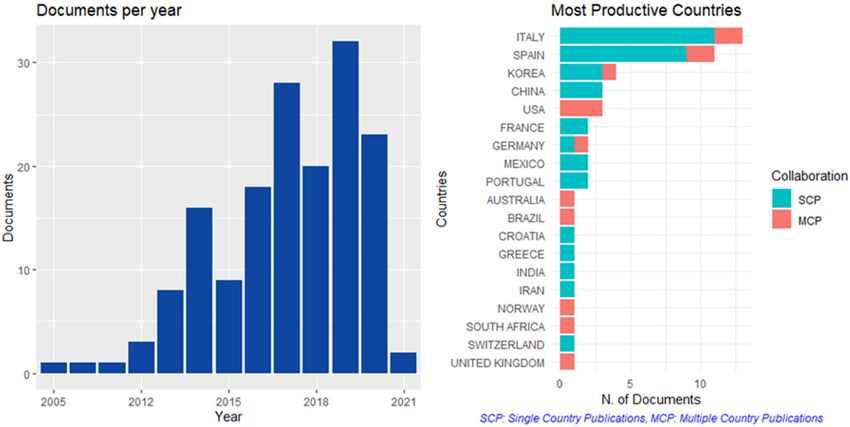
Sustainability 2021, 13, 10680 9 of 29
Figure 5. Documents per year and per country in literature collection #2.
Sustainability 2021, 13, x FOR PEER REVIEW 10 of 31
Figure6.6.Documents
Figure Documentsper
peryear
yearand
andper
percountry
countryininliterature
literaturecollection
collection#3.
#3.
4.1.1.Studying
Literature theCollection
source growth #1 of the seven sources with the most articles in the biblio-
graphic collection # 1 in Figure
Source growth: Analyzing the 7, two types ofof
evolution sources are identified,
the sources those with collection
of the bibliographic constant
time production, such as the “Transportation Research Record”
#1, documents from 332 different sources are identified. One hundred and five documents and the “Lecture Notes in
Computer
Sustainability 2021, 13, x FOR PEER REVIEW Science” and those with very large production in
(22%), come from 16 sources. It is noteworthy that the “Transportation Research Record” recent years, such 10asof“IEEE
31
Access” and “Transportation Research Part A: Policy and Practice”.
has published 15 documents from 1983 to 2019, presenting a continuous production over
time. “Lecture Notes in Computer Science” has published 13 documents from 2012 to
2020. “IEEE Access” presents a particularly high production in a short period of time with
11 articles from 2018 to 2020.
Analyzing the citations of the sources, it is identified that the “Transportation Re-
search Part C: Emerging Technologies” has five articles in the bibliographic collection # 1
and has 279 citations. The next highest source is “Transport Reviews” which has 265 cita-
tions from
Figure just twosource
7. Cumulative articles,
growthfollowed by the
of literature “Transportation
collection #1. Research Part A: Policy and
Practice” with 175 citations from eight articles.
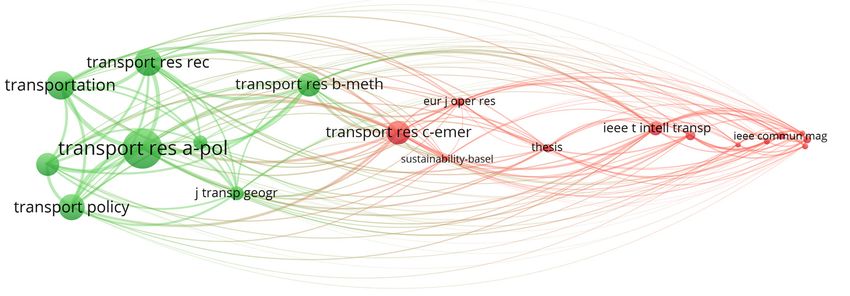
Source
Studying co-citation
the source network:
growthThe of co-citation networkwith
the seven sources of the sources
the shown in
most articles inFigure
the biblio-
8graphic
revealscollection
the existence of Figure
# 1 in two different
7, two clusters.
types of The green
sources arecluster includes
identified, sources
those with that
constant
focus on issues related to policymaking, project preparation and
time production, such as the “Transportation Research Record” and the “Lecture Notes in evaluation, and day-to-
day management
Computer Science” of transport
and those systems.
with very The large
“Transportation
productionResearch
in recentPart A: Policy
years, such as and“IEEE
Practice” participates with [27,28], which deal with the effectiveness of high-occupancy
Access” and “Transportation Research Part A: Policy and Practice”.
vehicle
Figure 7.
lanes and the reasons
7. Cumulative source
whyofpeople participate or not in carpooling, respectively.
Figure The Cumulative sourcegrowth
red cluster includes growth
sources ofliterature
literaturecollection
such as the collection#1.#1.
“IEEE Transactions on Intelligent Trans-
portation Systems”,
Source co-citation the “European
co-citation network: Journal of Operational Research”, and the “IEEE Com-
Source network:The Theco-citation
co-citationnetwork
networkofofthe thesources
sourcesshown
shownininFigure
Figure 8
munications
8 reveals Magazine”,
theexistence
existenceofoftwowhich focus
two different on information
different clusters.
clusters. The technology and decision making as
reveals the Thegreen
greencluster
cluster includes
includessources
sourcesthat that
the basis
focus on of smart
issues mobility.
related to “Transportation
policymaking, Research
project Part
preparation C: Emerging
and Technologies”
evaluation, and day-to-is
focus on issues related to policymaking, project preparation and evaluation, and day-to-
the
daymost importantofsource
management of the red cluster, as it is in the center of the two clusters at and
the
day management of transport
transportsystems.
systems.The The“Transportation
“Transportation Research
Research Part A: Policy
Part A: Policy and
same time, as citations
Practice” participates
participates with are made from all the other sources. This is due to the paper [29],
Practice” with[27,28],
[27,28],whichwhichdealdealwithwiththetheeffectiveness
effectiveness of of
high-occupancy
high-occupancy
which
vehiclehas 242and
lanes citations and refers topeople the adoption ratesorofnot autonomous and respectively.
shared auton-
vehicle
omous lanes
vehicles.and the
the reasons
reasonswhy why peopleparticipate
participate or not in in
carpooling,
carpooling, respectively.
The red cluster includes sources such as the “IEEE Transactions on Intelligent Trans-
portation Systems”, the “European Journal of Operational Research”, and the “IEEE Com-
munications Magazine”, which focus on information technology and decision making as
the basis of smart mobility. “Transportation Research Part C: Emerging Technologies” is
the most important source of the red cluster, as it is in the center of the two clusters at the
same time, as citations are made from all the other sources. This is due to the paper [29],
which has 242 citations and refers to the adoption rates of autonomous and shared auton-
omous vehicles.
Figure 8. Source
Figure Source co-citation
co-citationnetwork
networkofofliterature collection
literature #1 #1
collection [2].[2].
Top keywords-co-occurrence network: To understand the interconnection and evo-
lution of keywords in the documents of the bibliographic collection # 1, the co-occurrence
network of the keywords in Figure 9 and the plot of Figure 10 are created. It is derived
that the term “smart city” has been used the most. It appeared in documents in the litera-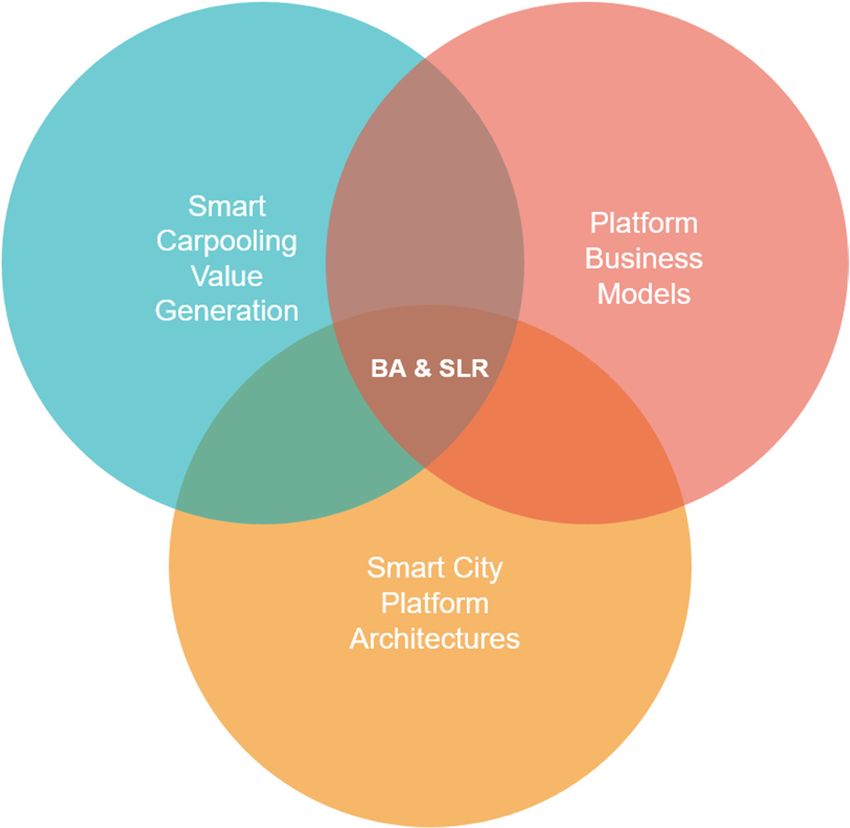
Sustainability 2021, 13, 10680 10 of 29
The red cluster includes sources such as the “IEEE Transactions on Intelligent Trans-
portation Systems”, the “European Journal of Operational Research”, and the “IEEE Com-
munications Magazine”, which focus on information technology and decision making
as the basis of smart mobility. “Transportation Research Part C: Emerging Technologies”
is the most important source of the red cluster, as it is in the center of the two clusters
at the same time, as citations are made from all the other sources. This is due to the
paper [29], which has 242 citations and refers to the adoption rates of autonomous and
shared autonomous vehicles.
Top keywords-co-occurrence network: To understand the interconnection and evo-
lution of keywords in the documents of the bibliographic collection # 1, the co-occurrence
network of the keywords in Figure 9 and the plot of Figure 10 are created. It is derived that
the term “smart city” has been used the most. It appeared in documents in the literature
collection #1 starting from 2013, and since 2016 its appearance has been very frequent.
Furthermore, the terms related to smart mobility, “smart mobility” and “smart transporta-
tion”, appear in 2016 and their uses have been consistently high since then. The term
“carpooling” is used from 2008 until 2020. It is noteworthy that in the literature collection
Sustainability 2021, 13, x FOR PEER REVIEW 11 of 31
#1 appear the terms “blockchain”, “big data”, and “internet of things”, a fact that describes
Sustainability 2021, 13, x FOR PEER REVIEW 11 of 31
the interaction of these thematic areas with smart cities and smart mobility.
Figure 9.
Figure 9. Co-occurrence
Co-occurrence network
network of
of keywords
keywords in
in literature
literature collection
collection#1.
#1.
Figure 9. Co-occurrence network of keywords in literature collection #1.
Figure 10. Cumulative occurrences of top keywords in literature collection #1.
Figure
Figure10.
10. Cumulative
Cumulativeoccurrences
occurrences of
of top
top keywords
keywords in
in literature
literature collection
collection #1.
#1.
Thematic map: The co-word analysis creates the thematic map of Figure 11, which
Thematic
Thematic map:
map: TheThe co-word
co-word analysis
analysis creates
creates the
the thematic
thematic map
map of of Figure
Figure 11,
11, which
which
reveals that the largest clusters include the themes of “smart city–smart mobility–internet
reveals
reveals that
that the
the largest
largest clusters
clusters include
include the
the themes
themes ofof “smart
“smart city–smart
city–smart mobility–internet
mobility–internet
of things” and “carpooling–ridesharing–incentives”. They are in the lower-right quadrant
of
ofthings”
things”and
and“carpooling–ridesharing–incentives”.
“carpooling–ridesharing–incentives”. They They are
are in
in the
the lower-right
lower-right quadrant
quadrant
and indicate basic themes necessary for the development of the area. Moreover, the lower-
and
andindicate
indicatebasic
basicthemes
themesnecessary
necessaryfor
forthe
thedevelopment
developmentof ofthe
thearea.
area.Moreover,
Moreover,the
thelower-
lower-
right quadrant includes the cluster with the themes “blockchain–cloud computing–inter-
right quadrant
right quadrant includes the cluster with the themes “blockchain–cloud computing–inter-
the cluster with the themes “blockchain–cloud computing–internet
net of vehicles”. The upper-left quadrant, which represents the area of the isolated themes,
net of vehicles”. The upper-left quadrant, which represents the area of the isolated themes,
includes the themes of the “congestion–high occupancy vehicle–HOV effectiveness”.
includes the themes of the “congestion–high occupancy vehicle–HOV effectiveness”.Figure 10. Cumulative occurrences of top keywords in literature collection #1.
Thematic map: The co-word analysis creates the thematic map of Figure 11, which
reveals that the largest clusters include the themes of “smart city–smart mobility–internet
Sustainability 2021, 13, 10680 of things” and “carpooling–ridesharing–incentives”. They are in the lower-right quadrant 11 of 29
and indicate basic themes necessary for the development of the area. Moreover, the lower-
right quadrant includes the cluster with the themes “blockchain–cloud computing–inter-
of
netvehicles”. TheThe
of vehicles”. upper-left quadrant,
upper-left which
quadrant, whichrepresents
representsthe
thearea
areaofofthe
theisolated
isolated themes,
themes,
includes
includes the
the themes
themes of
of the
the “congestion–high
“congestion–high occupancy
occupancy vehicle–HOV
vehicle–HOVeffectiveness”.
effectiveness”.
Sustainability 2021, 13, x FOR PEER REVIEW 12 of 31
Conceptual structure and topic dendrogram: Figure 12 present the results of the
MCA and k-means analysis. The two dimensions of the MCA plot explain 63% of the total
variance
Figure 11. of
Figure 11. the keywords
Thematic
Thematic map of
map (dimension
of literature
literature 1 = #1
collection
collection 41.96%,
[2]. dimension 2 = 20.74%). The analysis
#1 [2].
shows the formulation of five clusters, which express common concepts. The most im-
Conceptual
portant are the smartstructure and topic
city cluster (smartdendrogram: Figure 12 present
city–smart mobility–electric the results of the
vehicles–sustainabil-
MCA and k-means analysis. The two dimensions of the MCA
ity), the carpooling cluster (carpooling–congestion–optimization–ridesharing) plot explain 63% ofandthethe
total
in-
variance of the keywords (dimension 1 = 41.96%, dimension 2 = 20.74%).
ternet of things cluster (internet of things–blockchain–big data–security). These clusters The analysis
shows the formulation
have similar distance from of five
theclusters,
center ofwhich express common
the coordinates, and noneconcepts. Theatmost
is located impor-
the average
tant are the
concept smart
of the city cluster
literature (smart city–smart mobility–electric vehicles–sustainability),
collection.
the carpooling
The topic cluster (carpooling–congestion–optimization–ridesharing)
dendrogram in Figure 13 visualizes the hierarchical structure and the internet
of the key-
of things cluster (internet of things–blockchain–big data–security). These
words, identifying that the carpooling cluster is closer to the incentives cluster, which in clusters have
similar
turn aredistance from
close to the the center
internet of thecluster.
of things coordinates,
The smartandcity
none is located
cluster at the
is closer average
to the smart
concept of the literature
governance cluster. collection.
of literature
Figure 12. Conceptual structure of literature collection
collection #1.
#1.
The topic dendrogram in Figure 13 visualizes the hierarchical structure of the key-
words, identifying that the carpooling cluster is closer to the incentives cluster, which in
turn are close to the internet of things cluster. The smart city cluster is closer to the smart
governance cluster.Sustainability 2021, 13, 10680 12 of 29
Figure 12. Conceptual structure of literature collection #1.
Figure 13.
Figure 13. Topic dendrogram of
Topic dendrogram of literature
literature collection
collection #1.
#1.
4.1.2. Literature Collection
4.1.2. Literature Collection #2#2
Source growth: Studying
Source growth: Studying thethe evolution
evolution ofof the
the sources
sources for
for the
the literature
literature collection
collection #2,
#2,
it is revealed that there are documents from 103 different sources. Considering
it is revealed that there are documents from 103 different sources. Considering that the that the
collection
collection includes
includes112
112documents,
documents,it itappears
appears that there
that areare
there fewfew
sources withwith
sources more thanthan
more one
Sustainability 2021, 13, x FOR PEER REVIEW 13 of 31
publication. Examining the citations of the sources shown in Figure 14, it
one publication. Examining the citations of the sources shown in Figure 14, it is revealedis revealed that
the
that“International Journal
the “International of Information
Journal Management”
of Information Management” has onehasdocument
one documentin the in
collection
the col-
which
lectionhas 259 citations.
which The next The
has 259 citations. source is “IEEE
next sourceCommunications Magazine”,Magazine”,
is “IEEE Communications which has
which
166 has 166
citations citations
with with onefollowed
one document, document, byfollowed
“Journal by “Journal ofManufacturing”
of Intelligent Intelligent Manufac-
with
turing”
125 withfrom
citations 125 citations from one
one document document as well.
as well.
Figure14.
Figure 14. Source
Source growth
growthof
ofliterature
literaturecollection
collection#2.
#2.
Topkeywords-co-occurrence
Top keywords-co-occurrencenetwork: network:To Tounderstand
understandthe theinterconnection
interconnection and and evo-
evo-
lution of keywords in the documents of the bibliographic collection #2,
lution of keywords in the documents of the bibliographic collection #2, the co-occurrencethe co-occurrence
networkofofthe
network thekeywords
keywordsinin Figure
Figure 1515andand
thethe
plotplot of Figure
of Figure 16 is16 is created.
created. It is derived
It is derived that
thatterm
the the “smart
term “smart
city” hascity” has
been usedbeen
theused
most.the most. Itinappears
It appears documents in documents
published frompublished
2011,
fromsince
and 2011,2015
andits
since 2015 its appearance
appearance has been very hasfrequent.
been veryFurthermore,
frequent. Furthermore, the term
the term “business
“business
model” model”
is used is used since
frequently frequently since theofbeginning
the beginning of thewhile
the collection, collection,
the termwhile the term
“internet of
“internet
things” of things”
appears in 2015appears
and hasinbeen
2015consistently
and has been consistently
frequent frequent
since then. since then. that
It is noteworthy It is
in the literature
noteworthy thatcollection #2, the terms
in the literature “carpooling”,
collection “blockchain”,
#2, the terms “shared
“carpooling”, economy”,
“blockchain”,
and “platform”
“shared appear,
economy”, anda “platform”
fact that describes
appear,the interaction
a fact of thesethe
that describes knowledge
interactionareas
of with
these
smart cities and
knowledge areasbusiness models.
with smart cities and business models.from 2011, and since 2015 its appearance has been very frequent. Furthermore, the te
“business model” is used frequently since the beginning of the collection, while the te
“internet of things” appears in 2015 and has been consistently frequent since then. I
noteworthy that in the literature collection #2, the terms “carpooling”, “blockchai
Sustainability 2021, 13, 10680 “shared economy”, and “platform” appear, a fact that describes the interaction
13 of 29 of th
knowledge areas with smart cities and business models.
Sustainability 2021, 13, x FOR PEER REVIEW 1
Sustainability 2021, 13, x FOR PEER REVIEW
Figure 15. Co-occurrence network of keywords in literature collection #2. 14
Figure 15. Co-occurrence network of keywords in literature collection #2.
Figure 16.Figure
Figure16.
16.Cumulative
Cumulative Cumulativeoccurrences
occurrences
occurrences of
oftop
topkeywords
of top keywords keywords in literature
literature collection
incollection
in literature #2. #2.
Thematic map: Thematic
Thematic
The co-wordmap: The
The co-word
map:analysisco-word analysis
createsanalysis creates the thematic
createsmap
the thematic map
of Figuremap of Figure
of
17, whichFigure 17,
17, w
w
reveals that thereveals
largestthat
reveals thatthe
thelargest
clusters are theclusters
largest areas ofare
clusters are the
the areas
“smart areas of
of “smart models”
city–business city–business
city–business models” and
models”
and “shared and“sh
“s
economy–sustainability”,
economy–sustainability”,
economy–sustainability”, which are in the which
which are
are in
lower-rightin the
the lower-right
lower-right
quadrant quadrant
of the the The
of the
basic themes. basic themes
basic theme
lower-right
lower-right
lower-right quadrant quadrant
includes the includes
quadrant includes
cluster the
the cluster
with cluster
the with
with
areas the areas
“mobile applications–sma
“mobile applications–sma
applications–smart”
as well. well.
well.
Figure 17. Thematic mapFigure 17. Thematic
of literature map of literature collection #2.
collection
Figure 17. Thematic map#2.
of literature collection #2.
Conceptual structure and topic dendrogram: Figure 18 presents the results o
Conceptual structure and topic dendrogram: Figure 18 presents the results
MCA and k-means analysis. The two dimensions of the MCA plot explain 81.24% o
MCA and k-means analysis. The two dimensions of the MCA plot explain 81.24%
total variance of the keywords (dimension 1 = 58.38%, dimension 2 = 22.86%). The ana
total variance of the keywords (dimension 1 = 58.38%, dimension 2 = 22.86%). The an
shows five clusters, of which the smart city–business model cluster is the nearest t
shows five clusters, of which the smart city–business model cluster is the nearestSustainability 2021, 13, 10680 14 of 29
Conceptual structure and topic dendrogram: Figure 18 presents the results of the
MCA and k-means analysis. The two dimensions of the MCA plot explain 81.24% of
the total variance of the keywords (dimension 1 = 58.38%, dimension 2 = 22.86%). The
analysis shows five clusters, of which the smart city–business model cluster is the near-
est to the center of the coordinates, showing that it is closer to the average concept of
the literature collection. The next cluster nearest to the center of the coordinates is the
carpooling cluster (electric vehicle–shared economy–sustainability–carpooling–smart mo-
bility). The 5G cluster (5G–security–digital transformation), the internet of things cluster
(internet of things–blockchain–business processes), and the platform cluster (platform–
Sustainability 2021, 13, x FOR PEER REVIEW
mobile applications–mobile services) are more isolated from the average concept 15 of 31
of the
literature collection.
Sustainability 2021, 13, x FOR PEER REVIEW 15 of 31
Figure
Figure 18.
18. Conceptual
Conceptualstructure
structureofofliterature collection
literature #2.#2.
collection
The topic dendrogram in Figure 19 visualizes the hierarchical structure of the key-
words, identifying that the smart city–business model cluster is closer to the carpooling
cluster, which
Figure 18. in turnstructure
Conceptual connectoftoliterature
the 5G cluster.
collection #2.
Figure 19. Topic dendrogram of literature collection #2.
4.1.3. Literature Collection #3
Source growth: Analyzing the evolution of the sources of the literature collection #3
plotted in Figure 20, it is found that there are 162 documents from 120 different sources.
Thirty-seven documents,
Figure 19. Topic dendrogram
dendrogram corresponding
of literature
of to 23%, come
literature collection
collection #2. from nine sources. It is worth men-
#2.
tioning that the “IEEE Internet of Things Journal”, which has published four documents,
4.1.3.
4.1.3.
is LiteratureofCollection
Literature
the publisher [30] which#3
Collection #3provides a comprehensive survey of the enabling technolo-
gies, Source
protocols,
Source growth: Analyzingfor
and
growth:architecture
Analyzing anevolution
the
the urban IoTof
evolution ofservice
the and has
the sources
sources ofreceived
of the 2043 citations.
the literature
literature collection
collection #3
#3
plotted
plotted in
in Figure
Figure 20,
20, it
it is
is found
found thatthat there
there are
are 162
162 documents from 120
documents from 120 different
different sources.
sources.
Thirty-seven
Thirty-seven documents,
documents, corresponding
corresponding to to 23%,
23%, come
come from
from nine
nine sources. It is
sources. It is worth
worth men-
men-
tioning that the “IEEE Internet of Things Journal”, which has published four
tioning that the “IEEE Internet of Things Journal”, which has published four documents, documents, is
is the publisher of [30] which provides a comprehensive survey of the enabling technolo-
gies, protocols, and architecture for an urban IoT service and has received 2043 citations.Sustainability 2021, 13, 10680 15 of 29
Sustainability 2021, 13, x FOR PEER REVIEW 16 of 31
Sustainability 2021,
the13,publisher
x FOR PEERof
REVIEW
[30] which
provides a comprehensive survey of the enabling technologies, 16
protocols, and architecture for an urban IoT service and has received 2043 citations.
Figure 20. Source growth of20.literature collection #3.
Figure 20. Source growthFigure Source
of literature growth
collection of literature
#3. collection #3.
Source co-citation
Source co-citation network:
Source
network: The
Theco-citation
co-citation network:network
co-citation of
of the
The co-citation
network sources
network
the sources shown in
of thein
shown Figureshown
sources
Figure 21 in F
21reveals
revealsthe
theexistence
existence of
21 reveals one
the main cluster,
existence of which
one mainincludes
cluster, sources
which that focus
includes on
sourcesthe
of one main cluster, which includes sources that focus on the theory the-
that focus on th
ory of computing,
of computing, inory in information
of computing,
information and communications
in information and
and communications science and
communications
science technology
and technology science and
and inand in
technology a
shaping
shaping smart
smart city city evolution.
shaping
evolution. smart city evolution.
Figure
Figure 21.21. Source
Source Figure 21. network
co-citation
co-citation Source co-citation
network
ofof network
literature
literature of literature
collection
collection #3.#3. collection #3.
Top Top keywords-co-occurrence
Topkeywords-co-occurrence
keywords-co-occurrence network:To
network: network:the
Tounderstand
understand To understand
theinterconnection the interconnection
interconnection and
and evo-
evo- and
lution of keywords lution
in of
thekeywords
documents in the
of documents
the of
bibliographic the bibliographic
collection
lution of keywords in the documents of the bibliographic collection #3, the co-occurrence #3, collection
the #3,
co-occurrence the co-occur
network ofinthe keywords
networkofofthe
network thekeywords
keywords Figure
in Figure 22 andin
22 and theFigure
the plot 22Figure
plotofof and the
Figure plot
2323is of Figure
created.
is It 23
It is
created. is created.
derived
is derivedthat It is de
the term smart that has
city the been
term used
smartthe
citymost.
has beenIt used the
appears in most. It appears
documents in documents
published from 2011published
that the term smart city has been used the most. It appears in documents published from
and its appearance 2011isand
veryitsfrequent.
appearance The isterm
very internet
frequent.ofThe termisinternet
things the next ofmost
things is the next mos
frequent
2011 and its appearance is very frequent. The term internet of things is the next most fre-
term.term. quent term.
It is noteworthy that allIt the
is noteworthy
other that allasthebigother terms, such as big data, wireless s
quent It is noteworthy that all theterms,
other such
terms, such data,
as bigwireless sensor
data, wireless networks,
sensor
platform,platform, networks,
and architecture, platform, and
are used less architecture,
frequently. are used less frequently.
networks, and architecture, are used less frequently.You can also read