2013 Missouri Energy Resource Assessment - Missouri Division of ...
←
→
Page content transcription
If your browser does not render page correctly, please read the page content below
2013
Missouri Energy Resource Assessment

                         MO Department of Economic Development
                         Division of Energy
                         Revised June 2014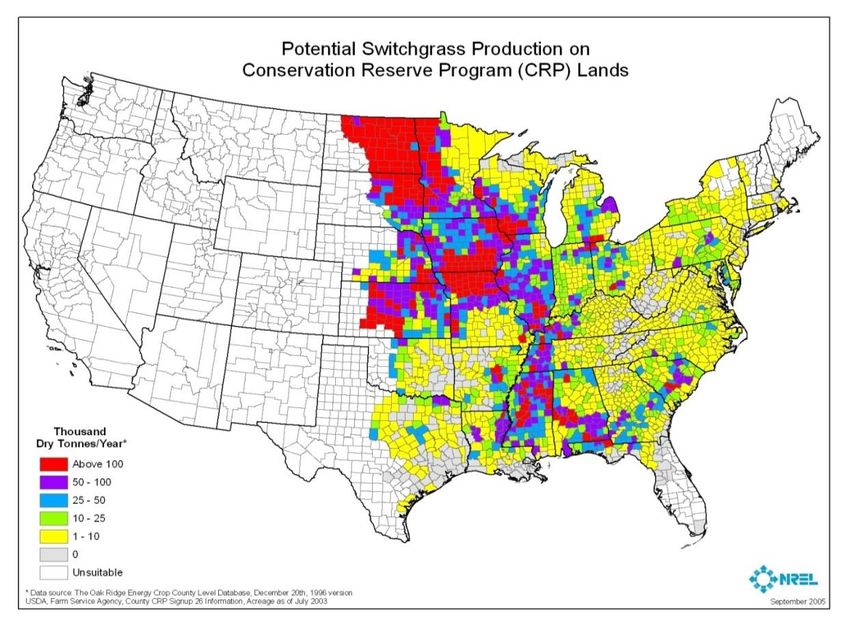
Table of Contents
Introduction ............................................................................................................1
Coal .............................................................................................................................................................3
Oil and Gas ...........................................................................................................17
Landfill Gas ...........................................................................................................27
Biomass .................................................................................................................................................. 33
Biofuels .................................................................................................................49
Ethanol…………………………………………………………………………………………………………………………………………49
Biodiesel………………………………………………………………………………………………………………………….. 52
Wind………………………………………………………………………………………………………………….. 57
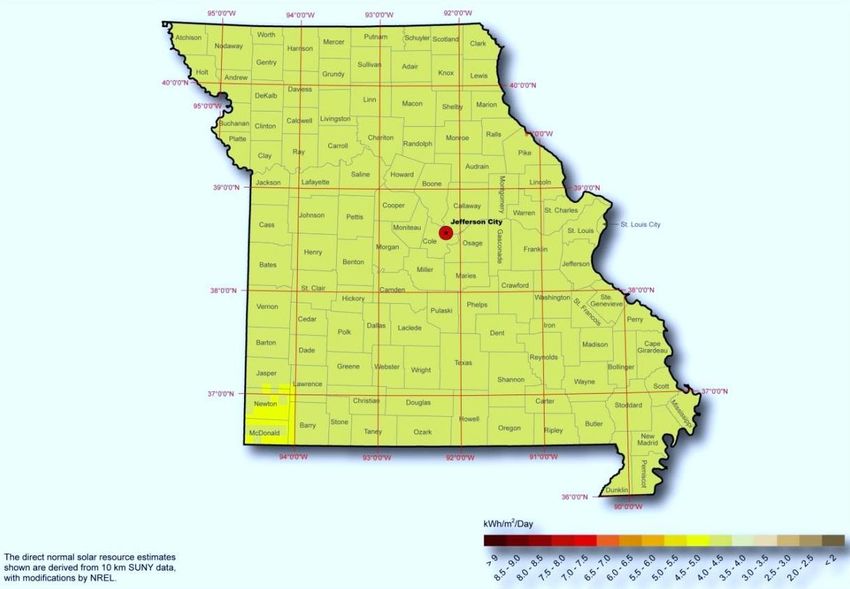
Solar………………………………………………………………………………………………………………….. 65
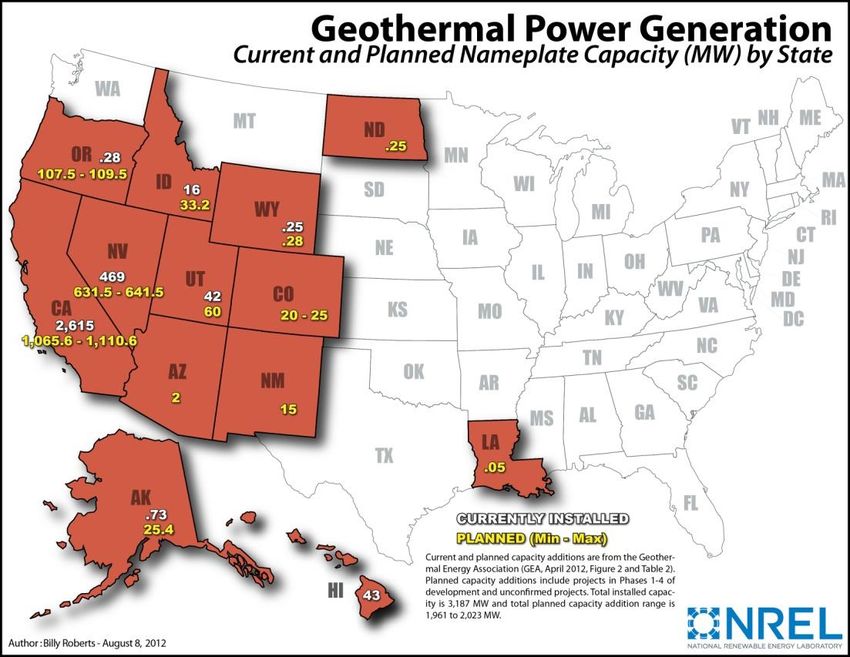
Geothermal……………………………………………………………………………………………………….. 69
Hydropower………………………………………………………………………………………………………. 75
Demand Side Management: Energy Efficiency & Demand Response…………………. 81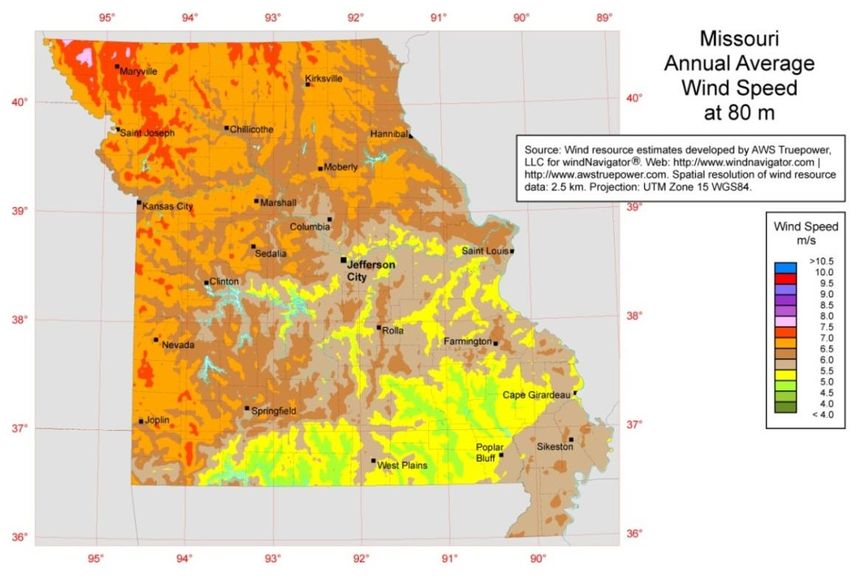
1. Introduction
       Missouri spends nearly $23 billion on energy annually. Most of these expenditures (52
percent) are in the transportation sector. Another 22 percent are expenditures by the residential
sector, 14 percent in the commercial sector and 12 percent by the industrial sector. Missouri
spent $6.7 billion, or 20 percent, of expenditures on the production of electricity in 2010.
Between 2009 and 2010, the energy expenditure level per dollar of economic output, measured
by state gross domestic product, rose by 12 percent. In 2011, the weighted-average price of
electricity across economic sectors ranks Missouri as 34th lowest in the country.
       Missouri’s energy profile is very diverse, with supplies of both traditional fossil fuel
resources and alternative resources. Included in our state’s energy resource portfolio are coal,
oil, natural gas, hydroelectric, landfill gas, ethanol, biodiesel, wind, solar, biomass and
geothermal sources. Energy efficiency is also an energy resource – often the lowest cost resource
– that is increasingly becoming an important part of meeting our state’s energy needs. The
development of each energy resource depends on many factors, including the location of the
resource, national and state policy, environmental regulations, transportation issues and national
and international market factors. Missouri’s ability to sustain energy production from each of
these sources depends on the interplay among these factors.
       Electricity in Missouri is generated from a mix of coal, hydroelectric power, natural gas,
nuclear and renewable resources. Missouri is most dependent upon coal, which produces 82
percent of the total electricity consumed. The next largest source of electricity is nuclear, which
accounts for 10 percent. Natural gas, hydropower and wind sources combine to produce the
remaining 8 percent of electricity generation.
       This first energy assessment catalogs publicly available information about the variety of
Missouri’s energy resources including fossil fuel resources, as well as energy efficiency and
renewable resources. The Department of Economic Development/Division of Energy used the
most current data available in the development of this report, but recognizes that new data may
be available when it is published. We look forward to annual updates and welcome comments to
improve the report. We hope the information in this document is useful and provides a basis for
discussions about Missouri’s energy and economic future.

                                                  1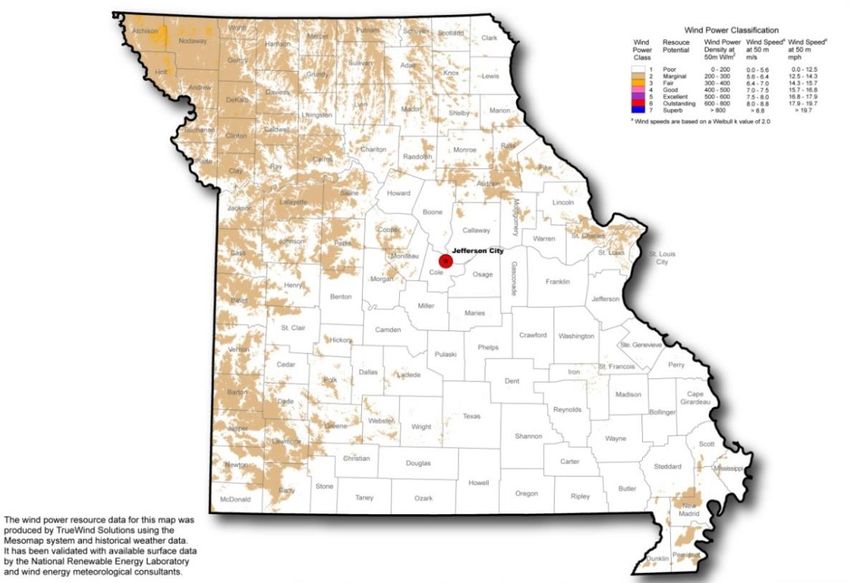
2
2. Coal
2.1 Background and History

        Coal production in the state of Missouri has been continuous since 1806. The first site to
be mined for coal in Missouri is located near Prairie City in Bates County. As the first state west
of the Mississippi River to produce coal on a commercial level, coal mining became a notable
part of the state economy by the 1880’s.1 Once coal mining began in earnest in the 1840’s, it
continued to operate effectively unregulated until 1971. The first legislation in Missouri to
regulate coal mining passed in 1971; by 1978, state law conformed to federal law (Public Law
95-87), which placed restrictions on coal mining activities.2 The enactment of the Surface
Mining Control and Reclamation Act of 1977 (SMCRA) impacted about 67,000 acres in 48
counties. Coal mines in Missouri were underground until the late 1920’s. The method used to
mine coal in Missouri gradually changed from underground mining to strip mining during the
1930’s to 1960’s.3

2.2 Resource Overview

        The majority of coal in the state is located in the western, northern and central regions.
Most coal in Missouri ranges from lignite to bituminous. Lignite coal is also called brown coal.
It is a brown carbonaceous sedimentary rock with a woody texture that consists of accumulated
layers of partially decomposed vegetation. Lignite is located in the Bootheel or southeastern
corner of the state (Figure 1-1).
        Bituminous coal is a soft black coal, rich in volatile hydrocarbons that burn with a smoky
yellow flame. It has high sulfur content and when burned, gives off sulfurous compounds that
contribute to air pollution and acid rain. Bituminous coal is located on the western edge and
northern half of the state. Missouri’s coal typically has relatively high sulfur content, averaging

1
  “Missouri Coal”, Missouri Department of Natural Resources, Division of Geology and Land Survey. N.d. Web.
August 28, 2012. .
2
  “Regulated Mining Activity”, Missouri Department of Natural Resources, Land Reclamation Program. N.d. Web.
August 28, 2012. < http://www.dnr.mo.gov/env/lrp/mininfo.htm>.
3
  “Missouri Coal”, Missouri Department of Natural Resources, Division of Geology and Land Survey. N.d. Web.
August 28, 2012. .

                                                     3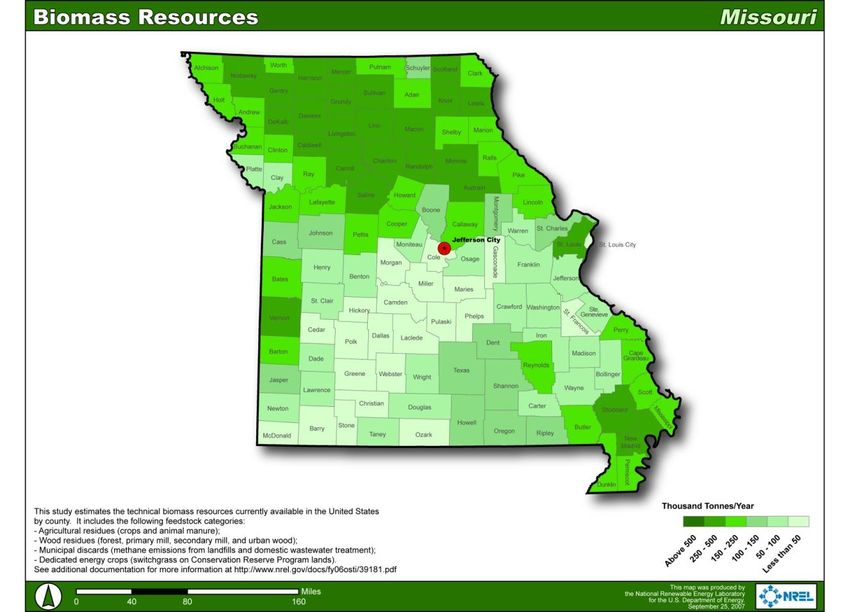
more than 2.5 pounds per million BTU (MMBtu) or 4 percent by weight. Approximately 33
percent of the state’s land, or 23,000 square miles, are in coal bearing areas.4
        More than half of the twenty identified coal seams have been mined. The total coal
reserve in Missouri is estimated to be about six billion tons, which accounts for less than 2
percent of the total coal reserve in the United States. It is also estimated that underground and
surface mineable deposits in Missouri are 689 and 3,156 million short tons, respectively, for
2010.5 The composition and production levels of Missouri coal restrict its influence on the state
and the nation’s economy and energy stability.

                          Figure 1-1. Coal Resource Distribution in Missouri

4
  “State Overview - Missouri”, United States Department of the Interior, Office of Surface Mining Reclamation and
Enforcement. N.d. Web. February 6, 2013. .
5
  “Table 15. Recoverable Coal at Producing Mines […]”, United States Energy Information Administration, 2011.
Web. August 28, 2012. .

                                                        4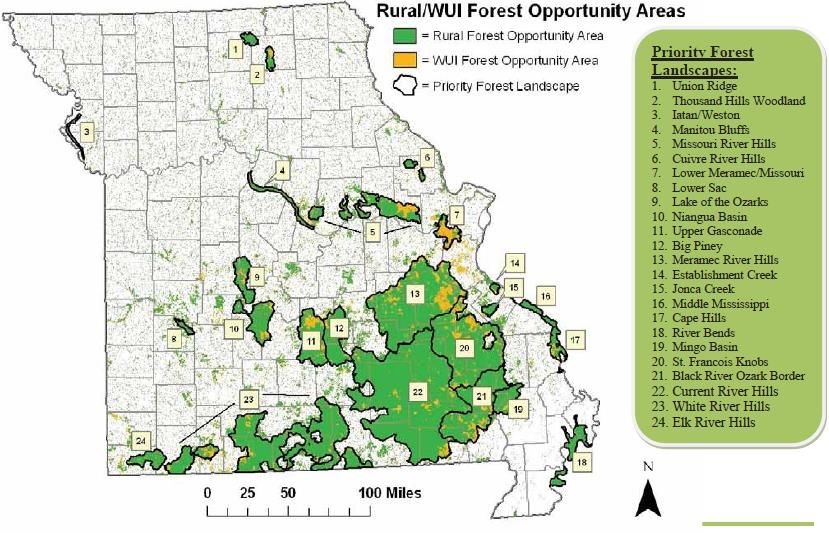
2.3 Coal Production

                                  8,000

                                  7,000

                                  6,000
            Thousand Short Tons

                                  5,000

                                  4,000

                                  3,000

                                  2,000

                                  1,000

                                     0

                                          Figure 2-2. Coal Production in Missouri (1960-2010)6
                                                (Refuse recovery is included beginning in 2001)

        Coal production in Missouri reached its peak from the mid-1970s to mid-1980s (Figure
2-2). The highest production of 6,733,000 short tons occurred in 1984, after which production
began a steady decline in the state. A dramatic decrease in coal production occurred in 1993.
The decrease in production was attributed, in part, to the 1990 Clean Air Act amendments that
restricted sulfur dioxide emissions. Coal-fired plants were faced with a decision to install sulfur
dioxide scrubbers in their plants or purchase lower sulfur content coal. Due to Missouri coal’s
high sulfur content, demand for Missouri coal decreased. Increased regulation on surface coal
mining also contributed to the drop in production.7 As of 2010, Missouri had two active surface
mines that produced 458,000 short tons of coal.8 This level of production ranks Missouri as 23rd

6
  “Table PT1. Energy Production in Physical Units, Missouri, 1960-2010”, United States Energy Information
Administration, 2010. August 28, 2012. .
7
  “Overview: The Clean Air Acts Amendments of 1990”, United States Environmental Protection Agency. N.d.
Web. August 28, 2012. < http://www.epa.gov/oar/caa/caaa_overview.html>.
8
  “Table 1. Coal Production and number of mines by State and Mine Type, 2011 and 2010”, United States Energy
Information Administration. 2012. Web. February 6, 2013. .

                                                                  5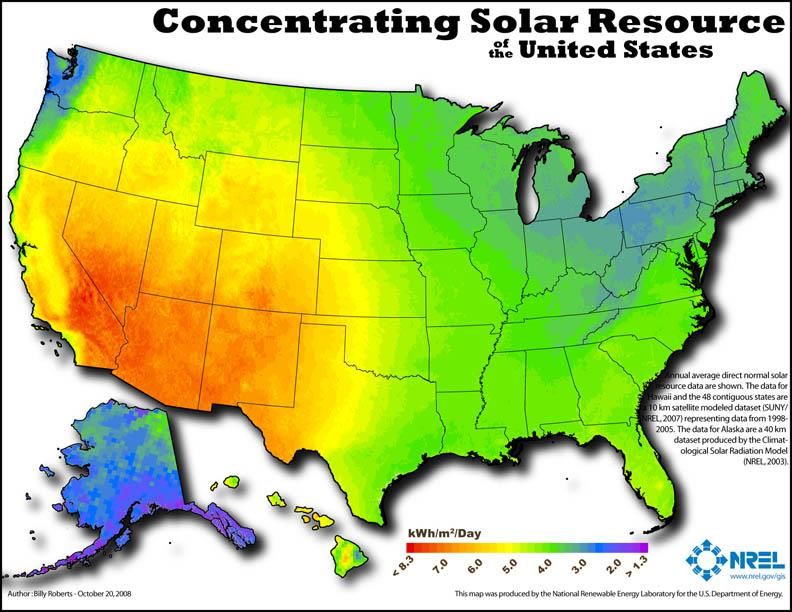
in the nation.9 However, this low level of production means that nearly all coal supplies are
imported from out of state.10

                                                                                     Coal

                                                                                     Petroleum
            81.3%
            Coal                                                                     Natural Gas
                                                                   5.1%
                                                                   Natural Gas       Other Gases

                                                                                     Nuclear

                                                                                     Hydroelectric
                                                                     9.7%            Conventional
                                                                     All Other       Wind

                                                                                     Wood and Wood
                                                                                     Derived Fuels
                                                                                     Other Biomass

                                                                                     Pumped Storage

                                                                                     Other

                  Figure 2-3. Net Electrical Generation by Energy Source (2010)11

2.4 Coal Consumption

        In 2010, Missouri produced 75,047 gigawatt hours (GWh) of electricity from coal, which
accounts for about 81 percent of annual net generation by all energy resources (Figure 2-3). In
2009, Missouri power plants burned approximately 699 billion BTUs of coal to generate
electricity.12 Electric power producers consumed 9,913,000 tons in coal stocks during 2010.
        The coal consumption in Missouri and selected neighboring states (Illinois, Indiana,
Iowa, Kansas and Arkansas) for 2010 and 2011 is shown in Figure 2-4. Figure 2-5 shows the
total coal consumption per capita for those states, including electricity generation and other
industrial usage. Between 1989 and 2009, coal use increased in Missouri by 1.27 percent. Most
coal produced in Missouri has been sold out of the state (Figure 2-6). In fact, Kansas buys most

9
  “Rankings: Coal Production, 2011 (thousand short tons)”, United States Energy Information Administration. 2012.
Web. October 2, 2012. .
10
   “Missouri Fossil Fuel Use at a Glance”, Missouri Department of Economic Development, Division of Energy. N.d.
Web. February 6, 2013. < http://ded.mo.gov/energy/docs/Missouri%20Fossil%20Fuel%20Use%202010.pdf>.
11
   “Detailed State Data, Net Generation by State”, United States Energy Information Administration, Electricity.
2012. February 6, 2013. .
12
   “Missouri Fossil Fuel Use at a Glance”, Missouri Department of Economic Development, Division of Energy. N.d.
Web. February 6, 2013. < http://ded.mo.gov/energy/docs/Missouri%20Fossil%20Fuel%20Use%202010.pdf>.

                                                       6
of the coal produced in Missouri. Due to the state’s heavy reliance upon coal and its low
production levels, Missouri’s ability to import a reliable supply of coal is vital for the production
of electricity and supporting the state’s overall economy. In 2011, Missouri purchased more than
44.5 million tons of coal in order to generate this power (Figure 2-7).13 In 2010, 97 percent of
the coal purchased was imported from Wyoming (Figure 2-8).
60,000
50,000 Illinois
Thousands of Short Tons
40,000 Indiana
30,000 Iowa
20,000 Missouri
10,000 Kansas
0 Arkansas
Electric Power Other Industries Electric Power Other Industries
2009 2010
Figure 2-4. Coal Consumption in Missouri and Neighboring States
13
“Missouri Electricity Profile 2010”, United States Energy Information Administration. January 2012. Web.
August 28, 2012. .
710
9
8
7
6
Short Tons
5
4
3
2
1
0
Illinois Indiana Iowa Missouri Kansas Arkansas
Figure 2-5. Total Coal Consumption per Capita in Selected States (2010)
350,000
300,000
250,000
Short Tons
200,000
150,000
100,000
50,000
0
2008 2009 2010 2011
Out of state Purchases of Mo Coal (tons)
Total In-State Purchases (tons)
Figure 2-6. Missouri’s Indigenous Coal Destinations
846,000
45,500
45,000
Thousand Short Tons
44,500 5 Year average
44,000
43,500
43,000
42,500
42,000
41,500
41,000
40,500
2007 2008 2009 2010 2011
Figure 2-7. Total Coal Consumption for Electricity Generation (2008-2011)
IL 2%
KS .3%
KY .07%
MO .1%
UT .6%
WY 97%
Figure 2-8. Missouri’s Coal Purchase by State of Origin (2010)
9Missouri ranks 6th in the nation for the total coal consumption used in electric power
generation.14 Nearly all coal purchased by Missouri, either in-state or out-of-state, is used to fire
generation plants for electric utilities (Figure 2-9 and Figure 2-10).15 In 2009, Missouri power
plants burned approximately 699 billion BTUs of coal to generate electricity. 16 In April 2012,
coal generated slightly less than 22,500 megawatt hours of electricity compared to April 2011,
which produced slightly over 25,000 megawatt hours.
Figure 2-9. Coal Consumption - State, Region and U.S. (2009 and 2010)
14
“Coal: Consumption By End Use Sector, by Census Division and State”, United States Energy Information
Administration. November-December 2012. Web. October 2, 2012.
.
15
“Missouri: Profile Overview”, United States Energy Information Administration. July 2012. Web. February 6,
2013. .
16
“Missouri Fossil Fuel Use at a Glance”, Missouri Department of Economic Development, Division of Energy. N.d.
Web. February 6, 2013. < http://ded.mo.gov/energy/docs/Missouri%20Fossil%20Fuel%20Use%202010.pdf>.
10Figure 2-10. Net Generation from Coal in Missouri (2011 and 2012)17
Figure 2-11 shows the annual amount of coal purchased by Missouri’s investor-owned
utilities (IOUs) from 2008 to 2011. These include Ameren Missouri, Kansas City Power &
Light Company, Kansas City Power & Light Greater Missouri Operations (formerly Aquila, Inc.
and St. Joseph Light & Power service areas before 2009), and the Empire District Electric
Company. Figure 2-12 shows the annual amount of coal purchased by utilities (IOUs, municipal
utilities and rural electric cooperatives) from 2008 and 2011.
17
“Table 1.7.B. Net Generation from Coal”, United States Energy Information Administration, Electric Power
Monthly. January 2013. Web. February 6, 2013.
.
1125,000,000 Empire District Electric
Co.
Tons of Coal Purchased
20,000,000 Kansas City Power &
Light Co.
15,000,000
Ameren Missouri
10,000,000
KCP&L Greater
Missouri Operations
5,000,000
Co.
Aquila, Inc.
0
2008 2009 2010 2011
Figure 2-11. Coal Purchased by Missouri’s Investor-Owned Utilities (2008-2011)
25,000,000
20,000,000
15,000,000
Tons
10,000,000
5,000,000
0
2008 2009 2010 2011
Aquila, Inc. Associated Electric Coop, Inc.
Central Electric Power Coop City of Columbia
City of Marshall City of Sikeston
City of Springfield Empire District Electric Co.
City of Independence Kansas City Power & Light Co.
Ameren Missouri University of Missouri-Columbia
Figure 2-12. Coal Purchases by Missouri’s Electric Utilities (2008-2011)
Compared with the electricity rates of other states, Missouri’s utilities provide electricity
at reasonable lower rates, even with Missouri’s reliance upon coal imported from out-of-state
suppliers. Figure 2-13 shows the cost for electricity in Missouri is lower than both the national
and regional average price.
1212
10
8
Cents/KWh 6
4
2
0
West
Missouri North U.S. Total
Central
All Sectors April 2012 7.74 8.09 9.52
All Sectors April 2011 7.58 7.91 9.64
Figure 2-13. Average Retail Price of Electricity to Customers
Figure 2-14. Average Retail Price of Electricity to Customers18
18
“Table 5.6.A. Average Retail Price of Electricity to Ultimate Consumer by End-Use Sector”, United States
Energy Information Administration, Electric Power Monthly. January 2013. Web. February 6,
2013..
13Figure 2-14 shows the average retail price of electricity to different sectors, including
customers from residential, commercial, industrial and transportation. Based on the U.S.
Department of Energy’s Energy Information Administration (EIA) rankings, Missouri is
currently ranked 38th for average retail price for electricity with a price of 7.78 cents/kWh in
2010.19 In 2012, the average price of electricity was 9.83 cents/kWh for the United States and
7.74 cents/kWh for Missouri.20
The average sales price of coal in Missouri has been withheld in EIA data for the most
recent years (2009 and 2010) due to proprietary classification. The average cost of coal
delivered for electricity generation in Missouri increased by 6.9 percent between 2011 ($1.74 per
MMBTU) and 2012 ($1.86 per MMBTU).21 Historical electricity prices by sector are shown in
Figure 2-15 (nominal price) and Figure 2-16 (inflation adjusted price).
Figure 2-15. Missouri Average Electricity Price, 1970-2011 (nominal price)
19
“Table 1. 2010 Summary Statistics (Missouri)”, United States Energy Information Administration. 30 January
2012. Web. 2 October 2012. .
20
“State Electricity Profiles.” United States Energy Information Administration. January 2012. Web. October 2,
2012. .
21
“Missouri Data: Prices”, United States Energy Information Administration. January 2013. Web. February 6, 2013.
.
14Figure 2-16. Missouri Average Electricity Price, 1970-2011 (inflation adjusted price)
1516
3. Oil and Gas
3.1 Background and History

        The first oil and gas deposits were discovered in Missouri shortly after the Civil War in the 1860’s
when water wells were being drilled in the Kansas City area. More than 2,500 oil and gas wells were
drilled before the 1940’s. The newest oil and gas field in the state was discovered in northwest Missouri
along the Holt and Atchison county border in 1987.22

3.2 Description of Resource

        There are three traditional oil and gas producing sections in the state (Figure 3-1): the Forest City
Basin in northwestern Missouri, the Bourbon Arch in western Missouri and the Lincoln Fold in
northeastern Missouri. Nearly all of the current oil and gas production in Missouri uses conventional
drilling technologies.

22
  “Oil and Gas in Missouri”, Missouri Department of Natural Resources. June 2008. Web. August 31, 2012.
.

                                                           17
Figure 3-1. Oil and Gas Producing Areas in Missouri23
Even though Missouri has historically had limited supplies of traditional hydrocarbons, relatively
large deposits of “heavy oil” exist. Missouri potentially possesses large deposits of unconventional oil and
gas. The three primary unconventional resources of oil and gas include24:
1) Tar sand
Tar sand heavy oil can be found in the Bourbon Arch south of Kansas City. Nearly 800,000 barrels
of oil have been produced in Vernon County since 1960. It is estimated the Bourbon Arch has 1.4
to 1.9 billion barrels of oil from tar sands.
2) Coalbed methane gas
23
“Oil and Gas in Missouri”, Missouri Department of Natural Resources. June 2008. Web. August 31, 2012.
.
24
“Oil and Gas in the Show-Me State”, The Geologic Column of Missouri, Volume 2, Issue 1, Summer 2007. Web. August 31,
2012. < http://www.dnr.mo.gov/geology/docs/gcsummer7.pdf>.
18Coalbed methane gas is found within deeply buried coal seams and is located primarily in
northwest, north central and west central Missouri. In 2006, more than 3,200 coalbed methane
wells in Kansas produced nearly 24 billion cubic feet of gas. Many of these wells are located in the
same coal seams that occur in western Missouri. While coalbed methane has not yet been produced
economically in Missouri, it is likely that the methane will be extracted, given Missouri’s extensive
coal deposits.
3) Oil shale
Oil shale has been found overlying some coal beds in northern Missouri and in portions of the
Chattanooga Shale formation in the extreme southwest part of the state. Only the most preliminary
analyses have been conducted on Missouri oil shale. Even though the possibility remains that a
certain level of oil shale is present, many technical, economic and environmental issues need to be
solved before the resource can be developed commercially.
3.3 Current Production and Usage
Missouri historically has limited oil and gas production. In 2012, 172,512 barrels of crude oil were
produced from 405 oil wells in the state, which ranks as the third least among all 33 oil-producing states
(Figure 3-2)25. With the price range between $65.00 and $99.25 per barrel, the sale of crude oil was valued
at over $14.3 million, which almost tripled the oil value of $4.8 million in 200626. Figure 3-3 illustrates the
trend for field production of monthly crude oil from January 1981 to November 2013. Figures 3-4 shows
the oil production in the state over the past 30 years.
25
“Crude Oil Production, 1981-2012”, United States Energy Information Administration. September 2013.Web. January 30,
2014. < http://www.eia.gov/dnav/pet/pet_crd_crpdn_adc_mbbl_a.htm>.
26
“2012 Oil and Gas Activities and Production Report”, Missouri Department of Natural Resources, Division of Geology and
Land Survey. April 2013. Web. January 30, 2014. .
1910,000
9,000
8,000
Thousand Barrels
7,000
6,000
5,000
4,000
3,000 Missouri
2,000
1,000
0
South Dakota
Tennessee
New York
Ohio
Virginia
Arizona
Nevada
Indiana
Michigan
Alabama
Arkansas
Illinois
Missouri
Florida
West Virginia
Kentucky
Pennsylvania
Nebraska
Figure 3-2. Crude Oil Producing States Under 20 Million Barrels (2012)
35
30
Thousand Barrels
25
20
15
10
5
0
Jan-97
Jan-13
Jan-81
Jan-83
Jan-85
Jan-87
Jan-89
Jan-91
Jan-93
Jan-95
Jan-99
Jan-01
Jan-03
Jan-05
Jan-07
Jan-09
Jan-11
Sep-07
Sep-81
Sep-83
Sep-85
Sep-87
Sep-89
Sep-91
Sep-93
Sep-95
Sep-97
Sep-99
Sep-01
May-02
Sep-03
Sep-05
Sep-09
Sep-11
Sep-13
May-82
May-84
May-86
May-88
May-90
May-92
May-94
May-96
May-98
May-00
May-04
May-06
May-08
May-10
May-12
Figure 3-3. Missouri Monthly Field Production of Crude Oil (Jan. 1981~ Nov. 2013)27
Oil is currently produced by 18 companies in six counties (Figure 3-5). Figure 3-6 shows the oil
production along with its respective percentage and sale value for each county. Cass County is the largest
oil producing county in the state with 94,950 barrels in 2012, which accounts for 55 percent of the total
27
“Missouri Field Production of Crude Oil (Monthly)”, United States Energy Information Administration. January 2014. Web.
January 30, 2014. .
20crude oil produced in Missouri.28 Table 3-1 and Figure 3-7 give the oil production in 2012 by each
operator.
300
250
Thousand of Barrels
200
150
100
50
0
Figure 3-4. Missouri Annual Crude Oil Production (1981~ 2012)29
28
“2012 Oil and Gas Activities and Production Report”, Missouri Department of Natural Resources, Division of Geology and
Land Survey. April 2013. Web. January 30, 2014. .
29
“Missouri Field Production of Crude Oil (Annual)”, United States Energy Information Administration. January 2013. Web.
January 30, 2014. .
21Figure 3-5. Commercial Oil and Gas Producing Counties in Missouri (2012)
23,733 (14%) 16,942(10%)
$1,876,343 $1,356,291
Atchison
20,428 (12%) Cass
$1,751,363
Jackson
9 (Commercial gas production activities currently occur only in Vernon County. However, permits have been
issued to construct new commercial gas wells in Clinton County.
Four counties (Cass, Clay, Clinton and Jackson) have approximately 500 private gas wells in the
state. The status of most of those wells is unknown due to the lack of required production reporting. Of the
50 known active private gas wells in use, 32 wells are located in Cass County. Almost all of the gas from
private gas wells is being used in private homes and small businesses to fuel heating appliances. The total
marketed production for the state from 1960-2010 is illustrated in Figure 3-8.31 The cumulative natural gas
production for the top six counties in Missouri from 1928 through 2013 is represented in Figure 3-9.32
100
90
80
Thousand of Barrels
70
60
50
40
30
20
10
0
Figure 3-7. Missouri Crude Oil Production by Operator (2012)
31
“Table 13. Natural Gas Production, Transmission, and Consumption by State, 1967-2000”, United States Energy Information
Administration. N.D.Web. January 30, 2014.140
120
100
Million Cubic Feet
80
60
40
20
0
1960 1970 1980 1990 2000 2010
Figure 3-8. Missouri Natural Gas Marketed Production (1960-2010)
12,000
10,000
8,000
MMCF
6,000
4,000
2,000
0
Clay Jackson Cass Clinton Vernon Caldwell
Figure 3-9. Total Cumulative Natural Gas Production by County (1928-2012)
24160
140
120
Trillion Cubic Feet
100
80
60
40
20
0 New York
Utah
Ohio
Alabama
Iowa
California
Colorado
Arkansas
Missouri
Virginia
Montana
Wyoming
Indiana
Illinois
North Dakota*
Texas
Michigan
Kentucky
Nebraska
New Mexico
Louisiana
Oklahoma
Maryland
Pennsylvania
Figure 3-10. Estimated Recoverable Shale Gas Reserves in Selected U.S. States
Even though hydraulic fracturing has been utilized by the gas industry for decades, it has
experienced a resurgence in popularity with the development of horizontal drilling. Technological
advancements in drilling techniques have made previously unavailable gas deposits within reach. The
development of horizontal drilling has increased the productivity of individual wells. The Bureau of
Economic Analysis estimates that Missouri has two trillion cubic feet (TCF) of shale gas deposits that are
currently economically recoverable, amounting to $217 billion in 2010 real state GDP (at a price of
$4/mcf).33 Figure 3-10 displays a comparison of estimated recoverable shale gas deposits for the top 24
states. This amount of potential shale gas is comparable to what is found in Nebraska, Iowa and Virginia,
but still is small on the national scale with several states having hundreds and into the thousands of TCF.
33
“Potential Impact of Natural Gas Fracking on Municipal Bond Issuers”, Kroll Bond Rating Agency, Inc. January 2012. Web.
August 28, 2012. < http://www.magny.org/event-presentations/01-20-12_potential_impact_of_%20natural_gas_fracking.pdf>.
2526
4. Landfill Gas
4.1 Landfill Gas Production

       Landfill gas is created by the anaerobic decomposition of waste materials in a landfill. The
captured gas can be used either to produce heat for thermal applications or to generate electricity. While
the use of landfill gas as a renewable resource in the state is relatively small compared to other energy
resources, it has been actively recovered in recent years to generate significant amounts of energy. From
2006 to 2010, the net electricity generation from landfill gas has tripled from less than 20 to 60 gigawatt
hours (GWh) (Figure 4-1).
       According to the Environmental Protection Agency’s (EPA) Landfill Methane Outreach Program
(LMOP), there are currently ten landfills in the state capturing landfill gas and using it for direct heating
and/or electricity generation. Seven of these ten landfills employ the landfill gas to produce electricity with
a combined generating capacity of 29 MW. Another 1.6 MW capacity landfill gas-to-electricity project is
under development at the State Fair Community College in Sedalia, Missouri. When it is completed, it will
add to the total generation capacity from landfill gas for a total amount of about 30 MW in the state. Table
4-1 lists all landfill gas-to-energy projects already in operation and under development.

                70

                60

                50

                40
          GWh

                30

                20

                10

                 0
                           2006          2007           2008          2009            2010

                     Figure 4-1. Net Electricity Generation by Landfill Gas in Missouri (2006-2010)

                                                        27
4.2 Landfill Gas Resources
The LMOP defines a candidate landfill for an energy project as one that is currently accepting waste
or has been closed for less than five years, has at least one million tons of waste in place, and does not have
an operating or under construction landfill gas-to-energy project. Many of the active landfills in the state
have landfill gas-to-energy projects in place or plan to put the systems in place. As these landfills continue
to accept more waste, their potential for energy production increases, producing more renewable
recoverable gas for energy generation.
Table 4-1. Landfill Gas-to-Energy Projects in Missouri
LFG Flow Emission
Landfill Landfill Landfill Owner Project LFGE LFGE Project MW to Project Reductions
Name Landfill City County Organization Start Date Utilization Type Capacity (mmscfd) (MMTCO2E/yr)
City of
Columbia City of Columbia, Reciprocating
SLF Columbia Boone MO 6/16/2008 Electricity Engine 3.1 0.089
City of
Columbia City of Columbia,
SLF Columbia Boone MO 8/31/2011 Electricity Cogeneration 0.0 0.000
Courtney
Ridge
Landfill, Republic Services,
LLC Independence Jackson Inc. 5/1/2009 Direct Direct Thermal 2.880 0.237
City of Fulton, Reciprocating
Fulton SLF Fulton Callaway MO 8/31/2011 Electricity Engine 0.2 0.010
Maryland Progressive Waste
IESI Landfill Heights St. Louis Solutions Ltd. 1/1/1983 Direct Direct Thermal
Maryland Progressive Waste
IESI Landfill Heights St. Louis Solutions Ltd. 1/1/1986 Direct Greenhouse 0.058 0.005
Maryland Progressive Waste
IESI Landfill Heights St. Louis Solutions Ltd. 1/1/1997 Direct Boiler 0.300 0.025
Maryland Progressive Waste
IESI Landfill Heights St. Louis Solutions Ltd. 1/1/2009 Direct Direct Thermal 0.010 0.001
Jefferson
City Sanitary Republic Services,
Landfill Jefferson City Cole Inc. 3/31/2009 Electricity Cogeneration 3.2 1.728 0.135
Lamar City of Lamar, Reciprocating
Landfill Lamar Barton MO 6/30/2010 Electricity Engine 5.6 0.236
Rumble SLF Waste
I & II Sugar Creek Jackson Management, Inc. 1/1/1998 Direct Greenhouse 0.022 0.002
Rumble SLF Waste
I & II Sugar Creek Jackson Management, Inc. 9/1/2005 Direct Direct Thermal 1.400 0.115
Springfield
Sanitary City of Reciprocating
Landfill Willard Greene Springfield, MO 5/10/2006 Electricity Engine 3.0 1.580 0.127
St. Joseph City of St. Joseph, Reciprocating
City SLF St. Joseph Buchanan MO 3/30/2012 Electricity Engine 1.6 0.068
Central
Missouri WCA Waste
SLF* Sedalia Pettis Corporation 1.6
28LFG Flow Emission
Landfill Landfill Landfill Owner Project LFGE LFGE Project MW to Project Reductions
Name Landfill City County Organization Start Date Utilization Type Capacity (mmscfd) (MMTCO2E/yr)
Veolia ES
Oak Ridge Veolia ES Solid
Landfill, Inc. Ballwin St. Louis Waste, Inc. 6/1/2009 Direct Direct Thermal 1.150 0.094
Maryland Progressive Waste Ameren Reciprocating
IESI Landfill Heights St. Louis Solutions Ltd. Missouri Electricity Engine 14.7 0.635
Total 33.0 1.779
*under development as of January 2014
Source: EPA LMOP; Updated Lamar Landfill - MW Capacity from Missouri Public Utility Alliance and Emission Reduction calculation by MDED/DE.
Table 4-2 gives the locations of the 16 candidate landfills in the state. A preliminary analysis
estimates that a total of an additional approximately 30 MW capacity could be realized from these
candidate landfills if they were all developed for electricity generation.
Table 4-2. Candidate Landfills for Energy Projects
Year Landfill
Landfill Owner Waste in
Landfill Name Landfill City Landfill County Landfill Closure Landfill Owner
Organization Place (tons)
Opened Year
Backridge Landfill La Grange Lewis Republic 890,000 1990 2021 Republic Services, Inc.
Services, Inc.
Black Oak Hartville Wright WCA Waste 4,460,000 1989 2031 WCA Waste Corporation
Recycling & Corporation
Disposal SLF
Bridgeton Landfill Bridgeton St. Louis Republic Services, 9,692,739 1976 2004 Republic Services, Inc.
Inc.
Butler County Poplar Bluff Butler Republic Services, 1,950,000 1980 2011 Republic Services, Inc.
Landfill Inc.
Central Missouri Sedalia Pettis WCA Waste 2,518,656 1972 2043 WCA Waste Corporation
SLF Corporation
Eagle Ridge SLF Bowling Green Pike WCA Waste 2,500,000 1972 2023 WCA Waste Corporation
Corporation
IESI Timber Ridge Richwoods Washington Progressive Waste 2082 Progressive Waste
Landfill Solutions Ltd. Solutions Ltd.
Joplin SLF Joplin Jasper City of Joplin, MO 1,324,368 1974 1990 City of Joplin , MO
Lee's Summit SLF Lee's Summit Jackson City of Lee's 2,700,000 1982 2017 City of Lee's Summit,
Summit, MO MO
Lemons East Dexter Stoddard Republic Services, 1,200,000 1994 2051 Republic Services, Inc.
Sanitary Landfill Inc.
Newton-McDonald Neosho Newton Newton- 900,500 1975 1993 Newton-McDonald
County SLF McDonald County County SLF Board, MO
SLF Board
29Year Landfill
Landfill Owner Waste in
Landfill Name Landfill City Landfill County Landfill Closure Landfill Owner
Organization Place (tons)
Opened Year
Show-Me Regional Warrensburg Johnson Republic Services, 1,017,600 1992 2044 Republic Services, Inc.
Landfill Inc.
Southeast SLF Kansas City Jackson Republic Services, 8,071,606 1974 2002 Republic Services, Inc.
Inc.
St. Francois County Park Hills St. Francois St. Francois 894,820 1974 1993 St. Francois
SLF Environmental Environmental
Corporation Corporation
Veolia ES Maple Macon Macon Veolia ES Solid 2,274,141 1976 2079 Veolia ES Solid Waste,
Hill Landfill, Inc. Waste, Inc. Inc.
Woods Chapel SLF Blue Springs Jackson The Links at Stone 2,100,000 1974 1994 The Links at Stone
Canyon, Inc. Canyon, Inc.
4.3 Spotlight on Missouri’s Landfill Gas Facilities
Columbia Landfill Gas Energy Plant, Columbia, Missouri
In 2004, Columbia voters passed a proposal to adopt a renewable portfolio standard. The goals are
a stepped program requiring Columbia to increase its use of renewable energy sources to 15 percent of
electric retail sales by December 31, 2022. In January 2014, Columbia voted to increase its goals to reach
15 percent by 2017 and 25 percent by 2022. The City of Columbia partnered with Sexton Energy, LLC in
2008 to complete a landfill gas-to-energy project. With the addition of the third generator in 2013, the
plant’s generation capacity currently reaches 3.1 MW. In 2013, Columbia’s landfill gas operations
generated 13,326 MWh of consistent power accounting for 1.12 percent of Columbia’s electric power at
$47.38 per megawatt hour.
Of all of the resources in Columbia’s renewable energy portfolio, landfill gas has had one of the
lowest impacts on rates. The average non-renewable cost in 2013 was $54.88 per megawatt hour. The
fourth generator may be added in the future that will allow enough electricity production to account for
approximately 2.5 percent of Columbia’s energy profile for the next ten years. Additionally, Columbia’s
landfill gas generation serves as a renewable base load resource.34
34
“2013 Renewable Energy Report.” Columbia Water & Light. February 2013. Web. February 6, 2013.
.
30St. Joseph Landfill Gas Electricity Plant, St. Joseph, Missouri
In 2010, the Kansas City Power & Light Greater Missouri Operations Company (KCP&L GMO)
partnered with the City of St. Joseph and Burns & McDonnell to develop a landfill gas–to-electricity
project at the St. Joseph Sanitary Landfill. The project was awarded a $450,000 Energize Missouri
Renewable Energy Biogas subgrant from the Missouri Division of Energy using American Recovery and
Reinvestment Act funds. This $6 million dollar project became fully operational in March of 201235 with a
1.6 MW generator and the capacity to power nearly 1,000 homes annually.36
Jefferson City Landfill Gas Utilization Project, Jefferson City, Missouri
The Jefferson City landfill gas project brought together the City of Jefferson, the City of Columbia,
the State of Missouri’s Department of Corrections, Ameresco and Republic Services (the landfill owner) to
meet the needs of all parties. This 3.2 MW facility saves approximately $500,000 annually and has the
carbon reduction equivalent of the removal of nearly 1,000 cars from the road. The power is purchased by
Columbia Water & Light through a 20-year contract, which helps the city meet its renewable portfolio
standard requirements. Additionally, Ameresco developed a system that utilizes the heat waste generated
from the facility for steam and hot water in the Jefferson City Correctional Center and Algoa Correctional
Center.37
IESI Champ Landfill, Champ, Missouri
The IESI Champ Sanitary Landfill has one of the longest histories in Missouri of utilizing landfill
gas for energy generation. This sanitary landfill has collected landfill gas and used it for fuel in its asphalt
plant burner and concrete ready mix plant boiler since 1992. In 1997, the nearby Pattonville High School
partnered with Fred Weber (the previous landfill owner) to utilize the landfill gas to power the school’s
boilers after the recommendation was made by the school’s ecology club. The project was funded by the
Missouri Division of Energy’s Energy Loan Program, a grant from St. Louis County Solid Waste
Commission and Fred Weber. The savings amount to approximately $27,000 annually, due in part to the
fact that Fred Weber provided the gas free of charge to the school. The environmental benefits are equal to
35
“American Recovery and Reinvestment Act, Energize Missouri Renewable Energy Biogas Grants.” Missouri Department of
Natural Resources. N.d. Web. 6 February 2013. .
36
“Landfill gas-to-energy project will create enough renewable energy to power nearly 1,000 homes.” Missouri Governor Jay
Nixon News Releases, Office of Missouri Governor Jay Nixon. 2010. Web. February 6, 2013.
.
37
“Algoa and Jefferson City Correction Centers.” Ameresco. 2011. Web. February 6, 2013.
.
31the carbon sequestered annually by 22,700 acres of pine or fir forest and the annual energy savings equal to
heating 3,100 homes.38
The landfill was producing more gas than was used by the school, and it was being burned off or
flared. To capture and utilize this unused gas, Ameren Missouri partnered with the new landfill owner,
IESI Inc., to develop an additional landfill gas utilization project in 2010, frequently referred to as
Ameren’s Maryland Heights Renewable Energy Center. This landfill gas electricity generation project is
one of the largest in the nation and became operational in the summer of 2012. It consists of three 4.9 MW
turbines with the capacity to power 10,000 homes. The landfill is expected to last into 2070, providing
consistent power to the St. Louis area and allowing Ameren to use the power generated for compliance
with Missouri’s renewable energy standard. 39
State Fair Community College, Sedalia, Missouri
State Fair Community College partnered with the West Corporation, which owns the Missouri
Central Landfill, various local, state and federal government agencies and private businesses to develop the
landfill gas project to generate electricity for the college and to provide training opportunities for students.
The initial phase of the operation is expected to have a 1.6 MW capacity. The second phase seeks to
develop an energy technology incubator to assist emerging businesses with exploring next generation
energy technologies and allow training opportunities for students.40 This project was under development as
of early 2014.
38
“Landfill Methane Outreach Program, Project profile: Fred Weber”, United States Environmental Protection Agency. 15 July
2010. Web. February 6, 2013. .
39
Tomich, Jeffrey. “Five Questions with Ameren Missouri’s Bill Barbieri”. St. Louis Post-Dispatch. April 27, 2012. Web.
February 6, 2013. .
40
“Missouri Center for Waste to Energy”, State Fair Community College. 2010. Web. February 6, 2013.
.
325. Biomass
5.1 Resource Overview
Biomass typically means any organic matter from plants or animals. Domestic biomass resources
include agricultural crops and residues, manure and wastes from animal feeding facilities, forest and wood
processing residues, municipal wastes and terrestrial and aquatic energy crops grown solely for energy
purposes. As a valuable renewable resource, biomass provides a wide range of products such as food,
fiber, heat, power, fuels and chemicals. In addition, biomass, like field crop and forest residues, can
provide necessary organic matter and nutrients for plant growth and reduce soil erosion.
As a major producer of agricultural and forest commodities in the nation, Missouri has an abundant
and diverse biomass resource base, which holds a significant potential for bioenergy, biofuels and
biochemicals. Various uncertainties like availability, sustainable management and technical and economic
constraints, have resulted in limited scale development of Missouri’s biomass resources. However,
increasing environmental and energy independence concerns make biomass production, conversion and use
a more promising option for Missouri. Increased use of biomass resources can reduce dependence on
imported fossil energy sources, create more job opportunities and stimulate the rural economy.
The types of biomass currently produced in the state include agricultural biomass, forest biomass
and municipal wastes. The agricultural biomass comes primarily from field and seed crops and their
residue, animal manure and wastes and food processing operations. Forest biomass is the residue and
waste produced mostly from timber harvesting and processing and from forest thinning and other forest
management practices. In addition, municipal solid waste (MSW) generates a large quantity of biomass.
According to the Missouri Department of Natural Resources’ Solid Waste Management Program, the
average MSW generation rate per capita in Missouri is approximately seven pounds per day, which is much
higher than the national average of 4.6 pounds.41 Dedicated energy crops and algae are also attracting more
interest in the state.
41
“The 2006-2007 Missouri Municipal Solid Waste Composition Study,” Missouri Department of Natural Resources, Solid
Waste Management Program. October 2007. Web. February 6, 2013.
.
335.2 Biomass Resources Availability and Opportunities
A 2005 study from the National Renewable Energy Laboratory (NREL)42 examined the availability
of technical biomass resources in the United States. The biomass categories in this study include
agricultural residues (crop residues and animal manure), wood residues (forest residues, primary mill
residues, secondary mill residues and urban wood residues), methane from landfills and domestic
wastewater treatment and dedicated energy crops in the Conservation Reserve Program (CRP) lands.
According to this study, the total technically available biomass in Missouri is estimated at
18,439,000 tons annually. Table 5-1 shows the estimated results for each category, and the total biomass
distribution by county in Missouri is illustrated in Figure 5-1.
Table 5-1. Total Biomass Resource Available in Missouri in 2005 NREL Study
Category Yearly Technical Availability
(thousand tons)
Agricultural Residues
- Crop residues 6,007
- Methane from manure management
120
Wood Residues
- Forest residues 1,840
- Primary mill residues
- Secondary mill residues 1,036
- Urban wood residues
69
613
Municipal Discards
- Methane from landfills 273
- Methane from domestic wastewater treatment
9
Switchgrass from CRP Lands 8,473
Total 18,439
42
Milbrandt, A. A Geographic Perspective on the Current Biomass Resource Availability in the United States. National
Renewable Energy Laboratory. December 2005. Web. February 6, 2013. .
345.2.1 Field and Seed Crops
As a major agricultural state, Missouri has approximately 30 million acres of farm lands with an
average farm size of 270 acres. Crops included in calculating the agricultural residues are corn, wheat,
soybeans, cotton, sorghum, barley, oats, rice, rye, canola, beans, peas, peanuts, potatoes, safflower,
sunflower, sugarcane and flaxseed. By assuming that 30 percent residue cover is reasonable for soil
protection and 35 percent of the total residue could be collated as biomass, the total technically available
crop residues in Missouri is estimated at 6,007,000 tons annually. Most crop residues in Missouri are
located in the northern area. A number of counties in that region are able to provide as much as 200,000
dry tons/year of crop residues for bioenergy projects.
Figure 5-1. Technical Biomass Resource in Missouri by County
355.2.2 Animal Waste
Animal waste is organic matter from animal production and processing. In addition to
manure, animal waste also includes dead animals, bedding, unused feed and other waste from
slaughter and meat processing. The agricultural livestock population in Missouri includes 4.3
million cows, 3.1 million swine, 287.2 million chickens and 77,100 sheep and lambs. According
to the 2007 Missouri Census of Agriculture provided by the U.S. Department of Agriculture’s
National Agricultural Statistics Service (NASS)43, the total cattle population in the state includes
2.09 million beef cows, 110,358 milk cows and 2.09 million other cows (heifers that have not
calved, steers, calves and bulls). A number of factors can affect the animal sizes and manure
production rates, such as weather conditions, types of confinement, feed and reproduction.
Based on the typical characteristic data of manure production published by the American Society
of Agricultural Engineers (ASAE)44, the estimated annual amount of animal manure on a wet
basis for cattle, swine, sheep and lambs, and poultry layers and broilers in Missouri’s counties is
illustrated from Figure 5-2 to Figure 5-5. Figure 5-6 shows the total manure availability by
county in the state.
Figure 5-2. Wet Cattle Manure Availability by County
43
“2007 Census of Agriculture.” United States Department of Agriculture, National Agricultural Statistics Service.
2007. Web. February 6, 2013. .
44
“Manure Production and Characteristics (ASAE D384.2 MAR 2005)”, the American Society of Agricultural
Engineers.
36Figure 5-3. Swine Manure Availability by County
Figure 5-4. Sheep and Lamb Manure Availability by County
37Figure 5-5. Poultry Layer and Broiler Manure Availability by County
Figure 5-6. Total Animal Manure Availability by County
385.2.3 Woody Biomass
Forest residues include logging residues and other removals after carrying out silviculture
operations and site conversion. Logging residues are the unused portions of trees cut or killed by
logging and left in the woods. Other removals are considered trees cut or otherwise killed by
cultural operations (e.g. pre-commercial thinning, weeding, etc.) or land clearings and forest uses
that are not directly associated with round wood product harvests. Most southeast and southeast
central counties in Missouri have at least 25,000 dry tons/year forest residues and more than ten
counties are even in the range of 50-100,000 dry tons/year. Furthermore, the U.S. Billion-Ton
report update in 201145 estimated the economic availability of logging residues. About one
million dry tons of logging residues are available annually at $80 per dry ton in the next 20 years
in Missouri. A simulation model also indicated that annual biomass from forest thinning are
300,000, 560,000 and 810,000 dry tons for the price of $20, $40 and $100, respectively.
Primary mill residues are composed of wood materials (coarse and fine) and bark
generated at manufacturing plants (primary wood-using mills) when round wood products are
processed into primary wood products like slabs, edgings, trimmings, sawdust, veneer clippings
and cores and pulp screenings. It includes mill residues recycled as by-products as well as those
left unutilized and disposed of as waste. Secondary mill residues include wood scraps and
sawdust from woodworking shops— furniture factories, wood container and pallet mills and
wholesale lumberyards. Those resources are located in southeast Missouri. Combining all forest
residues and primary and secondary mill residues, the forest and its product industry are able to
provide as much as 2,945,000 dry tons of biomass every year.
Urban wood waste includes wood residues from municipal solid waste (wood chips,
pallets and yard waste), utility tree trimming and/or private tree companies and
construction/demolition wood. The availability of urban wood waste largely depends on
population density, economic condition and industrial structure. The recently updated national
urban wood waste availability shows Kansas City and St. Louis areas are still the primary
sources for urban wood wastes. Both areas can provide more than 50,000 dry tons/year of urban
wood wastes. The Springfield area can also provide considerable amounts of this biomass
resource. The amount of urban wood waste is increasing in the Columbia area due to city
expansion.
45
“U.S. Billion-Ton Update”, United States Department of Energy. August 2011. Web. February 6, 2013.
.
39The Missouri Department of Conservation issued the State’s Forest Resource Assessment
and Strategy in 2010,46 which identified the goal of steering emerging woody biomass markets in
a sustainable direction. This report identified a number of forest opportunity areas (FOA) which
could offer Missouri’s best geographic opportunities for sustaining forest resources and the
associated beneficial usage like bioenergy. FOAs include rural, wildland-urban interface (WUI)
and urban settings. Figure 5-7 shows the existing forest resources identified in this report.
Approximately 50 percent of Missouri’s existing forestland is recognized as FOA (Figure 5-8).
Table 5-2 shows the identified urban FOAs with the population and Figure 5-9 illustrates those
areas.
Figure 5-7. Missouri Existing Forest Resource Map
46
“Missouri’s Forest Resource Assessment and Strategy.” Missouri Department of Conservation, et. Al. 2010. Web.
February 6, 2013. .
40Figure 5-8. Rural/WUI Forest Opportunity Areas
Table 5-2. Urban Forest Opportunity Areas in Missouri
U.S. Census Bureau Population estimate includes these
Urban FOA
Population Estimate counties
St Louis County and City, St. Charles,
St. Louis 2,014,235 Jefferson, Franklin
Kansas City 1,091,894 Jackson, Clay, Cass, Platte, Ray
Springfield 342,423 Greene, Christian
Columbia/Jefferson City 272,142 Boone, Cole, Callaway
Joplin 172,933 Jasper, Newton
St. Joseph 106,331 Andrew, Buchanan
Lake of the Ozarks 86,474 Camden, Morgan, Miller
Branson 78,574 Stone, Taney
Cape Girardeau 73,243 Cape Girardeau
41Figure 5-9. Urban Forest Opportunity Areas
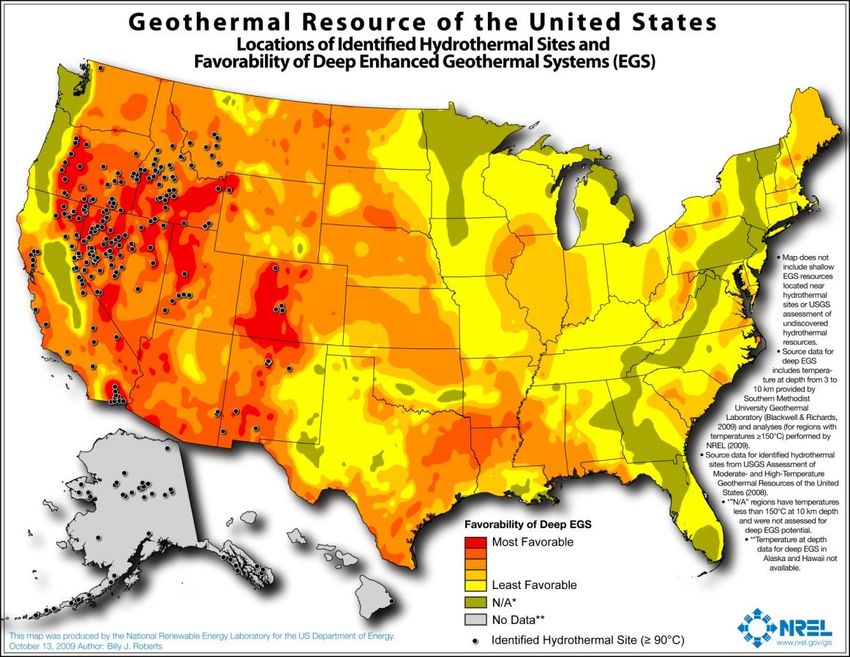
Figure 5-10. National Switchgrass Potential on CRP Land
425.2.4 Energy Crops
As a promising herbaceous energy crop, switchgrass has been increasingly attractive as a
feedstock for biomass pellets and biofuels production over the past decade. Missouri,
particularly in the northern region, has a great potential for growing switchgrass on Conservation
Reserve Program (CRP) lands. It was estimated that the state can supply nearly nine million dry
tons of switchgrass annually, which accounts for more than 10 percent of national switchgrass
potential. Woody energy crops like willow or hybrid poplar can potentially be grown on CRP
land, too. A rough estimate indicates that the potential production of seven million dry tons of
willow or hybrid poplar yearly can be achieved from CRP lands in Missouri. It accounts for over
15 percent of national potential.
5.2.5 Municipal Waste
Municipal wastes include mostly municipal solid waste (MSW) along with municipal
wastewater sludge from treatment facilities. Municipal solid waste includes primarily household
wastes in addition to some commercial wastes collected by a municipality within a given area.
Municipal solid waste normally excludes industrial hazardous wastes even though household
hazardous waste, such as batteries and light bulbs, is considered as municipal solid waste in
some definitions, considering the very limited amount. Municipal solid waste can be categorized
as biodegradable waste (food, kitchen waste and paper), recyclable material (paper, glass, metals,
cans and some plastics), inert waste (construction and demolition waste, concrete and dirt) and
composite wastes (clothing and waste plastics).
The quantity and composition of municipal solid waste varies significantly with
population, size and economic activities conducted in a specific area. For instance, rapidly
growing areas will typically have larger scale construction activities, which would result in
greater amounts of construction wastes, like wood and dirt. In contrast, if tourism is a major
local industry, municipal solid waste in that area may contain more vegetable and food wastes.
Thus, project developers should consider those factors when evaluating the local biomass
availability derived from MSW.
According to the Missouri Department of Natural Resources’ Solid Waste Management
Program, it is estimated that the total amount of waste disposed in Missouri landfills during 2006
43was 4,500,160 tons, which is equivalent to 1,698 pounds per capita annually. Since around 60
percent of the waste stream generated in the state is MSW, the quantity of MSW in the Missouri
waste stream for disposal in 2006 was estimated to be 2.7 million tons. The annual waste
generation per capita is around 2.14 tons, which corresponds to 7.0 pounds MSW per capita per
day, much higher than the national average of 4.6 pounds per capita per day. Table 5-3 gives the
detailed composition of MSW by averaging the samples taken from several landfills and transfer
stations in the state. The available biomass from the MSW composition categories in Table 5-3
includes paper and organics, such as food and wood waste.
Another biomass source from municipal waste, biosolids or sewage sludge, is the by-
product of the treatment of domestic wastewater in a wastewater treatment plant (WWTP).
Those waste residuals can be further treated to reduce pathogens and vector attraction by a
number of approved methods. Biosolids in their liquid form look like muddy water and contain
between 1-10 percent solids. Biosolids may be dewatered in a second step of the treatment
process, which turns it into a "cake" with the texture of a wet sponge. In this stage, the content
could increase to 11-40 percent biosolids. Biogas produced from anaerobic digesters at WWTPs
can be used as a fuel source to generate reliable electricity and heat necessary for the WWTPs,
which can displace purchased fossil fuels and reduce emissions of greenhouse gases and other air
pollutants. Table 5-4 lists the WWTPs in Missouri which currently either flare biogas or employ
biogas for energy uses.
Table 5-3. Typical Municipal Solid Waste Composition in Missouri47
% by weight % by volume
Cardboard 8.20% 13.50%
Newsprint 5.17% 3.48%
Magazines 3.66% 1.78%
High grade paper 6.40% 6.51%
Mixed paper 10.20% 12.09%
Total paper 33.63% 37.45%
47
“The 2006-2007 Missouri Municipal Solid Waste Composition Study,” Missouri Department of Natural
Resources, Solid Waste Management Program. October 2007. Web. February 6, 2013.
.
44You can also read