Green Growth Strategy for Karnataka - Case Studies
←
→
Page content transcription
If your browser does not render page correctly, please read the page content below

Green Growth
Strategy for Karnataka
Case Studies
Copyright © Global Green Growth Institute, 2014

Disclaimer
The presentation of the material in this publication does not imply
the expression of any opinion whatsoever on the part of the Global
Green Growth Institute concerning the legal status of any country,
territory, city or area or of its authorities, or concerning delimitation
of its frontiers or boundaries. Moreover, the views expressed in the
publication do not necessarily represent the decision or the stated
policy of the Global Green Growth Institute.

While every effort has been made to ensure the correctness of data/
information used in this report, neither the authors nor GGGI accept
any legal liability for the accuracy or inferences drawn from the
material contained therein or for any consequences arising from the
use of this material.

The full report should be referenced as follows: Global Green
Growth Institute (2014) Green Growth Strategy for Karnataka- Case
Studies, GGGI, Seoul, Republic of Korea

Text from this report can be quoted provided the source is
acknowledged and GGGI or BCCI-K informed.

Design: Infonauts, www.infonauts.in

Green Growth
             Strategy for Karnataka
             Case Studies

Consortium Partners

December, 2014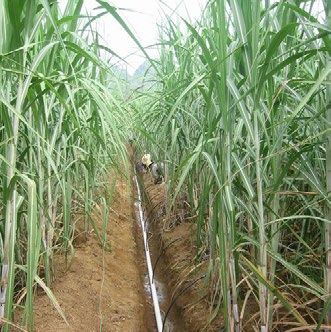
Acknowledgement

    This report forms deliverables of the project initiated by the Global Green Growth Institute (GGGI) and
    the Bangalore Climate Change Initiative - Karnataka (BCCI-K) with its consortium partners: Center
    for Study of Science, Technology and Policy (CSTEP, Bengaluru), Indian Institute of Science (IISc,
    Bengaluru), University of Agricultural Sciences (UAS, Bengaluru), Institute for Social and Economic
    Change (ISEC, Bengaluru), Integrated Natural Resource Management (INRM, New Delhi) and the
    London School of Economics—India Observatory (LSE-IO, London).

    The main authors of the case studies are Ankit Singhvi and Ajith Radhakrishnan with inputs from
    Jason Eis, Siddarthan Balasubramania and Prasoon Agarwal. This report also benefited greatly from
    inputs and suggestions by various officials from Government of Karnataka, academia, and professionals
    from relevant industries. Special thanks to Swati Sharma and Sahil Gulati for their editorial support
    and assisting authors in preparing report for publication. Above all, the project would not have been
    successful without the leadership provided by Professor B.K. Chandrashekar, Chairman, BCCI-K.

2
Foreword

Karnataka continues to witness strong economic growth with contributions increasing from industry
and the services sector. Its emergence as the IT hub of India underscores its increasing relevance in
shaping India’s growth story. The confluence of aspiring middle class, rising consumption, increasing
understanding of the impacts of climate change and a globalized economy require Karnataka to adopt
a climate resilient growth strategy to meet its development objectives.

Against this background, the BCCI-K and GGGI led-initiative on developing a Green Growth Strategy
for Karnataka is timely as it addresses the challenge of reconciling faster economic growth with
environmental sustainability. The strategy is developed with an approach grounded in scientific
modelling and intensive consultation with policy makers.

This report is an attempt to demonstrate the feasibility of implementing a green growth strategy in
Karnataka. There are five case studies covered in this report; electric vehicles, waste heat recovery,
wind energy, solar energy and micro-irrigation. All these opportunities have the potential to make
significant positive impacts in meeting the development objectives of the state, including sustained
economic growth, poverty reduction and job creation. The report identifies implementation barriers,
policy implications, investment requirements and possible funding sources for these specific
opportunities, and concluding with concrete recommendations for policy makers. It is intended to
be used as a tool to frame the issues around green growth, weighing the potential opportunities for
implementation of a green growth strategy in Karnataka.

Having worked in close consultation with various stakeholders as possible, we are confident that this
report will be highly useful to practitioners, policy makers and other experts. Our wish is for Karnataka
to be an inspiring example of how a climate-resilient, inclusive, green growth trajectory is possible,
turning ambitious vision into reality.

Prof. B. K. Chandrashekar
Chairman
Bangalore Climate Change Initiative – Karnataka (BCCI-K)

                                                                                                            3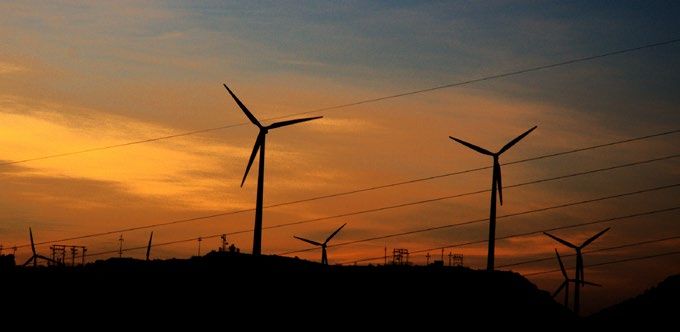
4
Contents

1   Enabling Adoption of Electric Vehicles                 7

2   Harnessing Waste Heat Recovery for Power Generation   15

3   Scaling up Grid Connected Solar                       21

4   Renewing Wind Energy                                  27

5   Boosting Micro Irrigation Opportunities               35

                                                               5
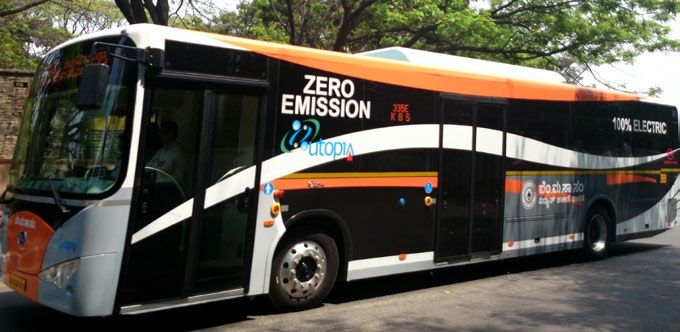
Four fold increase in demand for urban
transport in 20 years.

Increase in oil imports, Green House Gases,
Particulate Matter, noise pollution and
congestion.

Loss of 1.7% of state GDP due to air pollution
translating to economic loss of INR 5,100 crores
per year.

Electric Vehicles found to be most effective in
combating air pollution with zero tailpipe
emissions.

Electric Buses for use in public transport,
closest in overcoming key barriers for
adoption of Electric vehicles.
1
                                                                                          Enabling Adoption of Electric Vehicles

                  Enabling Adoption
                  of Electric Vehicles

    Executive Summary                                               and lower noise pollution in buses. In Indian context,
                                                                    electric vehicles also help in fuel security with reduced oil
                                                                    and gas imports. National Electric Mobility Mission Plan
India is on track to become the third largest road                  (NEMMP 2020) is the most comprehensive plan undertaken
transportation market by 2020, driven by strong economic            by Government of India to accelerate adoption of electric
growth and rapid urbanization. In the next 20 years, a steady       vehicles in the Indian market.
economic growth, higher working population, and longer
trips due to urban sprawl will lead to a four-fold increase in      There are four key barriers to adoption of electric vehicles.
the demand for urban transport, nearly tripling the demand          These barriers are related to policy, technology, enabling
for passenger transport as a whole.                                 infrastructure and cost economics. As per our analysis,
                                                                    electric buses for use in public transport are closest in
The growth in transportation sector has resulted in higher          overcoming these barriers.
oil imports, higher emissions of Green House Gases (GHG)
and Particulate Matter (PM10 and PM2.5), increased noise            Karnataka is best positioned to take lead in introducing
pollution and congestion in urban areas. Most of the cities         electric buses in their public transport system. With one of
in India surveyed by World Health Organization (WHO)                the largest intra-city public transport network, with a fleet
have been rated in top polluted cities in the world, especially     of over 6000 buses, it can emerge as a significant market
on count of PM pollution. PM concentrations in Bengaluru            for the Original Equipment Manufacturer (OEM) in the
are already in violation of National Ambient Air Quality            near future. Bengaluru Municipal Transport Corporation
Standards.                                                          (BMTC) has successfully piloted an electric bus for over 3
                                                                    months with positive results. Going forward, adoption by
Air pollution is a significant problem in India resulting in loss   state road transport corporations with a fleet of over 25,000
of about 1.7% of GDP, as per estimates by The World Bank in         buses can reduce PM emissions by 25%.
2014. While it may not be accurate to directly deduce from
national loss percentage, 1.7% of state GDP would translate         The Total Cost of Ownership (TCO) approach, as proposed
to a loss of economic activity of about INR 5,100 crores per        in NEMMP 2020 was used to arrive at subsidy requirement
year for Karnataka.                                                 for adoption of electric buses. For electric buses, current
                                                                    viability gap is estimated at about INR 60-70 lacs per bus.
Noise pollution in urban areas has also emerged as a                This is for buses which are equivalent in service and quality
significant health issue. Prolonged exposure to elevated            to Volvo air conditioned buses being currently used by
noise levels has been linked to sleeping disorders, noise           BMTC. This subsidy gap can be bridged by a combination
induced hearing losses and increased risks of heart stroke.         of direct incentives, waiver of import duty and taxes and
Estimates by UK government suggest that economic cost of            low cost interest loans. A combination of low cost loan
noise pollution is even higher than that of air pollution.          from Clean Technology Fund and quantification of societal
There have been multiple initiatives to reduce emissions            benefits can also bridge the subsidy gap.
in transportation sector ranging from fuel efficiency,
introduction of alternative fuels like CNG, promotion of            Karnataka could thus focus on electrification of its state
non-motorized transport (NMT) and electric vehicles.                fleet of buses and government vehicles in the short term to
                                                                    drive adoption. Further, BMTC can expand on its initiative
Electric vehicles are found to be the most effective in             to bring electric buses and initiate development of enabling
combating local air pollution with zero tailpipe emissions          infrastructure.

                                                                                                                                    7
1
Introduction This study segments the mobility requirements in Karnataka
and recommends focusing on electrification of public
transport and government vehicles in a definite time frame.
This case study is intended for policy makers to assess the This will help foster an ecosystem which will accelerate mass
merits in aggressively transitioning to electric mobility. The adoption of electric vehicles by private consumers as well.
passenger transport demand in Karnataka on road in 2010 India is uniquely positioned with lower per capita vehicles,
is estimated to have been about 180 Billion Passenger Kilo shorter commuting distances and a fair share of lighter
Meters (BPKM), with urban transport accounting for about vehicles, to adopt electric vehicles with current technology.
100 BPKM. Public transport accounts for about 50% of the total
urban transport demand. Bengaluru, which accommodates
over 40% of the vehicles in the state, is expected to account Air and Noise Pollution: Challenge
for a significant share of urban transport demand in the state. and Solutions
Bengaluru has the second highest registered motor vehicles
in the country after Delhi (Exhibit 1).
India is plagued by the problem of poor air quality with
Transportation has emerged as the single largest source of PM serious consequences on health of its citizens. Cities are the
pollution with diesel vehicles having the highest emission most affected and this problem is getting accentuated by
intensity. It accounts for 42% of the total PM pollution in rapid urbanization taking place in India.
city of Bengaluru which is one of the highest in the country.
Diesel vehicles, especially buses, have the highest emission Exhibit 2 shows the increasing trend of PM emissions in
factors and contribute almost 30% to the total PM pollution. Bengaluru. It also shows dominant role of transportation
in PM2.5 emissions in Bengaluru. PM2.5 is found to be more
A transformative approach combined with substantive dangerous for pulmonary disorders. The other source of
volumes, can make India a market maker for electric mobility. PM2.5 pollution is road dust, construction dust, industries
This approach looks at the transport problem from both and diesel generator sets used for power backup. Trucks and
accessibility and sustainability perspectives. Energy security, Buses contribute over 50% to the PM10 emissions in transport.
air pollution and noise pollution are current and serious
problems which India needs to solve for sustained growth. Elevated noise emissions result in sleeping disorders and
Bengaluru has all the key elements like California to lead increased risk of heart attack. Diesel powered buses result in
innovation in the country. It is also worst impacted by PM noise levels from 65 dB to 90 dB depending on the state of
pollution with transportation being the largest contributor. motion. Compared to diesel buses, electric buses have 7-10
Exhibit 1 Registered Vehicles in 2012 [CPCB (2010)]
Delhi
8000
7000
Bengaluru
6000
Hyderabad
Chennai
5000
Gr. Mumbai
Ahmedabad
Vishakhapatnam
4000
Coimbatore
Chandigarh
Pune
Ludhiana
Jamshedpur
Jaipur
Tiruchirapalli
Lucknow
3000
Aurangabad
Durg Bhillai
Vadodara
Vijayawada
Allahabad
Nagpur
Ghaziabad
Indore
Jodhpur
Kanpur
Jabalpur
Amritsar
Dhanbad
Madurai
Varanasi
Bhopal
Surat
Gwalior
Kolkata
Ranchi
Rajkot
Meerut
Srinagar
Kota
2000
Nashik
Patna
Raipur
Agra
Kochi
1000
0
7350
4156
3767
3387
2267
2029
1871
1682
1386
1338
1337
1315
1237
1145
1067
1058
953
868
839
829
803
760
743
738
729
704
683
682
680
605
588
579
553
525
521
496
490
480
462
445
444
420
281
201
Source: CPCB (2010)
8Enabling Adoption of Electric Vehicles
dB lower noise levels at 55-60 dB. This has significant health This is based on study conducted by The World Bank which
benefits in terms of reduced stress. As per Government of has estimated that there is a loss of about 1.7% of India’s
UK study, a reduction from 70 to 60 dB translates to a value GDP due to air pollution. There are multiple solutions with
of about 15 GBP per household per year. (Exhibit 3) varying degree of efficacy in combating air pollution. These
solutions can be categorized under three categories:
Large buses and Omni buses have the highest emission • Fuel efficiency standards: Fuel efficiency standards have
factor of 0.56 (g/km) among all road vehicles. This is played a key role in incrementally reducing emissions
followed by trucks. This is consistent with their overall across all vehicle categories. They are primarily driven by
contribution in PM pollution in Bengaluru city where regulations and standards.
buses have been found to be the highest contributor to PM • Hybrid vehicles and alternative fuels: CNG vehicles
emissions. The dominant fuel source for these categories of have played a key role in reducing PM emissions in metro
vehicles is diesel. cities, primarily Delhi. However, given the shortage of
domestic natural gas production, there are issues around
Large buses and Omni buses account for about 25% of fuel security and price of imported gas which need to be
the PM emissions in the country. We have taken 25% as resolved for sustained growth in CNG vehicles.
potential to reduce PM emissions in Karnataka for our • Electric vehicles: Electric vehicles present a transforma-
analysis by completely transitioning bus fleet to electric tive approach which can leapfrog India to the position of
buses. Karnataka with a state GDP of over INR 300,000 a global leader. They have the highest impact in reducing
crores would imply a loss of about INR 5,100 crores in GDP. air emissions at tailpipe and also reduce demand of oil
Exhibit 2 PM Emissions from Transport and Other Factors
Respirable suspended Particulate Matter levels %PM2.5 emissions Bangalore
300 Bangalore Paved road
Chennai Secondary and dust
250 4.4
13.6
Annual average concentration
Delhi Domestic
6.3
200 Mumbai
Kolkata
150
28.1
Transport 47.6
100
50 DG sets
0 Year
2001 2002 2003 2004 2005 2006 2007 2008 2009 2010
%PM10 emissions Bangalore
Exhibit 3 Value of Changes in Noise Exposure Others
2 Wheelers 2
Trucks
13
Value per household per year, GBP
30 24
25
21
20
15 27
13
3 Wheelers Bus
10
5 Cars
0
56 57 58 59 60 61 62 63 64 65 66 67 68 69 70
Noise decible dB
Source: Government of UK (2013) Source: Hosamane et. al. (2013) and CPCB (2010)
91
imports. They also reduce noise emissions by 7-10 dB towards fuel security. NEMMP focuses on:
during operation. • Demand creation through incentives and mandates.
• Domestic manufacturing by linking incentives to localization.
• R&D through pilot projects and test centers for
Current Policy Landscape For performance evaluation.
Electric Mobility • Provision of enabling infrastructure, primarily related to
charging stations and maintenance centers.
Table 1 shows the relative ranking in ease of implementation
Government of India in 2012 came forward with an ambitious of electric vehicles for different categories. Two wheelers,
NEMMP 2020 with the objective of making India a leader in three wheelers and buses have been identified higher on
electric vehicles, two wheelers and four wheeler market in ease of implementation scale. If we combine it with emission
the world by 2020 with sales of 6-7 million units. The plan impact, buses are best positioned for transition.
envisaged a push towards electric vehicles contributing
Table 1 NEMMP 2020 Assessment of Relative Ease of Implementation
Analysis Four Wheelers Two Wheelers Buses Three Wheelers LCVs
• Capabilities Low to Moderate Moderate to High Moderate Moderate Low
implementation
• Price Performance Gap Moderate to High Low to Moderate High High High
Ease of
• Investment Significant High investment Moderate Moderate Moderate
investments needed as volumes
required by OEMs are high
• Overall Low to Moderate Moderate to High Moderate Moderate Low
Exhibit 4 Insights from Electric Bus Trial Conducted by BMTC
Average distance travelled per day (km) Average battery charge (KWh) Average revenue collection (INR)
276 12,516
162 168 252
10,864
March April March April March April
Stable Operations Low Operating Costs Customer Acceptance
Average maintenance cost (INR 000/month) Average fuel cost (INR 000/month) Estimate of sound level (dBA) Electric bus
AC Volvo
14 150
70
55
5 53
10Enabling Adoption of Electric Vehicles
As a progressive state, Karnataka has already proposed adoption of EVs. The current policies are not adequately
exemption of road tax and Value Added Tax (VAT) funded and have limited time horizon.
exemption for electric vehicles. It is also home to Mahindra • Technology maturity and product effectiveness: EV
Reva, the first electric car company in India. BMTC has technology is rapidly evolving in terms of performance
recently concluded trials of an electric bus in the city. and features. Battery technology in terms of energy
The experience has been promising with definite savings density, charge capacity and operating life are most
on operational and maintenance cost. Exhibit 4 shows critical for EV. In India, there is limited choice for four
some insights from the electric bus trial data. Energy wheelers with only 1-2 products in the market. Similarly,
costs were reduced by 60% and maintenance cost by over two wheeler riders are handicapped by questions around
70%. Customers appreciated quieter rides with less noise product effectiveness.
and vibrations. BMTC has submitted a proposal to the • Total Cost of ownership and financing: Electric vehicles
Department of Heavy Industries under NEMMP to run a entail a higher initial capital investment despite lower
larger pilot with over 30 electric buses. operating costs. Electric vehicles have higher average total
cost of ownership compared to conventional fuel vehicles.
This industry, like any other new industry, would need
Barriers and Opportunities some government support to gain momentum. Low cost
financing and leasing models, reduction of import duties
and tax breaks in manufacturing need to be explored for
Electric vehicles have evolved over decades and are sustained growth.
increasingly being seen as mainstream alternative in • Enabling infrastructure and stakeholder awareness: A
transportation. Pike Research forecasts that the global mass adoption of electric vehicles would require building
market for all electric-drive buses—including hybrid, battery of charging and maintenance infrastructure. In addition,
electric, and fuel cell buses—grow steadily over the next lack of awareness among key stakeholders (policymakers,
6 years, with a Compound Annual Growth Rate (CAGR) vendors, customers) is a big impediment in EV adoption.
of 26.4% from 2012 to 2018. China has the maximum BMTC’s pilot of electric bus for 3 months starting April
deployment of electric buses and has fostered development 2014 has been very successful.
of over 9 electric bus manufacturers. Latin America has also
witnessed strong growth in adoption of electric buses. There Exhibit 5 illustrates the position of different vehicle
are four key barriers that electric vehicles need to overcome, categories in overcoming barriers as explained above. Buses
to go mainstream in India: for public transport are best positioned to lead the transition
• Policy and regulatory framework: A legislative mandate to electric vehicles. Government can mandate the adoption
for Electric Vehicles (EVs) in certain categories and of electric buses and explore deploying electric vehicles for
geographies is important to kick-start meaningful part of its fleet of cars.
Exhibit 5 Position of Different Vehicle Classes in Overcoming Barriers to Mass Adoption
Enabling infrastructure
and customer adoption
Success of Electric Vehicles
Economic value
and financing
Technology maturity
and product effectiveness
Policy and
regulatory framework
TRUCKS & CARS & 4 TWO GOVERNMENT OWNED Hurdles in Electrification of Transport
LORRIES WHEELERS WHEELERS BUSES & CITY TRANSPORT
Technology still Lack of product Technology available. Technology and
evolving for choice. Economic Challenges in product availble.
long distance. value proposition financing and Cluster demand.
not clear. sustaining demand.
111
Exhibit 6 shows the vehicle stock and performance of own state fleet which is best positioned to overcome barriers
Karnataka transport corporations. State buses accounted in implementation. This will meet the twin objective of
for about 30% of the total diesel consumption in the state developing a favourable ecosystem for EV and reducing PM
(16 million liters per year). Government can focus on its pollution.
Exhibit 6 Vehicle Stock and Performance of State Transport Corporations (2012-13)
Vehicle stock of buses Average vehicle mileage Annual diesel consumption
(units) (Km/litre) (million liters per year)
BMTC 6,000 BMTC 4.01 BMTC 1.1
KSRTC
1.60
KSRTC 8,243 KSRTC 4.87
NEKRTC 1.52
NEKRTC 4,203 NEKRTC 5.25
NWKRTC 0.99
˜30% of Karnataka
NWKRTC 4,403 NWKRTC 5.07 TOTAL 5.22 diesel consumption
Source: KRTC (2011), NWKRTC (2012), NEKRTC (2013), CSTEP (2014), GGGI analysis
Total Cost of Ownership (TCO) This study presents an analysis for electric buses used in
and Financing public transport. Exhibit 7 illustrates the TCO analysis
carried out for electric buses and Internal Combustion
Engine (ICE) buses. This analysis shows a gap of about
The Total Cost of Ownership approach has been followed INR 65-70 lacs per electric bus. This gap is for the fully
for this study, as indicated in the NEMMP 2020. This report loaded model of an electric bus which is equivalent to the
expands the definition and also adds the economic cost of current Volvo AC bus service by BMTC. This will reduce
PM pollution, for evaluation. The five key cost components considerably for bus variants without air-conditioning.
considered in the TCO analysis are: This viability gap is higher than the INR 37 lacs supported
• Investment cost (Depreciation) • Maintenance cost by NEMMP 2020.
• Financing cost • Salvage value
• Fuel cost
Exhibit 7 TCO Analysis of Electric Buses and ICE Buses (INR lacs)
100 18 273 119
148
11 54
34
4 12 67
39
Fuel Cost Maintenance Depreciation Finance Salvage TCO EV Fuel Cost Maintenance Depreciation Finance Salvage Economic
viability gap
ELECTRIC BUS DIESEL VOLVO
*Average 170 km/day, fuel cost INR 65/liter, electricity cost INR 6.95/KWh, maintenance cost actual from trial, efficiency 1.5 Kwh/km, 2.2 km/lt for Volvo
**Battery life of 9 years with 3000 charge cycles. Payback in 9 years, discount rate of 11%, residual value of 15% of capital cost for EV. 30 % of the battery cost
*** Maintenance cost of Electric bus increasing by 5%, diesel bus by7% on account of escalation in spares
**** Electric bus costs taken with reduced driving distance of 170 Km at INR 260 lacs, cost of Volvo taken at 88 lakhs
Source: GGGI analysis. NEMMP 2020, EBUSCO, KRTC (2011), The World Bank (2013), Ramachandra et. al. (2009)
12Enabling Adoption of Electric Vehicles
Exhibit 8 Social Benefits of Electric Bus
Preliminary and indicative estimate of secondary benefits of an Electric Bus (INR lacs)
3.8 22.7
4.4
8.0
6.5
Air Pollution* Noise Pollution** Off peak night storage*** Energy security**** Total secondary benfits
Diesel vehicles have higher Noise pollution results in Electric buses are charged India imports 80% of its
PM emission intensity sleeping disorders, high after 10 pm in off peak time oil demand resulting in
stress levels, low productivity increased USD demand
Higher PM10 and PM2.5 emissions They provide valuable
result in increased incidence of High noise levels increase storage for the grid operator India’s growing reliance
pulmonary disorders likelihood of heart attacks on import can have
security implications
*Outdoor air pollution. 1.7% GDP. 29% contribution by transport diesel bus account for about 30% of diesel consumption
**Value of noise level reduction of 7-10 dB, 10-15 GBP per household, 5 hour exposure, 2 hour in bus, 420 people per bus
***5 months during high wind season. 80% of 250 KWh of battery available for storage, avoided coal generation at INR 3/KWh
****USD to INR forward at 5% per year. Interest saving on 80% of oil consumption
Source: GGGI analysis, NEMMP 2020, EBUSCO, KRTC (2011), The World Bank (2013), Ramachandra et. al. (2009)
Electric buses in public transport have considerable social Recommendations
benefits. Electric buses have zero tailpipe PM emissions,
maintain low noise levels, can provide valuable off-peak
storage for wind energy and help reduce oil imports for Following are the recommendations made, based on the
the country. Exhibit 8 is a preliminary estimate of social case study:
benefits on account of an electric bus, translating to about • BMTC could build on the success of the trial of electric
INR 23 lacs. It is important that local dataset is developed bus. It has already sent a proposal for a 30 bus pilot to
for detailed analysis of the social benefits. Department of Heavy Industries. We believe that a bigger
pilot could be planned with state government support
Low cost financing can significantly impact the cost and low cost financing from CTF. This will attract
economics of an electric bus. The current TCO analysis competition and initiate the process of indigenization in
assumes 11% cost of debt for a 9 year tenure. A 1% reduction manufacturing.
in cost of debt results in reduction of INR 7-8 lacs in TCO. • State government could propose a long term implementation
One of the Climate Investment Funds (CIF) and the Clean plan (5-10 years) and provide additional funding support to
Technology Fund (CTF) provide middle income countries BMTC for early adoption of electric bus.
with highly concessional resources to explore options to • State government should induct electric vehicles as
scale up the demonstration, deployment, and transfer of low government vehicles to increase awareness, expand
carbon technologies in renewable energy, energy efficiency, product range and demonstrate commitment. Transport
and sustainable transport. The fund is already active in India department has already started an initiative where 100
and has given USD 100 million of development assistance electric cars are being procured for official duties for a
to the Government of Himachal Pradesh. This fund can be trial period.
targeted to run large scale pilots for electric vehicles by the • The air emissions should be actively monitored in urban
state government. The fund provides debt at ~7% (LIBOR+ areas starting with Bengaluru city, specifically for PM10
450 bps) with tenor of 40 years. This will reduce the TCO of and PM2.5. Noise levels could also be measured on bus
one electric bus by about INR 40 lacs. Combined with social routes to build emission and noise data map. This can
benefits and economies of scale, Karnataka can expand help prioritize routes for introduction of electric buses.
rapidly to induct more electric buses. This will also raise awareness and attractiveness of
electric vehicles in the society.
13Industries have over 50% share of the total
energy consumption and GHG emissions.
Cement and Iron and Steel plants alone account
for over 70% of the total energy emissions.
70%
Waste Heat Recovery in Karnataka offers
the potential to deploy 500MW of generation
capacity by 2030.
WHR would provide quality power all day,
allowing the grid operator to manage it as base
load power.
WHR power is competitively priced at INR 3.7-4
/kWh, marginally higher than the APPC price
for Karnataka.
14Harnessing Waste Heat Recovery
2
for Power Generation
Harnessing Waste
Heat Recovery for
Power Generation
Executive Summary
Karnataka is the fifth most industrialized state in India and become cost competitive with APPC thus obviating the
among the top producers of cement (~15Mt) and iron and need for government support.
steel (~10 Mt). Industries are dominant energy consumers
with over 50% share of the total energy consumption The current policies on WHR are focused on capital subsidy
and Green House Gas (GHG) emissions in the state of through accelerated depreciation (provided by central
Karnataka. Industry will continue to be the dominant government) and ability to offset RPOs through WHR
consumer of energy in 2030, with share in excess of 50%. power generation. Karnataka however, does not recognize
Within the organized industry sector, Cement and Iron and WHR generation towards RPOs. Also, the policy does not
Steel plants alone account for over 70% of the total energy specify criteria which addresses the concerns of Cement
related emissions. Cement is a distant second and has 10% and Iron and Steel sectors.
share. Currently Karnataka is one of the few states that
does not allow captive consumers to offset their Renewable The three big challenges for adoption of WHR technology
Power Obligations (RPOs) from (WHR) generation. This are high upfront capital investment, difficulty in sale of
has resulted in very low adoption of WHR solutions in the the surplus power and the lack of penetration of WHR
industry. WHR in Karnataka offers the potential to deploy technology in the industry. Since only two industries
about 500 MW of generation capacity by 2030 in Iron and account for majority of the capacity potential, the targeting
Steel and Cement industries. It would entail an investment is relatively easy for the government to explore generation
of about INR 3,500 crores but an added generation of based incentive for procuring WHR power.
electricity of about 3.5 million kWh/year (equivalent to
2,000 MW of wind generation capacity). Additionally, this The incentive requirement can be reduced significantly,
provides firm quality power all day, which allows the grid if low cost financing can be arranged for sourcing of
operator to manage them as base load power. technologies. Given that there are currently about 8 cement
plants over 1MTPA (Million Tons per Annum) which can
WHR technology is characterized by high capital deploy WHR system, a charter of action can be drafted with
investment with marginal subsidy support on tariff when all stakeholders to implement WHR systems in a specified
compared to current Average Pooled Power Cost (APPC). time period.
At present, Iron and Steel energy consumption is primarily
on account of Jindal South West (JSW) plant which has State Government could implement a preferential tariff
WHR system. In case of cement, currently only 1 out of 9 to buy electricity generated from WHR system. Clean
plants in Karnataka (>1 Mt of capacity) has installed WHR Technology Fund (CTF) administered by World Bank may
technology. With no fuel cost, WHR power is competitive be good source to pursue, to raise concessional finance for
at prices of INR 3.7-4 /kWh, which is marginally higher than investing in WHR system.
the APPC price for Karnataka, INR 3.07/KWh. However,
it is likely that with higher coal costs, WHR power would
152
Introduction Cement industry. JSW steel plant dominates the Iron and
Steel industry landscape and has deployed state-of-the-art
WHR technology to generate clean power and water.
Due to sustained industrialization, energy demand in
industries in Karnataka is projected to grow by three
times, reaching 32 Million Tons of Oil Equivalent (Mtoe) Growth and Potential of WHR Energy
by 2030, with thermal energy demand growing faster than for Electricity Generation
electricity demand. Over 90% of this thermal demand will
be met by industrial grade coal, much of which will have
to be imported. Cement and Iron and Steel industries will Emissions from industrial sector are going to double every
account for over 80% of the industrial energy demand decade (Exhibit 1). Exhibit 2 lays out growth path for energy
by 2030. demand for key industries. It is worth noting that energy
and emissions show a direct correlation primarily due to
As the industrial sector continues efforts to improve its heavy reliance on fossil fuels (coal) for energy demand.
energy efficiency, recovering waste heat losses provides Cement and Iron and Steel continue to have dominant
an attractive opportunity for an emission free and less contribution in the overall industrial emissions and energy
costly energy source. Using best available technologies, requirement. This calls for specific policy actions for these
specific energy consumption in various industries can be two industries.
reduced by 15-30%. This case study focuses on Cement
and Iron and Steel industries which account for majority An analysis of growth in Iron and Steel and Cement industry
of the energy consumption in the industrial sector in the show WHR potential of 500 MW by 2030 (Exhibit 3). This is
state. Currently the adoption of WHR technologies for based on current technology and has scope to increase as
power generation is very low in Karnataka, especially in the technology improves.
Exhibit 1 Emission Growth from Key Sectors in Karnataka
Emission in the BAU Scenario for Karnataka (all figures in MtCO2e)
304
18
80
+7%
47
150
12
33
79 24
9 159
14
13 Agriculture
81 Power
43 Transport
Industry
2010 2020 2030
Source: CSTEP (2014)
16Harnessing Waste Heat Recovery
for Power Generation
Exhibit 2 Energy Demand from Key Industries in Karnataka
Energy Demand in Industries (PJ)
1600
1400
1200
1000
800
600
Iron & Steel
Refinery
400
Cement
Fertilizers
200
Pulp & Paper
Aluminium
0 Textiles
2010 2015 2020 2025 2030
Source: CSTEP (2014), GGGI analysis
Exhibit 3 Waste Heat Recovery Electricity Potential in Karnataka
Production in Cement Industry Production in I&S Industry WHR based power generation
in Karnataka in Karnataka potential (all units in MW)
(all units in Million tons) (all units in Million tons)
39.9
560
43.44
8%
6.2% 9%
12.9 132
8.5
2010 2030 2010 2030 2010 2030
Source: CSTEP (2014), GGGI analysis
Policy and Regulatory Landscape of any energy source as renewable, has to be determined
for Waste Heat Recovery by MNRE for the project to be eligible for REC, which
is a national level framework. However, at state level,
classifying an energy source as renewable energy source is
Waste heat recovery projects as per Central Electricity determined by a state electricity regulator. The definition
Regulatory Commission (CERC) and Renewable Energy of Renewable Energy power in the state RPO regulations,
Certificate (REC) regulations are not considered renewable, differs in some instances from that of CERC and Ministry
and therefore are not eligible to get RECs. The classification of New and Renewable Energy (MNRE).
172
Table 2 Cost Economics of Waste Gas (BFG) Based
There are capital subsidies in the form of accelerated
Power Generation in Iron and Steel Units
depreciation, available on WHR equipment. These are at par
with depreciation benefits available for energy efficiency
initiatives which are available to an industry.
Parameters Units Value
• Capital Cost Million INR/MW 44 - 65
Karnataka currently does not treat WHR from industries
• O&M cost % of Capex 2.5
like Cement and Iron and Steel as renewable energy. The
• IRR % 17 - 21
state also does not allow captive plant owners to use waste
• LCOE INR/kWh 3.2 - 4.0
heat energy to meet their RPOs. Hence there is no added
incentive for the industry to adopt WHR solutions.
Barriers to Growth
• Sale of surplus WHR power: WHR power is marginally
higher than APPC in the state. This is also higher than the
The three big challenges for adoption of WHR current cost of coal power from old captive power plants
technology are: of the industries. This prevents companies to invest in
• High upfront capital investment: WHR requires higher WHR system and finance it with no firm commitments
upfront capital investment when compared to capital for sale of power.
cost related to setting up of conventional coal fired • Lack of best practice sharing in Industry: WHR adoption
power plants. This is difficult for most of the companies is still in nascent stage in the country. Most of the
that have limited capacity to deploy capital on initiatives technology deployed in the industry has been imported
outside of their core business activity. Additionally, high and adapted to local conditions. These adaptation
borrowing costs result in higher levelized costs of power. measures have resulted in higher energy recovery, better
Tables 1 and 2 outline the financial parameters for WHR operating efficiencies and thus, significantly improving
based solutions for Cement and Iron and Steel industries. the cost economics.
The cost of power is marginally higher than the current
APPC in the state.
Table 1 Cost Economics of Waste Heat Based Power
Generation in Cement Clinkerization Units
Parameters Units Value
• Capital Cost Million INR/MW 75 - 100
• O&M cost % of Capex 2.5
• IRR % 17 - 19
• LCOE INR/kWh 3.5 - 3.8
18Harnessing Waste Heat Recovery
for Power Generation
Recommendations
WHR has significant potential in terms of additional
electricity generation in the state of Karnataka. But to
realise it, there is a need for specific policy interventions.
Following are some of the conclusions from our analysis:
• There is a strong merit in the government giving priority
focus in developing WHR projects in the Cement sector,
in the immediate term. There are 8 cement plants with
capacity more than 1MTPA which are suitable for
WHR solutions.
• Karnataka could explore mechanisms to support WHR
energy projects. One option is to allow captive WHR
projects to qualify towards RPOs. The second option is to
have generation based incentive for WHR projects. This
would push companies to prioritize investment into
WHR plants.
• A robust ecosystem for WHR adoption could be built
through active collaboration between companies,
vendors and technical institutes. It is important that there
is an institutionalized mechanism to share knowledge
among companies operating in the same industry.
• Government could play an important role by bringing
companies and research institutes together on common
forum with an objective of disseminating knowledge.
• CTF administered by The World Bank may be a good
fund to pursue, to help source low cost financing for
cement plant owners to invest in WHR technology.
As one of the Climate Investment Funds (CIF), CTF
provides middle income countries with highly
concessional resources to explore options to scale up the
demonstration, deployment, and transfer of low carbon
technologies in renewable energy, energy efficiency, and
sustainable transport. The fund is already active in India
and has given USD 100 million development assistance
to Government of Himachal Pradesh.
192
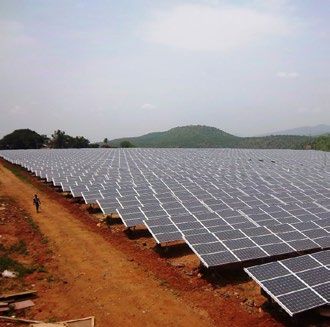
Abundant solar resource is available in Karnata-
ka, with 300 sunny days and low cosine losses
due to proximity to equator.
Comprehensive solar policy exists at both
central and state level to drive the adoption
of Solar power.
The commercial load is expected to form over
50% of overall building demand. Solar power
generation provides a good overlap with
meeting this commercial sector demand.
A major thrust on large solar parks in the
state, can be provisioned under the National
Solar Mission.
20Harnessing Waste Heat Recovery
3
for Power Generation
Scaling up Grid
Connected Solar
Executive Summary
Karnataka is blessed with abundant solar resource in the be instrumental in bringing capital for meeting annual
state, with 300 sunny days in a year and lower cosine losses policy targets.
due to its proximity to the equator. It is also one of the
leading states in terms of adoption of solar water heating For utility scale projects, Karnataka will have to attract
systems in the country and has a thriving manufacturing projects through Jawaharlal Nehru National Solar Mission
base across the value chain. Together with wind energy and (JNNSM) mechanism to limit the subsidy support. JNNSM
hydro power, there is potential to substantially take the projects can avoid state subsidy support by about INR 48
renewable energy share to more than 30% in the state. The crores/year on 100 MW of projects built under JNNSM as
recently launched Solar Policy 2014-2021 is a significant compared to that under state policy. Some of the savings
step in this direction. The policy is comprehensive and can be used to help consolidate land parcels and lease it
has ambitious targets. However, its success will depend to prospective developers. Karnataka has traditionally
largely on its implementation, requiring interdepartmental not been the preferred destination for JNNSM projects as
coordination. compared to Rajasthan and Madhya Pradesh due to limited
availability of land parcels and land connectivity.
Solar Policy 2014-2021 has set specific targets such as
400 MW of rooftop solar by 2017-18 with an annual There are three specific initiatives which can be explored
capacity addition of 100 MW. The policy also proposes to accelerate capacity addition in the state. In the case of
1,600 MW of grid connected, utility scale solar power till building-rooftop projects, GoK can help build a portfolio
2021 with an annual target of 200-250 MW. These targets of rooftops for bidding by solar developers. For utility
on grid connected solar power are the most substantive scale projects, solar parks with large contiguous lands and
solar capacity targets in the policy. They are also aligned transmission connectivity can be offered to prospective
with energy demand characteristics of the state, central developers to bid for solar capacity under JNNSM. Lastly,
government policies under JNNSM (Jawaharlal Nehru wind and solar projects can be co-located to help offset
National Solar Mission) and availability of developers. transmission costs and also result in better land utilization.
This last initiative is already being pursued by Karnataka
The capacity targets in Solar Policy 2014-2021 are Renewable Energy Development Ltd. (KREDL).
ambitious. This can be gauged from the fact that rooftop
capacity addition in all of India is less than 100 MW per A capacity addition of 2,000 MW would entail a direct
year. A conservative estimate shows that 30 million sq ft of investment of about INR 15,000 crores. This investment
building rooftop space is required every year for setting up could be supported by generation based incentive of about
100 MW capacity of solar. The current solar policy is well INR 1,000-1,400 crores/year by the state. Solar energy
structured and its specific aspect of relaxation of Floor deployment in socio-economically vulnerable districts
Area Ratio (FAR) for setting up of solar rooftop is a game can help generate additional economic activity in these
changer. Our assessment, based on interviews with solar districts thus helping to fulfil state economic goals. The
developers and analysis of central policy suggests that socio economic vulnerability index developed by Institute
Government of Karnataka (GoK) can help debottleneck site for Social and Economic Change (ISEC) as part of this
availability for setting up grid connected rooftop projects. project shows high correlation between vulnerable districts
Currently rooftop projects are fragmented and have small and solar resource potential.
capacities which discourage large developers, who would
213
Introduction • Accelerated depreciation benefits: All solar projects
qualify for accelerated deprecation benefits.
• Must run dispatch order: Solar power has been classified
Karnataka is rich in solar resources with 240-300 sunny days as firm power and has been accorded Must Run status in
in a year. It was also the first southern state to notify its solar dispatch schedules.
policy in 2011 and commissioned the first grid connected
Solar Photo Voltaic (SPV) project in the country. It is The Karnataka State Policy 2014-2021 is comprehensive in
estimated that commercial load will form over 50% of the identifying markets for solar power adoption. Some of the
overall building demand. Solar power generation has a good unique features of this policy are:
overlap with commercial sector demand with peak power • Promotion of Distributed Generation: Specific
generation during the day. Rooftop solar can help meet the capacity of utility scale projects, to promote distributed
peak demand for these buildings, thus providing valuable generation, has been allocated. It is especially designed
support to grid operators to manage base load power. for farmers who would be interested to convert some of
their land holdings to set up solar power plants.
JNNSM has emerged as the key driver for growth of solar • Bundled Power Option: Following the lines of JNNSM,
power in the country. It has set a target of adding 34,000 the policy allows for developers to set up solar projects
MW of grid connected solar power in the country by 2022, and sell power under bundled scheme. This is promising
which is about 3% of the overall electricity consumption of for developers who can tie-up capacity within the state.
India. The current national capacity deployment is about It is unlikely that developers will source power from
2,500 MW. JNNSM provides an attractive opportunity for outside the state given the lack of transmission capacity
states to build solar power capacities as they tread further under open access.
on the development path. • Specific Policy Features for Rooftop Solar Projects:
• The Net metering guidelines allow for surplus energy
The current state Solar Policy 2014-2021 is comprehensive to be fed back into the grid and paid for at Karnataka
and lays out a roadmap for both on-grid and off-grid solar Electricity Regulatory Commission (KERC), which is
opportunities. It envisages solar contribution in overall INR 9.05/kWh. This is a significant incentive for roof
electricity consumption to increase from 1.5% to 3% by owners to add capacity. There is a cap on the capacity
2021. This would require significant capacity additions depending on the connected load. Also, the billing
in rooftop solar (400 MW by 2018) and utility-scale solar period for calculating surplus energy needs to be
projects (1,600 MW by 2021). defined.
• Provision for amendment of bye laws with respect to
FAR: Additional area can be created under SPV panels
Policy Landscape with light roofing. This is a game changer and should
encourage solar adoption.
• Solar Park Development: The policy is explicit in
There are broadly two sets of policies for development government’s focus to develop solar parks on lease basis
of solar power projects. The first policy is at the central to utilize uneven waste land. It contemplates providing
level, defined under JNNSM. The second policy is the state a financial assistance of INR 1 crore for solar parks
specific solar policy. Some of the key parameters of these greater than 100 acres in backward areas, as identified
policies are: by Nanjundappa committee. It also allows private
• Generation based incentive: All grid connected developers to set up solar parks in the state, as a plug and
solar power projects, have long term power purchase play model.
agreements.
• Competitive reverse tariff bidding: Unlike wind, solar At central government level, JNNSM is the flagship solar
projects are awarded based on competitive bidding. policy by Government of India. This mission is one of the
• Concessional duties on solar equipment: Concessional eight missions under National Action Plan for Climate
custom and import duties are applicable on solar Change (NAPCC) and one of the most successful missions
equipment. However, there is ongoing debate on levy in terms of its performance against targets. The mission
of dumping duty on solar modules which is resulting in under the aegis of Ministry of New and Renewable
some market uncertainty. Energy (MNRE) has adopted a three-phase approach,
22Harnessing WasteScaling up Grid
Heat Recovery
Connected
for Power Solar
Generation
spanning the remaining period of the 11th Plan and rooftop solar would require about 30 million sq ft of rooftop
first year of the 12th Plan (up to 2012-13) as Phase I, the space. To put this in context, the current commercial floor
remaining 4 years of the 12th Plan (2013–17) as Phase II space area in Bangaluru is 100 million sq ft. This study
and the 13th Plan (2017–22) as Phase III. The mission highlights some of the issues faced in rooftop solar projects
is now in Phase II and intends to add about 750-1,000 across India and how Karnataka can take proactive actions.
MW/year through a bundled power sale arrangement.
This scheme is beneficial for states as their subsidy outgo It has emerged that rooftop solar is fragmented, complex
reduces considerably under this scheme. and will require push beyond policy, to gain meaningful
traction in capacity deployment. Based on conversations
with developers, some of the key challenges for onsite
Implementation Barriers rooftop solar deployment are:
• Creditworthiness: Ensuring creditworthiness of
customers who want to consume solar power on long-
As shown in Exhibit 1, Karnataka has attracted only 10 term basis, is critical for banks to lend for these projects.
MW of the 750 MW capacity auctioned in the last round of • Scale: Rooftop solar projects are small and hence, not
JNNSM Projects. The state policy also saw low conversion meaningful in the overall energy mix of a commercial
from auctioned capacity to commissioned projects. Out building. A typical contribution of rooftop solar energy
of 233 MW auctioned in two phases, only 27 MW has been system would be less than 10% of the overall electricity
commissioned so far. consumption. This results in lower interest levels for
large consumers of energy who are primarily concerned
The key issue faced by utility scale solar projects, is land with reliability of power supply.
and transmission connectivity. The Karnataka Solar Policy • Opportunity cost: Rooftop space is expensive and hence
2014-2021 recommends supporting JNNSM projects in a 15 year lock in is difficult for deployment of solar
the state. However, there needs to be a concerted effort to systems. Karnataka solar policy provisions amending
attract more solar power projects under JNNSM, given the byelaws related to FAR, which should help address some
overall power shortage in Southern India. Variability in of these issues.
generation is also a deterrent for grid operators to provide • Ownership: Most of the large commercial buildings
transmission connectivity. in Bangaluru are owned by developers having IT
companies as tenants. This creates a situation where
Karnataka solar policy envisages significant capacity energy consumers are not decision makers with respect
additions in rooftop solar with annual capacity targets of to installation of solar systems on the rooftops.
100 MW. A conservative estimate suggests that 100 MW of
Exhibit 1 Distribution of Solar Projects in MWs under Batch II of JNNSM Phase II
Tamil Nadu 10 Other 25
Andhra Pradesh 10
Rajasthan 350
Gujarat 40
Madhya Pradesh 250 Karnataka 10
Orissa 20 Maharashtra 35
Source: MNRE
233
Optimization of Government rooftop projects. A 100 MW solar capacity would require
Spending about 550-650 acres of land. Savings in subsidy translate to
about INR 8 lacs/acre equivalent of land value.
Currently, the state policy targets to add 1,600 MW of The key issue facing large scale utility solar projects is land
ground mounted solar power projects till 2021. There are and transmission connectivity. This can be addressed by
two routes for adding this capacity. The first is to develop building dedicated solar parks for projects under JNNSM
projects under the state program and the second is under or co-locating solar plants with wind farms after extensive
JNNSM. A comparison between state SPV tariffs and technical due diligence. The latter has advantage of higher
JNNSM VGF (Viability Gap Funding) shows savings of INR utilization of transmission capacity and ready availability
2.95/kWh (Exhibit 2). With an estimated annual generation of land. Both will translate to lower subsidy outgo for the
of 1,650 MWh/year, this will translate to annual savings of state. However, a detailed technical assessment is needed to
about INR 48 crores/year in subsidy support. These savings identify specific sites.
in subsidy can be used for developing more solar parks and
Exhibit 2 Tariff (INR/KWh) of Solar Power Projects as Determined by KERC and Bid Projects
12
10.92
10 9.56
8.4
8 7.2
6 5.45
4
2
0
Solar PV Solar Thermal Rooftop Solar PV Rooftop Solar JNNSM ground
with capital subsidy Solar PV
Source: KERC (2013)
24Harnessing WasteScaling up Grid
Heat Recovery
Connected
for Power Solar
Generation
Recommendations
GoK should build on its excellent solar policy to emerge as
the leading solar energy generating state. It should pursue
its targets in rooftop solar and ground mounted solar
plants. There are some specific initiatives which we believe
can help enhance the implementation of the solar policy.
• Build portfolio of rooftops and auction it to private
developers. KREDL should take the initiative, to identify
cluster of rooftops with each cluster being at least
MW scale. This would require detailed assessment of
rooftop availability, distributional transformer loads and
willingness of the building owners.
• As a starting point, rooftop spaces on government
buildings can be aggregated and subsequently auctioned
by KREDL for installation of solar systems.
• Identify sites for solar parks to be identified as per the
state policy. KREDL can aggregate the sites, design the
solar park, build transmission connectivity and then
lease it to the developers. Asian Development Bank (ADB)
Clean Energy Financing Partnership Facility (CEFPF)
can be accessed for development of solar farms. These
solar farms can then be made available to developers for
setting up capacity under JNNSM.
• Set up technology demonstration projects, as provisioned
in JNNSM. Solar thermal storage is one such technology
which can help provide solar energy during peak
demand (after sunset) and also improve the overall
grid stability by providing firm quality power. Solar
Energy Corporation of India (SECI) has been entrusted
by MNRE, to set up technology demonstration projects.
The state can provide site infrastructure in terms of land
and transmission connectivity. This will help minimize
subsidy support and also allow solar power to meet peak
loads in the evening.
253
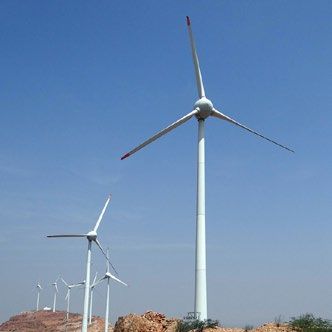
Wind Energy is an effective and affordable way
to meet the state’s target of 20% renewable
energy share in electricity demand by 2030.
Karnataka has high potential for wind energy,
estimated at 100,000 MW out of which 2,200 MW
is already installed.
The districts of Chikballpur ,Chamrajnagar and
Chitradurga can be specifically explored for
wind farm development given their high wind
potential, proximity to Bengaluru and high
socio-economic vulnerability.
Coupled with hydro power, variability in wind
power supply can be effectively managed.
26Harnessing Waste Heat Recovery
4
Renewing
for PowerWind Energy
Generation
Renewing
Wind Energy
Executive Summary There are two established mechanisms to support
development of wind energy. The first mechanism is
generation based incentive which has a longer track
Wind energy is an effective and affordable way for record and better support from financial institutions, due
Karnataka to meet 18% (share) target of its electricity to certainty of revenues. It is completely dependent on
demand by renewable energy by 2030. This would translate the subsidy given by the state. The second mechanism
to a total capacity deployment of about 11,000 MW in the is the Renewable Energy Certificate (REC) which is a
state. Wind energy generation offers significant co-benefits market based mechanism. Government saves INR 1.13/
in terms of clean power, local job creation and reduced kWh of generation based incentive for projects which are
import dependence on coal. setup under REC mechanism. The success of attracting
projects under REC mechanism is dependent on relative
Karnataka has the third largest installed base of wind attractiveness of the state of Karnataka vis-à-vis other wind
capacity in the country. The current deployment is endowed states, primarily in terms of site availability and
about 2200 MW for a state where the potential has been connectivity.
estimated to be over 100,000 MW (CSTEP, 2013). The
capacity addition in Karnataka has plateaued to about 200 The districts of Chikballpur, Chamrajnagar and Chitradurga
MW per year. However, Karnataka has had the slowest could be explored for wind farm development, for multiple
uptake in wind capacity, both in terms of year-on-year reasons. First, these districts have high wind potential.
percentage and megawatts capacity, among the 4 states Second, they are close to Bangaluru, which is the largest
having significant on shore wind potential – others being load center in the state, and third, they are relatively
Tamil Nadu, Maharashtra and Rajasthan. Moreover, most poor and more socio-economically vulnerable to climate
of the large wind farms proposed in the state are yet to change and hence in need of development opportunities.
take off and bulk of the capacity commissioned in state is Karnataka Renewable Energy Development Limited
fragmented, with 90% of the projects, of having less than (KREDL), has recently de-allocated about 2,500 MW of wind
20 MW capacity. capacity of some developers on account of lack of progress.
Consequently, some wind sites will free up allowing for
It is estimated that over 9,000 MW of wind power capacity immediate implementation on development of wind farms.
could be added by 2030. This includes 2,500 MW of
additional capacity, beyond the current plan. At today’s For this project, the Asian Development Bank (ADB)
technology costs, this entails an average investment of Clean Energy Financing Partnership Facility (CEFPF) is
about INR 54,000 crores translating into an annualized recommended for sourcing funds, to develop wind farm
investment outflow of INR 3,600 crores and capacity infrastructure. These funds would be either in the form of
addition of 600 MW. a grant, or low cost financing with potential investment
of USD 3-5 million for building infrastructure for a 400-
Some of the critical issues faced in the development of wind 500 MW wind farm. These farms can then be marketed
energy are limited land availability, lack of transmission to prospective developers to invest in wind generation
capacity for wind energy and seasonal variability in wind capacity. At the domestic level, the National Clean Energy
generation. Government needs to resolve these issues to Fund (NCEF) is a Government of India fund which can
accelerate wind capacity addition, from 200 MW per year to be explored for development of wind forecasting tools
about 600 MW per year. and grid integration pilots to consume higher share of
renewable energy. NCEF allows for up to 40% Viability Gap
Funding (VGF) and has a corpus of INR 15,000 crores.
27You can also read