LEVELIZED COST OF ELECTRICITY RENEWABLE ENERGY TECHNOLOGIES - MARCH 2018 - Fraunhofer-Institut für Solare ...
←
→
Page content transcription
If your browser does not render page correctly, please read the page content below

FRAUNHOFER INSTITUTE FOR SOLAR ENERGY SYSTEMS ISE

LEVELIZED COST OF ELECTRICITY
RENEWABLE ENERGY TECHNOLOGIES

MARCH 2018

  1

                                                    © Rainer Sturm 2010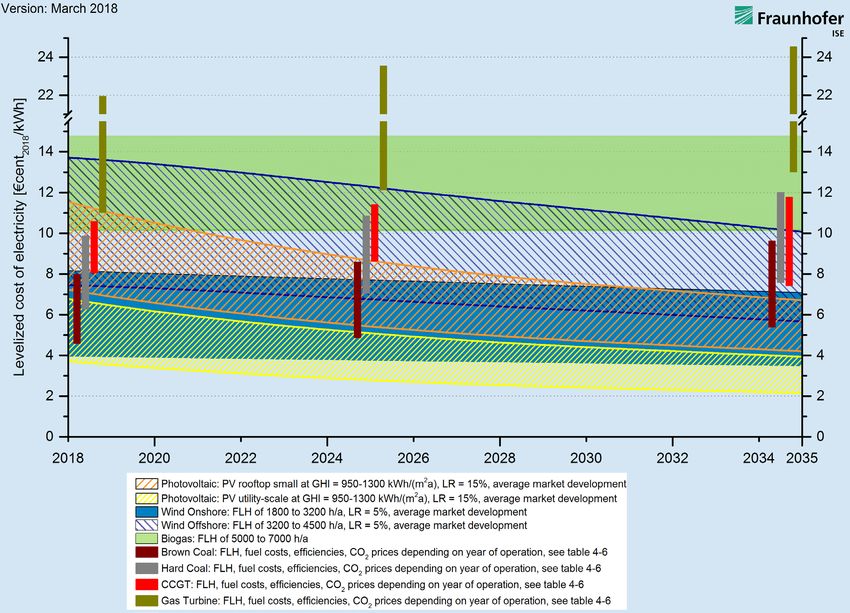
LEVELIZED COST OF ELECTRICITY
RENEWABLE ENERGY TECHNOLOGIES

March 2018

CHRISTOPH KOST
SHIVENES SHAMMUGAM
VERENA JÜLCH
HUYEN-TRAN NGUYEN
THOMAS SCHLEGL

FRAUNHOFER INSTITUTE FOR SOLAR ENERGY SYSTEMS ISE

  2
CONTENTS

                                   Summary									2

                                   1. Objective of this analysis							 5

                                   2. Historical development of renewable energy technologies		                                  8

                                   3. Input data for the calculation of LCOE		                                                  10

                                   4. LCOE of energy technologies                                                               14

                                   5. LCOE for renewable energy technologies in regions with
                                      high solar irradiance           					                                                    24

                                   6. Outlook: LCOE and system integration of renewable
                                      energy technologies              					                                                   29

                                   7. Appendix                                                                                  32

                                   8. References                                                                                34

Contact Person:
Dr. Christoph Kost
christoph.kost@ise.fraunhofer.de

Heaf of Business Area
Energy Systems Analysis:
Dr. Thomas Schlegl

Fraunhofer Institute
for Solar Energy Systems ISE
Heidenhofstraße 2                  Acknowledgements
79110 Freiburg
www.ise.fraunhofer.de              We thank Lisa Bongartz, Thomas Fluri, Charitha Buddhika Heendeniya, Klaus Kiefer, Björn Müller,
                                   Franziska Riedel und Eberhard Rössler for their valuable contribution and great support in crea-
Directors of Institute:            ting this study.
Prof. Dr. Hans-Martin Henning
             1
Dr. Andreas Bett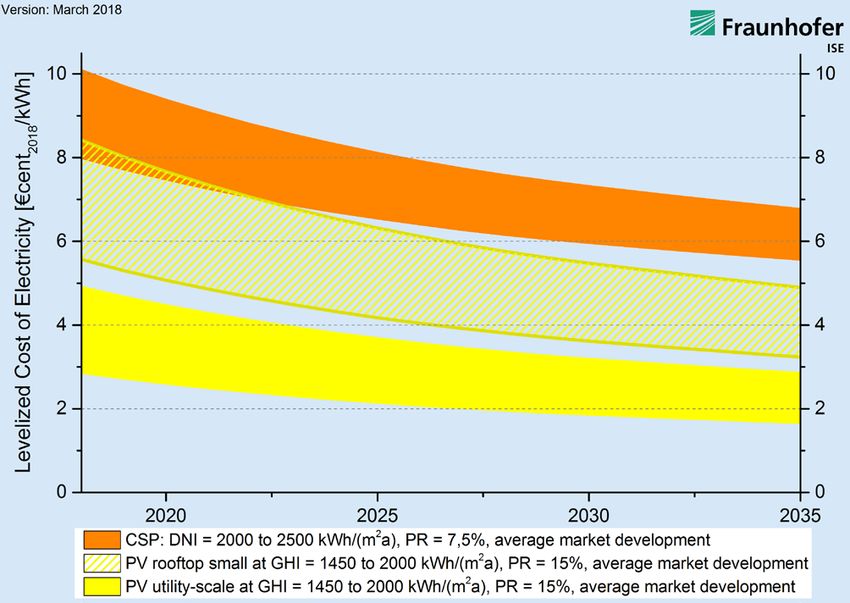
SUMMARY
The present study analyzes the levelized cost of electricity systems, large PV rooftop systems and PV ground-mounted
(LCOE) of renewable energy technologies in the first quar- utility-scale systems. The LCOE for all types of PV systems con-
ter of 2018 and predicts their future cost development until tinues to show a decreasing trend, thus increasing the margin
2035 based on technology-specific learning rates (LR) and between them and the average end-customers electricity price
market scenarios. of 29.23€Cents/kWh, including VAT (BDEW 2017).
The main focus of the study is on the LCOE of photovoltaic The LCOE of onshore wind turbines in 2018, with specific plant
(PV), wind turbines and biogas plants in Germany. As a re- costs of 1500 to 2000 EUR/kW, ranges between 3.99 and
ference, the development of the LCOE for newly constructed 8.23 €Cents/kWh. As a result, PV systems and onshore wind tur-
conventional power plants (brown coal, hard coal, combined bines are, on average, the least expensive technologies in Ger-
cycle gas turbines (CCGT), gas turbines) is also analyzed. many, both among renewable energy technologies as well as
Figure 1 shows the LCOE for both renewable and fossil power fossil power plants. Onshore wind farms at very good locations
plants built in 2018. already produce electricity at lower costs than newly erected
coal or CCGT power plants. Despite higher average full load
Depending on the type of systems and solar irradiance (950 hours of up to 4,500 hours per year, the LCOE of offshore wind
to 1300 kWh/m²a of global horizontal irradiance (GHI) in turbines from 7.49 to 13.79 €Cents/kWh is significantly higher
Germany), PV systems have a LCOE between 3.71 and than onshore wind turbines. This is owed to higher investment
11.54 €Cents/kWh, excluding value-added tax (VAT). As of to- and installation costs as well as higher operating and finan-
day, the specific system costs lie within the range of 600 to cing costs for offshore installations (specific system costs of
1400 EUR/kWp and are primarily dependent on the type of 3100 to 4700 EUR/kW).
plants. This study distinguishes between small PV rooftop
The LCOE of biogas power plants (specific plant costs
Version: March 2018
between 2000 and 4000 EUR/kW) ranges between
22
10.14 €Cents/kWh (7000 full load hours) and 14.74 €Cents/kWh
20
(5000 full load hours). A heat utilization is not considered in
Levelized cost of electricity [€cent2018/kWh]
18
16
the calculations.
14
12
In terms of the conventional power plants, the LCOE of brown
10
coal lies between 4.59 and 7.98 €Cents/kWh, of hard coal 6.27
8
6 to 9.86 €Cents/kWh and of combined cycle power plants 7.78 to
4 9.96 €Cents/kWh, depending on the assumed full load hours and
2
CO2 certificate prices. The range of costs is mainly attributed to
0
PV
rooftop
PV
rooftop
PV
utility-
Wind
Onshore
Wind Biogas Brown coal Hard coal CCGT
Offshore 5000-7000 6450-7450 5350-6350 3000-4000
Gas
500-2000
the large variation in full load hours. Since the full load hours
small large scale 1800-3200 3200-4500 FLH FLH FLH FLH FLH
950-1300 950-1300 950-1300 FLH FLH in h/a in h/a in h/a in h/a in h/a result from the variable marginal costs of the individual power
GHI in GHI in GHI in in h/a in h/a
2 2 2
kWh/(m a) kWh/(m a) kWh/(m a)
plant, they are dependent on the forecast of fuel prices, CO2
Figure 1: LCOE of renewable energy technologies and conventional
power plants at locations in Germany in 2018. The value under the certificate prices, development of renewable electricity feed-in
technology refers in the case of PV to the global horizontal irradiance
and composition of the power plant complex.
(GHI) in kWh/(m²a), for the other technologies to the annual full
load hours (FLH). Specific investments are taken into account with a
minimum and maximum value for each technology.
2
The study also calculates the LCOE of PV home storage systems.            Germany. This same process is carried out for wind and biomass
It lies between 16.34 and 47.34 €Cents/kWh in 2018. Both the              power plants as well as conventional power plants. The usual
costs of electricity generation by PV systems and the storage             financing costs on the market and the surcharges for risks are
costs are taken into account in the calculation. The large va-            included in detail and are specific to each technology. This pro-
riation in the LCOE is a result of the wide range in the invest-          vides a realistic comparison of the power plant locations, tech-
ment costs of PV battery storage as well as the consideration of          nology risks and cost developments. The level of financing costs
different storage sizes and their potential to increase the self-         has considerable influence on the LCOE and the competitiveness
consumption rate.                                                         of a technology. Furthermore, all of the costs and discount rates
                                                                          in this study are calculated with real values (reference year 2018).
Prognosis of LCOE in Germany through 2035                                 The specific investments in 2018 are calculated based on market
                                                                          research and cost studies.
Figure 2 shows the results for the future development of the
LCOEs in Germany until 2035. The illustrated range reflects the           For PV systems, a LR of 15% is assumed. By 2030, the LCOE of
possible cost variations in the input parameters (e.g. power plant        PV systems will sink below the value of 4.70 (rooftop systems)
prices, irradiance, wind conditions, fuel costs, number of full load      and 2.41 €Cents/kWh (ground-mounted utility-scale power plant).
hours, costs of CO2 emission certificates, etc.), which are listed in     From 2025 onwards, even small PV rooftop systems in southern
Tables 1 to 6. This methodology is exemplarily explained for the          Germany will generate electricity at a lower cost than newly in-
cost range of PV: The upper limit of the LCOE results from the            stalled hard coal or CCGT power plants in 2025. The specific PV
combination of a PV power plant with a high procurement price             system costs in 2035 will be between 350 and 815 EUR/kWp.
at a location with low solar irradiance (e.g. northern Germany).          By 2035, utility-scale PV power plants in southern Germany will
Conversely, the lower limit is defined by the most inexpensive            generate electricity at a considerably low cost, way below the
solar system at locations with high solar irradiance in southern          average LCOE for all fossil fuel power plants.

Figure 2 Learning-curve based predictions of the LCOE of renewable energy technologies and conventional power plants in Germany by 2035.
Calculation parameters are listed in Tables 1 to 6. The LCOE value per reference year refers respectively to a new plant in that particular year.

    3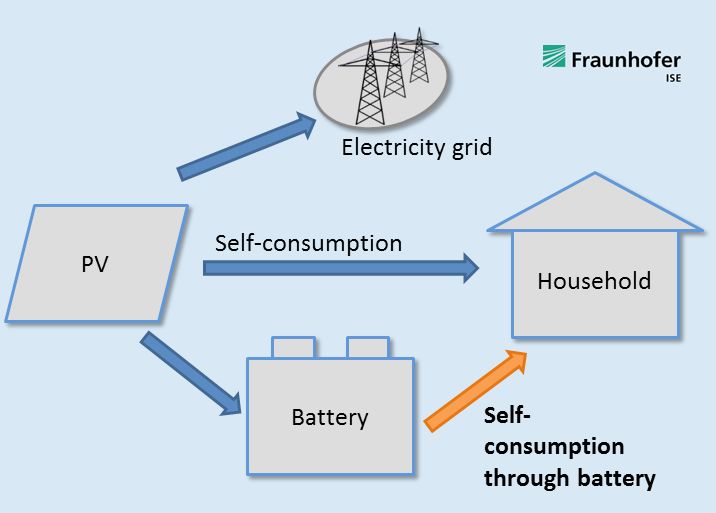
The current LCOE of onshore wind power is already at the level          reduction potential compared to onshore wind turbines. Depen-
of brown coal power plants and in some cases below the LCOE             ding on location and wind supply, electricity generation costs will
of hard coal and CCGT power plants. For the future trend, a LR          fall to between 5.67 and 10.07 €Cents/kWh by 2035. The increase
of 5% is anticipated. Improvements are mainly expected through          in LCOE of conventional power plants is owed to the expected
higher full load hours and also new installations with special low-     reduction of full load hours as well as the higher price of CO2
speed turbines. The expected increase in costs for fossil fuel pow-     emission certificates in the future.
er plants will nevertheless further improve the competitiveness of
onshore wind power plants, i.e. the cost of electricity generation at   Since only slight decreases in cost are expected for biogas power
high wind speed onshore locations in 2035 will be well below the        plants, no LRs for biogas are assumed. This leads to constant
levels for all fossil power plants, at LCOEs between 3.49 to            electricity production costs until 2035 (10.14 to 14.74 €Cents/kWh
7.09 €Cents/kWh. Offshore wind turbines still have a strong cost        excluding heat generation).

    4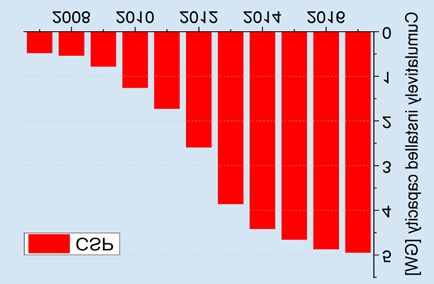
1. OBJECTIVE OF THIS ANALYSIS
Decarbonisation and transformation of the energy system are In order to be able to realistically model the variations in market
associated with both technical and economic efforts. The cost prices and fluctuations in full load hours (FLH) within respective
of current and future power generation is heavily dependent on technologies, upper and lower price limits are indicated. These
the cost of expanding and operating power plants. The costs limits are chosen based on a technology cost analysis of indivi-
of renewable energy technologies in particular have changed dual components, market and literature research as well as la-
dramatically in recent years. This development is driven by tech- test reports from current power plants. It should be noted that
nological innovations such as the use of less-expensive and bet- market prices are often based on applicable feed-in tariffs and
ter-performing materials, reduced material consumption, more- are therefore not always in free competition. Characteristics of
efficient production processes, increasing efficiencies as well as individual technologies that cannot be mapped into LCOE, such
automated mass production of components. For these reasons, as the advantages of easily integrable storage, the number of
the aim of this study is to analyze the current and future cost FLH, decentralized power generation, capacity for follow-up
situation as transparently as possible in the form of LCOE. operation and time of day availability, have not been taken into
account. The technologies are evaluated and compared based
on standard market financing costs and historically proven lear-
Central contents of this study ning curves. As a reference, the current and future LCOE of
new conventional power plants (brown coal, hard coal, com-
Analysis of the current situation and the future market de- bined cycle power plants and gas turbines) are calculated.
velopment of photovoltaic (PV), wind turbines (WT) and
biogas plants in Germany The LCOE of renewable technologies depends largely on the
following parameters:
Economic modeling of technology-specific LCOE (status 1.
quarter of 2018) for different types of installations and site Specific investment cost
conditions (e.g. solar irradiance and wind conditions) on for the construction and installation of power plants with upper
the basis of common market financing costs and lower limits; determined based on current power plant and
market data
Assessment of the different technology and financial pa-
rameters based on sensitivity analyzes of the individual Local condition
technologies with typical irradiance and wind conditions for different loca-
tions and full load hours (FLH) in the energy system
Forecast the future LCOE of renewable energy technolo-
gies until 2035 using learning curve models and market Operating cost
growth scenarios during the power plant’s operational life time
Analysis of the current situation and future market deve- Lifetime of the plant
lopment of photovoltaic and solar thermal power plants
(CSP) for locations with favorable solar irradiance Financing condition
earnings calculated on the financial market and maturity peri-
Analysis of electricity generation costs of PV storage sys- ods based on technology-specific risk surcharges and country-
tems specific financing conditions taking into account the respective
shares of external and equity-based financing.
5The following power generation technologies are studied and Concentrated solar power plants (CSP)
assessed in various design sizes with respect to the current level
of LCOE at local conditions in Germany: Parabolic trough power plants (100 MW) with thermal
storage - parabolic
Photovoltaic power plants (PV)
Modules based on crystalline silicon solar cells For locations with high solar irradiance, not only photovol-
taic technology, but solar thermal power plants (concentrated
Small rooftop systems (5 - 15 kWp) – »PV rooftop small« solar power) are also investigated. As CSP power plants can
Large rooftop systems (100 - 1000 kWp) – »PV rooftop only be used to generate electricity under high direct irradi-
large« ance, the analysis focuses on locations with direct normal ir-
Ground-mounted utility-scale power plants (larger than 2 radiance of 2000 kWh/(m²a) (e.g. in Spain) and locations with
MWp) – »PV utility scale« 2500 kWh/(m²a) (e.g. in the MENA countries).
For the PV power plants, locations in Germany with a GHI of Of solar thermal power plant technologies, only parabolic
950 to 1300 kWh/(m²a) are studied. Standard modules with trough technology is analyzed. Fresnel systems and tower po-
multi-crystalline silicon solar cells are taken into consideration. wer plants, which are currently being developed and built, are
not considered in this study.
Wind energy power plants
Onshore (2 - 4 MW) »Levelized Cost of Electricity: Renewable Energy Techno-
Offshore (3 - 6 MW) logies« version March 2018 - Comparison to the previous
studies
The operation of onshore wind turbines in Germany is studied
at 1800 to 3200 FLH per year as well as offshore wind power at This study is an update of the versions from November 2013
3200 to 4500 FLH per year. (Kost et al, 2013), May 2012 (Kost et al, 2012) and December
2010 (Kost and Schlegl, 2010). The methodology and content
Biogas power plants have been improved and the current trends in cost develop-
ment in the last four years have been taken into account.
Biogas power plants (> 500 kW) with substrate (silo mai-
ze, swine manure, etc.) Besides that, the LCOE of PV systems were expanded to include
the combination of PV systems and batteries, which are ins-
For the entire time period applied in the analysis, a constant talled by private persons and investors to profit from the self-
substrate price of 3.03 €Cents/kWh is assumed since no cost in- consumption of electricity from their PV modules. The sizes of
creases are expected in the future (Scheftelowitz et al. 2016). the PV systems are updated according to the current market si-
The possible operation of a biogas plant as an electricity-heat tuation (small rooftop PV between 5 and 15 kWp, large rooftop
cogeneration power plant with additional heat output and the PV on commercial buildings between 100 and 1000 kWp and
corresponding profits are not accounted for in this study. ground mounted utility scale PV plants from 2 MWp onwards).
Conventional power plants In terms of wind energy, the low wind-speed turbines and
high wind-speed turbines are not distinguished. Increasing
Brown coal power plants (1000 MW) FLHs are assumed for both onshore and offshore turbines,
Hard coal power plants (800 MW) which correlates with the current market trend of increasing
Combined Cycle Gas Turbine power plants (CCGT power ratio between the rotor diameter and the nominal power of
plants, 500 MW) the generator, as well as the increasing hub height. This trend
Gas turbine power plants (200 MW) justifies the slight increase of the investment costs compared
to 2013. However, the costs are expected to decrease again
For comparison, the LCOE of new conventional power plants in the future.
with different development paths for FLH as well as for prices
of CO2 emission certificates and fuels (brown coal, hard coal or Apart from that, both fixed and variable operational costs are
natural gas) are analyzed. considered for wind turbines. The fixed operational costs con-
6sist of the yield-independent repair and maintenance works, Furthermore, the financial conditions for the power plants are
management, lease and insurance costs. Even the conventio- more favorable in this study since the interest rate is currently
nal power plants are designated with fixed and variable ope- much lower than in 2013. The average interest rate for 20 years
rational costs, which contributes to a significant amount in the in 2013 was around 2.6%. In contrast, the interest rate fell to
LCOE as it consists of among others fuel and CO2-certificate 1.07% in 2017 (Status: November 2017). However, the possi-
costs. Since there is a large uncertainty in the conventional bility of an increase in the interest rate in the future cannot be
power plants, a wide range of input parameters for fuel and neglected. Therefore, a smaller interest rate is used in this study
CO2 price as well as FLH are chosen. This is especially true for relative to that in the previous version, which implies that an
the CO2-certificate prices, where a considerably wider ran- increase could be expected in the future.
ge relative to the previous study is chosen here in order to
portray the uncertainty.
72. HISTORICAL DEVELOPMENT OF
RENEWABLE ENERGY TECHNOLOGIES
Throughout the past 15 years, the global market for renewable potentials of the technologies within the next years and will
energies has experienced a strong growth (see Figure 3). In re- contribute to a continuing dynamic market development of
cent years, the market for renewable energies has been pushed renewable energies (AEE 2015).
forward by its growing competitiveness compared to conventi-
onal power plants. Furthermore, the commitment to long-term The extent of the global expansion of renewable energy po-
energy targets has created an even more stable climate for in- wer plant capacities including large-scale hydropower plants
vestments in renewable energies. Positive response can be seen increased significantly by the end of 2016 with a total installed
from lawmakers in several countries towards the prospect of capacity of more than 2000 GW (REN21 2017). In comparison,
the scarcity and price increase of fossil energy sources as well as the current globally installed capacity of nuclear power plants
climate problems. At the same time, the emergence of more amounts to just about 400 GW (IAEA 2018). While the installed
technology applications further profits the renewable energy capacity of nuclear power plants increased only by 9 GW bet-
technologies by making them more competitive even without ween 2000 and 2012, the increase amounted to 266 GW for
investment supports. wind power and to about 100 GW for PV installations (Schnei-
der M. and Forggatt 2013).
Version: March 2018
550
Due to different cost and market structures as well as support
500
schemes, the markets for individual technologies have develo-
Cumulatively installed capacity [GW]
450
400 ped very differently. The market for wind power plants reached
350 competitive market prices at an early stage and has therefore
300
found markets in many countries even without incentive pro-
250
grams. The installed capacity of wind turbines currently sums
200
150
up to 539 GW, with new installations reaching about 52 GW
100 in 2017 (GWEC 2018). The installed capacity of PV adds up to
50 approximately 403 GW at the end of 2017 and is thus lower
0
2007 2008 2009 2010 2011 2012 2013 2014 2015 2016 2017 than that of wind power. Nevertheless, with around 100 GW
Biogas Photovoltaic Wind in 2017, significantly more capacity was added to PV power
Figure 3: Global cumulatively installed capacity 2007-2017 of wind than to wind power (PV magazine 2018). In comparison, the
power, PV, biogas and CSP according to GWEC 2018, REN21 2017, and
IRENA 2018 respectively. Values of 2017 are stated under reserve due new installation of wind power in 2012 was still above of PV.
to lack of sources to cross-check the data. In Germany, the total installed wind power in 2017 amounts to
just under 56 GW and thus has exceeded the total capacity of
The strong market growth of renewable energies and the high PV capacity of about 43 GW (Fraunhofer ISE 2017A).
investments in new power plants were accompanied by inten-
sive research efforts, which led to improved system solutions The LCOE of wind power plants in locations with strong winds,
with higher degrees of efficiency, lower production costs and which is competitive compared to conventional power gene-
lower operation costs. In combination with an increase in mass rating technologies, has enabled the establishment of wind
production, the specific investment costs and thus the LCOE power plants in various markets, including in emerging and
of all technologies analyzed in this study, other than biogas developing countries. Despite good growth forecasts for off-
power plants, could be significantly lowered. A further decre- shore wind power, problems in the implementation phase of
ase of the LCOE will, in turn, lead to an increase of the market new wind turbines have led to their current share of just over
83% of the total installed wind power capacity. A partially high North Africa), the concept of CSP plants is currently being pursu-
prioritization of offshore wind energy is contrasted by high ad- ed by political decision-makers due to the advantages of thermal
ditional efforts for the technical implementation, which often energy storage and the possibility of high added local value.
leads to delays in project realizations.
For the forecast of the LCOE until 2035, this study uses learning
The photovoltaic market has also become an important seg- curve models to estimate future developments. In particular,
ment within renewable energies through the expansion of pro- high LRs of up to 20% have been observed for wind technology
duction capacity, particularly in Asia, where highly automated and crystaline PV throughout the last 20 years (Fraunhofer ISE
production lines are used. Considerable production overcapaci- 2017B). The learning curve models are based on market scena-
ties have led to high competition within the PV industry since rios for each technology with a forecast of the future market
2009. Since 2011, this has led to significant price declines and developments, which are taken from reference scenarios of va-
sometimes unexpected market dynamics. rious studies (Table 11 in the appendix). The technology-specific
market scenarios give each technology a development horizon,
The market for biogas plants has grown the most in Germany which is influenced by numerous technological, energy-political
in the last 10 years, followed by Austria and England. A market and economic decision-making variables over the next twen-
for biogas plants is increasingly developing in the USA as well ty years. For all technologies, there is considerable uncertainty
as in China. The reason lies above all in the remuneration regu- about the actual realizable market development until the year
lations of the respective countries. 2035, as this is very dependent on the amount of specific in-
vestments and usable full-load hours, the need to integrate
In addition to the technologies described above, which are used storage options, the regulatory environment of the different
in Germany, solar thermal power plants can play an important markets and last but not least the price development of con-
role for power generation in countries with higher irradiance. ventional energy sources. However, the actual market develop-
CSP power plants have been gaining market shares in some ment of each technology is crucial for the temporal progress
countries since 2007, following the first installations in the USA of decreasing trends in costs. The presented developments in
in the 1980s. A capacity of 5100 MW has now been installed LCOE are therefore potential development paths based on cur-
(mainly in Spain and the USA) (data from our own market re- rent market developments from various reference scenarios and
search). Especially in the sunny MENA countries (Middle East and technology specific assumptions such as LR and FLH.
9ZUSAMMENFASSUNG
3. INPUT DATA FOR THE CALCULATION OF
LEVELIZED COST OF ELECTRICITY
Technology and financing parameters Sea and Baltic Sea. The input parameters for onshore power
plants are also taken from currently planned or commissioned
A detailed explanation of the methodology of LCOE is found in projects.
the Appendix on page 37.
Electricity generation from biomass is solely calculated for pow-
Upper and lower price limits that do not take outliers into er plants which burn biogas based on different substrates. The
account is calculated for all technologies based on the data substrates used are swine manure und silo corn (with a share of
research; the regular market costs for installation of power 40% of silo corn). Heat generation in CHP biogas power plants
plants varies between them. Uniform amounts of investments is an important operational parameter and increases the econo-
are assumed for all locations. In practice, one must take into mic value of the power plants. However due to the focus of this
account that the investments in power plants in markets that study on electricity generation, it is not included in the calcula-
have not yet been developed can in some cases be conside- tion of the LCOE. At this time there are many bioenergy power
rably higher. Table 1 shows the investment costs in EUR/kW plants in operation. Power plant size is generally between 70
(nominal capacity) for all technologies considered that were and 1000 kWel, whereby power is generated using solid, liquid
determined based on market research on currently installed or gaseous bio-fuels. New power plants or expansions of power
power power plants in Germany as well as taking external plants are being advanced primarily in the biogas sector (DBFZ
market studies into account. Within the technologies, the sys- 2012). Additionally, flexible power plants will be needed in fu-
tem costs were distinguished based on power plant size and ture for the integration of fluctuating power generation from
power plant configuration. wind power and photovoltaic power plants (VDE 2012). Flexib-
le operation of biogas power plants in load-following operati-
For PV, the upper and lower limits for the installation cost are on mode is possible. In this study, only LCOE of biogas power
differentiated according to the system sizes of small rooftop plants with a size of around 500 kWel are calculated because
systems up to 15 kWp, large rooftop systemy up to 1000 kWp power plants of this capacity currently hold the largest market
and ground-mounted PV systems. By using these costs, the share (Stehnull et al, 2011).
LCOE for each point of time for investment and construction
are calculated. The financial lifetime of PV is set to 25 years. The following parameters are used in the calculation of LCOE
Longer lifetimes and operation of PV are also reported by the for installation constructed at beginning of 2018 and in the fu-
plant monitoring of Fraunhofer ISE. ture (Table 2). The financing parameters have been continuous-
ly analysed since the first studies in 2010, 2012 and 2013.
Data for offshore wind power plants is obtained by currently The risk and investor structure of each type has been adapted.
constructed and commissioned projects in the German North Currently, the available financing conditions are very attractive.
PV rooftop PV rooftop
CAPEX PV utility-scale Wind Wind
small large Biogas Brown coal Hard coal CCGT GT
[EUR/kW] (> 2 MWp) onshore offshore
(5-15 kWp) (100-1000 kWp)
Investment
1200 800 600 1500 3100 2000 1600 1300 800 400
2018 low
Investment
1400 1000 800 2000 4700 4000 2200 2000 1100 600
2018 high
Table 1: Specific CAPEX in EUR/kW of current power plant installations
10Therefore, capital costs are assumed to be lower than in the A mixture of real and nominal values is incorrect and not per-
study of 2013. It has to be noticed that the financing conditions mitted. To carry out the analysis on nominal values, the annual
(in the form of interest rate for debt and equity) might increase inflation rate has to be projected by 2035. Since the forecast
again, especially for future projects. for the inflation rate over the long term is very imprecise and
difficult, cost predictions are generally completed using real va-
In many studies, the aspect of technology specific financing lues. All costs stated in this study therefore refer to real values
conditions is not sufficiently analyzed. Often, similar discount from 2018. The LCOE provided for future years in the figures
rates are assumed for all analyzed technologies and locations. always refer to new installations in the respective years. The
This can lead to divergent LCOE compared to real LCOE. In this LCOE of a single project remains constant over its operational
study, the discount rates are determined specifically for each lifetime and is therefore identical to the value of the year of
technology by applying the market capital cost (and the pa- installation.
rameter weighted average costs of capital – WACC) for each
investment. The WACC consists of a share for the interest rate A second factor influencing return on equity is the project-spe-
on debt and the return on equity. Large power plants const- cific risk: The higher the risk of default, the higher the return on
ructed and operated by large investors and institutions have a equity required by the investor. In order to keep the capital costs
higher WACC due to the expected return of the investor com- low, a high share of debt with low interest rate is desirable. It
pared to small and medium size projects that are constructed by is, however, also limited by the project-specific risk: The higher
private persons or business partnerships. The return on equity the risk of default, the lower the amount of debt that banks
expected by investors for technologies with lower maturity (e.g. provide to the project. Since offshore wind parks continue to
offshore wind) are additionally higher compared to established evince a high project-specific risk, the average capital costs are
technologies. It can be expected that the financial conditions correspondingly higher than for comparable onshore projects.
will be equalized after increase of installed capacity as the risk If loans with low interest rates are available in sufficient amount,
premium for new technology sinks with increasing experience. for example from the KfW-Bankengruppe, interest rates on
Since the WACC is derived from the usual interest rates and debt of approximately 2 to 4% can be achieved depending on
expected returns on the market, which are given in nominal the technology. This is currently the case for small PV power
values, the nominal value of the WACC is calculated first. This plants, for which the effective interest rate of a KfW loan is cur-
nominal value is then converted into a real value by taking an rently only 2.63% for the highest rating class – with a 20-year
assumed 2% p.a. inflation rate into account. maturity and 20-year fixed interest (KfW 2018). Since there is
currently a very low rate of interest and this value is expected to
The decisive factor for the calculation of the LCOE is that all increase, the interest rate on debt is set slightly higher to 3.5%
payment streams are assumed at either nominal or real levels. for PV installations.
PV rooftop
PV rooftop PV
large Wind Wind Brown Hard
small utility-scale Biogas CCGT GT
(100-1000 onshore offshore coal coal
(5-15 kWp)
kWp) (> 2 MWp)
Lifetime [in
25 25 25 25 25 30 40 40 30 30
years]
Share of debt 80% 80% 80% 80% 70% 80% 60% 60% 60% 60%
Share of equity 20% 20% 20% 20% 30% 20% 40% 40% 40% 40%
Interest rate on
3.5% 3.5% 3.5% 4.0% 5.5% 4.0% 5.5% 5.5% 5.5% 5.5%
debt
Return on equity 5.0% 6.5% 6.5% 7.0% 10.0% 8.0% 11.0% 11.0% 10.0% 10.0%
WACC
3.8% 4.1% 4.1% 4.6% 6.9% 4.8% 7.7% 7.7% 7.3% 7.3%
nominal
WACC
1.8% 2.1% 2.1% 2.5% 4.8% 2.7% 5.6% 5.6% 5.2% 5.2%
real
OPEX fix 2.5% of 2.5% of 2.5% of 4.0% of
30 100 36 32 22 20
[EUR/kW] CAPEX CAPEX CAPEX CAPEX
OPEX var
0 0 0 0.005 0.005 0 0.005 0.005 0.004 0.003
[EUR/kWh]
Degradation 0.0025 0.0025 0.0025 0 0 0 0 0 0 0
Table 2: Input parameter for LCOE calculation. The real WACC is calculated with an inflation rate of 2%.
11In international comparisons of locations, one must keep in horizontal surface (Figure 25). This corresponds to a solar irra-
mind that the financing conditions differ, similar to the en- diance between 1100 and 1510 kWh/(m²a) onto an optimally
vironmental conditions such as solar irradiance and wind oriented PV power plant. After subtracting losses of electricity
conditions. Especially in the case of renewable energy pro- generation in the PV system, an average annual electricity yield
jects, whose economic efficiency is significantly dependent between 935 and 1280 kWh per installed kWp is obtained.
on feed-in compensation, the country-specific risk of default
of these payments, such as caused by national bankruptcy, The wind conditions are also location-dependent. Onshore
must be taken into account. Another factor is the availabi- wind turbines can reach FLH of only 1800 hours per year at
lity of subsidized loans at favorable interest rates. Germany unfavourable locations. The level of FLH, however, can reach
offers here very favorable framing conditions for investments values of up to 3200 hours at selected locations near the coast
in renewable energy. in Germany.
The average FLH for onshore wind power plants constructed in
Local Conditions 2016 is at 2721 hours per year (Fraunhofer IWES 2018). Much
Irradiance and Full Load Hours (FLH) higher FLH can be reached by offshore power plants with values
between 3200 hours at coastal areas and 4500 hours at loca-
The amount of electricity yield at each power plant location is tions with large distance to the coast (in the North Sea). Due
an important parameter with a considerable influence on the to the trend of increasing size and distance from the coast, off-
LCOE of renewable energy technologies. In the case of solar shore power plants are expected to reach 5500 FLH in the best
technologies, the amount of diffuse or direct solar irradiance case (Reuter, Elsner 2016). This refers to an annual growth of
(depending on the technology) plays an important role. The FLH 0.6%. Therefore, an annual growth of FLH for new installations
of a wind farm can be calculated from the wind conditions at is assumed to be 0.5%.
the power plant location as a function of the wind speed. In
the case of biogas, however, the number of FLH is not supply- Biogas power plants are operated in Germany with a utilization
dependent but is determined by the demand, availability of rate of 80 – 90% (which refers to over 7000 FLH). Due to the
substrate and power plant design. flexibility premium in the EEG law, the power plants are increa-
singly operated by a flexible operation mode. This leads, how-
For that reason, exemplary locations with specific FLH for wind ever, to decreasing FLH. The objective of the flexibility premium
farms should be studied as well as locations with specific ener- is an increase of the flexibly electricity generation by biogas
gy sources from solar irradiance (see Table 3). At typical loca- power plants. By this change, the fluctuating feed-in of solar
tions in Germany, there is a global horizontal irradiance (GHI and wind should be better balanced. Consequently, the range
– consisting of diffuse and direct irradiance) in the range bet- of FLH of biogas plants is assumed between 5000 and 7000.
ween 950 and 1300 kWh per square meter and year onto the
PV plant (location) Global horizontal Irradiance on PV modules with Electricity generation per 1 kWp
irradiance [kWh/(m2a)] optimal angle of inclination with optimal angle of inclination
[kWh/(m2a)] [kWh/a]
Northern Germany 950 1100 935
Central and Eastern Germany 1120 1300 1105
Southern Germany 1300 1510 1280
Wind power plant (2 - 5 MW) Wind speed at 120m Wind full load hours [h] Electricity generation per 1 kW
hub height [m/s] [kWh/a]
Onshore: Inland Germany 5.5 1800 1800
Onshore: Northern Germany 6.4 2500 2500
Onshore: Coastal area Germany 7.8 3200 3200
Offshore: Short distance from coast 7.8 3200 3200
Offshore: Middle distance from coast 8.7 3600 3600
Offshore: Very good locations 10.3 4500 4500
Table 3: Annual returns at typical locations of PV and wind power (Source: Fraunhofer ISE).
12In comparison to most of the renewable energy technologies, To compare the LCOE of renewable energy technologies and
conventional power plants generate their electricity output conventional power plants, assumptions about the efficiencies
based on the hourly demand, cost of fossil fuels and the hourly and CO2 emissions of these power plants are needed. The as-
merit order in the energy system. The current FLH of brown coal sumptions for the typical power plant sizes are for brown coal
power plants is at 6950 hours on average. Coal-fired power between 800 and 1000 MW, for hard coal between 600 and
plants are at 5850 hours and CCGT plants at 3500 hours on 800 MW, for CCGT power plants between 400 and 600 MW
average in Germany (BMWI 2017a). and for gas turbines 200 MW. Through further technological
improvements, the efficiency of new power plants will increase
In the German energy transformation process, the increasing for brown coal from 45% to 48%, for hard coal from 46% to
electricity generation from renewables reduces the FLH of con- 51% and for CCGT from 60% to 62%. The price trends for
ventional power plants. This study estimates continuously redu- fuels are assumed with very moderate increases. Due to a pos-
cing FLH for all new conventional power plants (brown coal and sible shortage of CO2 allowances, a long-term increase of the
coal -1% per year, CCGT -0.5%, gas turbines constant FLH). allowance price is assumed (see Tables 4-6).
The average value of FLH for brown coal reduces to 5350 hours
in 2035 and for CCGT to 3100 hours. Higher FLH can reduce
the LCOE of fossil power plants and vice versa, as the market
Fuel prices
situation or demand development allows it. 2018 2020 2025 2030 ab 2035
[EUR/MWh]
Brown Coal 1.8 1.8 1.8 1.8 1.8
Fuel Cost Hard Coal 9.6 11.1 11.5 13.4 15.2
Natural Gas 21.0 25.1 27.1 32.2 33.8
Substrate costs vary considerably for biogas power plants. Substrate Bio-
30.3 30.3 30.3 30.3 30.3
mass
The costs differ owing to the options for purchasing subst-
Table 4: Assumptions about fuel prices are based on values of
rates or using substrates generated by biogas operators in- (Prognos AG 2013; Hecking et al. 2017; Schlesinger et al. 2014;
World Bank 2017; DLR Rheinland-Pfalz 2017; Scheftelowitz et al.
house. Additionally, the shares of the various substrates differ
2016)
between power plants. For example, in 2009, a biogas plant
in Baden-Württemberg, utilized an average substrate mix
which consisted of 30% liquefied manure, 5% solid manu- Efficiency con-
re, 43% silo maize, 12% grass silage, 5% whole plant silage ventional power 2018 2020 2030
plants [%]
(GPS) and 5% other substrate (Stehnull et al, 2011). In this ,
Brown Coal 45.0 46.5 48.5
the methane yield for the individual substrates was between Hard Coal 46.0 50.0 51.0
106 Nm³/tFM (ton wet mass) for silo maize (Scholwin et al, CCGT 60.0 61.0 62.0
Biomass 40.0 40.0 40.0
2011) and 12 Nm³/tFM for liquefied pig manure (Taumann
Table 5: Efficiency development in large power plants (Wietschel et
2012). Different costs accumulate for the substrates. Thus the al. 2010)
substrate costs for the purchase of maize silage are around
31 EUR/tFM (Scholwin et al, 2011) and for liquefied pig ma-
nure around 3 EUR/tFM (DBFZ 2010). Substrate costs for sub- CO2 certificate
strate produced in-house can be assumed to be near zero. prices 2018 2020 2025 2030 ab 2035
[EUR/t CO2]
Average substrate costs of 0.03 EUR/kWhth are assumed
Lower value 5.3 5.0 12.5 20.0 30.0
by considering the conversion of the methane yield and the Upper value 5.3 15.0 32.5 50.0 70.0
methane energy production of 9.97 kWh/Nm³. Table 6: CO2 certificate price (own assumptions)
134. LEVELIZED COST OF ELECTRICITY OF
ENERGY TECHNOLOGIES
In this chapter, the LCOEs of renewable energy technologies at and 8.43 €Cents/kWh while LCOE values between 9.89 and
locations in Germany are determined for PV, biogas and wind 11.54 €Cents/kWh are reached at locations in northern Germa-
power based on market data on specific investments, opera- ny with an irradiance of 950 kWh/(m²a). The results depend
ting costs and additional technical and financial parameters. on the amount of the specific investments, which is assumed
Reference calculations for conventional power plants (brown to range from 1200 EUR/kWp to 1400 EUR/kWp. Rooftop
coal, hard coal, CCGT and gas turbines) with different confi- PV power plants up to 1000 kWp can produce electricity at
gurations, construction and operation strategies provide LCOE a LCOE between 4.95 and 6.18 €Cents/kWh in southern Ger-
values for comparison. many and between 6.77 and 8.46 €Cents/kWh in northern
Germany, each with specific investments between 800 and
In southern Germany, the LCOE for small PV rooftop systems 1000 EUR/kWp. Ground-mounted PV power plants current-
at locations with GHI of 1300 kWh/(m²a) lies between 7.23 ly reach LCOE values between 3.71 and 4.95 €Cents/kWh in
Version: March 2018
22
20
Levelized cost of electricity [€cent2018/kWh]
18
16
14
12
10
8
6
4
2
0
PV PV PV Wind Wind Biogas Brown coal Hard coal CCGT Gas
rooftop rooftop utility- Onshore Offshore 5000-7000 6450-7450 5350-6350 3000-4000 500-2000
small large scale 1800-3200 3200-4500 FLH FLH FLH FLH FLH
950-1300 950-1300 950-1300 FLH FLH in h/a in h/a in h/a in h/a in h/a
GHI in GHI in GHI in in h/a in h/a
2
kWh/(m a) kWh/(m2a) kWh/(m2a)
Figure 4: LCOE of renewable energy technologies and conventional power plants at different locations in Germany in 2018. The value under
the technology refers in the case of PV to solar irradiance (GHI) in kWh/(m²a); in the case of other technologies it reflects the number of full
load hours of the power plant per year. Specific investments are taken into account with a minimum and maximum value for each technology.
Additional assumptions are presented in Table 4-Table 6.
14southern Germany and between 5.08 and 6.77 €Cents/kWh Photovoltaics
in northern Germany, with specific installation costs of Market development and forecast
600 EUR/kW to 800 EUR/kW. Therewith, the LCOE of all kinds
of PV systems in Germany is significantly lower than the ave- At the end of 2017, the global installed PV capacity excee-
rage net electricity price for households of about 20 €Cents/kWh ded 400 GWp and the global expansion in 2017 amounted
excluding VAT (which corresponds to the net energy price of to around 100 GWp. This represents a market growth of over
average electricity price for private households at 29 €Cents/kWh 30%, compared to the 76.6 GWp installed globally in 2016
as published by BDEW 2017). (Hill 2017). Currently China dominates the global PV market in
both production and installation. At the same time, more coun-
The LCOE of onshore wind power with an average instal- tries are installing PV on a significant scale, as PV plants increa-
lation cost of 1500 EUR/kW and a very high annual FLH of singly prevail in free competition and can thus be implemented
3200 hours is 3.99 €Cents/kWh. However, such locations in independent of subsidy programs. The PV market growth is
Germany are very limited. LCOEs in less suitable locations in now driven by purely economic reasons.
Germany range up to a value of 8.23 €Cents/kWh, depending
on the specific investment and the annual FLH (see Table 3). Performance Ratio of PV systems
In comparison, the cost of offshore wind turbines is signifi- The Performance Ratio is used frequently to compare the
cantly higher, displaying values between 7.49 €Cents/kWh and efficiency of grid-connected PV systems at different loca-
13.79 €Cents/kWh, despite higher FLH of 3200 to 4500 per year. tions and with different module types. It describes the ratio
The considerably more complex grid connection of offshore si- of the actual energy yield (final electrical energy) of a PV
tes for the grid operator is not included in the electricity gene- system and its rated output. The nominal power of a PV
ration costs. The LCOE of biogas plants ranges between 10.14 system is usually expressed in kilowatt peak (kWp) and is
and 14.74 €Cents/kWh for substrate prices of 3.03 €Cents/kWhth. based on the power of the PV modules in the PV system
measured under Standard Testing Conditions (STC). The
Based on the current conditions on the electricity market with actual usable energy yield of the PV system is influenced
respect to FLH and fuel prices for each technology, the fol- by the real operating conditions at the system location.
lowing LCOEs for conventional power plants are determined: Deviations of the actual module yield in comparison with
Brown coal power plants built today achieve an LCOE between STC conditions may arise for various reasons, such as dif-
4.59 and 7.98 €Cents/kWh for the selected operation parameters ferent solar radiation values, shading and soiling of the PV
(e.g. a very low CO2 price today and a sharply rising CO2 price modules, reflection on the module surface at oblique inci-
in the future). The LCOE for hard coal shows slightly higher dent angles, spectral deviation from STC conditions, and
values between 6.27 and 9.86 €Cents/kWh. CCGT power plants increasing module temperature. Other losses in the PV sys-
achieve values between 7.78 and 9.96 €Cents/kWh, while the tem are caused by electric mismatch of modules, resistive
LCOE of gas-fired turbines is considerably higher, ranging bet- losses in the AC and DC wiring, inverter losses and even-
ween 11.03 and 21.94 €Cents/kWh. tual losses in the transformer. New, optimally oriented PV
systems achieve performance ratios between 80 and 90%
One must keep in mind that the LCOE calculation does not in Germany (Reich et al., 2012).
include the possible flexibility of a power generation technolo-
gy or the worth of the generated electricity. For example, the
specific seasonal and daily generation of each technology is dif- This leads to the assumption that the global PV market will
ferent. Differences due to the flexible use of power plants or continue to grow strongly. All three scenarios “High”, “Me-
the provision of ancillary services in relation to the market sales dium” and “Low”, upon which the study is based, assume a
price of electricity obtained are not reflected in the LCOE (see continuous reduction in annual market growth. The expected
also Chapter 7). market growth of 30%, 25% or 20% for the respective scena-
rios (“High”, “Medium” and “Low”) will decline to 10% (for
“High” and “Medium”) and 5% (for “Low”) respectively by
2035. For the year 2035, the three scenarios result in a total
capacity of 9000 GWp, 5200 GWp and 3000 GWp respectively.
The scenarios of the cumulatively installed power plant perfor-
mance are shown in Table 10.
15Version: March 2018 produce approximately 935 kWh/(m²a), while power plants in
10000
Low
Medium
southern Germany yield up to 1280 kWh/(m²a).
High
Cumulatively installed capacity [GWp]
8000
The strong decline in investment prices for PV power plants has
led to significantly lower LCOEs compared to 2013. Ground-
6000
mounted utility-scale power plants in northern Germany can
already achieve a LCOE below 5 €Cents/kWh and in the south
4000
below 4 €Cents/kWh respectively. The LCOE of large PV rooftop
systems lies between 8.46 €Cents/kWh in northern Germany and
2000
4.95 €Cents/kWh in southern Germany. Small PV rooftop systems
in Germany generate electricity at LCOE between 11.54 and
0
2018 2020 2022 2024 2026 2028 2030 2032 2034 7.23 €Cents/kWh, and thus are well below the average electricity
costs for households. As all PV technologies still have a clear
Figure 5: Market development scenarios of cumulatively installed
power plant capacity [GW] for PV 2018-2035, own scenarios. potential for cost reduction, a continued decrease in the invest-
ment costs and consequently the LCOE in the medium to long
Development of prices and costs term is to be expected – apart from possible price fluctuations
due to special market events. Additionally, the lifetime of PV
Since 2016, wholesale prices for crystalline modules in Germa- systems is also expected to increase. Today, many module pro-
ny have dropped significantly from an average of just under ducers already guarantee their module performance for over
540 EUR/kWp (pvXchange 2018) to 440 EUR/kWp (BSW 2018) 25 years. In case of an increase of the lifespan of power plants
in 2018. The lowest net price for crystalline modules in the first from 25 to 30 years, the LCOE will sink by another 8.5%.
quarter of 2018 was 340 EUR/kWp (BSW 2018). An approxi-
mation towards the price level of China could be observed: Version: March 2018
While the average wholesale price in 2016 still amounted to 12
just under 530 EUR/kWp, it fell to almost 400 EUR/kWp in 2018
Levelized cost of electricity [€cent2018/kWh
10
(as of the first quarter of 2018). In 2013, the price difference
between the modules in Germany and China was significantly 8
larger: While prices in Germany were around 770 EUR/kWp, in
6
China they were significantly lower at 550 EUR/kWp.
4
The costs for inverters and balance of system (BOS) components
2
like mounting system and cables, as well as their installation
costs, dropped, though not as strongly as PV module prices. 0
PV PV PV PV PV PV PV PV PV
rooftop rooftop utility- rooftop rooftop utility- rooftop rooftop utility-
While in 2005, solar modules constituted almost 75% of the small
950
large
950
scale
950
small
1120
large
1120
scale
1120
small
1300
large
1300
scale
1300
GHI in GHI in GHI in GHI in GHI in GHI in GHI in GHI in GHI in
system costs, this share is around 50% today, even for rooftop 2 2 2
kWh/(m a) kWh/(m a) kWh/(m a)
2
kWh/(m a) kWh/(m2a) kWh/(m2a) kWh/(m2a) kWh/(m2a) kWh/(m2a)
Figure 6: LCOE of PV plants in Germany based on system type and
PV systems. Table 1 shows the price bands for PV systems of solar irradiance (GHI in kWh/(m²a)) in 2018.
different size classes. The costs for small PV systems (5 to 15
kWp) currently range from 1200 to 1400 EUR/kWp. For larger A sensitivity analysis performed for a small PV plant in Germany
PV systems up to 1000 kWp, the costs currently amount to 800 demonstrates the LCOE’s strong dependency on the solar irradi-
to 1000 EUR/kWp. Ground-mounted utility-scale power plants ance and specific investments (see Figure 7). The sharp decline
with capacities above 2000 kWp show investment costs bet- in the LCOE in the last years can be explained by the lower
ween 600 and 800 EUR/kWp. These values include all compo- module prices. The influence of the capital costs for investment
nent and installation costs associated with the PV power plant. (WACC) on the LCOE is not to be underestimated, since the
In some cases, investments below the specified price ranges can differences here can be relatively large and slightly outside of
be realized under certain conditions of purchase. the parameter variance of 80 to 120% shown here. Operating
costs change more slightly and have a smaller influence on the
The current LCOEs of PV systems are shown in Figure 6 for va- LCOE of PV plants, since they only constitute a minor share of
rious power plant sizes and costs at different irradiance values the total costs. The system lifespan has a strong effect on the
(according to Table 3). The number following power plant size costs. With longer lifespans, plants that have already amortized
stands for the annual global horizontal irradiance at the power continue to produce electricity at very low operating costs.
plant location in kWh/(m²a). Power plants in northern Germany
16Version: March 2018 The LCOE of wind power is highly dependent on local condi-
130
tions with respect to both onshore and offshore power plants,
as well as on the achievable FLH. In general, locations with fa-
120
vorable conditions are distinguished from those with unfavo-
Variation from reference [%]
110
rable wind conditions. Favorable locations have average wind
speeds of more than 7.8 m/s. Locations with unfavorable loca-
100 tions are often located inland; the average annual wind speed
is lower and the ground is rougher because of agriculture and
90 forest cover.
80
80 90 100 110 120 A current trend indicates that manufacturers are striving to con-
Parameter variance [%]
struct higher towers and increase the rotor area in proportion
Investment WACC O&M Lifetime Irradiance
Figure 7: Sensitivity analysis of a small PV system with a GHI of 1120
to the generator capacity. This corresponds with an effort to
kWh/(m²a) and investment of 1300 EUR/kW increase yields, enabling profitable operation also at locations
with less favorable wind conditions. Higher towers and longer
Wind power plants rotor blades, however, lead to greater material and installation
costs that can only be justified by a significant increase in FLH.
Of all renewable energy technologies, wind power currently Thanks to ongoing technical refinement, an increase in FLH can
has the strongest market penetration due to its competitiveness be expected for future power plants and thus an annual incre-
compared to conventional power generation. Initially strongest ase in the FLH which would lead to improvements in the LCOE
in the markets of Denmark and Germany, the world market for wind power.
in recent years has changed showing the strongest growth in
China, India and the USA (GWEC 2013). The electricity generation costs of onshore wind turbines are
calculated for sites with an average annual wind speed of
By the end of 2017, the total capacity of installed wind power 5.5 m/s and 6.4 m/s, respectively. 1800 (at the first location)
has increased to over 500 GW. The market has shown conti- and 2500 FLH per year (at the second location) are achieved.
nuous growth in the past. The total capacity of onshore wind Very good wind locations on the coasts are represented by a
is expected to reach more than 1100 GW in 2025 and about location with 7.8 m/s and 3200 FLH.
1500 GW in 2030 (GWEC 2017a; GWEC 2017b). For offshore
wind energy, a global total capacity of 65 GW in 2025 and of As shown in Figure 9, the LCOE of onshore wind turbines at
126 GW in 2030 is expected (DW 2017, IRENA 2016). coastal locations with favorable wind conditions with 3200
FLH ranges between 3.99 and 4.85 €Cents/kWh. Locations with
The share of wind power in total electricity generation in Ger- less-favorable wind conditions achieve LCOE values from 6.72
many amounted to 17.6% in 2017, of which 14.5% came to 8.23 €Cents/kWh, depending on the specific investments. If it
from onshore wind energy (Burger 2017). Wind energy conti- is possible to achieve 2500 FLH at the respective location, the
nues to account for 46.6% of renewable electricity generation LCOE reaches values between 4.97 and 6.07 €Cents/kWh, which
in 2017 (Burger 2017). is lower than the LCOE of new hard coal power plants.
Version: March 2018
3200
Wind Offshore Medium In contrast, the analysis of current offshore wind power (in-
Wind Offshore High
2800 Wind Onshore (GWEC 2013, 450S)
Wind Onshore (GEWC 2013, NewPol)
cluding locations with higher FLH up to 4500) shows higher
Cumulatively installed capacity [GW]
Wind Onshore (GWEC 2013, Adv)
2400 LCOE than onshore wind power. This is due to the necessary
2000
use of more resistant and expensive materials, the elaborate
anchoring in the seabed, cost-intensive installation and logistics
1600
of the plant components and higher maintenance expenditure.
1200
However, a decrease in system costs and lower maintenance
800 costs can be expected due to more reliable systems in the fu-
400
ture. Currently, the LCOE of offshore wind turbines at very good
locations ranges from 7.79 to 9.95 €Cents/kWh. However, these
0
2018 2020 2022 2024 2026 2028 2030 2032 2034 locations are often distant from the coast and are disadvan-
Figure 8: Market forecasts of cumulative wind power according to taged by a complex and expensive network connection, as
(GWEC 2013).
17Version: March 2018
vestments as the primary goal for realizing future cost reduction
14
potential. Similar to PV, the sensitivity analysis reacts strongest
Levelized cost of electricity [€cent2018/kWh]
to this parameter. Furthermore, reducing maintenance costs can
12
also make an important contribution.
10
8
6
Biogas power plants
4
The market for biogas power plants is characterized by nu-
2
merous ups and downs. While around 600 MW were added an-
0 nually from 2009 to 2011, the annual additional capacity was
Wind Onshore Wind Onshore Wind Onshore Wind Offshore Wind Offshore Wind Offshore
1800 FLH
in h/a
2500 FLH
in h/a
3200 FLH
in h/a
3200 FLH
in h/a
3850 FLH
in h/a
4500 FLH
in h/a
only about 240 MW in the following two years. In 2016, the
Figure 9: LCOE of wind power by location and full load hours in 2018.
total installed capacity of biogas power plants in Germany was
more than 4200 MW (Fachverband Biogas 2017). Despite the
well as the need to bridge the greater depth of the sea. Loca- expansion of biogas plants in Germany, observations show no
tions with less FLH (3200 h) show a LCOE between 10.33 and reduction in specific investment costs in recent years. Indeed,
13.79 €Cents/kWh. This puts offshore wind turbines above the the specific investment costs of installations even increased bet-
cost of electricity for onshore wind turbines under almost all ween 2005 and 2009 (Stenull et al., 2011). Therefore, no LR for
conditions (and locations). The advantage of offshore installa- biogas plants is assumed. In this study, heat offtake is not taken
tions is the higher number of FLH, as well as lower noise pol- into account, in order to preserve the basis for comparison with
lution and increased public acceptance, if minimum levels for the LCOE of other technologies. A heat credit is therefore not
the distance to the coast and environmental protection requi- taken into account in the LCOE.
rements are met. However, network connectivity problems still
delay current offshore projects. These technology-specific risks Figure 11 shows the LCOE of large biogas power plants
lead to higher capital costs as well as well as demand for finan- (>500 kWel) for different FLH. Furthermore, the specific in-
cial security from creditors, which results in higher WACC for vestments between 2000 and 4000 EUR/kW are included in
offshore projects compared to onshore wind parks. the calculations. Biogas power plants with high FLH and lo-
wer specific investment costs evidence a LCOE of at least
The margin for cost reductions in offshore wind power is limi- 10.14 €Cents/kWh. The LCOE of biogas plants with low FLH
ted by the large expenditures for installation and maintenance. and high specific investments will be significantly higher
Therefore, achieving parity with onshore wind power seems and can reach up to 14.74 €Cents/kWh. The largest determi-
quite difficult at the moment. However, the past years have nant of the electricity production costs of biogas plants are
shown that project costs tend to decrease faster than expected the substrate costs, but FLH also have a major impact on the
with the realization of numerous projects. The sensitivity analy- LCOE. The LCOE will drop by more than 0.75 €Cents/kWh, if
sis for onshore wind power identifies savings in power plant in- FLH are increased by 20%. In comparison, the LCOE drops by
Version: March 2018 Version: March 2018
130 16
Levelized cost of electricity [€cent2018/kWh]
15
120
Variation from reference [%]
14
110 13
12
100
11
90 10
9
80
80 90 100 110 120 8
Parameter variance [%] Biogas - 5000 Biogas - 6000 Biogas - 7000
FLH in h/a FLH in h/a FLH in h/a
Investment WACC O&M Lifetime Full load hours
Figure 10: Sensitivity analysis of onshore wind power 2500 FLH, Figure 11: LCOE of biogas power plants at different FLH in 2018.
specific investment of 1800 EUR/kW.
18You can also read