Repowering of old wind turbines in India - GIZ
←
→
Page content transcription
If your browser does not render page correctly, please read the page content below
Repowering of old wind
  turbines in India

Study by:   Supported by:

Imprint
Commissioned by:
Indo-German Energy Forum Support Office
c/o Deutsche Gesellschaft für Internationale Zusammenarbeit (GIZ) GmbH
1st Floor, B-5/2, Safdarjung Enclave
New Delhi 110 029, India
Email: info@energyforum.in
Website: www.energyforum.in
Tel.: +91 11 4949 5353

Project Lead: Mr.Balwant Joshi

Principal Investigator: Mr. Krishnajith M U

Project Team:
Mr. Balwant Joshi (Idam)
Mr. Krishnajith M U (Idam)
Mr. Anny Mary (Idam)
Mr. Sujoy Das (Idam)
Mr. Markus Wypior (GIZ)
Mr. Anil Kumar Bellary (GIZ)
Ms. Sandra Soares da Silva (KfW)

Acknowledgement:
KreditanstaltfürWiederaufbau(KfW)
National Institute of Wind Energy (NIWE)
Indian Wind Energy Association (InWEA)
Indian Wind Turbine Manufacturers Association (IWTMA)
Gujarat Electricity Regulatory Commission (GERC)
Maharashtra Electricity Regulatory Commission (MERC)
Karnataka Electricity Regulatory Commission (KERC)
Madhya Pradesh Electricity Regulatory Commission (MPERC)
The Rajasthan Electricity Regulatory Commission (RERC)
The Tamil Nadu Electricity Regulatory Commission (TNERC)
Gujarat Energy Development Agency (GEDA)
Karnataka Renewable Energy Development Ltd (KREDL)
Maharashtra Energy Development Agency(MEDA)
The Tamil Nadu Energy Development Agency (TEDA)
Rajasthan Renewable Energy Corporation Limited (RRECL)
Indian Renewable Energy Development Agency (IREDA)
Export-Import Bank(Exim)
Power Finance Corporation (PFC)
Indian Wind Power Association (IWPA)

Study by:
Idam Infrastructure Advisory Pvt. Ltd
Regd. Off: 801, 8th Floor, Crystal Plaza
158, C.S.T. Road, Kalina
Mumbai 400 098, India
Email: contact@idaminfra.com
Website: www.idaminfra.com

Version: New-Delhi, September 2018

All rights reserved. Any use is subject to consent by Indo-German Energy Forum Support Office (IGEF-SO) as
well as Idam Infrastructure Advisory Pvt. Ltd. All content has been prepared with the greatest possible care and
is provided in good faith. No guarantee regarding the currency, accuracy and completeness of the information is
provided. IGEF-SO & IDAM accept no liability for damages of a tangible or intangible nature caused directly or
indirectly by the use of or failure to use the information provided, unless it can be proven to have acted with
intent or gross negligence.
02
03

Key Findings

    In India more than 10 GW of old wind turbines with less than 1 MW capacity are installed in very
1   wind rich class 1 sites. 2,5 GW with less than 500 KW turbine capacity are presently installed in
    India.

    Repowering these relatively old wind turbines with modern turbines promises to more than
2   quadruple the energy generation on these sites.

    Capacity Utilisation Factor (CUF) of old wind plants with less than 500 KW even in wind rich
3   class 1 sites is in the range of 10-14%, while in these wind rich sites the effective CUF can be at
    least 25%.

    Business models for successful implementation of repowering projects in India have been
4   developed. A promising one is covered in this report.

    Lack of implementation due multiple reasons, but especially due to constraints, not

5   incentivising sufficiently to bring very fragmented, existing individual wind mill owners
    together.
04 Table of Contents Foreword 02 Key Findings 03 Table of Contents 04 List of Figures 05 List of tables 06 Executive summary 07 1. Introduction 08 1.1 Objective of the study 09 1.2 Key Components of the Study 10 1.3 Potential benefits and issues associated with repowering projects 10 2. Market potential assessment for repowering 13 2.1 Wind Power Development in India 13 2.2 Methodology for market potential Assessment for Repowering 14 2.3 Market potential in India (Focus on Tamil Nadu, Gujarat) 16 3. Stakeholder consultation and key Learnings 21 3.1 Analysis of response of the questionnaire 21 3.2 Summary of Stakeholder Consultation Process 28 3.3 Key Learnings And Feedback from Stakeholder Consultation 29 4. International case studies 31 4.1 Germany 31 4.2 Denmark 37 4.3 Spain 39 4.4 Netherlands 40 4.5 Experience in India so far 41 4.6 Major learning from international case studies 41 4.7 Learning from Indian experience 41 4.8 Policy and Regulatory Provisions for repowering in India 42 5. Challenges for Repowering in India 45 5.1 Key issues for repowering 45 5.2 Recommendations on key issues 46 6. Development of Business Model 48 6.1 Essential features of business model 48 6.2 Important Features of Business Model 49 6.3 Role of various major stakeholders 50 6.4 Process Chart-Repowering Project 51 6.5 Financial Incentives for Repowering 53 6.6 Key scenarios 55 7. Recommendations: Government Intervention FOR repowering 57 8. Conclusion 59 Bibliography 60 Annexure I: Note on Issues Related to Captive Power From the Perspective of Repowering 61 Annexure II: Draft Guidelines and Framework for Wind Repowering 66 Annexure III: Analysis of Sample reference project in Gujarat 72
05 Repowering of old wind turbines in India
List of Figures
Figure 1 : Cumulative Wind Installed Capacity (MW) 08
Figure 2 : Wind Turbine Generator (WTG) Installation Trend 09
Figure 3 : Benefits of Repowering 10
Figure 4 : WTG Capacity Wise Classification (From 1989-90 to 2016-2017) 13
Figure 5 : All India WTG Wise Installed Capacity as on 31 March 2017 14
Figure 6 : Repowering Potential in Wind Rich States 16
Figure 7 : Repowering Potential of Wind Rich Sites in Tamil Nadu (in MW) 17
Figure 8 : WTG Capacity Wise Installation in Tamil Nadu Since 2002 18
Figure 9 : Repowering Potential of Few Wind Rich Sites in Gujarat 19
Figure 10 : Repowering Potential of Gujarat 20
Figure 11 : Questionnaire 21
Figure 12 : Eligibility Criteria for Turbine Size and Balance Life 22
Figure 13 : Eligibility Criteria for Windfarm Size 22
Figure 14 : Eligibility Criteria for Offtake Arrangement 23
Figure 15 : Technical Parameters to Support Repowering 23
Figure 16 : Key Technical Issues 24
Figure 17 : Ownership Issues of Windfarm 24
Figure 18 : Land Ownership Issues 25
Figure 19 : Commercial Issues Related to PPA 26
Figure 20 : How the Developer should be compensated 26
Figure 21: Procurement of Power at Higher Tariff 26
Figure 22 : Capacity Yield Factor and Energy Yield Factor 27
Figure 23 : Policy Incentives for Repowering 27
Figure 24 : Other Policy Support 28
Figure 25 : Regulatory Initiatives for Repowering 28
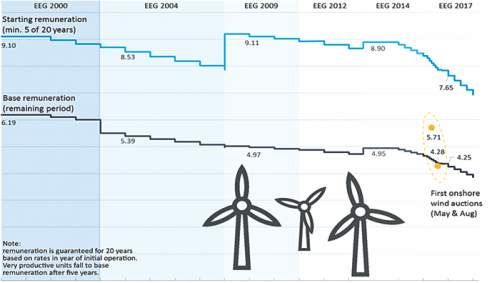
Figure 26 : Remuneration Rates of German Onshore Wind Power From FY 2000 to FY 2018 33
Figure 27 : Annual Installed and Cumulative Capacity (MW) in Germany Including Repowering and
Dismantling 35
Figure 28 : Annual Installed, Dismantled and Cumulative Capacity of Repowering Projects 35
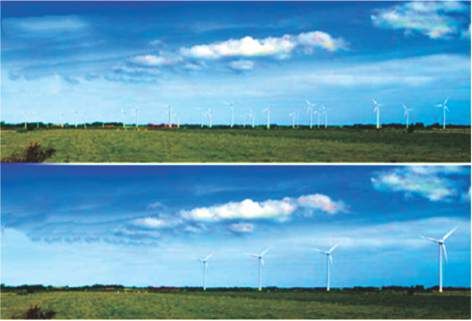
Figure 29 : Illustration of Repowering in Germany 36
Figure 30 : Illustration of Energy Production and Installed Capacity 36
Figure 31 : Repowering Growth Trend in Germany (MW) 37
Figure 32 : Cumulative Wind Power Capacity (MW) From FY 2008 to FY 2017 38
Figure 33 : Cumulative Wind Power Capacity (MW) in Spain from FY 2007 to FY 2017 39
Figure 34 : Cumulative Wind Power Capacity (MW) in Netherlands From FY 2007 to FY 2017 40
Figure 35 : Repowering Business Model 48
Figure 36 : Implementation Framework and Stages for the Proposed Business Model 50
Figure 37 : Repowering Process Chart 52
Figure 38 : Interventions Required From Various Agencies 5806 List of tables Table 1 : State-Wise Repowering Potential (Capacity
07      Repowering of old wind turbines in India                                                                             11

     Executive Summary
     As wind power generation facilities age through the years of operations, toward the end of their useful lives,
     project owners are faced with plant end-of-life decisions. This report is intended to inform policymakers, wind
     power project developers, investors, funding institutions and other stakeholders within the wind industry
     regarding the technological options, business opportunities and challenges associated with such plant end-of-
     life decisions, in particular, repowering. This report extensively deals with several local site-specific issues that
     are the potential roadblocks for repowering in India. India has witnessed aggressive growth in harnessing wind
     energy for nearly two decades. Development of wind power projects started way back in mid-1990's. These wind
     power projects are located at the wind resource rich sites, with turbines of very low capacity, less than 500
     kilowatt (kW) and with a hub height of not more than 25 to30 meters. The research carried out for this study
     reveals that such projects currently have an average capacity utilisation factor (CUF) of only10% to 14% even
     though these sites have very good wind resource. It canbe understood that, had those sites been available for
     modern wind turbines to be installed, the effective CUF would have been at least 25%.

     Under such circumstances, and amidst a conducive environment for accelerated growth of renewable energy,
     the Government of India has announced an ambitious target of 160 gigawatt (GW) of wind and solar energy
     installations by 2022. The plan embarks upon wind energy deployment of 60 GW by 2022. To achieve such an
     ambitious target; depending on greenfield projects, especially in windy sites with average wind resource profile,
     may not yield the desired outcome. Hence, to increase the wind energy portfolio and to ensure energy security
     in the long run, repowering of old wind power projects appearto be the most effective tool to harness massive
     potential of wind energy.

     This report also aims to develop understanding of the repowering framework in Germany, Denmark, Spain and
     Netherlands whose success in repowering of wind energy is commendable. Various issues acting as a bottleneck
     and various interventions influencing the growth of repowering projects have been studied in detail. Based on
     the daunting issues for repowering, long-term sustainability of projects and other relevant assumptions, a
     holistic business model has been proposed. The study addresses the concerns of various stakeholders who are
     likely to be involved in the implementation of the proposed business model with clear definition of their roles
     and responsibilities. Success of the proposed business model would also, to a large extent, depend on the
     Government support at various levels – an aspect that has been covered in this report. Policy support in the
     form of financial incentives, as well as solutions to potential regulatory and contractual hurdles, would be
     necessary if an accelerated deployment of repowering and investment in this business segment is to be created.
08
1. Introduction
India has a cumulative renewable energy installed capacity of 69,022 megawatt (MW) as on 31 March 2018. Out
of the total installed RE capacity, 34,046 MW is contributed by wind energy that accounts for 49.32% of the total
renewable energy generation capacity. Although the total potential of wind energy is more, the country can
harness only a part of it due to many reasons — a solution to some is repowering. The major areas with wind
energy installations are concentrated in the western and southern parts of the country, mainly due to the
coastal location that brings in wind and conducive policies of the respective states. Over the years, the States of
Gujarat, Rajasthan, Maharashtra, Madhya Pradesh, Tamil Nadu, Andhra Pradesh and Karnataka have witnessed
significant investment in the sector. The cumulative deployment of wind energy systems over the years is
shown in Figure 1.
Figure 1 Cumulative Wind Installed Capacity (MW)
40,000
34,046
35,000
32,280
30,000
Installed Capacity (MW)
26,916
25,000 23,444
CAGR 21.18%
20,226
20,000 19,072
17,350
15,000 14,157
11,807
10,242
10,000 8,757
7,094
5,352
5,000 3,636
1,909 2,524
03 04 05 06 07 08 09 10 11 12 13 14 15 16 17 18
02- 03- 04- 05- 06- 07- 08- 09- 10- 11- 12- 13- 14- 15- 16- 17-
20 20 20 20 20 20 20 20 20 20 20 20 20 20 20 20
Years
Source: MNRE Annual Reports
In India, wind power development commenced with the installation and demonstration of the first wind turbine
generator unit, with a unit size of 55 kW. Installation of wind turbines of different class and unit sizes ranging
from 90 kW to 225 kW quickly followed. With an increase in the participation of wind market in 1990s, wind
turbines of 225 kW to 500 kW unit size was the preferred choice. In contrast, today, the most popular wind
turbine unit size in India ranges from 1 MW to 3 MW. The hub height of wind turbines, which was initially 26
metres(m)has increased to about 80m to 100m today. The standard commercially available wind turbine size
which was 150 kW 15 years ago and 500 kW 10 years ago, has now moved up to 2,000 to 3,000 kW.
The evolution of wind turbines since the last two decades is depicted in Figure 2.09 Repowering of old wind turbines in India
Figure 2 Wind Turbine Generator (WTG) Installation Trend
6,000
5,000
WTG Raiting (KW)
4,000 Multi MW WTG
500 kW to 1 MW WTG
< 500 kW WTG
3,000
2,000
1,000
0
92 993 994 995 996 997 998 999 000 001 002 003 004 005 006 007 008 009 010 011 012 013 014 015 016 017
19 1 1 1 1 1 1 1 2 2 2 2 2 2 2 2 2 2 2 2 2 2 2 2 2 2
Years
Source: Idam Infra Analysis and Indian WindPower Directory,2017
The old wind turbines below 500 kW range is still in operation in many states such as Tamil Nadu, Gujarat,
Madhya Pradesh and Maharashtra. Studies reveal that about 10% of the total wind installations in India have
less than 500 kW rating totalling around 3,500 MW. It would also be worthwhile to note that most of these
turbines have been installed at Class I wind sites with high wind power potential. This shows that a significant
potential for repowering exists in India.
To harness the available wind resource at these wind rich sites, repowering activities must be adopted on a
priority basis, which could be a viable option for the investors and would vastly increase the total renewable
energy generation capacity of India.
1.1 Objective Of The Study
In India, the National Institute of Wind Energy or NIWE (erstwhile C-WET) estimated the total potential of
installed capacity of wind energy at 100meter hub height to be302 GW. The objectives are framed based on the
target of Indian Government of deploying 60 GW of wind energy by 2022. The primary objective is to lay a
guideline for the optimum utilization of Class I wind resource rich sites by repowering the old wind turbines.
The broad objectives of this study are mentioned below:
I. Overview of the wind energy sector in India.
II. Identifying the potential benefits and challenges associated with wind repowering.
III. Overview of international experience in repowering with focus on Germany, Denmark, Spain and
Netherlands.
IV. Overview and identification of major factors that influence the decision of repowering by project
developers and the correlation between various factors
V. Detailed overview of the financial requirements of repowering and identification of suitable business
model for all the parties involved.
VI. Detailed overview of the policy and regulatory interventions required.
VII. Detailed overview and identification of total repowering market potential in India.
VIII. Knowledge sharing through stakeholder consultations.10
1.2 Key Components Of The Study
The study is divided into following four modules to provide focused attention to each key component of the
work.
● Market Study for Re-Powering
● Evaluation of Business Model and Selection
● Development of Implementation Roadmap for Selected Model
● Development of Draft Guidelines for Repowering
1.3 Potential Benefits And Issues Associated With Repowering Projects
The old wind turbines, especially those nearing the completion of their life, suffer from several operational,
technical and financial problems such as the following:
● Poor control mechanism
● Grid integration control
● Poor regulation
● Reactive power control
However, there is a better alternative to addressthe sub-optimal utilization of Class I wind potential sites in the
country. This process involves replacement of small WTGs with modern and more efficient WTGs of higher
capacity. This process is called repowering of old wind power projects.
According to a research performed by Grontmij, in 'Replacement of Existing Wind Turbines, 2000', repowering
can be done in any of the following ways:
● One-to-one replacement
● Two-to-one replacement
● Clustering into farm
● One-to-one up scaling of wind farm
Each of these alternatives has its own advantages and disadvantages. Alternative 1 has the largest electricity
production potential and alternative 4, the lowest. For each alternative, there is a positive impact on the
landscape, the best one being alternative 3,i.e., clustering into wind farm model.
In this study, clustering into wind farm model is envisaged, wherein,the multiple solitary wind turbines at
different locations of a wind farm are replaced with higher capacity state of the art, but fewer in number WTGs
to develop a wind farm. This model is very apt in the Indian context as the potential sites are filled up with
turbines with very low capacity, which can be replaced by newer and higher capacity turbines.
1.3.1 Potential Benefits Of Repowering
Repowering of wind farms offer several benefits as depicted in Figure 3.
Figure 3 Benefits of Repowering
OPERATIONAL ENVIRONMENTAL
TECHNICAL FINANCIAL
BENEFITS11 Repowering of old wind turbines in India
Technical
i. Efficient utilisation of potential wind sites producing higher quantum of energy.
ii. Improved CUF at given wind farm site.
iii. Higher efficiency.
Operational
i. Reduced operation and maintenance (O&M) costs.
ii. Modern wind turbines/farms offer better integration with grid.
iii. Better management of grid parameters and provision of higher operational flexibility for the system
operators
Environmental
i. Reduced impact on movement of birds.
ii. Reduced noise pollution
Financial
I. Achieve better wind power economics.
ii. Reduction in land area per MW of wind farm.
iii. Additional energy generation can yield higher profits including more Renewable Energy Certificate (REC)
offerings.
iv. Clean Development Mechanism (CDM) benefits.
Owing to the reduced number of turbines, chances of collision or affecting the movement of birds (migratory or
otherwise) is minimal. Moreover, the modern turbines generate less noise pollution due to higher design
sophistication and better technology.
1.3.2 Driving Factors To Influence Repowering Installations
● For independent wind power producers (IPPs)/wind power generating companies trying to scale-up their
wind portfolios and achieve critical mass rapidly, there has been a preference for turbines of larger size.
This due to the power potential of a wind turbine determined by the square of the rotor diameter - a large
turbine, delivering more power than two separate turbines of half the size.
● In addition, for offshore markets to minimize the installation cost per MW, a significant proportion of the
cost of foundation (the largest possible capacity) is installed on each foundation unit.
From the Government perspective, following are the reasons to promote repowering:
● The additional generation will create a larger base for wind energy, thereby increasing the renewable
energy portfolio of the country.
· ● Although the repowered wind turbines are taller in height, quality of the landscape is often perceived as
being’ improved, since the number of turbines is reduced in the changed scenario.
1.3.3 Key Implementation Issues And Challenges
Several challenges exist in the implementation of repowering program on a large scale. Majority of these
challenges are technical, administrative and contractual in nature. However, a conducive policy regime and a
structured business model can help address the concerns of all stakeholders and pave way for the adoption of
repowering in many states. The challenges in early adoption of repowering are as below:
I. Turbine Ownership:
Repowering will reduce the number of installed turbines and there may not be any replacement of turbines.
The number of owners may be more than the number of installed turbines. Hence, the issue of turbine
ownership is important.12 ii. Land Ownership: Multiple owners of the same wind farm land may create complications for initiating repowering projects. iii. Power Purchase Agreement (PPA): The procurer may be not be interested to modify/revise a PPA signed with the state utility for 10, 20 years or more, before its expiry, as the new tariff would be higher than the one at which the original PPA was signed. iv. Electricity Evacuation Facilities: The current grid facilities that are designed to support the generation capacities may require augmentation and upgradation. v. Additional Costs: Additional decommissioning cost for old turbines needs to be assessed. Although, these costs can be covered to a large extent by the mere scrap value of old turbines. vi. Disposal of Old Turbines: Old turbines can be disposed either by scrapping or buy-back by the government or the manufacturer, or by exporting to other countries. The old turbines cannot be installed in any other location within the country. vii. Lack of Incentives: One of the primary barriers to repowering is the general lack of economic incentive to initiate the project. viii. Policy Package: Unavailability of a proper policy framework encouraging repowering project. Considering India's power requirement, percentage of RPO of various Indian states and the target set by the Government, repowering would be an ideal option. This will also encourage the wind power market in the country to fully utilise the wind resources at many good wind rich sites.
13      Repowering of old wind turbines in India

     2. Market Potential
        Assessment For
        Repowering
     2.1 Wind Power Development In India
     India has witnessed substantial growth in wind energy capacity addition over the last decade. The growth
     momentum has spread across major wind rich states such as Gujarat, Maharashtra, Madhya Pradesh,
     Tamil Nadu, Rajasthan, Andhra Pradesh and Karnataka. However, it is observed that there were significant
     installations prior to 2002 involving wind turbine generators with capacity less than 1 MW. The first WTG was
     commissioned in the late 80s with a turbine capacity size of just 55 kW, and thereafter the WTG size started
     increasing. Till date, around 19,503 WTGs of below 1 MW capacity is installed in various parts of the country
     with a cumulative capacity of more than 10,578 MW. It is pertinent to note that, these WTGs are installed in the
     best wind sites of the country highlighting a bare fact that these sites are not optimally utilized. Distribution of
     WTGs of capacity less than 1 MW is depicted in Figure 4.

       Figure 4                 WTG Capacity Wise Classification (From 1989-90 to 2016-2017)

                                                                                                  5,740 MW
                                                  1,585 MW
                               7,000                                                               6,807
                                                     6,608

                               6,000

                               5,000
                                                                                      2,354 MW
                  NO. of WTG

                               4,000                                                     3,663

                               3,000

                               2,000                           460 MW
                                                                 1,325      403 MW
                               1,000   36 MW                                  847
                                         243
14
to 2.1 MW,Vestas Wind up to 2.1 MW, GE India up to 2.33 MW, Regen up to 2.8 MW, Acciona up to 3.0 MW, etc.
Installation of new turbines of higher capacity results in the overall increase of capacity by 2 to 3 times.
Based on the WTG capacity, the development of wind energy in various states is illustrated in Figure 5. The
figure depicts a significant quantum of installation of WTGs of capacity below 500 kW. Besides, the maximum
potential for repowering of such projects with turbine size below 500 kW exists in Tamil Nadu, Maharashtra and
Gujarat with an installed capacity of 1,744 MW, 302 MW and 202 MW respectively.
Figure 5 All India WTG Wise Installed Capacity as on 31 March 2017
8,000
7,000
Installed Capacity (MW)
6,000
5,000
4,000
3,000
2,000
1,000
TN GJ MH RJ KK AP MP TG KE
>2,000 KW 321 1,106 538 989 230 1,467 238 101 8
1,501 - 2,000 KW 925 1,329 931 948 1,425 1,479 1,320 - 16
1,001 - 1,500 KW 2,445 1,255 1,877 1,023 795 194 604 - -
501 - 1,000 KW 2,375 1,475 1,000 1,287 1,312 301 311 - 3415 Repowering of old wind turbines in India
Table 1 State-Wise Repowering Potential (Capacity16
Figure 6 Repowering Potential in Wind Rich States
Repowering Capacity (MW)
3,979
1,261
834 857 1,034 929
154 401 202 209
14 67 21 86 0 34
TN GJ RJ MH KK MP AP KE
Repowering in this FY 2017 (MW) 834 154 14 401 67 21 86 0
Next 10 years ( 2017 - 2027) (MW) 3,979 1,261 857 1,034 929 202 209 34
Source: Idam Infra Analysis
2.3 Market Potential In India (focus On Tamil Nadu, Gujarat)
As illustrated in Figure 6, the major potential for repowering is in Tamil Nadu and Gujarat. Hence, these two
states have been selected for further study and analysis of site-based potential.
2.3.1. Tamil Nadu
Tamil Nadu has the highest installed capacity of wind energy in India. The installed wind energy
capacity of the state is 8,197.08 MW as on 31 March 2018. This accounts for 24.01% of the country's
total installed wind energy capacity. The state has some of the India's best wind resource rich sites
that include Muppandal, Tirunelveli, Kethanur, Poolavadi, Gomangalam etc. The wind resource
rich sites have a wind power density ranging more than 200-250 W per sq.mt.
Analysis of wind resource rich sites with the highest repowering potential is depicted in Figure 7.17 Repowering of old wind turbines in India
Figure 7 Repowering Potential of Wind Rich Sites in Tamil Nadu (in MW)
300
279.2
250
227
Installed Capacity (MW)
200 193
149.5
150
118 113 110
103 95.5
100 94
87.6
76
50
0
Muppandal Poolavadi Kethanur Perungudi
Wind Rich Sites in Tamil Nadu
Total installed capacity Capacity with WTG18
Figure 8 WTG Capacity Wise Installation in Tamil Nadu Since 2002
14,000
12,000 + +
+ +
+ +
+
10,000
+
Installed Capacity in MW
+
8,000
+
+
+
6,000
+
4,000
+
+
+
2,000
-
2002 2003 2004 2005 2006 2007 2008 2009 2010 2011 2012 2013 2014 2015 2016 2017
> 2000 - - - - - - - - 15 43 94 96 107 117 134 157
>1500 and 1000 and 500 and19 Repowering of old wind turbines in India
Analysis of few wind rich sites with highest repowering potential is shown in Figure 9.
Figure 9 Repowering Potential of Few Wind Rich Sites in Gujarat
90 82
77
80
Installed Capacity (MW)
70
60
50 42
40 40 40
38
40
76 27
30
21
20 13 13 13
10
-
Dhaank Lamba Navadra Mervadar
Wind Rich Sites in Gujarat
Total installed capacity Capacity with WTG20
Figure 10 Repowering Potential of Gujarat
WTG capacity wise installation since 2000
5,000 +
4,000 +
+
Total number of WTGs
+
+
+
3,000
+
+
2,000 +
+
+
1,000
+ + +
+ +
-
2002 2003 2004 2005 2006 2007 2008 2009 2010 2011 2012 2013 2014 2015 2016 2017
> 2000 - - - - - - 1 1 9 13 107 147 197 219 261 534
>1500 and 1000 and 500 and21 Repowering of old wind turbines in India
3. Stakeholder
Consultation and Key
Learnings
The purpose of stakeholder consultation was to highlight the key issues influencing repowering decisions and
provide possible solutions, recommend policy requirements, highlight techno-commercial needs with total
market potential for repowering of old wind turbines in India. A theme-based questionnaire was created and
circulated amongst the various stakeholders to receive feedback and suggestions on various issues that may
impact the future of repowering projects. The questionnaire was based on the themes mentioned in Figure 11.
Figure 11 Questionnaire
Eligibility Criteria Policy and
Technical Commercial Investment
and Regulatory
Key Considerations Issues Issues Issues
Interventions
To gather different perspective(s) of various stakeholders associated with repowering, a consultation process
through structured interview was planned.
Questionnaire was circulated to the following stakeholder groups as under:
● State Nodal Agencies: GEDA (Gujarat), KREDL (Karnataka), MEDA (Maharashtra), TEDA (Tamil Nadu)
and RRECL (Rajasthan).
· ● State Utilities: Gujarat, Maharashtra, Karnataka, Rajasthan, Tamil Nadu and Tata Power.
· ● State Electricity Regulatory Commissions: GERC (Gujarat), MERC (Maharashtra), KERC (Karnataka),
MPERC (Madhya Pradesh), RERC (Rajasthan) and TNERC (Tamil Nadu).
· ● Wind Industry Associations: IWPA, InWEA, IWTMA and WIPPA.
· ● Wind developers/IPPs.
· ● WTG manufacturers
The purpose of the questionnaire was to identify the major impediments, catalysing factors and eligibility
criteria for repowering projects. The analysis of the responses is shown in the following sections.
3.1 Analysis Of Response Of The Questionnaire
The responses were classified into four segments, namely, eligibility criteria, technical aspects, commercial
aspects, and policy and regulatory interventions required. The subsequent paragraphs deal with each of these
aspects.22
3.1.1 Eligibility Criteria
The decision of repowering is based on several factors. The questionnaire included questions on
appropriate turbine size, balance life of project, wind farm size, connectivity requirements etc. In
many cases, there are operational projects where the installed per WTG capacity size is less than
500 kW but have completed an operational life of only five to seven years in some other cases, the
WTGs are installed, each of capacity size 1 MW or above with a completed life of more than 10 years
Such scenarios extensively persist in the wind industry in India. Hence, a conscious call regarding
the eligibility of wind projects for repowering should be taken at an expert level. The eligibility
should consider factors such as old and lesser capacity size turbines, completed project life,
number of turbines in a windfarm etc.
The responses sought in this regard have been analysed and presented in Figure 12. The
stakeholder responses are shown in percentage terms.
Figure 12 Eligibility Criteria for Turbine Size and Balance Life
Appropriate Turbine Size Balance Useful Life
60% 50%
50% 40%
40%
30%
30%
20%
20%
10% 10%
0% 0%23 Repowering of old wind turbines in India
In addition, any repowering initiative in a multi owner windfarm would require a holistic business
model that would suffice the requirement of all owners such a comprehensive case can be a
precedence to develop appropriate Policies and Regulations. The most pertinent aspect of
repowering is represented in Figure 14.
Figure 14 Eligibility Criteria for Offtake Arrangement
Connectivity Requirement Offtake Arrangement
50% 60%
40% 50%
40%
30%
30%
20%
20%
10% 10%
0% 0%
11 KV and 33 KV 66 KV 132 KV Others Sale to Third party Captive use All above Others
The above figure shows that many stakeholders suggested that WTGs must be connected to at least
33 kilovolt (kV) transmission line for evacuation. It is evident that most of the old wind power
projects in both Gujarat and Tamil Nadu are connected to 11 kV that poses a serious technical
problem for evacuation of higher capacities upon repowering. As repowered projects would have a
significant higher energy generation, it would require 66 kV interconnection to the substation. The
Green Energy Corridor project in India needs to incorporate repowering potential sites as major
generation centres and design the evacuation infrastructure accordingly. Besides, the state
transmission companies of wind resource rich states should involve wind power developer's views
for their periodic transmission planning. Without proper transmission infrastructure up-gradation
to evacuate the repowered energy, possible repowering projects will be hindered, thereby
harnessing sub-optimal premium wind resources.
3.1.2 Technical Aspects
Repowering would enhance the generation of electricity from a site. While, a complex blend of
various issues would be a bottleneck for repowering, there are some technical reasons that would
support repowering decision. The responses are presented in Figure 15.
Figure 15 Technical Parameters to Support Repowering
All other options mentioned below
Equipment was at the end of its useful life
Technology was outdated
Increasing net capacity factor
Lowering O&M costs
Increasing total plant rated capacity
0% 5% 10% 15% 20% 25% 30% 35% 40%
Source: Indian Wind Power Directory, 201724
Many technical factors have been cited as factors that influence repowering decisions. The major
factors as cited by stakeholders include increased plant load capacity (PLF), deployment of new
WTG technology and lower (O&M) costs among the others While the supporting factors for
repowering have been identified, the technical issues that pose as challenges for repowering, have
also been identified as outlined in Figure 16.
Figure 16 Key Technical Issues
All the options mentioned below
Upgradation of internal network within wind
Upgradation of existing pooling substation
Adequate infrastructure like approach road
Adequacy of evacuation infrastructure
Adequate wind potential
0% 10% 20% 30% 40% 50% 60% 70% 80% 90% 100%
Source: Indian Wind Power Directory, 2017
The above Figure shows that, more than 90% of the respondents have cited adequacy of evacuation
infrastructure to be single most important technical parameter and a prerequisite for repowering
projects. While a significant number of respondents have opined the feasibility upgrade to the
nearest pooling substation as a key decision parameter.
3.1.3 Commercial Aspects
Commercial issues are complex and entails dealing with multiple stakeholders such as the
windfarm owners of a single windfarm, suppliers and O&M agencies, parties of PPA like utilities.
Since repowering of old wind turbines may replace multiple smaller capacity turbines by few
higher capacity turbines, multiple commercial issues should be addressed. Few such relevant
issues were framed in the questionnaire and presented for expert stakeholder suggestions. The
responses are compiled graphically in Figure 17.
Figure 17 Ownership Issues of Windfarm
Whether share of wind installed capacity of a owner in the wind farm In case, any WTG owner is unwilling to go for repowering of its
can be a criteria for sharing the initial capital and others costs for turbines in the wind farm, should the WTG owner be compensated
repowering as well as the revenue after repowering the wind farm? in some way for the wake losses caused by repowered turbines that
are installed at higher hub heights
100%
80%
80%
60%
60%
40% 40%
20% 20%
0% 0%
yes no yes no25 Repowering of old wind turbines in India
In a scenario where fewer number of low capacity WTGs are decommissioned to accommodate a
modern WTG of higher capacity, 80% stakeholders suggested that, share of wind installed capacity
of an owner in a windfarm can be a criterion to share the initial capital cost, while the revenue
earned from the project shall be shared in the ratio of equity investment in the project. In a
scenario where an owner is not willing to go for repowering, nearly 80% of the stakeholders reveal,
such parties should be compensated for their land.
There are several land ownership models across various states. Windfarm land is owned by
multiple owners in a farm either on project plot basis or footprint basis. Further, there are issues
associated with Right of Way, access/approach road and lease of land. One major commercial issue
in repowering is the necessity for modification of the old PPAs. Any repowering initiative would
mean additional investment for the desired additional generation. This would increase the per unit
generation cost. Since the utilities are already in a secured PPA with developers with still few years
of plant life remaining, the utilities would be sceptical to such an initiative as they are procuring
power at a much cheaper rate through the existing PPAs.
Whereas, in the repowered scenario, developer would recover the additional generation cost
through a higher tariff. Under such circumstances, opinions were sought from an expert about the
possible solutions regarding commercial issues.
Figure 18 Land Ownership Issues
what are the modifications in land ownership/lease What kind of commercial arrangements are followed for land
agreements required in the following cases to enable allocation for multiple WTG owners in a wind farm?
repowering of the wind farm:
60%
80% 50%
70%
40%
60%
50% 30%
40%
30% 20%
20%
10%
10%
0% 0%
Land sub leased Acquisition Acquisition of If any other, Land sub leased Acquisition Acquisition of All the above
by land owner of land by land by WTG please elaborate by land owner of land by land by WTG
to multiple WTG WTG owner owner on to multiple WTG WTG owner owner on
owner on plot basis footprint basis owner on plot basis footprint basis
The study reveals that there are varied responses regarding the commercial impediments of
repowering. Many respondents opined that though modification of the existing PPA would be a major
hurdle, the modification of tariff would be a major challenge. It is well understood that not only the
additional cost of per unit generation must be reflected in the modified tariff, but also the increased
cost cannot be imposed on the utilities. It must be adjusted either through the government subsidy
route for limited time till the completion of the early PPA, or through some new market mechanism.
Regarding the aspect of whether the developer should be compensated or not, as discussed in the
above paragraph, most of the stakeholders have opined that developers should be compensated either
through additional feed-in tariff (FiT) or through capital subsidy in the form of Accelerated
Depreciation(AD) or Generation Based Incentive (GBI). The responses are compiled as shown in
Figures 19 and 20 respectively.26
Figure 19 Commercial Issues Related to PPA
Considering utilities and the WTG owners/project developers are already engaged in a
secured PPA, what are the commercial impediments for repowering?
40%
30%
20%
10%
0%
Modification Additional Modification to Regulatory Treatment Lack of
to tariff investments term/tenure of approvals during Transition appropriate
required PPA or Offtake period compensation
agreement
Figure 20 How the Developer should be compensated
In case Utility demands to be supplied at old PPA rate after repowering, how can the developer
be compensated for increased cost incurred for repowering of wind farm?
40%
30%
20%
10%
0%
Additional FIT Govt. subsidy Additional RECs Combination of both
like GBI/AD (or REC multiplier)
In consultation with the response of stakeholders, it is observed that majority has opined that
higher tariff approved by the Commission would be a way of making the utilities procure power at
the current tariff that is higher than the tariff in the old PPAs. Alternatively, the RPO compliance
mechanism can be strengthened to compel the utilities either to buy repowered power or to buy the
required REC(s).
Figure 21 Procurement of Power at Higher Tariff
In the present scenario, under which of the following conditions you think, utility would agree to
procure the repowered power at higher tariff?
50%
40%
30%
20%
10%
0%
Utility is power deficit Utility falls short of All the above
RPO target27 Repowering of old wind turbines in India
Figure 22 Capacity Yield Factor and Energy Yield Factor
While Energy Yield Factor for repowering project would While Capacity Yield Factor for repowering project would
vary from site to site, what are the expectations of the vary from site to site, what are the expectations of the
Wind Power developer in respect of minimum Energy Wind Power Developer in respect of the minimum
Yield Factor out of a repowering project? Capacity Yield Factor out of a repowering project?
60% 90%
80%
50%
70%
40% 60%
50%
30%
40%
20% 30%
20%
10%
10%
0% 0%
EYF should be 2 EYF should be 2.5 EYF should be 3 CYF should be 1.5 CYF should be 2
While it is understood that both capacity yield factor and energy yield factor parameters are site
dependent and would vary from case to case basis for repowered sites, under ideal scenario, around
50% responses said the energy yield factor should be 2. While more than 80% of responses
suggested capacity yield factor should be 2.
3.1.4 Policy And Regulatory Interventions
It is understood that any repowering initiative would not only increase the electricity generation by
2 to 3 times, it will also make the appearance of the landscape better. Moreover, repowering would
help to fetch the aspirational target of the Government of India having 60GW of wind energy by
2022. However, to promote the repowering projects by the developers, certain policy incentives are
envisaged. While most of the stakeholders believe that the GBI per unit of energy generation would
be the best instrument, some stakeholders believe that AD or capital subsidy would be the best way
to incentivize the investors Policy incentives for repowering is represented in Figure 23.
Figure 23 Policy Incentives for Repowering
In what way should the current policy incentives be altered to that could be offered for
promotion of repowering projects specifically?
60%
40%
20%
0%
GBI Accelerated Capital subsidy Others, tax benefits
depreciation
Apart from the conventional forms of incentives for the promotion of wind energy, other
promotional features such as concessional debt funding support are also envisaged. As shown in
Figure 24, around 75% of the stakeholders have opined for low cost interest funding to be
incorporated in the policy framework. Such low-cost funding can be entrusted with organizations
such as Indian Renewable Energy Development Agency (IREDA), Export-Import (Exim) Bank,
Power Finance Corporation (PFC), etc.28
Figure 24 Other Policy Support
Whether concessional debt funding support is required for What is the preferred nature of support?
repowering?
100%
90%
80% 80%
70% 70%
60% 60%
50% 50%
40% 40%
30% 30%
20% 20%
10% 10%
0% 0%
yes no Loan with Loan with longer Low Cost
longer moratorium and interest
tenure deferred funding
repayment
structure
While policy parameters can catalyse repowering initiatives, the congenial regulatory framework
would drive the scheme forward by providing long-term certainty to the investors for the sale-to-
distribution company (DISCOM) model, investors would look at a higher tariff to make the
repowering projects financially viable. Some other features offered by the Regulators are shown
graphically in Figure 25.
Figure 25 Regulatory Initiatives for Repowering
What are the Regulatory incentives that could be offered for promotion of repowering projects?
Allow amendment/extension of existing PPAs with
utilities with effect of repowering
Higher number of REGs per unit generated from
repowered projects
1 unit purchase from repowered projects could be
considered as 2 units or (appropriate multiples) for
RPO compliance
Specific RPO for purchase from repowered projects
Additional FIT
0% 5% 10% 15% 20% 25% 30% 35%
The above Figure demonstrates that stakeholders have favoured the amendment of existing PPAs
and provision of additional FiTs as the most coveted measure for repowering initiatives toward
implementation.
3.2 Summary Of Stakeholder Consultation Process
Consultation with the members of wind energy associations and officials of state renewable energy
development agencies provided useful insights as well as raised several issues that may hinder the repowering
of old wind projects in India. The key driving factors for repowering as stated by various stakeholders are
summarized below:29 Repowering of old wind turbines in India
● WTGs having capacity less than 300 kW and have completed a life of 20 years are most suitable for
repowering.
● Upgradation of existing evacuation infrastructure is cited as one of the most critical factors to undertake
repowering projects. WTGs must be connected to at least 33 kV or preferably 66 kV lines for proper
evacuation.
● Share of the installed capacity of an owner in a windfarm can be a criterion for sharing the capital
investments as well the revenues after repowering the windfarm in the ratio of equity investments.
● Modification of the existing PPAs with generators and utilities for the revision of tariff may not be
acceptable to the utilities because of the poor financial condition of the latter.
● The Government may provide appropriate subsidy(ies) in the form of GBI or additional FiT etc. for the
developers
● The state regulatory commission should form or strengthen RPO compliance mechanisms for the
obligated entities.
● A conducive model policy may be issued by MNRE which in turn may be adapted by the states in their
policy instrument for addressing the above issues.
3.3 Key Learnings And Feedback From Stakeholder Consultation
Key learnings and feedback received through stakeholder consultation process on the key issues influencing the
development of repowering business has been summarized in Table 3.
Table 3 Key Learnings and Feedback From Stake holders
Issue Key Challenges by Respondents Suggestions
• Issues regarding ownership of • A suitable business model must be evolved
windfarm with multiple wind turbine where interest of all parties is taken care of
Ownership owners in given wind farm
• Formation of Special Purpose Vehicle (SPV)
• All parties'/WTG owners may not be with equity participation from the concerned
keen on repowering parties with sharing of revenues in proportion
to equity interest could be a solution
• Most of the old wind projects are • The evacuation infrastructure must be
connected to 11 kV line (particularly in upgraded to 66 kV systems
Evacuation TN) posing a major hurdle for any
• In some cases, upgradation of the pooling
repowering initiative
substation may be required
• Multiple ownership of land for a given • Lease of land or right to use land on footprint
wind farm poses another challenge for basis in favor of SPV could be explored to
Land repowering projects address the requirement in case of multiple
landowners
• Optimal micro-siting for repowered
site requires unhindered access,
planning and flexibility on the site
• Retaining earlier power offtake • Multiple options available for power
arrangements (sale to DISCOM or offtake,viz., a) sale to DISCOM, b) captive model,
Power offtake captive) and identifying off-takers of c) sale to any third party by open access route
arrangement extra power generation post and combination to be allowed
repowering
• Existing off-take to be protected at least for
residual life period
• Existing tariff is too low as the PPAs • FiT for wind should prevail.However, to continue
Tariff and signed for over 20 years have a the tariff of old PPAs, the developer would
incentives perpetual nature with no termination require a certain incentive over and above FiT
clause30
Issue Key Challenges by Respondents Suggestions
• Current tariffs are unviable for • In case of captive power plants, attractive
Tariff and repowering projects wheeling and banking provision must be
incentives
brought in
• Utility is in a secured PPA with the • Utility off-take would be as per the old PPA rates
developer at a much lower cost to continue thebalance tenure of existing PPA
Utility • Utility would not allow break away to • New PPA shall cover the new FiT for additional
enable repowering generation through repowering31 Repowering of old wind turbines in India
4. International
Case Studies
Globally, the Government policy initiative is one of the main driving factors behind the rapid growth of
renewable energy. In this chapter, the policy support and incentive structures that propelled repowering
business in the European market have been analysed. It is observed that Germany, Denmark, Spain,
Netherlands and United Kingdom (UK) have remained pioneers of onshore wind energy installations across
Europe. However, in the repowering business, Germany and Denmark have been the most progressive in the
world. Hence, it is vital to understand the kind of policy support and regulatory interventions required to
promote repowering in the country. For this, a country-specific study was undertaken for Germany, Denmark,
Spain and Netherlands to analyse the requirement of key driving factors in the Indian context. Key learnings
were captured subsequently.
Europe has traditionally remained one of the largest markets for wind power development in the world. Even
with China, India and North America moving up the ladder in wind energy deployment, Europe would still hold
about 32% share of the global wind energy installed capacity.
Back in 2010, China became the world's largest wind energy producer and the boom is continuing unabated,
especially fuelled by the government support and ambitious renewable energy targets. In 2018, although China
and USA are the two biggest wind power generating nations, Germany is the largest annual market for wind
power in Europe with a cumulative installed capacity of 57.4 GW. While the market distribution changes
annually, the industry is moving towards European Union's target of supplying 20% of Europe's electricity by
the end of 2020. In Europe, 16.8 GW of new wind power was added during 2017, bringing the total installed
capacity to 168.7 GW, and generated about 336 TWh of electricity accounted for about 18% of the Europe's
electricity consumption.
4.1 Germany
Germany is the first European Union country with the largest wind installed capacity, followed by Spain, UK,
France and Italy. Nearly, 50% of the current wind power capacity in Germany was installed after 2000. The
Renewable Energy Sources Act (Erneuerbare-Energien-Gesetz [EEG]) was a key enabler for the wind capacity
addition achieved by Germany.
Below listed are the various implications of EEGon repowering from 2000 to 2017:
● EEG 2000: The EEG Lawcomplied with the EU criteria by setting time limits on compensation,
establishing cost-oriented rates, differentiating according to energy source, plant size and location,
introducing a degressive structure and insisting on regular reviews. The Law, however, was silent on any
incentives for repowering.
● EEG 2004:Amendment to the Renewable Energy Sources Act (EEG) in 2004 offered an additional
financial incentive to repower wind projects installed before 1995. Before 2004, German FiTs provided
some encouragement for wind repowering, by offering new wind projects and higher FiTs than existing
projects in operation. Since 2004, FiTs offered longer and higher income for wind turbines thereby
replacing/restructuring the existing projects built before December 1995 and were at least three times
the capacity of the older turbines. The repowering incentives (RI) offered by the EEG had no effect since
the spacing requirements and the height limits made it impossible to achieve the required tripling of
installed nominal capacity.32
● EEG 2009:FiT for onshore wind farms was increased from EUR 8.03 to EUR 9.2 cents/kilowatt-hour
(kWh) for the first five years of operation, and EUR cents 5.02/kWh thereafter. This tariff will be
decreased annually for new installations by 1%, as opposed to the previous 2%.Similarly, the law would
increase the repowering incentive to support the replacement of old turbines by the new ones. The initial
remuneration would be increased by EUR 0.5 cent/kWh. The replaced turbines must be in the same
administrative district and be at least 10 years old. The new turbine must have at least twice, but no more
than five times the original turbines capacity.
● EEG 2012:The EEG amendments 2012 retained the incentives on repowering projects. FiT for onshore
wind projects remained at 8.93 cents/kWh for the initial five years and the base tariff as 4.87 cents/kWh
for the rest of the project life. This FiT was subjected to an annual digression of 1.5%. An incentive of 0.5
cets/kWh, as mentioned earlier, was retained in the amendment. However, the law stated the incentive
amount shall be reduced by 0.01 cents/kWh annually. There were certain conditions laid out for the
applicability of incentives as mentioned below:
● The repowered capacity must be atleast twice the earlier capacity.
● The onshore plants must be commissioned prior to 2002.
● EEG 2014: The revised version of the EEG 2014 gave additional impetus to the repowering of older wind
turbines as the financial incentive meant for repowering was granted only for projects which could be
completed until the end of the year. Therefore, in 2014 a last chance was offered to the operators of older
wind turbines to use the repowering incentive by dismantling an old wind turbine and installing a new
one in the same region. With the EEG revision in force since August 2014, repowering has acquired
another significance for the future development of German wind energy market. Since the EEG 2014
came into effect, the Federal Network Agency (Bundesnetzagentur) established a register of installations
for all new renewable energy plants commissioned and decommissioned. The obligation to report is a
prerequisite for claiming the EEG remuneration, and therefore since August 2014 a clearly improved
database for repowering became available.
● EEG 2017:The reform introduced public tender procedures for wind, solar and biomass projects in
country's efforts to shift from FiT support renewable energy deployment to market orientated price
finding mechanism. With that, projects will no longer be eligible for statutory FiT remuneration; but,
will have to bid for it in public auction organised and monitored by the Federal Network Agency
(BNetzA). Successful projects will receive contracts for 20 years based on the sale of electricity produced
at the bid price quoted during the auction process. Repowering incentive continued to be abolished in
this Law as well.
The compilation of the FiTs with digression rates and repowering incentive over the period from EEG 2000 to
EEG 2017is depicted in Table 4.33 Repowering of old wind turbines in India
Table 4 Onshore Wind FiTand Repowering Incentive Rates (Value in € Cents/kWh)
Repowering
Amendments Particulars Initial FiT Base FiT Degression
Incentive
New Wind Project 9.10 6.2 NA 1.50%
EEG 2000
Repowering Project 9.10 6.2 NA 1.50%
New Wind Project 8.7 5.5 NA 2%
EEG 2004
Repowering Project 8.7 5.5 0.5 2%
New Wind Project 9.2 5.02 NA 1%
EEG 2009
Repowering Project 9.2 5.02 0.5 1%
New Wind Project 8.93 4.87 NA 1.50%
EEG 2012
Repowering Project 8.93 4.87 0.5 1.50%
New Wind Project 8.9 4.95 NA NA
EEG 2014
Repowering Project 8.9 4.95 Abolished NA
New Wind Project - - NA NA
EEG 2017
Repowering Project - - Abolished NA
The remuneration rates of German onshore winds from FY 2000 to FY 2018 is represented in Figure 26.
Figure 26 Remuneration Rates of German Onshore Wind Power From FY 2000 to FY 2018
10
9
8
7
6
in € ct/kWh
5
4
3
2
1
0
00 001 002 003 004 005 006 007 008 009 010 011 012 013 014 015 016 017 018 019
20 2 2 2 2 2 2 2 2 2 2 2 2 2 2 2 2 2 2 2
Source: Windmonitor Fraunhofer IWES, 2017
More sites for wind energy deployment are being developed in middle and southern Germany. This has created a
market for newer turbines based on the modern technologies, which can optimally utilise the sites with lower
wind speeds. Apart from the new installations, Germany has also witness degressive repowering activities
replacing the first-generation turbines of 300 kW or lower capacities by the latest ones that could be as big as 2
MW.34
Improved energy generation in modern turbines has made it economically viable to replace older turbines after
an average run-time of 10 years. According to BWE, presently, 41% of the installed capacity in Germany will be
completing 15 years by 2020 and the same would be considered as repowering potential by then. Apprehensions
for the abolition of RI through EEG amendment, 2014 can be attributed as the main reason for significant higher
repowering installations in 2014.
The EEG amendment that commenced on 01 August2014,mandatedthe formation of a Central Turbine Registry
to capture the additions of wind energy turbines, repowering and dismantling data in detail. In 2017, 315 old
Table 5 Cumulative WTG InstallationsIncluding Repowering of Turbines Till 2017
Status of Land-Based Wind Energy Development Capacity (MW) Number of WTG
Gross addition during FY 2017 5,333.53 1,792
Repowering share (not binding) 951.77 315
Development
2017 Dismantling in 2017
(incl. subsequent registration) (not 467.27 387
binding)
Net addition during 2017 4,866.26 1,405
Cumulative
31 December Cumulative WTG portfolio
Status: 31 December 2017 (not binding) 50,776.93 28,675
2017
Source: BWE
WTGs with installed capacity of 467 MW were identified for repowering. The same was replaced by 315 new
WTGs having total installed capacity of 952 MW. The net addition in 2017 came to 4,866 MW. Therefore, by the
end of 2017, the cumulative WTG portfolio increased to 28,675 WTG with a cumulative capacity of 50,777 MW.
This equates to an increase of the cumulative capacity of 11% compared to the preceding year.
Onshore wind energy in Germany has recorded a huge expansion in the transition phase of the new tendering
system. According to the German Wind Energy Association (BWE), a total of 2,281 MW (gross) was newly
installed in the first half of 2017 thus equating to 790 wind power plants. Expansion in the first half of 2017 is
therefore 11% higher than the level reached in the same period of the previous year.35 Repowering of old wind turbines in India
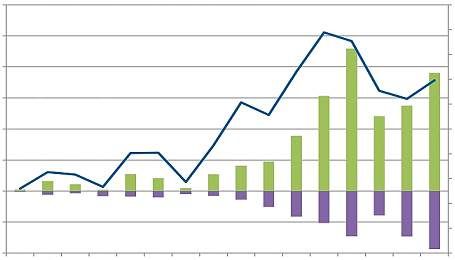
Figure 27 Annual Installed and Cumulative Capacity (MW) in Germany Including Repowering and Dismantling
5,500 55,000
Annual Added / Dismantled Capacity [MW]
Cumulative Capacity (Repowering)
5,000 5,0000
Cumulative Capacity (New Project)
4,500 45,000
Annual Installed Capacity (Repowering)
4,000 40,000
Cumulative Capacity [MW]
Annual Installed Capacity (New Project)
3,500 35,000
Annual Dismantled Capacity
3,000 30,000
2,500 25,000
2,000 20,000
1,500 15,000
1,000 10,000
500 5,000
0 0
-500 -5,000
92 993 994 995 996 997 998 999 000 001 002 003 004 005 006 007 008 009 010 011 012 013 014 015 016 017
19 1 1 1 1 1 1 1 2 2 2 2 2 2 2 2 2 2 2 2 2 2 2 2 2 2
Source: BWE
The identified annual newly-added repowering capacity, the dismantled capacity, as well as the share of the
capacity of repowering turbines in the annual gross additions over time is illustrated in Figure 28. The
repowering capacity notably declined following the cancellation of the repowering incentive with the EEG 2014,
increased in 2017 and reached its second highest value since 2014.
Figure 28 Annual Installed, Dismantled and Cumulative Capacity of Repowering Projects
30% 1,500
Framework of Repowering Projects [MW]
Dismantling and Capacity Addition in the
Cumulative Capacity (Repowering) 1,300
25%
Share of Repowering Capacity from
Cumulative Capacity (New Project)
1,100
Annual Capacity Addition [%]
20% Annual Installed Capacity (Repowering)
900
Annual Installed Capacity (New Project)
15%
Annual Dismantled Capacity
700
10% 500
300
5%
100
0
-100
-5%
-300
-10% -500
02 03 04 05 06 07 08 09 10 11 12 13 14 15 16 17
20 20 20 20 20 20 20 20 20 20 20 20 20 20 20 20
Source: BWE
The below image depicts an example of repowering in Germany where 20 turbines of 200 kW were replaced
with seven turbines of 2 MW. It was observed that the investment was tripled, but the annual energy production
increased fourfold.You can also read