METHANOL AS A MARINE FUEL - Methanol Institute
←
→
Page content transcription
If your browser does not render page correctly, please read the page content below
Supported by
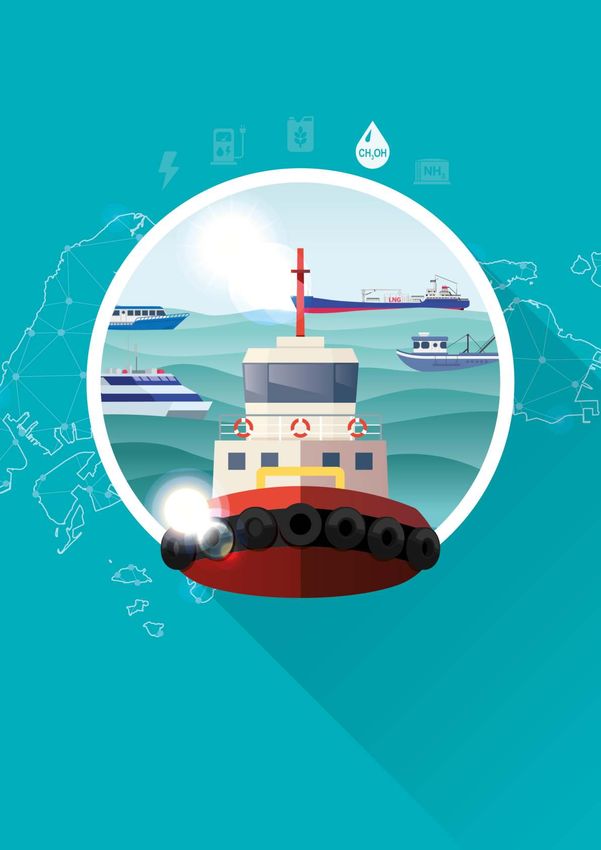
METHANOL
AS A MARINE FUEL
– Availability and Sea Trial Considerations
Maritime Energy and Sustainable Development (MESD) Centre of ExcellenceMethanol as a Marine Fuel
– Availability and Sea Trial Considerations
This study is conducted by the Maritime Energy & Sustainable Development (MESD) Centre of Excellence
in collaboration with Methanol Institute, Dongguan Transmission & Fuel Injection Technologies Co., Ltd,
and China Classification Society (CCS). This study has received research funding from the Singapore
Maritime Institute (SMI).
Launched in October 2017, Maritime Energy & Sustainable Development (MESD) Centre of Excellence
is jointly funded by Singapore Maritime Institute (SMI) and Nanyang Technological University (NTU). As
the first maritime research centre supported by SMI, MESD is set up to deepen Singapore’s maritime
R&D capability and Maritime Singapore’s position as a global maritime knowledge and innovation hub to
support Singapore’s strategic maritime needs. With the focus on future port and shipping applications,
MESD CoE aims to develop innovative and sustainable solutions by working closely with all the key
stakeholders within the maritime cluster.
Published in January 2021
Principal Investigator: Main Author: Co-author: Contributor:
Dr Liu Ming Dr Liu Ming Mr Li Chen Associate Professor Mr Koh Eng Kiong
Lam Siu Lee Jasmine Ms Yang Mengyao
Dr Sze Jia Yin Ms Gou Xueni
External Advisor: Industry Collaborator:
Dr Sanjay Chittarajan Kuttan, Singapore Maritime Institute Methanol Institute
Mr Bernard Wong, PSA Marine (Pte) Ltd Dongguan Transmission & Fuel Injection
Ms Haniza Bte Mustaffa, Singapore Shipping Association Technologies Co., Ltd
Mr Chris Chatterton, Methanol Institute China Classification Society (CCS)
Mr Kieu Kim Sen, York Launch Service Pte Ltd
With inputs from Maritime and Port Authority of Singapore
You may also refer to these reports published by MESD:
Alternative Fuels for A Study on the Future Energy Electrification of Singapore
International Shipping Options of Singapore Harbour Harbour Craft – Shore and Vessel
Published in April 2020 Craft Power System Considerations
Published in November 2020 Published in November 2020
© Nanyang Technological University, 2021
This report and its contents are protected by copyright and other intellectual property rights. The copyright of the contents and
materials, except for any third party information available in this report, is owned by the University. No parts of this publication
may be reproduced or distributed in any form or by any means or stored in any retrieval system of any nature, without prior written
consent of Nanyang Technological University.
The information provided in the report is for general informational purposes only. We have made every attempt to ensure the
accuracy and reliability of information provided in this report. However, the information is provided “as is” without warranty of any
kind. We do not accept any responsibility or liability for the accuracy, content, completeness, legality, or reliability of the information
contained in the report.Executive Summary
The report is prepared under the collaboration between Nanyang Technological University (NTU),
Methanol Institute (MI), Dongguan Transmission & Fuel Injection Technologies Co., Ltd. (FIT) and China
Classification Society (CCS). This evaluation study is premised upon several high-level considerations:
the availability of methanol from a global perspective; the provisions provided by marine authorities; and
the experience from early adopters/pilots using methanol fuel for marine vessels.
Methanol has drawn much attention as a marine fuel due to its potential in GHG emission reduction,
ease of handling, operational safety and engine compatibility. Methanol production from fossil feedstock
(natural gas and coal) has reached a global scale that makes it a chemical commodity with established
storage and distribution infrastructure.
Used as fuel, methanol produced from fossil feedstock emits more life cycle GHG than direct burning
of fossil fuel. It is, therefore, necessary to use low carbon feedstock such as biomass and renewable
energies. Using global exergy flow as the basis, the authors identify several potential pathways, which
are dependent on energy from solar PV, wind, and biomass. Furthermore, a hypothetical analysis of plant
productivity reveals that plant biomass has enough potential to meet the entire marine energy demand
in the next few decades. In Southeast Asia where biomass feedstock is abundant, a methanol pathway
from this feedstock can be more favourable. The study also highlights that future unlimited methanol
production relies on direct carbon capture from the air, with hydrogen generated from wind energy or
solar PV. However, this technology has a high production cost and capital investment.
The study identifies bunker tankers as an early adopter using methanol powered system on board, taking
into consideration of several regulatory provisions, which include IGF code, CCC (Carriage of Cargoes and
Containers) guidelines, and references from chemical cargo handling guidelines. The recommendation is
also based on case studies of the two pioneering installations: Green Pilot and Stena Germanica.
The study also presents a general observation on methanol engine retrofit. Several concepts have been
implemented, such as changing ignition mechanism, adding combustion improver and using pilot fuel
injection. All these approaches address the less than satisfactory ignition property of methanol.
The study prescribes the recommendations and considerations when preparing for a sea trial. A sea
trial checklist is proposed and needs to be prepared in advance as per the vessel’s specification and
operating profile. These listed pre-trial tests and requirements will need approval from a recognised
marine classification society.
Methanol as a Marine Fuel – Availability and Sea Trial Considerations 1Table of Contents
Executive Summary 1
List of Figures 3
List of Tables 3
List of Abbreviations 4
1. Introduction of Methanol as a Fuel 5
1.1 General Properties of Methanol 5
1.2 Life Cycle GHG Emission 6
1.3 Methanol Fuelled Ships 7
2. Methanol Fuel Production and Supply 9
2.1 Global Production and Consumption 9
2.2 Global Potential of Renewable Energy Supply 9
2.3 Feedstock for Methanol Production 11
2.3.1 Fossil Feedstock 11
2.3.2 Biomass Feedstock 11
2.3.3 Non-bio Renewable Feedstock 13
2.4 Economics of Methanol Production from Biomass and Renewables 13
2.5 Other Alternative Biomass Conversion Routes 15
2.5.1 Bioethanol 15
2.5.2 Biogas 15
2.5.3 Comparative Analysis with Other Energy Conversion Routes 16
2.6 Methanol Production Plants Using Renewables 16
2.7 Future Methanol Production 18
3. Methanol Fuel Guidelines 20
3.1 IGF Code and CCC 20
3.2 Methanol as Chemical Cargo 22
3.3 Additional References 22
4. Methanol as an Alternative Marine Fuel 23
4.1 Observations from Green Pilot Project and Stena Germanica 23
4.1.1 Methanol Fuel and Engine 23
4.1.2 Green Pilot Project 23
4.1.3 Stena Germanica 24
4.1.4 Summary 24
4.2 Harbour Craft Adoption 24
4.2.1 Engine Makers 25
4.2.2 Operating Profile 25
4.2.3 Considerations for Singapore Harbour Craft 26
4.3 Recommendation on Methanol Installation 26
4.4 Considerations for Sea Trial 27
5. Conclusion 29
References 30
2 Maritime Energy and Sustainable Development (MESD) Centre of ExcellenceList of Figures
Figure 2.1 The major methanol end-users in fuels applications 10
Figure 2.2 Global exergy flux, reservoirs and destruction 10
Figure 2.3 Renewable methanol production pathways 13
Figure 2.4 Comparison of power yield from various renewable sources 18
Figure 2.5 Flow diagram of the FARWIND energy system 19
List of Tables
Table 1.1 Comparison of fuel emission factors 5
Table 1.2 Comparison of well-to-propeller GHG emissions of fuels 6
Table 1.3 Methanol powered ocean-going ships 8
Table 1.4 Other completed, ongoing and upcoming methanol projects 8
Table 2.1 World energy demand summary (Mtoe, in 2018) 10
Table 2.2 Global installed capacity of solar PV, solar thermal, wind and hydroelectric 10
Table 2.3 Commercial and emerging plant species with high biomass productivity 11
Table 2.4 Comparison of biomethanol production cost from various techno-economic studies 14
Table 2.5 Overview of investment cost for (bio-) methanol facilities 14
Table 2.6 Energy yield of biomass conversion routes 16
Table 2.7 Current bio and renewable methanol production projects and facilities 17
Table 2.8 Examples of methanol projects from wind energy 19
Table 3.1 Summary of methanol fuel-related codes and guidelines for marine use 21
Table 4.1 Singapore harbour craft prefixes 24
Table 4.2 Engine makers’ development in alternative fuel and emission reduction 25
Table 4.3 Example of engine types of harbour craft 26
Methanol as a Marine Fuel – Availability and Sea Trial Considerations 3List of Abbreviations
B20 A blend of 20% biodiesel and 80% IMDG International Maritime Dangerous
petroleum diesel Goods
B30 A blend of 30% biodiesel and 70% IMO International Maritime
petroleum diesel Organization
B100 Pure biodiesel without petroleum IMSBC International Maritime Solid Bulk
diesel blend Code Cargoes Code
CCC Carriage of Cargoes and LEL Lower Explosion Limit
Containers LHV Lower Heating Value
CCS China Classification Society LH2 Liquid Hydrogen
CCU Carbon Capture and Utilization LNG Liquefied Natural Gas
CI Compression Ignition LPG Liquefied Petroleum Gas
CNG Compressed Natural Gas LSHFO Low Sulphur Heavy Fuel Oil
COPT Core Oil Palm Trunk LUC Land Use Change
CO2 Carbon Dioxide MDO Marine Diesel Oil
CRI Carbon Recycling International MESD Maritime Energy and Sustainable
DAC Direct Air Capture Development Centre of Excellence
DF Dual Fuel MGO Marine Gas Oil
DME Dimethyl Ether MI Methanol Institute
ECU Engine Control Unit MPA Maritime and Port Authority of
EFB Empty Fruit Bunches Singapore
EGR Exhaust Gas Recirculation MSC Maritime Safety Committee
ESD Emergency Shut Down MTBE Methyl Tertiary Butyl Ether
EU European Union MTO Methanol To Olefin
FAME Fatty Acid Methyl Esters NOx Nitrogen Oxides
FID Final Investment Decision NTU Nanyang Technological University
FIT Fuel Injection Technologies OPEFB Oil Palm Empty Fruit Branch
GHG Greenhouse Gas OPF Oil Palm Fronds
GPP Gross Primary Productivity PM Particulate Matter
GWP Global Warming Potential POX Partial Oxidation
HAZID Hazard Identification PV Photovoltaic
HFO Heavy Fuel Oil SCR Selective Catalytic Reduction
HVO Hydrotreated Vegetable Oil SDS Safety Data Sheet
H2 Hydrogen SFOC Specific Fuel Oil Consumption
ICE Internal Combustion Engine SI Spark Ignition
IGC International Code for the SOLAS International Convention for the
Code Construction and Equipment of Safety of Life at Sea
Ships Carrying Liquefied Gases in SOx Sulphur Oxides
Bulk SVO Straight Vegetable Oil
IGF International Code of Safety for TRL Technology Readiness Level
Code Ship Using Gases or Other Low-
Flash Fuels
4 Maritime Energy and Sustainable Development (MESD) Centre of Excellence1 Introduction of Methanol as a Fuel
This study to evaluate the potential use of methanol as a marine fuel is a result from the collaboration
between Nanyang Technological University (NTU), Methanol Institute (MI), Dongguan Transmission
& Fuel Injection Technologies Co., Ltd. (FIT) and China Classification Society (CCS). The study
provides a high-level understanding of the availability of methanol as a marine fuel, and the critical
considerations before a sea trial is conducted.
1.1 General Properties of Methanol
Methanol (CH3OH) is the simplest form of alcohol. It is a light, volatile, colourless, flammable
liquid with a distinctive odour at room temperature and pressure. Methanol has been used
widely as a chemical for various industrial and domestic applications. Recently, methanol
is increasingly being considered an alternative fuel to reduce greenhouse gases and
pollutants’ emission [1].
Methanol burns with only water and carbon dioxide as by-products when combustion is
complete. Methanol is an oxygen-rich fuel that combusts in an ICE (Internal Combustion
Engine) emitting no sulphur oxides (SOx), a negligible amount of particulate matter (PM) and
nitrogen oxides (NOx). The emission factor of methanol is listed in table 1.1, as a comparison
to conventional marine fuels and several other alternative fuels.
There is no global warming potential from methanol slip because it degrades rapidly in air
and groundwater as a result of a photochemical reaction or bacterial digestion. The chronic
toxicity due to occupational contact of methanol is very low. It has been reported that skin
contact with high concentrations of methanol has been effectively cured with the proper
treatment using ethanol [6].
Fuel Energy Calorific SFOC Operational Fuel Emission Factor (g/kWh)
Convertor Valueb
TRLa
MJ/kg g/kWh CO2 CH4 N2 O SOx NOx PM
LSHFO 9 40.5 179 541 0.01 0.027 3.23 15.8 0.72
MDO 9 42.6 170 524 0.01 0.026 0.32 14.8 0.16
LNG 9 48.6 150 412 3 0.016 0.003 1.17 0.027
LH2 3~4 120 57 0 0 0 0 0 0
Methanol 8~9 20 381 522 0 0 0 3.05 0
c
Ammonia 6 18.9 381 0 0 N.A. 0 N.A. 0
SVO Soy 7~8 37.5 195 - 0.0064 0.013 0.37 17.1 0.19
Biodiesel Soy 9 37.8 187 - 0.0061 0.013 0.36 17.9 0.18
HVO 9 44.1[3] 164 d
- - - - - -
Table 1.1 Comparison of fuel emission factors [2]
a
Technology Readiness Level
b
Lower heating value
c
Calculated value [3]
d
Calculated from lower heating value
Methanol as a Marine Fuel – Availability and Sea Trial Considerations 5It is worth mentioning that the incomplete combustion of methanol produces formaldehyde
- a carcinogenic pollutant. The formaldehyde formation is caused by the presence of the
engine’s internal crevices, cold spots, and fuel leakages. However, in high-pressure diesel
cycle engines, the formaldehyde emission is of lesser concern. There is no fuel slip and all
the methanol is burned at high temperatures (1,300 degree Celsius) which does not favour
the formation of formaldehyde [4].
1.2 Life Cycle GHG Emission
When produced from renewable resources, methanol offers the potential to reduce the
overall greenhouse gas and pollutants emission associated with its lifecycle. In biomass
rich Southeast Asia, there is an abundant supply of renewable feedstock such as the waste
streams from agricultural industry or forestry residuals. These are considered the future low
carbon sources for methanol production.
In order to carry out a GHG emission life cycle assessment, MESD narrowed down the
feedstock to the methanol production pathway to oil palm fronds (OPF), a by-product from
oil palm plantation. As a comparison, a biogas conversion pathway is used, starting from the
empty fruit bunches (EFB) as the feedstock. The LCA results (table 1.2) shows that the GHG
emission of methanol produced from OPF is lower than that of fossil methanol, biogas from
EFB and biodiesel from the same plantation.
Fuels CO2-eq CO2-eq (g/kWh) Engine Remarks
Reference
(g/MJ) Efficiency (%)a
Well-to- Tank-to- Well-to-
Tank Propeller Propeller
LNG 18.5 488 ~ 630 ~ 47 (Otto SI) Well-to-tank refers to gas well to [5]
(fossil) 549 691 (155.8 g/kW h)b LNG bunker barge
LNG 55.4 107 531 EFB fermentation, and the [6]
(biogas) waste residual returns to land as
fertiliser
Biodiesel 10.29 4.1 84.6 46 (Diesel [13]) From palm oil, FAME as the end [7]
(184.7 g/kW h) product, without considering LUC
(Land Use Change)
52.1 ~ 4.1 412 ~ With LUC (11 ~ 42 years for [8]
148.8 1,167 carbon payback). CO2-eq
emission is 1,969 to 5,626 kg/
(tonne.year) of biodiesel
Full- N.A. N.A. 736 73% for Does not include the 2nd life of [9]
electric electric power battery
(Singapore transmission
grid) N.A. N.A. 577 Exclude GHG of battery [9]
production
Methanol 27 550 766 45 N.A. [10]
(natural
gas)
Methanol 42.2 0 338 45 Produced from OPF (oil palm [11]
(biomass) fronds) originally used as
fertilisers, electricity is from
Malaysian grid
Table 1.2 Comparison of well-to-propeller GHG emissions of fuels
a
High speed engine except for full-electric option
b
Methane slip and N2O emission is 3g/kWh and 0.016 g/kWh, respectively
6 Maritime Energy and Sustainable Development (MESD) Centre of ExcellenceThe lower LCA GHG emission of methanol (from OPF) can be expected due to the
following reasons.
a. Methanol does not show global warming potential (GWP) from fuel slip, where it can
be a major concern with methane-based fuels (LNG, biogas).
b. A high energy conversion yield from the raw feedstock to methanol is achievable,
making the methanol pathway more energy efficient.
1.3 Methanol Fuelled Ships
Commercial Fleet
By the end of 2019, there were 10 ships running on methanol fuel and two ships being built
(table 1.3). Besides a RoPax ship (Stena Germanica) powered by medium speed 4-stroke
engines, the rest 11 ships are powered by 2-stroke low-speed engines, consuming their
cargo (methanol) as fuel.
Development Projects
There are a number of pilot projects evaluating the various options for the adoption of methanol
as a marine fuel. The development is summarised in table 1.4. Unlike the commercial fleet
cases, a significant portion of these projects start with retrofitting smaller engines, or with the
disruptive concept to enhance GHG reduction.
Methanol as a Marine Fuel – Availability and Sea Trial Considerations 7Vessel Company Vessel Type Ignition Type Engine DWT Remarks
Reference
Name Power (tonne)
(kW)
Mari Couva NYK Oil / Chemical CI, slow speed, 7,180 49,000 New Build [12]
Tanker 2 stroke [13]
Mari IINO Kaiun Oil / Chemical CI, slow speed, 7,180 49,000 New Build [12]
Kokako Kaisha & Tanker 2 stroke [13]
Mitsui
Lindanger Waterfront Oil / Chemical CI, slow speed, 10,320 49,999 New Build [14]
Shipping Tanker 2 stroke [15]
Leikanger Waterfront Oil / Chemical CI, slow speed, 10,320 49,999 New Build [14]
Shipping Tanker 2 stroke [16]
Mari Jone Marinvest Oil / Chemical CI, slow speed, 7,580 49,999 New Build [17]
Tanker 2 stroke
Mari Boyle Marinvest Oil / Chemical CI, slow speed, 7,580 49,999 New Build [17]
Tanker 2 stroke
Taranaki MOL Oil / Chemical CI, slow speed, 8,470 49,994 New Build [18]
Sun Tanker 2 stroke [19]
Manchac MOL Oil / Chemical CI, slow speed, 8,470 49,994 New Build [18]
Sun Tanker 2 stroke [20]
Cajun Sun MOL Oil / Chemical CI, slow speed, 8,470 49,994 New Build [18]
Tanker 2 stroke [21]
N.A. Proman N.A. (built in Dual fuel N.A. 49,900 New Build [22]
Stena Bulk Guangzhou) (12,500 tonnes/year,
fuel consumption)
N.A. Proman N.A. (built in Dual fuel N.A. 49,900 New Build [22]
Stena Bulk Guangzhou) (12,500 tonnes/year,
fuel consumption)
Stena Stena Lines RO-Pax CI, 4 stroke, 23,000 10,670 Retrofit [23]
Germanica medium speed [24]
Table 1.3 Methanol powered ocean-going ships
Project/ Company Vessel Type Engine Type Engine Gross Remarks
Reference
Vessel Power Tonnage
Name (kW)
Pilot 729 SE ScandiNAOS Pilot boat SI, high speed 313 20 Retrofit [25]
(CNG convert)
(CI convert)
Jupiter - Road ferry SI, high speed 1,324 737 Retrofit [26]
Leanship Volvo Penta - High-speed dual - - Retrofit [27]
fuel on methanol
Methaship Caterpillar, Cruise Medium speed - - - [27]
MAN etc. Ropax
Ferry
Green A consortium Total 9 ships - 1,000 ~ 300 Methanol [28]
Marine of 22 including new 12,000 ~23,000 is from
Methanol companies build and (DWT) carbon
retrofit neutral
sources
The - - Hydrogen ICE - - Claims [29]
HyMethShip with methanol 97% CO2
converter and reduction
CCS
Table 1.4 Other completed, ongoing and upcoming methanol projects
8 Maritime Energy and Sustainable Development (MESD) Centre of Excellence2 Methanol Fuel Production and Supply
2.1 Global Production and Consumption
Methanol is either produced from fossil fuels or biomass. Current methanol production from
mega plants around the world is using fossil-based natural gas and coal as their feedstock.
There are over 90 methanol plants with a combined production capacity of around 110 million
tonnes [30]. As of 2016, Methanex was the largest methanol producer in the world, contributing
to 14% of the market share [31]. According to IHS, global methanol demand reached 75 million
metric tonnes in 2015 (24 billion gallons or 91 billion litres), driven in large part by MTO and
emerging energy applications, which has accounted for up to 46% of methanol consumption.
The recent IHS study has revealed the demand growth through the statistics in 2018 [31].
Besides the conventional use for chemical production on formaldehyde (29%) and acetic
acid (9%), the energy-related methanol consumption including direct fuel use (10%), MTBE
(12%), DME (5%) and Biodiesel (4%) accounted for 31% of methanol use, of which the China
market had a dominating share (57%) of the total consumption [31]. The further breakdown
of methanol’s energy use is shown in figure 2.1, in which methanol is either burned directly or
converted into forms that can be “drop-in” fuels for existing internal combustion engines.
Eventually, the availability of methanol fuel is determined by the abundance of feedstock.
Fossil resources (coal and natural gas) will continue to dominate the feedstock supply for
methanol production for a long time. Renewable feedstock such as biomass, captured
carbon dioxide, and renewable hydrogen are expected to have more contribution when life
cycle CO2 emission is concerned.
2.2 Global Potential of Renewable Energy Supply
It is critical to have a top-down understanding of the flow of renewable energies, almost all of
which are originated from solar radiation. The global exergy flux, reservoirs and destruction
map provides an excellent global view (figure 2.2) [32]. Solar energy is abundant; there
are 86,000 TW incident flow onto the lower atmosphere and 48,000 TW onto the surface,
respectively. By natural process alone, there are 90 TW absorbed to feed the planet’s
photosynthesis, 870 TW to blow the wind [34]. In comparison, the global energy demand by
human activity in 2018 was 14,301 Mtoe (table 2.1) or 19 TW year, and the demand by total
shipping was 250 Mtoe or 0.332 TW year [35].
Solar energy needs to be converted into a form of “energy mass” that can act as a renewable
feedstock. Natural photosynthesis is currently the most available and efficient process to
capture carbon and convert it into carbohydrates, an “energy mass”. In contrast, the electricity
and heat from solar energy need to be converted into a form of “energy mass” to carry energy
vectors such as hydrogen. However, this needs a further step using electrolysis. There are
four main solar-derived energies being harnessed: solar PV (photovoltaic), solar thermal,
wind and hydro. Their recent installed capacity is summarised in table 2.2, which is still a
small proportion compared to the total capacity of global electricity generation of 7.72 TW
[36]. Nevertheless, future large-scale renewable methanol production would require abundant
renewable electricity to be readily accessible at a reasonable cost. It is worth noting that the
offshore wind has a cumulative installed capacity of 0.022 TW (22GW) at the end of 2018
[37], and it can serve as a potential to produce green hydrogen, and eventually methanol.
Methanol as a Marine Fuel – Availability and Sea Trial Considerations 9Methanol
Direct Blend Chemical Conversion
Gasoline MTG Process DME MTBE/TAME FAME
Ship Bunker Fuel Gasoline LPG Gasoline Additive Biodiesel
Figure 2.1 The major methanol end-users in fuels applications
Source: Adapted from [32]
34,000 0.06 Wind Energy
Atmospheric
62,500
Extra-Solar Radiation
Reflection
162,000 60 Waves
Solar Radiation Ocean Thermal Gradient
Atmospheric 0 Wind Energy Absorption
Absorption 0
31,000 870 Wind 100 OTEC
0.36 Hydro-electricity
41,000 Evaporation 300 Clouds 7.2 Rivers 5,000
86,000 Surface
90 Clouds 5.4 Rivers Reflection
Surface Incident
Scattering 43,000 Surface Heating
90 Photosynthesis 1.2 Traditional Biomass 0.016 Solar Energy
30 ZJ Plants 0.15 Commercial Biofuels
KEY
0.04 Carbon Burial
Radiation Chemical
3.6 Coal Kinetic Gravitational
270 ZJ Coal
Natural Energy Destruction
5.0 Oil
Energy Accumulation [ZJ] (=1021 J)
110 ZJ Oil
Human Use for Energy Services
200 ZJ 3.2 Gas
Human Use for Energy Services
Methane Hydrate 50 ZJ Gas
Figure 2.2 Global exergy flux, reservoirs and destruction
Source: Adapted from [33]
Coal Oil Gas Nuclear Hydro Biomass Other Total
and Renewables Energy
Waste Demand
Energy Demand 3,778 4,488 3,253 710 364 1,418 289 14,301
Table 2.1 World energy demand summary (Mtoe, in 2018) [38]
Solar PV Solar Thermal Wind Hydro Total Electricity Generation
Capacity (TW) 0.398 0.472 0.600 1.267 7.72
Table 2.2 Global installed capacity of solar PV, solar thermal, wind and hydroelectric [36][39][40]
10 Maritime Energy and Sustainable Development (MESD) Centre of Excellence2.3 Feedstock for Methanol Production
2.3.1 Fossil Feedstock
The methanol production process from fossil resources has been developed for almost a
century. Currently, methanol is produced in large quantity through a two-step catalytic process
that involves: 1) gasification of carbonaceous feedstock into a gas mixture of carbon monoxide
and hydrogen (syngas), and 2) converting the syngas into methanol. Coal and natural gas
are used as the most available fossil feedstock to achieve good overall economics. When
used as a marine fuel, the fossil-derived methanol produces higher life cycle GHG emission
than conventional HFO and MGO [41] do. However, the production of fossil-based methanol
is still increasing, due to the demand from the chemical industry or as the feedstock for MTO
(methanol to olefin) process [42].
2.3.2 Biomass Feedstock
Biomass is an organic carbonaceous material that originates from plant photosynthesis. Out of
the 90 TW exergy flow into photosynthesis globally, only 1.2 TW goes into traditional agricultural
biomass and 0.15 TW into commercial biofuel production [34]. When biomass is used as a
potential carbonaceous feedstock, it is important to know the land productivity of biomass
production and the area of land needed to meet the needs of the maritime industry.
Biomass is produced by plants through photosynthesis. There are two main categories, C3
and C4 plants based on the differences in the carbon compounds assimilated at the beginning
of the photosynthesis. The theoretical maximal photosynthetic energy conversion efficiency
is 4.6% and 6% for C3 and C4 plants, respectively. However, given the fact that plants are
the perennial living organism with self-standing and propagating structure, plant biomass is
still considered one of the best storages of solar energy. From a global perspective, tropical
terrestrial forests, savannahs and grasslands account for 60% of the total terrestrial land
surface metabolism, making them the most productive area of plant biomass [43]. On the
other hand, the productivity of ocean-based plant biomass is significantly less [44].
Biomass: Land Productivity and Potential
Plant species with high energy yield per unit area of land provide more biomass for methanol
production. Numerous research has proposed several high-yielding candidate plants, known
as energy crops. Of particular interests are the energy crops that are more related to or
originates in the tropical regions.
Plant Species Biomass Productivity (tonnes ha-1 year-1) References
Lignocellulose Fatty Acid Tri-Glyceride
Miscanthus 13 ~ 44 (dry) - [45]
Sugar Cane a
79 (wet) , 21.3 (dry) - [46]
Oil Palm 39 ~ 40 (dry) 4~5 [47]
Pongamia - 7 ~ 29 [48]
Creeping River Grassb 80 - [49]
King Grassc 28 ~ 79 - [50]
Table 2.3 Commercial and emerging plant species with high biomass productivity
a
Water content of fresh sugar cane is 73%
b
Echinochloa polystachya
c
Pennisetum americanum ×P.purpureum
Methanol as a Marine Fuel – Availability and Sea Trial Considerations 11Taking the tropical forest as an example, the gross primary productivity (GPP) ranges
between 30 and 40 Mg C ha-1 year-1, which is affected by atmospheric carbon dioxide level
[51]. A study on Indonesian plantation in rain forest reveals that 36.48 to 63.55 (dry weight)
tonnes of biomass can be produced per hectare of land per year [52]. Another study on the
forest of Southeast Asia found that the productivity varies greatly with tree species, Albizia
produces more biomass (18.81 ton ha-1 year-1) than Eucalyptus (11.76 ton ha-1 year-1) [53].
Table 2.3 lists several candidate species with high productivity and adaptability to various
soil and climate conditions. Miscanthus and sugar cane are well-studied grassy crops with
widespread distribution in Southeast Asia. The creeping river grass and king grass are the
most productive crops, being reported to produce 80 tonnes of dry biomass per hectare per
year, close to the theoretical yield of C4 plants. However, the yield may drop to half or lesser
under more realistic conditions due to the limit of water and nutrient supply.
From the energy perspective, there is no distinctive boundary to limit the end-use of a
plant. For example, oil palm is a good producer of both oil (fatty acid triglyceride) as well as
lignocellulose feedstock. Inarguably, oil palm provides the highest yield of oil per hectare per
year compared to the other commercially planted oil-bearing crops. An average yield of 4 to 5
tonnes of crude oil per hectare of land with best fields giving as high as 7 to 8 tonnes of crude
oil per hectare makes oil palm the most efficient oil-bearing crop in the world. In addition to
the high yield of oil, the lignocellulose biomass as a byproduct of palm plantation may well
be considered a future feedstock for methanol production, including OPEFB (oil palm empty
fruit branch) and COPT (core oil palm trunk).
Alternatively, there will be a future scenario that both biodiesel and biomethanol are produced
from the same starting energy crop, making use of the lipid and lignocellulose mass more
effectively. With the progress of agricultural technology and fertiliser production, the World
Bioenergy Association [54] predicts that by 2035 the global biomass potential will reach 150
EJ (or 4.76 TW year), in which 43% and 52% will come from agriculture (including energy
crops) and forest respectively, the remaining 5% is from waste streams. As a result, the
global biomass production’s stored energy will far exceed the consumption from the total
shipping of 0.332 TW year in 2018. However, there is a need to understand how biomass
energy is converted into methanol for marine applications.
Biomass Conversion
Biomass conversion to methanol is one of the many options to obtain sustainable fuels.
When compared to other pathways such as biodiesel, biomethane and bioethanol, the
conversion to methanol is more robust and versatile. The entire biomass feedstock can be
thermally broken down into syngas for methanol production, allowing a wide range of organic
feedstock to be used. The reported conversion efficiencies based on dry biomass varies,
from 40% to 50% in a 100 tonnes/day plant using lignocellulose feedstock [55], 45% to 57%
from wood [56][57][58], and up to 44% from oil palm residuals [59].
An effective way to improve the efficiency is to add hydrogen gas directly into the biomass
gasification step to optimise the reactants (hydrogen to carbon monoxide) ratio. As a result,
a simulated plant integrating woody biomass and water electrolyser can achieve methanol
exergy efficiency of 72%, and a total energy efficiency of 96% when waste heat is utilised
[60]. The improvement also opens up the opportunity to incorporate renewable electron with
biomass to achieve satisfactory methanol output if a dedicated land area is a limiting factor.
12 Maritime Energy and Sustainable Development (MESD) Centre of Excellence2.3.3 Non-bio Renewable Feedstock
The direct capture from the air provides an unlimited supply of carbon dioxide for methanol
production. The pathway is a hydrogenation process of carbon dioxide.
CO2 + 3H2 CH3OH + H2O ∆H = - 49.16 kJ/mol
Water Splitting to H2 Flue
Air
Thermal Gas
Photo-electro
Hydro CCS
Solar Thermal CO2
Solar Energy
Solar PV Electricity Hydrogen Reactor Methanol
Wind
Harvested
Biomass Gasification Syngas
Biomass
Figure 2.3 Renewable methanol production pathways
The concentration of carbon dioxide in the air is very low. Until recently, the recorded level
reached 414.42 ppm from Mauna Loa Observatory, Hawaii [61]. Direct air capture (DAC)
of CO2 by conventional scrubbing process is conducted with high energy input, making the
process expensive at an estimated cost of $100 to 200 for every ton of CO2 captured [62].
Despite the gaps, carbon capture and hydrogenation are promising pathways to produce
methanol offshore, where wind-generated electricity can be more readily available. As a
summary, the overall scheme to convert solar energy into methanol through various main
pathways is given in figure 2.3.
2.4 Economics of Methanol Production from Biomass and Renewables
At present, methanol production from renewable feedstock is more costly than that from
fossil feedstock. Techno-economic analysis has been used to understand the feasibility of
methanol production from biomass and other renewables. In table 2.4, the production cost
of methanol from various biomass and renewable sources is provided. A comparison of the
capital investment is listed in table 2.5. It was found that the price of electricity and biomass
[63], the capital cost of the plant and the production capacity are primary factors that impact
production cost of methanol [64] [65]. Where lignocellulose is the feedstock, several studies
have indicated the cost of methanol to be around $20 per GJ [60] [63] [64] [65] [66] [67].
Methanol produced from carbon capture and hydrogenation was the most expensive at
$33.8 per GJ [60]. When compared with the price of fossil-based methanol that falls within
the range of $16.7 to 23.1 per GJ in 2010, it is challenging to justify the cost of bio and
renewable methanol.
Methanol as a Marine Fuel – Availability and Sea Trial Considerations 13Feedstock Conversion Capacity Cost Production References Fossil Methanol
Process (tonnes/day) Year Cost ($/GJ) Price ($/GJ)d
Forest SilvaGas process 2,000 2008 14.48 [66] 16.7 ~ 41.8
Residue ($333 ~ 832/tonne)
Forest RENUGAS 2,000 2008 22.67 [66] 16.7 ~ 41.8
Residue process
Maize Gasification 18.8 ~ 3,792 2008 21.6 ~ 29.5 [64] 16.7 ~ 41.8
Residue (400 ~ 2,000
MW)
Pine Wood Gasification 2,400 2012 ~ 20 [65] 22.1 ~ 24.2
($439 ~ 482)
Wood Gasification and 890 2010 18.7 [60] 16.7 ~ 23.1
water electrolysis (10.3 kg/s) (€14)b ($333 ~ 459/tonne)
CO2 and CO2 capture 890 2010 33.8 [60] 16.7 ~ 23.1
Hydrogen from power plant (10.3 kg/s) (€25.3)b
hydrogenated
with H2 from
water electrolyser
Animal Biogas upgrading 2.85 2010 34.52 [67] 16.7 ~ 23.1
Manure and water (Farm scale) (687.03/
electrolysis tonne)
Animal Biogas upgrading 59.3 2010 21.03 [67] 16.7 ~ 23.1
Manure and water (Large scale (418.56/
electrolysis POX) tonne)
Animal Biogas upgrading 37.1 2010 22.74 [67] 16.7 ~ 23.1
Manure and water (Large (452.57/
electrolysis scale steam tonne)
reforming)
Wood Gasification and 1,053 2010 19.6 [63] 16.7 ~ 23.1
water electrolysis (USD 120
(20% wind per barrel
penetration) equivalent)c
Wood Gasification and 1,053 2025 23.0 [63] N.A.
water electrolysis (USD 141
(50% wind per barrel
penetration) equivalent)c
Table 2.4 Comparison of biomethanol production cost from various techno-economic studiesa
a
Density and LHV (lower heating value) of methanol is 0.791 kg/litre and 19.9 MJ/kg, respectively
b
One US dollar = 0.7472 Euro on 31st Dec 2010
c
One barrel of oil equivalent = 6.118 GJ
d
Methanex monthly average regional posted contract price history (non-discounted)
Company Feedstock Investment Capacity Capital Cost Source
Cost (kilotonnes/ (USD/(tonne.
(million USD) year) year))
Chemrec Black liquor 440 100 4,400 Chemrec 2008
Värmsland Wood 540 100 5,400 Värmsland Methanol, 2011
Methanol
CRI Flue gas 15 1.6 9,500 CRI 2011
CO2
N.A. Natural gas 650 ~ 1,300 1,000 650 ~ 1,300 Bromberg & Cheng, 2010
Table 2.5 Overview of investment cost for (bio-) methanol facilities [68]
Future implementation of large capacity plants will create challenges on biomass collection
and logistics due to their primary production’s highly dispersed nature. However, it is
14 Maritime Energy and Sustainable Development (MESD) Centre of Excellenceproposed that future opportunities may arise from distributed or decentralised smaller scale
production facilities [65]. The rural production of methanol can be encouraged due to its
positive social effect [64].
2.5 Other Alternative Biomass Conversion Routes
Besides the biomass-to-methanol option, bioethanol and biogas conversion routes are worth
considering due to their established production technology and broad applications.
2.5.1 Bioethanol
Bioethanol can be produced from woody material as feedstock. Instead of using a high-
temperature catalytic conversion, the established process relies on hydrolysis to break down
the lignocellulose and starch into small sugar molecules, followed by fermentation to produce
ethanol. An early study in the 1990s [69] compared ethanol and methanol production from
corn, wood and natural gas. It was reported that three times as much methanol could be
made from renewable raw materials than ethanol for the same amount of energy used.
They also noted that methanol production from wood consumed less fossil energy than
ethanol from corn. They predicted that using wood as a feedstock for methanol production
would be a more attractive option. A more recent study using woody biomass came out with
similar finding. One metric ton of woody biomass with 41.4% cellulose, 28.1% hemicellulose
and 30.5% lignin (dry basis) can produce 290 litres of ethanol or 530 litres of methanol.
The energy and carbon conversion of biomethanol production is about 30% higher than
bioethanol production [70].
2.5.2 Biogas
Modern-day use of biomass usually starts from gasification to break down bulky plant tissue
into small molecules by either thermal treatment or anaerobic digestion in the presence of
bacteria. The product from thermal gasification is a mixture rich in hydrogen, carbon monoxide
and carbon dioxide, which is a versatile precursor to produce a number of gaseous and liquid
fuels. However, the fermentation process produces a gas mixture of mainly methane and
carbon dioxide, or under a controlled condition with a significant amount of hydrogen [71].
The gasified biomass can be used in the gaseous form such as cleaned bio syn-gas, bio-
methane or bio-hydrogen; or further catalytic conversion to produce liquid fuels. However,
deeper processing is always associated with further energy loss from the raw biomass input,
a conversion route with lesser steps is preferred.
Converting lignocellulose biomass into methane and hydrogen are considered alternative
routes. Biomethane from either anaerobic digestion or biomass gasification exhibits similar
efficiencies (62 ~ 65%) in retaining the energy from raw forest residues [72]. In a study
when fermentation is used to produce bio-methane, the average productivity of 4,000 Nm3
ha-1 year-1 is used to estimate across EU-25 agricultural area, and some good individual
examples reached 7,500 ~ 10,200 Nm3 ha-1 year-1 on maize plantation [73]. The bio-methane
pathway shows a competitive energy yield as compared to methanol route.
Gasification to hydrogen follows a similar process. High-temperature thermochemical
conversion is currently the predominant pathway due to its established process understanding
and equipment design. The yield of hydrogen on a dry biomass weight basis is relatively
low, with reported values varying from 8 ~ 13% via steam gasification of sawdust [74],
or 12.6 ~ 17.1% from pyrolysis oil [75]. Practical issues such as gasifier design, cost of
biomass, hydrogen storage and distribution infrastructure are still the main barriers that
make hydrogen less competitive to methanol in the short term. However, from a long-term
perspective, hydrogen produced from biomass gasification will play a key role during the
transition towards a clean and sustainable energy future [76].
Methanol as a Marine Fuel – Availability and Sea Trial Considerations 152.5.3 Comparative Analysis with Other Energy Conversion Routes
Table 2.6 provides a comparison between several discussed biofuels from various mainstream
biomass and conversion processes. The energy yield of biomethanol route shows the
broadest range with the potential to be the top producer, followed by biomethane, bioethanol
and oil crop extraction. The last two routes have been well established with less room for
further improvement.
In tropical regions, the average potential to produce methanol from energy crop can reach 16
tonnes ha-1 year-1, taking the high side productivity of miscanthus as an example. Suppose
methanol is to replace 50% of world bunker demand. In that case, it will require a global
production of 362.5 million tonnes, or 22.6 million hectares of dedicated land use, or 0.47%
of the total agricultural land on earth [77]. As a medium-term projection, it has been estimated
that about 240 million ha of land, can be used for dedicated energy crops by 2035. There will
be enough land worldwide to feed 9 billion people and produce more biomass for energy and
material use [54].
End Product Methanol Methane Ethanol Raw Oil
LHV (MJ/kg) 19.9 50 26.8 37.2
Energy Crop Miscanthus Maize Sugar cane Oil palm
Main Process Gasification + Anaerobic digestion Fermentation Extraction
catalytic conversion
Yield of Product 6,500 ~ 22,000a 5,355 ~ 7,283b 4,270 [78] 4,500c
(kg/(ha.year)) ~ 8,258 [46]
Energy Yield 129 ~ 438 268 ~ 364 114 ~ 221 ~ 167
(GJ/(ha.year))
Table 2.6 Energy yield of biomass conversion routes
a
Overall 50% conversion
b
Data taken from reference [73]
c
Average taken from reference [47]
2.6 Methanol Production Plants Using Renewables
The list of methanol plants is shown in table 2.7. In terms of capacity, these are small plants
as compared to fossil methanol plants with capacities easily reaching several millions of
metric tonnes per year. Renewable methanol production relies heavily on the availability
of biomass and other forms of renewables supply. An efficient (cost and carbon footprint)
biomass collection network is critical. At present, there is no reported renewable methanol
plant in Southeast Asia. However, as a region abundant in biomass output, Southeast
Asia has enormous potential to supply renewable materials for methanol production. It is
anticipated that well-selected energy crops and biomass waste stream would be the future
feedstock for biomethanol in the region.
16 Maritime Energy and Sustainable Development (MESD) Centre of ExcellenceLocation Company or Start-up Capacity Feedstock Ref.
Project Year
Operational
USA Smithfield 2003 ~ 2008 7,000 gallons/day Swine manure [79]
BioEnergy (21 tonnes/day)
Iceland Carbon 2011 4,000 tonnes/year Flue gas CO2 and H2 from [80]
Recycling water electrolysis
Internationala
Niederaussem, MefCO2 2014 1 tonnes/day Flue gas CO2 [81]
Germany
Sweden BioDME 2008 4 tonnes/day DME Black liquor [82]
Canada Enerkem 2016 38 million litre/year Municipal waste [83]
(30,096 tonnes/year) (100,000 tonnes/year, dry)
Canada Alberta Pacific 2011 N.A. Wood [84]
Sweden Chemrec 2011 ~ 2016 70 MW MeOH Black liquor [85]
Piteå output from 100 MW
biomassb
Sweden Varmlands late 2015 300 tonnes/day Forest residual [86]
Methanol AB (or 90,000 tonnes/
year)
Under Construction/Order/Proposed
Sweden Södra 2019 5,000 tonnes/year Off gas of condensates [87]
from Kraft mill
Netherlands FReSMe 2017 N.A. CO2 and H2 from a steel [88]
production plant
Netherlands Enerkem FID (final 270 million litre/year Municipal, industrial, [83]
investment (213,840 tonnes/year) commercial and
decision) institutional waste
(360 kilotonnes)
Spain Enerkem FID 270 million litre/year Municipal, industrial, [83]
(213,840 tonnes/year) commercial and
institutional waste
(400 kilotonnes)
Europe and CirclEnergy Awarded in N.A. CO2 from flue gas and H2 [89]
China 2019 from electrolysis
Netherlands BioMCN late 2019 19,636 tonnes/year CO2 and green hydrogen [90]
Netherlands Woodspirit c
Awarded in N.A. Biomass [91]
2012
Poland PKE & ZAK 2015 Up to 550 kilotonnes/ Up to 10% biomass and [92]d
year coal
Germany DeBioM N.A. N.A. Wood [92]
USA Maverick N.A. 3,000 ~ 10,000 Natural gas or biogas [93]
Synfuels gallons/day
(9 ~ 30 tonnes/day)
Table 2.7 Current bio and renewable methanol production projects and facilities
a
Aka George Olah Renewable Methanol Plant
b
Around 304 tonnes/day
c
A consortium consisting of BioMCN, Siemens, Linde, and Visser & Smit Hanab
d
Requote from the publication instead of the original link that is invalid
Methanol as a Marine Fuel – Availability and Sea Trial Considerations 172.7 Future Methanol Production
The future production of methanol can harness the abundant supply of CO2 from the air and
hydrogen through electrolysis of water. The concept is not new but still challenging due to the
difficulty of direct air capture of CO2 and energy-intensive process to produce hydrogen by
electrolysis. Energy-efficient options are described below.
Nuclear
Decades ago, it was proposed to use thermal nuclear energy to power the process [94]
[95]. As a result of optimisation, carbon dioxide captured from the air by diluted potassium
carbonate solution to produce potassium bicarbonate is found to require the least amount
of energy. The total energy required for methanol synthesis from these sources of carbon
dioxide is 3.90 kWh(e)/1b methanol, of which 90% of the electricity is consumed for the
generation of hydrogen.
Offshore Solar PV
An interesting concept was recently proposed to use solar energy to recycle atmospheric
CO2 into liquid fuel. The concept is based on clusters of marine-based floating islands.
Photovoltaic cells can be installed to convert sunlight into electrical energy to produce H2
and extract CO2 from seawater. The two gases are then reacted to form methanol, which is
conveniently shipped to the end consumers [96].
The outcome of the idea is a clustered solar methanol island. It has been proposed that an
individual facility is a cluster of 70 flexible PV islands, each with a diameter of 100 m (total PV
area 550,000 m2) that occupies a total area of about 1km2 [96]. The facility’s yearly output is
estimated to be 15,300 tonnes/year, which is scheduled for collection by tanker ships.
Wind
The energy yield of renewables is critical. Given the same land area, wind energy has the
highest yield compared to solar PV, hydroelectric and photosynthesis, making it a preferable
choice for renewable methanol production (figure 2.4) [97]. Based on wind energy input,
several emerging projects and concepts are summarised in table 2.8, using methanol as the
energy carrier product. A schematic flow diagram is further illustrated in figure 2.5, in which
methanol is considered the best energy carrier if all CO2 is captured and recycled back to the
production loop [98].
Power Yield Comparison per Square Kilometer
Biomass Hydro Solar PV Wind
Unit: GWh/(km2.year)
500 – 1,000
170 – 300
12
2 – 2.5
Biomass Hydro Solar PV Wind
Figure 2.4 Comparison of power yield from various renewable sources
Source: Adapted from [97]
18 Maritime Energy and Sustainable Development (MESD) Centre of ExcellenceLocation Project Commencement Capacity Feedstock Reference
Sweden Liquid wind 2019 5,000 kg/hour CO2 from CCU [99]
H2 from electrolysis
Germany Westküste 2030 700 MW H2 CO2 from cement [100]
100 input plant
H2 from electrolysis
France Farwind 2017 ~ 2020 Scenario- CO2 from land [98]
based supply
H2 from electrolysis
Table 2.8 Examples of methanol projects from wind energy
CO2 CO2
Capture
CO2
Power-to-
Wind End
FARWINDERs Electricity Methanol Methanol Tankers Methanol Trucks Methanol
Energy Users
Plants CO2
Energy Water Energy Propulsion Propulsion
Losses Losses and Auxiliaries
Subsystems
Figure 2.5 Flow diagram of the FARWIND energy system
Source: Adapted from [98]
Methanol as a Marine Fuel – Availability and Sea Trial Considerations 193 Methanol Fuel Guidelines
Unlike most hydrocarbon fuels consisting of multi-components, methanol is a single-component
fuel, exhibiting a set of consistent chemical-physical properties. Guidelines regulating the use of
methanol as a marine fuel are still being developed.
3.1 IGF Code and CCC
The International Code of Safety for Ships using Gases or other Low-flashpoint Fuels, known
as IGF Code, regulates the implementation of alternative fuels for ships. It entered into force
on 1 January 2017 [101]. The objective of the code is to minimise the risk to ships, crews
and the environment. The low-flashpoint fuels shall be adopted with mandatory measures
for arranging, installing, controlling, and monitoring machinery, equipment and systems. The
IGF code was initially limited to liquefied natural gas (LNG) [102]. To keep the IGF code up-
to-date, a Sub-Committee on Carriage of Cargoes and Containers (CCC) formed with the
aim to review the International Codes including IGF code, IGC code and at meantime to
develop guidelines relevant to other types of fuels [101][102].
The sub-committee comprises different working groups, which are attended by delegates of
the member states of IMO. They are involved in research and debate by giving examples
of safe design options for the use of methyl alcohol. Hazard identification (HAZID) was
conducted to assess the designs during the discussion [103]. The amendment from CCC
Sub-Committee is framed after detailed study and review. Till date, there are 6 sessions
conducted to undertake matters related to the safety and security of cargos with low flashpoint
fuels [102]. With the contribution from CCC Sub-Committee, interim guidelines for ships
using methyl/ethyl alcohol as fuel were established. The guidelines address areas that need
to be specially considered when using the methyl/ethyl alcohol fuel and apply to all ships
indicated in Part G of SOLAS chapter 2.1 [104]. It covers the design and indicates liabilities
of stakeholders, including the responsibilities during the bunkering operations. Table 3.1
summarises the codes and guidelines related to methanol fuel for marine use.
In line with international codes and CCC amendment, marine classification societies such
as China Classification Society (CCS) has also developed rules and regulations for green
shipping. One of the established standards is the Guidelines for Ships Using Alternative
Fuels implemented on 1 December 2017 [105]. The objective of the regulation is to provide
guidelines and safety provisions when alternative fuels are adopted. Currently, it focuses
on methyl/ethyl alcohol fuel, fuel cell and biodiesel. The guidelines are applicable for both
new build and retrofit cases. It includes but is not limited to the information in the design
of shipboard equipment, bunkering infrastructures, fire safety control and alarm monitoring
system. However, the guideline is only applicable for a ship in the steel structure of not less
than 20 m in length. It will be a scenario-based approach for a vessel with other design, which
needs further evaluation before deployment.
With respect to existing international guidelines, the challenge is that they are mainly
applicable for ocean-going vessels. With respect to vessels operating within the port limit, the
guidelines may be more applicable for bigger harbour craft. For example, in Singapore, some
vessels under SB and ST categories (table 4.1) are designed with ocean-going capability.
When actual implementation is considered for smaller harbour craft (SP and SC categories
20 Maritime Energy and Sustainable Development (MESD) Centre of Excellencein Singapore) operating only within the port limit, function-based guidelines from respective
classification societies together with risk assessment by port authorities are supposed
to be a more practical approach. It helps to identify the potential risk factors arising from
the use of methyl/ethyl alcohol fuels that affect personnel on board, the environment and
shipboard safety. As a result, the awareness of hazards and risk with suitable measures
can be established. Further consideration about the hazards associated with vessel layout,
operation profile, bunkering arrangement, together with reasonably foreseeable failures,
should be addressed and evaluated with acceptable techniques. Inputs from naval architect
and engineering principles with a comprehensive understanding of the operational experience
and field data will help enhance the contents of the document. Likewise, a provision for
methanol powered local harbour craft can be established.
Regulations Timeline Objective and Remarks Reference
and Guidelines Descriptions
IGF Jan Considered a goal-based Focusing initially on liquefied natural [106][107]
2017 approach and used to gas (LNG).
provide an international
standard for ships other
than vessel covered by
the IGC Code, operating
with gas or low-flashpoint
liquids as fuel.
CCC 6 Sept The Sub-Committee Finalised draft interim guidelines for the [102][108]
2019 keeps updated the safety of ships using methyl/ethyl alcohol
International Maritime as fuel, for submission to the Maritime
Solid Bulk Cargoes Safety Committee (MSC) for approval.
Code (IMSBC Code)
CCC 5 Sept The sub-committee agreed, in principle, [102][101]
and the International
2018 to draft interim guidelines for the safety of
Maritime Dangerous
ships using methyl/ethyl alcohol as fuel.
Goods (IMDG) Code. It
CCC 4 Sept also keeps under review IMSBC Code amendment developed [102][109]
2017 other Codes including and IMDG Code amendments finalised.
the International Code
CCC 3 Sept The IGF Code Correspondence Group [102][103]
of Safety for Ships
2016 was tasked with further developing draft
using Gases or other
technical provisions for the safety of
Low Flashpoint Fuels
ship using methyl/ethyl alcohol as fuel.
(IGF Code) and the
CCC 2 Sept International Code for The sub-committee began developing [102][110]
2015 the Construction and draft text of technical provisions for the
Equipment of Ships safety of ship using methyl/ethyl alcohol
Carrying Liquefied Gases as fuel, for further consideration by a
in Bulk (IGC Code). correspondence group.
CCC 1 Sept Draft international code of safety [102][111]
2014 for ships using Gases or other Low
flashpoint Fuels (IGF Code) agreed.
CCS Dec Formulated the Applies to steel ships of not less than [112]
2017 ‘Guidelines for Ships 20m in length and using methyl/ethyl.
Using Alternative Fuels’
to provide technical
standards for methyl/
ethyl alcohol fuel, fuel
cells and biodiesel fuel
application on ships for
emission control.
Table 3.1 Summary of methanol fuel-related codes and guidelines for marine usea
a
Update. For further information, there are two latest publications on methanol for marine fuel use, namely, “Interim guidelines for the safety of
ships using methyl/ethyl alcohol as fuel (IMO MSC102, Nov 2020)” and “Bunkering Technical Reference on Methanol (by LR and MI, Sept 2020)”.
Methanol as a Marine Fuel – Availability and Sea Trial Considerations 213.2 Methanol as Chemical Cargo
Methanol has been used as a chemical commodity extensively. There are established
documents, such as methanol safety data sheet (SDS) [113] covering hazards identification,
safe handling, storage, accidental release, firefighting, first aid and environmental
considerations of methanol.
The sea transportation of methanol is regulated by the International Maritime Dangerous
Goods (IMDG) code. The code is applicable to all members of SOLAS [114]. The IMDG Code
requires that certain provisions be followed whenever dangerous goods are shipped by sea.
These provisions require good management of dangerous goods such that they are correctly
and safely:
a. Classified and identified.
b. Packed.
c. Marked, labelled and placarded.
d. Documented.
e. Stowed on board the vessel.
f. Segregated from other goods with which they may react dangerously.
In addition, appropriate emergency response information must be available, and security and
training requirements must be followed.
3.3 Additional References
A detailed summary of methanol safe handling manual was published by Methanol Institute
in 2008 [115]. This manual is designed to be a primary resource for information on methanol
specifically for its safe handling. It presents current information on methanol’s properties,
potential environmental and health and safety hazards, safe handling practices, emergency
response procedures, product and distribution stewardship, and risk communication. The
manual provides convenient access to practical information. Key facts and useful references
are highlighted in the text. Additional technical data, such as methanol’s chemical, physical,
and thermodynamic properties, are provided in the appendices. The reference section also
presents a list of scientific and technical resources for more in-depth understanding. The
manual also includes Fact Sheets on many topics related to methanol’s safe handling, which
include methanol use as fuel, emergency response, product stewardship, and health effects.
22 Maritime Energy and Sustainable Development (MESD) Centre of ExcellenceYou can also read