Improving Vehicle Fuel Economy in the ASEAN Region - Working Paper 1/10
←
→
Page content transcription
If your browser does not render page correctly, please read the page content below
Improving Vehicle Fuel Economy in the ASEAN Region

                                     Working Paper 1/10

                                                 U NE P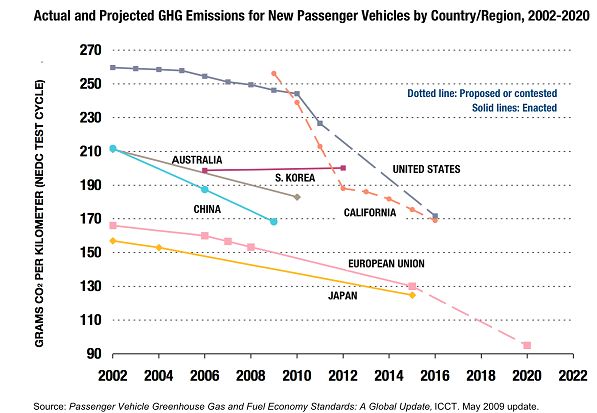
Improving Vehicle Fuel Economy in the ASEAN
                                                                                                                            July 2010

CONTENTS
EXECUTIVE SUMMARY .................................................................................................................................. 4
1. INTRODUCTION ..................................................................................................................................... 6
  1.1      Background ................................................................................................................................... 6
  1.2      Objectives and Scope .................................................................................................................... 7
2 RATIONALE FOR FUEL ECONOMY POLICIES AND MEASURES IN THE ASEAN ....................................... 9
  2.1 Motorization ....................................................................................................................................... 9
  2.2      Energy Security and Fuel Savings ................................................................................................ 11
  2.3      CO2 Emissions from Fossil Fuel Combustion in the Transport Sector ......................................... 13
  2.4      Air Pollution ................................................................................................................................ 15
  2.5      Economic impacts ....................................................................................................................... 16
3 BRIEF REVIEW OF FUEL ECONOMY STANDARDS AND CO-BENEFITS .................................................. 19
  3.2      Review of Fuel Economy Standards ............................................................................................ 19
  3.3      Co-benefits of Fuel Economy ...................................................................................................... 21
4 THE ASEAN AND ITS TRANSPORT INITIATIVES .................................................................................... 23
5 SUMMARY OF FINDINGS ..................................................................................................................... 25
  5.1      Fuel Economy in the Context of Other Fuel, Vehicle, and Energy Issues ................................... 25
  5.2      Multiple Government Institutions Regulate Fuel, Vehicle, and Energy Issues ........................... 26
  5.3      Varying Status of Fuel Economy Policies and Measures in ASEAN Member Countries.............. 27
  5.4      Need to involve Vehicle Manufacturers and other Stakeholders............................................... 27
  5.5      Consideration of Technical Issues and other Barriers ................................................................ 28
6. A COMMON FUEL ECONOMY FRAMEWORK FOR THE ASEAN ............................................................ 30
  6.1      Support for a Fuel Economy Framework under ASEAN .............................................................. 30
  6.2      Criteria that a Fuel Economy Framework should meet .............................................................. 30
  6.3      Organization within ASEAN ......................................................................................................... 32
Annex A. Selected ASEAN Member Country Profiles.................................................................................. 33
  1. Indonesia ............................................................................................................................................. 33
  2. Malaysia .............................................................................................................................................. 36
  3. Philippines ........................................................................................................................................... 38
  4. Singapore ............................................................................................................................................ 40
  5. Thailand............................................................................................................................................... 43
  6. Vietnam ............................................................................................................................................... 45
Annex B. Overview of Fiscal Measures on Vehicle Ownership and Use in the ASEAN ............................... 47

About CAI-Asia
The Clean Air Initiative for Asian Cities (CAI-Asia) promotes better air quality and livable cities by translating knowledge to
policies and actions that reduce air pollution and greenhouse gas emissions from transport, energy and other sectors. CAI-
Asia was established in 2001 by the Asian Development Bank, the World Bank and USAID, and is part of a global initiative
that includes CAI-LAC (Latin American Cities) and CAI-SSA (Sub-Saharan Africa).
Since 2007, this multi-stakeholder initiative is a registered UN Type II Partnership with almost 200 organizational members,
eight Country Networks (China, India, Indonesia, Nepal, Pakistan, Philippines, Sri Lanka, and Vietnam) and the CAI-Asia
Center as its secretariat. Individuals can join CAI-Asia by registering at the Clean Air Portal: www.cleanairinitiative.org. Its
flagship event, the Better Air Quality conference, brings together over 700 air quality stakeholders.
Improving Vehicle Fuel Economy in the ASEAN
July 2010
LIST OF ABBREVIATIONS
AFTA ASEAN Free Trade Agreement
APEC Asia-Pacific Economic Cooperation
ASEAN Association of Southeast Asian Nations
ATM ASEAN Transport Meeting
BAQ Better Air Quality
BEE Bureau of Energy Efficiency (India)
CAFÉ Corporate Average Fuel Economy
CAMA Chinese Automotive Manufacturers Association
CBU completely built up
CNG compressed natural gas
CO Carbon monoxide
CO2 Carbon dioxide
DIESEL Developing Integrated Emissions Strategies for Existing Land Transport
EIA Energy Information Administration of the U.S. Department of Energy
EST Environmentally Sustainable Transport
EU European Union
FCAI Federal Chamber of Automotive Industry (Australia)
FIA Federation Internationale de l'Automobile
GDP Gross Domestic Product
GHG greenhouse gas
HC Hydrocarbons
HDV Heavy-duty vehicles
I&M Inspection and maintenance
ICCT International Council for Clean Transport
IEA International Energy Agency
ITF International Transport Forum
JAMA Japan Automobile Manufacturers Association
JARI Japan Automotive Research Institute
KAMA Korean Automotive Manufacturers Association
LDV Light-duty vehicles
LNG Liquefied natural gas
LPG Liquefied petroleum gas
MEET Ministerial Meeting on Environment and Energy in Transport
MLIT Ministry for Land, Infrastructure, Transport, and Tourism (Japan)
MoSRTH Ministry of Shipping Road Transport and Highways (India)
NGV Natural Gas Vehicles
NOx Oxides of Nitrogen
OMV Original Market Value
PM Particulate Matter
QA/QC Quality assurance/ quality control
RON Research Octane Number
2Improving Vehicle Fuel Economy in the ASEAN
July 2010
STOM Senior Transport Officials Meeting (ASEAN)
SUV Sports Utility Vehicles
UNCRD United Nations Centre for Regional Development
UNECE/WP29 United Nations Economic Commission for Europe Working Paper 29
UNEP United Nations Environment Programme
US United States
USD United States Dollar
VAT Value added tax
WHO World Health Organization
Indonesia:
Gaikindo Association of Indonesia Automotive Industries
MoT Ministry of Transport
IDR Indonesian Rupiah
Philippines:
NEECP National Energy and Efficiency and Conservation Program
PETC Private Emission Testing Centers
LTO Land Transportation Office
DAO Department Administrative Order
SVPCF Special Vehicle Pollution Control Fund
ASB Anti-smoke Belching
CFCERT Committee on Fuel Conservation and Efficiency in Road Transport
GEMP Government Energy Management Program
NGVPPT Natural Gas Vehicle Program for Public Transport
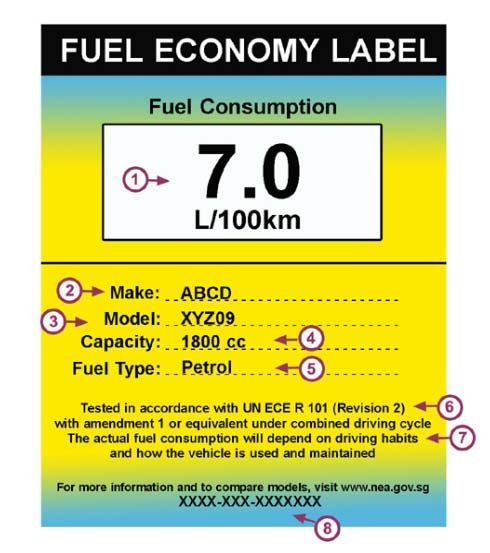
Singapore:
GVR Green Vehicle Rebates
ARF Additional Registration Fee
FELS Fuel Economy Labeling Scheme
EPMA Environmental Protection and Management Act
FEL Fuel Economy Label
COE Certificate of Entitlement
PARF Preferential Additional Registration Fee
NEA National Environment Agency
LTA Land Transport Authority
Thailand:
PCD Pollution Control Department
MNRE Ministry of Natural Resources and Environment
BoI Board of Investments
3Improving Vehicle Fuel Economy in the ASEAN
July 2010
EXECUTIVE SUMMARY
A survey on fuel economy in the Association of South East Asian Nations (ASEAN) was conducted to assist
ASEAN and its Member Countries to adopt a pro-active approach to promote fuel economy by
establishing a common framework for adopting fuel economy policies and measures. This survey was
carried out by the Clean Air Initiative for Asian Cities Center (CAI-Asia Center) and funded by the FIA
Foundation in support of the Global Fuel Economy Initiative (GFEI), which aims for an improvement of
50% worldwide by 2050 in average fuel economy (reduction in fuel consumption per kilometer).
Road transport is a key element in the mobility of goods and people. It is also a significant consumer of
liquid fossil fuels worldwide and thus a major contributor to the increasing global greenhouse gas (GHG)
emissions, especially CO 2 , and air pollution. While most OECD countries have put in place vehicle fuel
economy standards, China is the only developing country in Asia with such standards. While fuel
consumption of individual Southeast Asian countries is small compared to that of China or India, it is
significant if considered for Southeast Asia as a whole, and motorization levels (number of vehicles per
thousand people) in Southeast Asia will continue to be larger than that of India and China for the next
two decades. Moreover, fuel consumption by transport is expected to increase by more than 5% per year
until 2030 because of rapid urbanization and economic growth resulting in greater demand for mobility.
ASEAN countries increasingly rely on fuel imports, fuel prices are very volatile, and several countries
heavily subsidize fuel putting pressure on national budgets. CO 2 emissions are expected to rise equally as
fuel use increases. Air pollution, although also depending on the quality of fuel and emission control
devices, will also increase. Of these, particulate emissions are of concern because of their health impacts
as well as their contribution to global warming because they contain black carbon or “soot”.
The main reasons for fuel economy policies and measures are therefore fuel security and costs, climate
change and air pollution. Such policies and measures could lead to up to 16% reductions in fuel and CO2
emissions if applied to light duty vehicles (LDVs) and up to 26% if applied to both LDVs and high duty
vehicles (HDVs). However, the development of fuel economy policies and measures varies largely
between ASEAN countries. Thailand is furthest advanced with concrete proposals for such standards for
LDVs and will be adding other vehicle types step by step.
In spite of this, there is support for a common Framework for Fuel Economy Policies and Measures in the
ASEAN, as witnessed by the various transport initiative and declarations by the ASEAN or with ASEAN
representation and based on interviews with government officials from different ASEAN countries. The
ASEAN could provide a platform for its Member Countries to help each other improving fuel economy
while respecting individual countries’ preference for certain policies and measures and timelines. The
ASEAN can also provide a stronger voice to vehicle/engine manufacturers to adopt fuel economy
standards, where individual countries are less able to do so, especially those with only vehicle assembly
but no manufacturing.
The development of such a framework should
• Be linked to or placed into context of other policies and efforts on fuel, vehicles, energy, climate
change and air pollution, as shown in the figure. One important reason is that fuel economy
4Improving Vehicle Fuel Economy in the ASEAN
July 2010
policies and measures currently do not rate as highly in the agenda of government ministries as
compared to alternative fuels and emissions management.
• Engage, at the country level, the various government agencies involved in setting policies for fuel,
vehicles, energy and the environment, including transport, energy, environment, and finance
ministries.
• Carefully select the body within ASEAN to lead the framework development, and other national
agencies from ASEAN member countries to be involved at the ASEAN level to streamline the
development of policies and measures, including at least the government agency that takes the
lead in the respective ASEAN country on fuel economy for vehicles. Initial discussions on fuel
economy could start with the ASEAN Senior Transport Officials Meeting (STOM) since most of the
ASEAN Member Countries have acceded to some international declarations promoting fuel
efficiency in the transport sector like the MEET and the EST Forum.
• Involve other stakeholders, in particular vehicle manufacturers, to ensure the smooth passage of
fuel economy policies and measures, particularly standards and vehicle labeling programs.
• Facilitate awareness raising, knowledge sharing and capacity building between ASEAN countries
and develop common guidelines on fuel economy policies and measures including the use of
fiscal measures, and on the linkages between fuel economy and environmental issues. Input
should be sought from especially China, Japan, the European Union, and the United States, to
fast track the adoption and improve the quality of fuel economy policies and measures in ASEAN
countries.
• Include a pilot study of how fuel economy policies and measures can be integrated and
implemented in the transport plans of ASEAN countries.
• Address technical issues and other barriers, such as lack of data and quality control, perceived
conflict with biofuels policies, enforcement issues with imported cars, purchaser consideration of
fuel efficiency, and limited experience and capacity within government.
• Be supported by a concrete steps in the form of an Action Plan.
Energy Efficiency and Fuel Environmentally
Security Sustainable Transport
Fuel Efficiency in Cleaner and
the Transport Efficient Fuels and
Sector Fuel Vehicles
Economy
Fuel Economy in the context of Energy Efficiency and Sustainable Transport
5Improving Vehicle Fuel Economy in the ASEAN
July 2010
1. INTRODUCTION
1.1 Background
Road transport is a key element in the mobility of goods and people. It is also a significant energy end-use
sector worldwide and thus a major contributor to the increasing global greenhouse gas (GHG) emissions
as well as air pollutant emissions. The entire transport sector consumes nearly 60% of the world’s
petroleum supply (IEA, 2008) and contributes approximately 25% of the world’s energy-related GHG
emissions (Ribeiro et al., 2007). According to the IEA, road transport accounts for almost 80% of the total
energy demand from transport. Rapid shifts from the patterns of energy use in the transport sector
towards fuel economy are much needed as the sector is expected to grow robustly in the coming
decades.
The share of transport in the demand for liquid fuels is projected to increase more rapidly than any other
end-use sector in the next 25 years. Developing countries are expected to contribute significantly to the
projected increase in the transport sector energy demand growth where transportation energy use
increases by an average of 2.7% annually from 2006-2030, whereas the average energy use growth rate in
developed countries is 0.3% annually (EIA, 2009). China, India and other Asian developing countries,
particularly the major ASEAN countries are expected to account for almost half of the increase in world
GDP and 27% of world transport liquids consumption by 2030 (EIA, 2009).
China and India, the two main countries to contribute significantly to fuel consumption increase in the
transport sector, have already taken steps in terms of formulating and adopting fuel economy standards.
China put in place fuel economy standards in 2005 with the aim to reduce China’s dependence on foreign
oil and to encourage the entry of more fuel-efficient vehicles into the Chinese market (ICCT, 2009). India
is currently in the process of developing mandatory fuel economy standards.
The Association of South East Asian Nations (ASEAN) and its Member Countries also contribute
substantially to fuel consumption increase in the transport sector because of a surge in urbanization and
rapid economic growth, resulting in greater demand for mobility. Based on estimated growth scenarios,
the ASEAN motorization levels (number of vehicles per thousand people) will continue to be larger than
that of India and China for the next two decades (see Figure 2).
6Improving Vehicle Fuel Economy in the ASEAN
July 2010
Figure 1. The ASEAN Member Countries
According to the 2nd ASEAN Energy Demand Outlook (2009), the final energy consumption in ASEAN will
grow at an average annual rate of 3.9% from 343 MTOE in 2005 to 901 MTOE in 2030 with the
transportation sector experiencing the highest growth in consumption of 5.1 percent annually,
corresponding to an equivalent growth in CO 2 emissions. 1
Fuel economy policies and measures will provide an opportunity for policy makers to reduce fuel
consumption, providing savings for both importing and non-importing countries, and contributing to fuel
security. In addition, such policies and measures will contribute to reducing CO 2 emissions from the
transport sector. If no measures are taken immediately, emissions of both criteria air pollutants and GHGs
will increase exponentially as a result of the increased demand for mobility and energy in the ASEAN
region.
1.2 Objectives and Scope
Building on the discussions and recommendations from the Better Air Quality (BAQ) 2008 pre-event “Fuel
Economy: Towards a Global Framework” supported by the FIA Foundation on behalf of the Global Fuel
Economy Initiative (GFEI) 2, the survey aims to provide a basis for the ASEAN and its member countries to
adopt a pro-active approach to promote fuel economy by establishing a common framework for adopting
fuel economy policies and measures in support of the goals of the GFEI.
The survey also aims to inform the ASEAN and its member countries and as well as international
organizations and development institutions on the status of fuel economy policies and measures in the
ASEAN region. While the survey focuses on improving fuel economy of conventional light-duty vehicles,
other transport modes like 2-wheelers and heavy-duty vehicles also play an important role. Other issues
1 nd
2 ASEAN Energy Demand Outlook. March 2009
2
The proceedings are available on the BAQ 2008 website (www.baq2008.org/preevent-fuels)
7Improving Vehicle Fuel Economy in the ASEAN
July 2010
raised by stakeholders in the ASEAN relate to alternative fuels, fuel quality and vehicle emissions
management are intrinsic to the discussion of promoting fuel economy policies and measures. The
survey also provides possible next steps on how fuel economy policies and measures can be implemented
in the ASEAN and its member countries.
This survey is implemented in the context of the Global Fuel Economy Initiative launched by the FIA
Foundation, International Energy Agency (IEA), International Transport Forum (ITF), and United Nations
Environment Programme (UNEP) to facilitate large reductions of GHG emissions and oil use through
improvements in automotive fuel economy. 3 The objective of the GFEI is to promote further research,
discussion and action to improve fuel economy worldwide and develop policy engagement strategies in
each region.
The GFEI targets an improvement of 50% worldwide by 2050 in average fuel economy (reduction in fuel
consumption per kilometer). Fuel economy is defined in the “50 by 50: Global Fuel Economy Initiative
Report” as fuel consumption per kilometer. Improving fuel economy or reducing the fuel consumed per
kilometer can be achieved through different sets of measures including improvement in vehicle
efficiency, using more efficient fuels and changing behavior – e.g. promoting eco-driving.
The GFEI work will be practical, and focused on making a real difference - from working with governments
in developing policies to encourage fuel economy improvement for vehicles manufactured, assembled or
sold in their countries, to supporting regional awareness initiatives that provide consumers and decision
makers with the information they need to make informed choices.
The activities of the GFEI include the following:
• Development of improved data and analysis on fuel economy around the world, monitoring trends
and progress over time and assessing the potential for improvement.
• Work with governments to develop policies to encourage fuel economy improvement for vehicles
produced or sold in their countries and to improve the consistency and alignment in policies
across regions in order to lower the cost and maximize the benefits of improving vehicle fuel
economy.
• Work with stakeholders including auto makers to better understand the potential for fuel
economy improvement and solicit their input and support in working toward improved fuel
economy.
• Support regional awareness initiatives to provide consumers and decision makers with the
information they need to make informed choices.
3
See www.50by50campaign.org for more information
8Improving Vehicle Fuel Economy in the ASEAN
July 2010
2 RATIONALE FOR FUEL ECONOMY POLICIES AND MEASURES IN
THE ASEAN
As the ASEAN gears towards further development, it faces several transport-related challenges such as
increasing demand for mobility and higher motorization, traffic congestion, higher fuel consumption.
Unless averted, this will be accompanied by further shift from lower carbon intensive modes such as
public transport and non-motorized transport to more carbon intensive motorized transport. Moreover,
as the GDP per capita increases, a further shift from small cars and two wheelers to larger cars and SUVs
will further compound negative transport externalities. There is a need to reconcile the increased desire
for personal mobility and trade in order to reduce these transport externalities and to sustain the auto-
manufacturing industries in the ASEAN region.
Fuel economy standards are being promoted worldwide as an effective means of reducing oil
consumption and carbon and air pollutant emissions. In the IEA’s 2009 report “Transport, Energy and
CO2”, a review of fuel economy policies in selected countries and regions shows that implementation of
progressively tighter mandatory fuel efficiency standards for LDVs has proven instrumental in achieving
steady and rapid technology uptake while avoiding increases in vehicle size, weight and power, which
erode the fuel savings provided by the technologies. 4 These selected countries include the United States
(Corporate Average Fuel Economy Standards or CAFE), Japan (established its fuel economy standards
under its “Top Runner” energy efficiency program), the European Union, Korea, Canada, and China.
Chapter 4 of the IEA report, entitled “Light-duty vehicle efficiency: policies and measures”, captures the
various experiences and the status of common measures to improve fuel efficiency in these countries and
regions, such as regulatory standards, voluntary targets, financial incentives and improved consumer
information.
This section summarizes relevant issues faced by the ASEAN and its member countries.
2.1 Motorization
Motorization in ASEAN countries is the main driver for transport externalities. Figure 2 shows the
estimated growth in the total number of vehicles vis-à-vis the motorization index (number of vehicles per
1000 people) in selected countries and regions. It shows that compared to China and India, the
motorization levels in major ASEAN countries will be higher until 2035. The ASEAN’s motorization index
will nearly double from 150 to approximately 327 by 2025 indicating that there would be major fleet
renewal and expansion in the coming years. This influx of new vehicles makes it imperative that vehicle
fuel economy measures are designed efficiently. Increasing motorization has become a major concern in
many ASEAN cities as it continues to weigh on their carrying capacity of transport systems and on general
urban development.
Figure 3 shows the growth of motor vehicles by mode for six ASEAN countries. Current estimates show
that if the reference scenario pervades in the future, the vehicle increase will mostly come from
motorcycles, but also from personal cars and light-commercial vehicles, in descending order.
4
OECD/ IEA, 2009. Transport, Energy, and CO2. Available: http://www.iea.org/w/bookshop/add.aspx?id=365
9Improving Vehicle Fuel Economy in the ASEAN
July 2010
Total Vehicles and Motorization Index
450 800
400 700
350 600
300
500
250
400
200
300
150
100 200
50 100
0 0
2005 2008 2015 2025 2035 2005 2008 2015 2025 2035 2005 2008 2015 2025 2035
ASEAN (Major Countries) China INDIA
Total Vehicles (in millions)- (Left Axis) Motorization Index (V/1000 P) (Right Axis)
Figure 2. Motorization Index in ASEAN, China, and India
Note: ASEAN = Association of Southeast Asian Nations; ASEAN countries included are
Indonesia, Malaysia, Philippines, Singapore, Thailand and Vietnam.
Source: Asian Development Bank and Clean Air Initiative for Asian Cities. 2009.
160
Millions
140
120
100
2005
80
2008
60 2015
2025
40
2035
20
0
MC-two MC-three PC LCV Bus HCV Others
ASEAN ( 6 Countries)
Figure 3. Growth of Motor Vehicles per Mode for 6 ASEAN Countries
(Indonesia, Malaysia, Philippines, Singapore, Thailand, Vietnam)
Notes:
MC-two = Motorized motorcycles
MC-three = Motorized three-wheelers
PC = Personal cars
LCV = Light commercial vehicles
HCV = Heavy commercial vehicles
Source: Asian Development Bank and Clean Air Initiative for Asian Cities. 2009.
Further to information on vehicle growth from Figures 1 and 2, new vehicle sales in the ASEAN market
10Improving Vehicle Fuel Economy in the ASEAN
July 2010
(Indonesia, Malaysia, the Philippines, Singapore, Thailand and Vietnam) totaled 1.87 million units in 2007
and reached 2 million units in 2008. About 86% of the total sales in 2008 were produced by JAMA
member companies and their ASEAN counterparts (JAMA, 2009). 5
With continued economic growth and increasing cooperation and collaboration amongst ASEAN nations,
the region is seen to play an increasingly important role in the global automobile market. In
strengthening the automobile market while promoting sustainable mobility, the ASEAN is moving towards
the abolition of regional tariffs, harmonization of automotive technical regulations, mutual recognition of
certification, streamlining of customs procedures and distribution systems, fostering of supporting
industries and human resources, promotion of safety, greater environmental protection, and other
strategies (JAMA, 2008) 6. According to the JAMA (2009), the establishment of AFTA (ASEAN Free Trade
Area) is nearing completion and there is a significant progress towards the creation of ASEAN Economic
Community (AEC).
2.2 Energy Security and Fuel Savings
Energy use in the transportation sector is an important issue in ASEAN countries especially during times
of high oil prices. The key to energy security is the sustained supply of energy at affordable prices. The
Asia Pacific Energy Research Centre defines energy security as “the ability of an economy to guarantee
the availability of energy resource supply in a sustainable manner, with the energy price being at a level
that will not adversely affect the economic performance of the economy” (APERC 2007). This definition is
deemed more relevant in the context of Asia and the Pacific because it links energy security to two
related fields: economy and environment (ADB, 2009). 7
As shown in Figure 4, the road transport sector has an increasing share of total energy consumption in
ASEAN countries. As this trend continues the impact of fuel use from the transport sector on energy
security will also become increasingly significant.
5
Japan Automobile Manufacturers Association (JAMA), 2009. Powering up hand-in-hand: Partnership in the Auto Industry
between ASEAN and Japan. Available: http://www.jama-english.jp/asia/publications/pamphlets/hand_in_hand_2009.pdf
6
Japan Automobile Manufacturers Association (JAMA). 2008. Hand-in-hand: Partnership in the Auto Industry between
ASEAN and Japan
7
ADB. 2009. Improving Energy Security and Reducing Carbon Intensity in Asia and the Pacific
http://www.adb.org/Documents/Books/Improving-Energy-Security-Reducing-Carbon-Intensity/Improving-Energy-Security-
Reducing-Carbon-Intensity.pdf
11Improving Vehicle Fuel Economy in the ASEAN
July 2010
350,000 100
% share of road transport in energy
90
energy consumption (ktoe) 300,000
80
250,000 70
consumption
200,000 60
50
150,000 40
100,000 30
20
50,000
10
0 0
1990 1995 2000 2005
% Share of Transport
Total Final Consumption
Transport Sector Consumption
Figure 4. Energy Consumption from Transport in ASEAN
Note: Data is taken from the APEC Energy Database, Figures include data for Indonesia, Malaysia, Philippines, Singapore,
Thailand and Vietnam.
Figure 5 shows the import of petroleum products by selected ASEAN Economies. Except for Thailand, for
most of the ASEAN countries fuel imports increased from 1990 to 2006. Since 2004 the dependence on
imported crude oil exceeds indigenous production in the ASEAN region (Figure 6). This will put pressure
on the ability of ASEAN governments to use financial resources for national development as these are
also needed for importing crude and processed oil.
Figure 5. Petroleum Imports of Selected ASEAN Figure 6. Crude Oil Imports in ASEAN
Countries Note: Data was taken from the APEC Energy Database.
Note: Data was taken from the APEC Energy Database Data for Indonesia, Malaysia, Philippines, Singapore,
Thailand, Singapore and Vietnam are included in the
graph.
12Improving Vehicle Fuel Economy in the ASEAN
July 2010
Given the volatility and the generally increasing global oil prices, ASEAN nations should implement fuel
economy standards to help alleviate dependence on imported crude oil and petroleum products. Even
though new technologies based on non-conventional transport fuels are continuously being developed,
these alone will not reduce dependence on imported fuel in the near term. Better vehicle fuel economy
will substantially contribute to a more efficient use of conventional transport fuels.
Figure 7 shows the projected fuel consumption and costs related to fuel economy improvement of 35%
for light-duty-vehicles and heavy-duty vehicles in 2035. Results show about 25% fuel cost savings
compared to BAU for diesel and gasoline
Figure 7. Total diesel and gasline fuel consumption and costs in 2035 under a business-as-usual
scenario
Note:
BAU = Business-as-usual
FE (LDV) = Fuel economy improvement for light-duty vehicles only
FE (HDV) = Fuel economy improvement for light-duty and heavy-duty vehicles
2.3 CO 2 Emissions from Fossil Fuel Combustion in the Transport Sector
The IEA estimated that, in 2006, the transport sector accounted for 23% of the world’s carbon dioxide
(CO2) emissions and 13% of global GHG emissions. Although the share of CO2 emissions attributable to
transport sector of developing countries is currently low, emissions are expected to increase by 45.6%
between 2005–2030. 8 Unlike traditional air pollutants that can be controlled at the ‘tail-pipe’, CO2
emissions can only be controlled by reducing fuel consumption. In order to understand the potential
emission reductions by improving fuel economy, the CAI-Asia Center as a part of this survey conducted a
8
See Bellagio Declaration on Transportation and Climate Change. Available: http://www.sutp.org/bridgingthegap/
downloads/cornie/Bellagio_Declaration_on_Transportation_and_Climate_Change-Final.pdf
13Improving Vehicle Fuel Economy in the ASEAN
July 2010
rapid assessment using existing fleet data available in various countries. It is noted that many ASEAN
countries are yet to standardize fuel consumption surveys and derive local emission factors, which may
significantly affect computations. The basic assumptions adopted in the computation are in line with FIA
50/50 assumptions:
i. 2020- 20% improvement in stock average (on-road) efficiency, reflecting both the improvements
in new car fuel economy (with some lag time for stock-turnover) and additional measures
such as eco-driving, improved aftermarket components, better vehicle maintenance, etc.
ii. 2030- 35% improvement in stock, roughly trailing new car improvements plus on-road
improvement measures.
iii. 2050- 50% (50 by 50: the Ultimate Goal) improvement in global stock average fuel economy,
following the new car improvement in 2030 and with in-use improvement measures.
Furthermore, the fleet was segregated into gasoline and diesel-fueled vehicles (neglecting alternative
fuels) and the improvement was initiated in 2012. 9 As shown in Figure 7, the impact of fuel economy on
LDVs is more pronounced in Thailand and Philippines because of the number of LDVs and the current and
estimated vehicle-kilometer traveled (VKT) from these LDVs. The CO2 reductions in 2035 range from 8%
(Vietnam) to 16% (Thailand and Philippines). CO2 estimates for Vietnam are relatively low because of the
proliferation of motorcycle use and shorter trips. The CO2 reductions from fuel economy measures for
LDVs are relatively low compared to developed countries because the VKT of LDVs in developing
countries is lower.
It is interesting to note that when fuel economy of LDVs and HDVs are taken together that the CO2
reductions increase to 26-27% by 2035. The VKT of HDVs in the ASEAN region is substantial because of
trip number and length. Most HDVs, particularly long-haul trucks and urban delivery trucks and vans, also
have lower fuel efficiency because of vehicle age and poor maintenance practices. This means that fuel
economy policies for HDVs will have a relatively large impact and it is thus preferred that fuel economy
policies cover both LDVs and HDVs would be preferred.
The timing and severity of implementing new fuel economy standards are seen as important factors in
maximizing the impacts of these standards. The ASEAN fleet renewal rate is a matter of debate as many
engines are “transferred” during their usage life to other vehicles. Assuming an approximate life of fifteen
years, even with rapid influx of new “efficient” vehicles, inefficient vehicles would dominate the fleet for
several years. As seen in Figure 7, the introduction of fuel economy standards in 2012 may result in
complete fleet renewal (conservative estimates) only in 2027. For this reason, an early introduction of
standards for new vehicles is critical.
9
Estimating the impacts of fuel economy policies and measures are difficult as it depends on various issues – like type of
vehicle sold, on road interaction, maintenance, location of use, type of operation etc. The analysis included only the
improvement of fuel economy for LDVs.
14Improving Vehicle Fuel Economy in the ASEAN
July 2010
250 250
Indonesia FE for HDV and LDV Thailand-LDV+HDV-FE
Indonesia(Reference) Thailand(Reference)
200 Indonesia FE for LDV 200
Thailand-LDV-FE
Million Tons of CO2
Million Tons of CO2
150 150
100 100
50 50
0 0
2005
2010
2015
2020
2025
2030
2035
2005
2010
2015
2020
2025
2030
2035
250 250
Philippines-LDV+HDV-FE
200 200 Vietnam-LDV+HDV-FE
Philippines(Reference)
Vietnam(Reference)
Million Tons of CO2
Million Tons of CO2
Philippines-LDV-FE Vietnam-LDV-FE
150 150
100 100
50 50
0 0
2005
2010
2015
2020
2025
2030
2035
2005
2010
2015
2020
2025
2030
2035
Figure 8. Impact of Fuel Economy Standards in selected ASEAN countries on CO2 emissions
2.4 Air Pollution
Urban air pollution is a significant issue in many developing countries, including ASEAN countries. High
concentrations of criteria air pollutants such as particulate matter (PM) pose a serious concern for public
health. The World Health Organization (WHO) estimates that 531,000 premature deaths occur annually in
developing Asian countries due to air pollution. 10
Road transport is not only a significant contributor to GHG emissions but also to criteria air pollutant
emissions. There is a variety of measures that governments can take to abate air pollution from road
transport, like developing roadmaps for implementing vehicle emissions standards. Figure 9 shows the
current and planned vehicle emissions standards for new LDVs in selected ASEAN countries. Fuel
economy measures can be integrated in a wider set of measures i.e. vehicle emission standards,
alternative fuel vehicles promotion, and strengthening inspection and maintenance standards.
Fuel economy explicitly tries to improve the efficiency of fuel combustion, and as inefficient fuel
combustion causes more air pollution, better fuel economy contributes to the overall reduction of air
pollutant emissions, albeit marginally. Experience from the US (Greene et. al, 1994) suggests that the
CAFÉ standards in the US have resulted to significant reductions of hydrocarbon emissions. 11
10
Kryzanowski. M. 2006. Why we need better air quality. Keynote presentation delivered at BAQ 2006 in Yogyakarta,
Indonesia 13-15 December 2006. Available: http://www.cleanairnet.org/baq2006/1757/propertyvalue-26669.html
11
Greene, D. et.al. 1994. Motor-vehicle fuel economy: The forgotten hydrocarbon control strategy? Available:
http://www.sciencedirect.com/science/article/B6VG7-466FHB8-5/2/0a11c5a08226c7e9c33b9447fb4bcd67
15Improving Vehicle Fuel Economy in the ASEAN
July 2010
Country 95 96 97 98 99 00 01 02 03 04 05 06 07 08 09 10 11 12 13 14 15
Indonesia Euro 2
Malaysia Euro 1 Euro 2 Euro 4
Philippines Euro 1 Euro 2 E4
a
Singapore Euro 1 Euro 2
b
Singapore Euro 1 Euro 2 Euro 4
Thailand Euro 1 Euro 2 Euro 3 Euro 4
Viet Nam Euro 2
Figure 9. Emission Standards for New Light-Duty Vehicles
Notes: Italics – under discussion; a – gasoline; b – Diesel;
Source: CAI-Asia. 2009 March. Emission standards for new vehicles (light duty). Available:
http://www.cleanairnet.org/caiasia/1412/articles-58969_resource_1.pdf
2.5 Economic impacts
The global price of crude oil has been steadily increasing in the past several years. This steady price
increase has had negative implications on ASEAN economies and has been a significant driver of fuel
subsidy increases.
Figure 10 compares the primary total energy consumption with GDP per capita. It shows how larger
ASEAN countries are still at the lower end of energy consumption and GDP per capita. In contrast, Figure
10 shows that subsidies can be as high as 70% of the fuel price. Considering the increasing share of the
transport sector on energy consumption as shown in Figure 3, this will increasingly become an important
issue for most ASEAN countries.
16Improving Vehicle Fuel Economy in the ASEAN
July 2010
12
Primary Energy Consumption per capita
10
8
(toe/capita)
6
Indonesia
4 Malaysia
Philippines
2 Singapore
Thailand
0
0 5,000 10,000 15,000 20,000 25,000 30,000 35,000
GDP per capita (Current International Dollars PPP)
Figure 10. Total Energy Consumption and GDP per Capita in Selected ASEAN Countries
Note: Data was taken from the BP Statistical Review 2009 and from the UN Data Explorer
website
Increased fuel subsidies hamper the ability of governments to fund other programs, including those
directed towards improving the lives of the poor. Consumers who benefit from these subsidies are usually
the middle and high-income classes of society. In Indonesia, for example, as much as 40% of high-income
families benefit from 70% of the fuel subsides, while 40% of the lowest income families benefit from only
15% of subsidies 12. Table 1 provides information on food and fuel subsidies of selected ASEAN countries
in 2008. 13 The Philippines and Thailand have deregulated markets for gasoline and diesel and therefore
only targeted subsidies for public transport are provided. The table suggests that the fuel subsidies in
Indonesia and Malaysia amounted to 2.9% and 2.5% of GDP respectively in 2008. In contrast, food
subsidies amounted to 0.2% and 0.7% in Indonesia and Malaysia respectively.
With high oil consumption and subsidies, fuel economy policies and measures can contribute to the
government’s efforts in energy conservation and liberalizing the pricing of fuel, thus allowing for more
investments in other key sectors, like education and health.
12
See Central Bank of the Republic of Indonesia. In one of the Indonesian government press releases in 2008, the
government acknowledged that with the price of crude oil being at USD 120/barrel for 2008, the fuel subsidy will exceed Rp
200 trillion. Available:
http://www.bi.go.id/web/en/Publikasi/Investor+Relation+Unit/Government+Press+Release/Fuel+Subsidy.htm
13 rd
United Overseas Bank Quarterly Global Outlook 3 Quarter 2008
17Improving Vehicle Fuel Economy in the ASEAN
July 2010
Table 1. Fuel and Food Subsidies in selected ASEAN Countries in 2008
% of GDP Total Subsidy % of Total Fuel Food Remarks
Expenditure
Malaysia 3.3% 13% 2.6% 0.7% Based on prices after June 2008
hike
Indonesia 2.9% 13.7% 2.7% 0.2% Fuel prices were raised in late
May 08
Philippines 3.6% 4.3% 0.2% 3.4% Fuel subsidy for public transport
sector for 3 months starting
April 2008, and cut import
duties on oil
Thailand 0.9% 2.5% 0.8% 0.1% Diesel subsidy for 3 months
ending July 2008, subsidy for
rice farmers to raise production
Singapore 0 0 0 0
Source: UOB, 2008
100
90
80
70 Gasoline
60 Diesel
50 Kerosene
40 LPG
30 Light Fuel Oil
20 Heavy Fuel Oil
10 Natural Gas
0
Source: IEA Analysis in WEO 2006
Figure 11. Consumption Subsidy as % of Reference Energy Price in Selected ASEAN
Countries in 2005
Source: IEA Analysis in World Energy Outlook 2006
18Improving Vehicle Fuel Economy in the ASEAN
July 2010
3 BRIEF REVIEW OF FUEL ECONOMY STANDARDS AND CO-BENEFITS
3.2 Review of Fuel Economy Standards
Over the years, many countries have initiated different fuel economy schemes. Figure 12 compares the
initiatives, proposals and standards on an “equal basis” 14 and shows that Japan and Europe lead in
restricting the growth of emissions through fuel economy. However, strengthening standards in China
may result in the highest reductions in CO2, considering the sheer growth of vehicles in China in the next
decade.
Figure 12. Actual and Projected CO2 Emissions for New Passenger Vehicles by Country/
Region, 2002-2020
15
Source: ICCT
The success and failures of these various schemes provide useful case studies for the ASEAN. Table 2 gives
examples, borrowing insights from leading institutions and researchers. 16 A comprehensive review of
these various experiences and policies are provided by IEA 17.
14
When comparing different countries, it is important to normalize the drive cycles. Different countries have different
driving behaviors, road types and location and topography. Though, different test cycles are used in U.S., E.U. and Japan,
14
EU NEDC is preferred by many countries . Interesting to note is that UN-ECE/WP29 is looking at harmonized test cycle
15
See http://www.theicct.org/documents/ICCT_PVStd_May09.ppt
16
The complete list of documents for detailed reading can be found at
http://www.cleanairnet.org/caiasia/1412/propertyvalue-26861.html
17
Transport, Energy, and CO2 study of the IEA (2009), Chapter 4, Light-duty vehicle efficiency: policies and measures
19Improving Vehicle Fuel Economy in the ASEAN
July 2010
Table 2. Brief overview of experiences from selected fuel economy initiatives
Country/Region Summary
Australia The Federal Chamber of Automotive Industry first established voluntary fuel economy standards
for new vehicles sold in Australia in 1978. In 2003, FCAI members committed to a voluntary
target of 6.8L/100km for petrol passenger cars by 2010. This represents an 18% improvement in
the fuel efficiency of new vehicles between 2002 and 2010.
Canada Canada has a long history of voluntary agreements with the auto industry, which the
government and industry initiated in the late 1970s to avert legislation. The initial program was
designed to provide information on fuel consumption rates to consumers, and to improve the
fuel efficiency of new vehicle fleets.
In November 2007, a law was passed to enhance the Canadian federal government’s authority
to regulate vehicle fuel efficiency, and regulations will take effect in 2011. The new mandatory
fuel standards for cars and light trucks will be harmonized with current and future US fuel
regulations aimed at curbing carbon emissions.
China China’s National Development and Reform Commission announced in 2004 that it would
introduce mandatory fuel efficiency standards for passenger cars. The standards are initially
classified into 16 categories based on vehicle weight. Standard values are set for each category.
In addition, there are different standard values for manual transmissions and automatic
transmissions. Compared with the Japanese regulation, which also has weight based categories,
the Chinese standards tend to be more stringent for heavier passenger cars than lighter ones.
Many considerthe Chinese standards to be the third most stringent globally. Interesting to note
is that it does not differentiate based on fuel, but by weight. In 2006, excise tax on vehicles to
provide a stimulus for sales of small-engine vehicles. In 2009, China announced that it will target
a fleet wide average of 42.2 miles per gallon by the year 2015. In June 2010, the government
approved subsidies for 16 car manufacturers to produce fuel efficient cars. Per car, 3,000 yuan
will be granted if it is proven that they save at least 20% fuel.
European Union In 1998/1999, the EU reached a voluntary agreement with the European Automobile
Manufacturers Association, JAMA and KAMA to work towards a target of 140 g CO2/km for
passenger cars. Reports suggest that emissions from the average new car sold reached 163 g
CO2/km in 2004. Since the measure had limited success, in June 2007, the Council of
Environment Ministers formally adopted a resolution on mandatory targets for passenger cars
of 120 g CO2/km by 2012. This target would be met through an “integrated approach”, whereby
car manufacturers would achieve 130 g/km through technical improvements in vehicles and
engines and the remaining reduction of 10 g/km would be achieved through other measures.
India India’s fuel economy standards are taking longer to develop because of institutional
arrangements. In 2007 the Bureau of Energy Efficiency (BEE) and the Petroleum Conservation
Research Association raised the idea of fuel economy standards in India. Government
departments debated on which department should take the lead and whether India should
develop CO 2 based standards or should a have mandatory or voluntary fuel labeling scheme.
After the Prime Minister’s office intervention, it was decided that implementation of mandatory
fuel economy standards and fuel efficiency labeling for cars are needed to strengthen India’s
energy security. The Bureau of Energy Efficiency (BEE), an autonomous energy regulator under
the Ministry of Power, were given the responsibility to develop the standards and labels. The
Ministry of Shipping Road Transport and Highways (MoSRTH) will enforce these regulations. In
January 2010, the Ministry of Environment and Forests announced that mandatory fuel
efficiency standards will be introduced by the end of December 2011.
Japan Regulatory “Top Runner” standards and the mandatory display of energy efficiency values were
enabled in 1998. The standards have been introduced for LDVs (1999), LPG vehicles (2003) and
HDVs (2006). It is also mandatory to ensure labeling of vehicles. The standards can be
considered as effective as there is a strong disincentive for the customers in the form of
progressively higher taxes levied based on the gross vehicle weight and engine displacement of
automobiles when purchased and registered.
20Improving Vehicle Fuel Economy in the ASEAN
July 2010
Country/Region Summary
South Korea The Average Fuel Economy program and fuel economy rating identification of motor vehicles
were introduced in 2005. The reference average fuel economy standards are 12.4 km/l for
vehicles with engine displacement of 1500cc or less, and 9.6 km/l for displacement exceeding
1500cc. Fuel economy standards were set for domestic cars in 2006 and imported cars in 2009 if
sales are less than 10,000. If sales of imported cars exceed 10,000 then these must meet US
CAFÉ standards
United States The US unveiled revamped national policy aimed at both increasing fuel economy and reducing
greenhouse gas pollution for all new cars and trucks sold in the United States in May 2009. The
new standards, covering model years 2012-2016, and ultimately requiring an average fuel
economy standard of 35.5 mpg in 2016, are projected to save 1.8 billion barrels of oil over the
life of the program with a fuel economy gain averaging more than 5 percent per year and a
reduction of approximately 900 million metric tons in greenhouse gas emissions. This would
surpass the CAFE law passed by Congress in 2007 required an average fuel economy of 35 mpg in
2020. In May 2010, announcements were made by the US government on introducing stricter
fuel economy requirements for trucks.
Sources: IEA (2008), and other research and news reports
From the perspective of the developing Asian countries, it is perhaps most relevant to look at the scheme
employed by China and the benefits that arose from it. Calculations show that China will conserve
around 2.3 billion liters (equivalent of 1.7 million tons) of gasoline per year after the implementation of
its fuel economy standards. 18 In 2006 alone, avoided gasoline consumption was about 1.3 billion liters.
Moreover, gasoline demand was cut by almost 2% with expense savings due to avoided gasoline purchase
equivalent to about 10 billion RMB. It is interesting to note that this improvement was made against
international market trends (such as increasing vehicle weight and power) and tightening environmental
and safety standards. These savings from fuel economy improvements would rise over time as
motorization levels in Chinese cities continue to rapidly increase.
It can be expected that the developments of fuel economy standards as well as technological
developments in vehicle manufacturing in China will influence the development of standards, the
adoption of more fuel efficient technologies and thus the overall fleet fuel economy in ASEAN countries.
As China is a major trade partner of ASEAN, China will also affect the ASEAN vehicle fleet through export
of Chinese made cars to ASEAN countries. This is less the case for India as standards are yet to be
mandated, however, technological developments, especially with regards to the Nano car by TATA as this
is a small affordable car that is relatively fuel efficient, will likely be of influence to fuel economy
developments in the ASEAN.
3.3 Co-benefits of Fuel Economy
Although fuel savings would provide co-benefits such as reduced air pollution, the extent of co-benefits
would depend on of the stringency of fuel economy standards and incentives provided. As the ASEAN is
tightening its fuel quality and vehicle emissions standards, it would be helpful if the member countries try
to link air pollution mitigation efforts with fuel economy initiatives. This could result in faster adoption of
fuel economy policies and measures and would allow for maximization of air pollution reduction.
18
Oliver, H.H., et al., 2009. China’s fuel economy standards for passenger vehicles: Rationale, policy process, and
impacts. Energy Policy (2009), doi:10.1016/j.enpol.2009.06.026.
21Improving Vehicle Fuel Economy in the ASEAN
July 2010
The DIESEL project 19 quantified the emission factors for Bangkok and derived benefits for various
policies. It showed that simple measures influencing inspection and maintenance and preventive
maintenance can reduce both air pollutants and GHG emissions. Including inspection and maintenance
policies to supplement fuel economy policies is particularly important as many researchers have observed
significant drops in fuel economy values over the period of usage.
It can be argued that the co-benefits of fuel economy measures may not be substantial (or even that
there may be little rebounds due to improper implementation) from a traffic congestion, noise pollution
and road safety perspective. However, considering the high potential impact of fuel economy on vehicle
purchase choice, if “incentives” provided to buy fuel efficient cars (e.g. subsidies and taxes) are linked
with low emission cars, the benefits will be maximized. Another argument to link fuel economy policies
with fuel quality and vehicle emissions policies is to address the concern that particulate matter, NOX and
other emissions would increase if drivers decide to drive more because the reduced fuel costs per km
driven makes this affordable. Finally, as the ASEAN fuel market is volatile and imperfect as described
earlier, designing fuel economy standards in conjunction with broader fuel policies most importantly in
the form of reduced fuel subsidies, would allow financial savings to be directed to social programs such as
education and health.
From the ASEAN region, some of the best examples for promoting co-benefits of fuel economy measures
are found below. Other examples in ASEAN Countries are provided in Annex 2.
• Promoting Green Vehicles in Singapore – To encourage the purchase of hybrid and compressed
natural gas (CNG) vehicles a Green Vehicle Rebate (GVR) was introduced in 2001. The GVR was
further enhanced in December 2005, providing green vehicles an Additional Registration Fee
(ARF) rebate of 40% of the Open Market Value (OMV) of the car, up from 20%. Since the
enhancement of the rebate, which is valid until 2009, the number of green vehicles has increased
substantially from about 140 in 2005 to more than 1500 by end of 2007. The resulting change in
fleet composition has a major impact on fuel economy and air pollutant emissions.
• Eco car in Thailand – An “Eco car” meets minimum pollution standards of Euro 4 or higher and
emitting no more than 120 g CO2/km. To promote the sales of fuel efficient cars, the Ministry of
Finance put in place a tax incentive scheme which reduces the excise tax rate on standard
passenger cars that meet fuel-efficiency criteria, and qualify as eco cars. Starting from October
2009, the excise tax rate for eco cars was cut from 30% to 17%. Cars eligible for the 17% tax rate
must have an engine size of not more than 1,300 cc for gasoline engines and not more than 1,400
cc for diesel engines.
19
Developing Integrated Emission Strategies for Existing Land Transport (DIESEL). See
http://www.cleanairnet.org/caiasia/1412/article-48845.html#h2_11
22Improving Vehicle Fuel Economy in the ASEAN
July 2010
4 THE ASEAN AND ITS TRANSPORT INITIATIVES
The ASEAN, as a bloc, is strengthening its transport and environment cooperation with international and
regional organizations and also among its member countries. Increasingly, ASEAN countries are looking at
the transport issue from a holistic perspective.
Fuel economy provides a unique opportunity for ASEAN member countries to learn from existing policies,
institutional arrangements and strengthen the emission measurement knowledge and capacity. This
section describes the key institutional and policy frameworks that exist in the ASEAN region.
The Association for Southeast Asian Nations (ASEAN) was formed in August 1967 as a mechanism to
promote regional cooperation in Southeast Asia. Transport has been one of the key sectors discussed by
governments under ASEAN since its establishment. The initial framework for improving the transport
regional infrastructure was established during the period 1999-2003 by the ASEAN Transport
Cooperation, which focused on the development of the trans-ASEAN transportation network, finalization
of the ASEAN transport facilitation agreements, capacity building programs, policy-development projects
and studies, and mutual sharing of best practices and experiences.
Environment was, however, not an important part of the initial discussions in ASEAN on transport.
However it received major impetus during the Ninth ASEAN Transport Ministers (ATM) Meeting in Yangon
(2003) which formulated the Transport Policy Agenda for 2005-2010. One of the actions in the Transport
Policy Agenda stated that: "Environmentally sustainable regional transport strategies, including accession
to the relevant international conventions and protocols, promotion of environmental-friendly
transportation technology and transportation modes." 20
ASEAN, at the 13th ASEAN Summit in Singapore (2007), adopted the ASEAN Declaration on
Environmental Sustainability. 21 This declaration recognized the adverse impacts of climate change
caused by global emissions of greenhouse gases, particularly to the developing countries. The declaration
emphasized that the ASEAN would, amongst others:
• Work through bilateral, regional and global partnership to promote the development and
transfer of low carbon technologies including cleaner and climate friendly technologies.
• Work with international financial and development cooperation institutions to encourage
innovative financing options to stimulate investment in climate-friendly technology and
development.
ASEAN representatives, along with other international delegates participated in the fourth regional
Environmentally Sustainable Transport (EST) forum in Seoul in 2009, organized by the United Nations
Centre for Regional Development (UNCRD). The meeting contributed to the Seoul Statement which
suggested to:
20
ASEAN Transport Action Plan 2005-2010. Available:http://www.aseansec.org/16596.htm
21
ASEAN Declaration on Environmental Sustainability. Available: http://www.aseansec.org/21060.htm
23You can also read