STOP DIGGING The Silvertown tunnel is in a hole, so
←
→
Page content transcription
If your browser does not render page correctly, please read the page content below
The Silvertown Tunnel is in a hole, so STOP DIGGING

Transport Action Network
Stop the Silvertown Tunnel Coalition
Speak Out Woolwich
Extinction Rebellion Greenwich

The Silvertown tunnel is in a hole, so

STOP DIGGING
June 2020

Campaigners against the Silvertown Tunnel – with masks to show the air pollution it would cause – at City Hall,
June 2019

                                                       1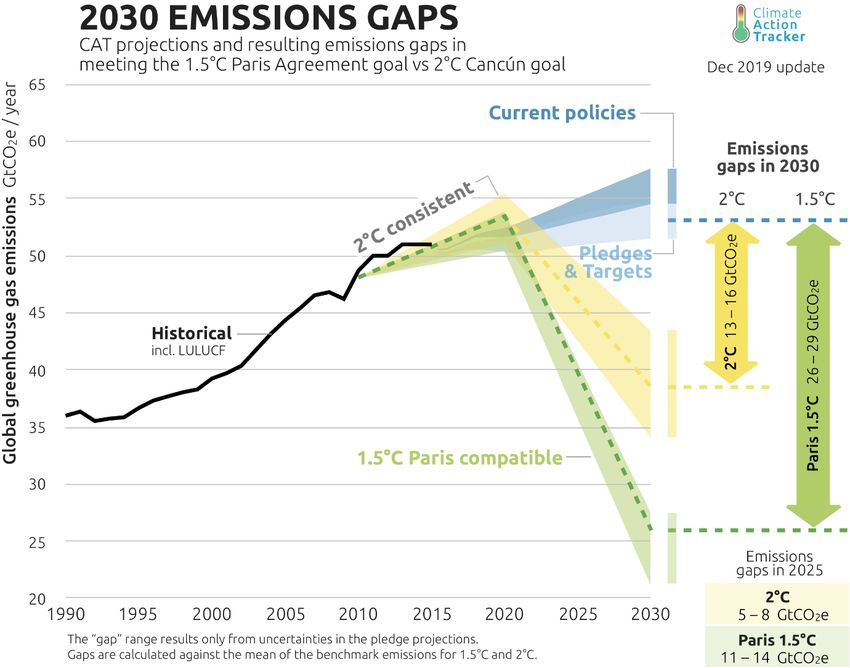
The Silvertown Tunnel is in a hole, so STOP DIGGING

Executive Summary
The proposed Silvertown tunnel would be a twin-bore road tunnel under the River Thames in
east London, linking Silvertown with the Greenwich peninsula, near to the existing twin-bore
Blackwall Tunnel. A contract to design, build, finance and maintain the tunnel, widely
reported to be worth £1.2 billion, was awarded by Transport for London (TfL) in November
2019 to the RiverLinx consortium, comprising Aberdeen Standard Investments, BAM group,
Cintra (a subsidiary of Ferrovial), Macquarie Capital and SK Engineering & Construction.1
The tunnel is the largest current infrastructure project supported and ultimately funded by the
Greater London Authority (GLA), of which TfL is a statutory body, and the Mayor of
London, who has political authority over it. The GLA claims that the tunnel will reduce
traffic congestion around the Blackwall tunnel; reduce the number of closures and incidents
in and around the tunnel; and provide for improved public transport links including cross-
river bus services. It says that the tunnel will reduce the environmental impact of traffic
congestion, and produce economic effects such as improving journey times, “improving
access to new markets and new homes” and “creating opportunities for new jobs”.2
Opposition to the tunnel project has been voiced by residents’ groups, political parties and
others, before and during public consultations in 2014-15, on the grounds that there were
better ways to support public transport, and that it could worsen, rather than alleviate, traffic
congestion and air pollution problems. The borough councils of Lewisham, Southwark,
Newham and Hackney have opposed the scheme.
The scheme has come under fresh scrutiny for two reasons:
First, in December 2018 the Mayor of London, along with other local authorities and the UK
parliament, declared a “climate emergency”. Local groups opposed to the tunnel demanded
that the tunnel project be reappraised in the light of this emergency.3 The Mayor, the GLA
and supporters of the project responded by saying it would have a neutral, or even positive,
effect on London’s greenhouse gas emissions.
Second, the Covid-19 pandemic has produced unprecedented changes in transport practices
during the lockdown, an unprecedented shake-up of transport policy at government and local
level, and now requires a revision of projections of future transport trends.
This report starts with an introduction, summarising policy issues arising from the Covid-19
pandemic, which reinforce the case for cancelling the Silvertown tunnel. The report also:

1TfL published on line a redacted version of the project agreement in May 2020.
. TfL raised the estimated
cost of the tunnel from £1 billion to £1.2 billion in the Contract Award Notice, published on 5 March 2020.

2; Silvertown Tunnel: the case for
the scheme (April 2016), pp. 47-73. The documents cited in this report are those drawn up by Transport for London to
support the proposed scheme, available on its web site. There was an inquiry into the project by the Infrastructure
Planning Inspectorate, completed in April 2017. The inspectorate required some minor amendments to the scheme, and
approval was then given by Chris Grayling, the transport secretary, in May 2018. Documents submitted to the inquiry by
TfL, and by groups opposing the scheme, are stored on the inspectorate’s web site:
.
3,

                                                           2
The Silvertown Tunnel is in a hole, so STOP DIGGING
■ Examines the evidence of the tunnel project’s probable effect on greenhouse gas
emissions and air pollution; and finds that the tunnel would likely increase, rather than
decrease, greenhouse gas emissions, and would also likely, at best, redistribute air
pollution rather than decrease it (part 1);
■ Examines the GLA’s argument, central to its case for the tunnel, that it would not
cause ‘induced traffic’ (the effect, analysed in transport research, that more roads
produce more traffic), and finds this claim to be false (part 2);
■ Shows, with reference to research conducted at the Tyndall Centre for Climate
Research, that the tunnel project is incompatible with the targets for climate action
associated with the 2015 Paris accords, a finding that potentially puts the scheme at
odds with the recent Appeal Court ruling on Heathrow Airport expansion (part 3);
■ Reviews the GLA’s transport and environment strategies, which form the policy
context for the tunnel project, and argues that these need to be strengthened with
investment in public transport and non-car modes, not weakened with big road projects
(part 4);
■ Shows that the tunnel project, like many big road projects, would widen, rather than
narrow, social inequalities (part 5);
■ Argues that the tunnel project is incompatible with the GLA’s claim that London is
leading internationally on climate change, and that the project manifests double
standards on climate policy (part 6); and
■ Points out that the assumptions on traffic demand growth that are key to the tunnel
project need to be re-examined in the light of the Covid-19 pandemic (part 7).
The report concludes with recommendations that the tunnel project be scrapped, and transport
policies be directed to effectively reducing greenhouse gas emissions and helping Londoners
on lower incomes enjoy the best possible mobility.
3The Silvertown Tunnel is in a hole, so STOP DIGGING
Introduction: Covid-19 has changed the transport
policy outlook
In April, during the lockdown, UK road traffic volumes were down by more than 60%; in
London, bus usage fell by more than 80% and underground train usage by more than 90%.4
Bicycle usage soared – in some places by 70%, the government estimated.
The government and the Mayor of London reacted with short-term measures to support
walking and cycling. On 9 May the government announced a £250 million “emergency active
travel fund” to support pop-up bike lanes, wider pavements and safer junctions, part of a
larger £5 billion programme announced in February. The Mayor of London announced a
Streetspace plan “to accommodate a possible ten-fold increase in cycling and five-fold
increase in walking when lockdown restrictions are eased”.5
Both government and the GLA acknowledge this as an opportunity to change transport policy
long-term. Grant Shapps, the Transport Secretary, stated, in a preface to updated statutory
guidance for local authorities:6
We recognise this moment for what it is: a once in a generation opportunity to deliver a
lasting, transformative change in how we make short journeys in our towns and cities.
At the same time, the Department for Transport has started a consultation on decarbonising
the transport sector. Its report, published in March, acknowledged for the first time that
reductions in traffic will be needed; it designates as a priority supporting fewer car trips
“through a coherent, convenient and cost-effective public network”.7
However, there is an enduring contradiction in transport policy. These measures, which could
reduce car use, especially in some city locations, run alongside other policies that could
increase car use overall. At London level, City Hall is pressing on with the Silvertown Tunnel
project. At government level, the second phase of the Road Investment Strategy, which
provides for £27.4 billion of infrastructure spending between now and 2025, was launched in
March: a legal challenge to it is being prepared by the Transport Action Network, using the
precedent of the recent Court of Appeal decision against the Heathrow airport expansion.8
Covid-19 has brought the transport system to a crossroads: which way is taken depends on
policy. Specialist transport researchers have made this point as the scale of opportunity
opened up by the pandemic has become clear. Professor Phil Goodwin, one of the UK’s
leading transport researchers, has written that Covid 19 had boosted both “a return to the
4 Cabinet Office Briefing Rooms presentation, 26 April, slide on Transport Use Change
5“Back to work: ‘capacity of transport network will be down by 90%”, The Guardian, 9 May 2020; “Mayor’s bold new
Streetspace plan will overhaul London’s streets”, GLA web site, 6 May 2020
6
7 Department for Transport, Decarbonising Transport: setting the challenge (March 2020)
8 Department for Transport, Road Investment Strategy 2: 2020-2025. Presented to parliament pursuant to section 3 of the
Infrastructure Action 2015 (March 2020);
4The Silvertown Tunnel is in a hole, so STOP DIGGING
local provision of [transport] services, and great attention to short distance travel”, and also
“car dependence” and illusions about “a large expansion of road capacity”:9
So we are living in the middle of the largest, swiftest changes in travel behaviour ever
seen, and that has opened up futures of simultaneous inconsistent trends. [...] This does
not mean that we are uncertain about whether one or the other direction will be taken.
The near certainty is that they both will. The uncertainty is which will win, and where,
and that is about policy, not forecasting.
The contention of this report is that Silvertown tunnel construction, like the government’s
road investment strategy, would help reinforce car dependence, potentially undoing the effect
of measures to encourage cycling and walking.
The pandemic has had two other results that require the Silvertown tunnel project to be
rethought. First, it has triggered an economic recession that will oblige government at all
levels to reconsider investment priorities. Second, the rapid changes in work and transport
practices during the lockdown are counteracting economic drivers towards car dependence.
Some demand for car journeys, for road space, and for cars, will be permanently reduced.
This has already resulted in calls for the government’s road programme to be scrapped. Chris
Stark, chief executive of the UK Committee on Climate Change, has said that traffic volumes
are likely to decline over the long term, and that “I would spend the roads budget on fibre”, to
improve the broadband network. Edmund King, president of the AA, has also said that
infrastructure funds might be better spent on broadband to support home working, as the AA
now predicts a permanent reduction in demand for road travel.10
These arguments for diverting funds away from road infrastructure may also be applied to the
Silvertown tunnel.
9Phil Goodwin, “Transport appraisal and planning in a time of imperatives”, TransportXtra, 15 May 2020. For other
relevant views from transport specialists see: Matthew Taylor, “A new normal: how coronavirus will transform transport in
British cities”, The Guardian, 18 May 2020
10“Climate change: switch road cash to broadband, adviser says”, BBC News, 21 April 2020; Roger Harrabin, “Coronavirus
will transform UK work and travel, says AA”, BBC News, 3 April 2020
5The Silvertown Tunnel is in a hole, so STOP DIGGING
1. The tunnel would increase, not decrease,
greenhouse gas emissions and air pollution
The GLA and the London Mayor’s office have said repeatedly that the tunnel project is (i)
compatible with “zero carbon” goals, and would not cause an increase in carbon emissions,
and (ii) would result in “an overall improvement in air quality”. These claims are
demonstrably false.
The GLA’s arguments were set out by Heidi Alexander, Deputy Mayor for transport, in a
letter to Victoria Rance of the Stop the Silvertown Tunnel coalition.11 The Deputy Mayor
argued that construction of the Silvertown tunnel, and its use by buses, would ensure that:
[C]ongestion [in and around the Blackwall and Silvertown tunnels] will effectively be
eliminated. [...] The user charges will ensure overall traffic volumes and associated
carbon emissions do not increase, and air quality will actually be improved overall. [...]
Further on she wrote:
Addressing climate change is a clear priority for the Mayor and TfL. We are doing
everything in our power to address the climate emergency and achieve our zero carbon
goals across a range of policy areas. By radically improving traffic conditions and
effectively eliminating congestion, the delivery of the Silvertown Tunnel will see no
increase in carbon emissions and an overall improvement in air quality [my emphasis,
SP]. [...]
In response to campaigners’ proposals that a new carbon impact assessment of TfL’s
transport policy was needed, in the light of the climate emergency, Deputy Mayor Alexander
wrote:
London’s 1.5C trajectory has been developed using detailed bottom up modelling of the
carbon emissions from transport and buildings and other sectors, and takes into account
planned developments such as the Silvertown tunnel and London wide policies such as
ULEZ.
The new user charging scheme being introduced will ensure that the Silvertown tunnel
does not result in increased operational carbon emissions as the total number of
vehicles crossing the Thames is not forecast to increase. Silvertown tunnel will not
undermine the overall carbon reduction required across the wider transport sector from
either direct emissions or when factoring in embodied carbon.
The claim that the scheme will not increase carbon emissions has been repeated by other
supporters of it. For example, Greenwich Labour councillor Denise Scott-McDonald has
stated, in answer to a public question, that the tunnel would relieve congestion at peak times,
and that:
This queuing traffic emits significantly more pollution and greenhouse gas. By
smoothing traffic flow, it is anticipated that the new tunnel will reduce emissions. This
11Letter from Heidi Alexander to Victoria Rance, 30 May 2019. Reference MGLA140519-2589. The full correspondence is
available from the Stop the Silvertown Tunnel Coalition on request
6The Silvertown Tunnel is in a hole, so STOP DIGGING
effect will be combined with user charging, to stop the tunnel generating unnecessary
new trips.12
These statements ignore four possible effects of increasing road capacity through the
construction of the scheme.
1. Construction of the tunnel would have a considerable carbon impact. The materials
required would have embodied greenhouse gas emissions, estimated in the project’s
Environmental Impact Statement at 82,077 tonnes of CO2 equivalent – around the same as
7000 trips of 900+ km each by a Boeing 737-400.13 To this should be added the emissions
impact of transportation and waste during construction,14 and of other construction associated
with the tunnel, such as additional road construction, lorry parks, and so on.
2. If the tunnel becomes operational, the overwhelming body of evidence indicates that it
would contribute to an overall increase in car usage, and traffic volumes, in London. The
confidence with which the Deputy Mayor asserts that “user charges will ensure overall traffic
volumes and associated carbon emissions do not increase”, “the new user charging scheme
[...] will ensure that the Silvertown tunnel does not result in increased operational carbon
emissions” is not justified by TfL’s forecasting, which neither takes proper account of
induced traffic, nor deals with the larger context by which the total volume of traffic is
determined (see section 2 below).
3. The modelling to which the Deputy Mayor refers, on which London’s 1.5deg C trajectory
is based, falls short of any meaningful interpretation of the 1.5 degree target, as is shown by
research conducted at the Tyndall Centre for Climate Change Research (see section 3 below).
The urgency highlighted by the Tyndall centre – that, if emissions continue at the 2017 rate,
Greater London’s “carbon budget” (the amount of carbon it can emit while helping to avoid
dangerous global warming) will be entirely exhausted by 2027 – is absent from the GLA’s
approach. The GLA’s transport strategy implicitly rejects a robust effort to reduce the number
of cars and car journeys, and the overall volume of traffic. This point is developed in section
4 below.
4. By adopting a “climate emergency”, the GLA has made a commitment to urgent action to
tackle climate change. To proceed with a £1.2 billion project that, in the very best case, will
cause significant greenhouse gas emissions – and in the worst case, will contribute to a spiral
of more roads and more traffic that is a key driver of rising emissions – is not in keeping with
this commitment. The arguments made in support of the tunnel feed in to a political discourse
that responds to the climate emergency with rhetoric while continuing with business as usual
policies.
The GLA’s arguments on local air pollution are similar to those on greenhouse gas emissions.
There are differences, because of the local, as opposed to global, nature of the problem.
Construction of a second tunnel nearby the Blackwall tunnel could, at least temporarily,
reduce the volume of slow-moving traffic at the Blackwall tunnel’s entrances. This could, at
12Royal Borough of Greenwich, Public Questions to council meeting of 26 June 2019, question from Matt Browne, SE10.
See minutes, pp. 7-8
13Silvertown Tunnel Environmental Statement (April 2016), Table 13-12, pp. 13-44 and 13-45. According to the Carbon
Independent web site, a Boeing 737-400 would use about 3.61 tonnes of fuel making a 926-km flight; this would produce
11.37 tonnes of CO2 equivalent in emissions.
14Silvertown Tunnel Environmental Statement, section 13.7 deals with these issues but without giving carbon emissions
estimates
7The Silvertown Tunnel is in a hole, so STOP DIGGING
least temporarily, reduce the severe air pollution in one location. Even here there are doubts,
though, because, as research at Portland State University has shown, “congestion mitigation
does not inevitably lead to reduced emissions”, and that smoother-moving traffic can increase
the level of pollutant emissions.15
Beyond that, because the Silvertown project is likely to stimulate induced traffic, it is likely
that it will also, inevitably, aggravate London’s air pollution problem. This at a time when
Newham and Greenwich, boroughs directly affected by the tunnel, have among the highest
level of PM2.5 particulates in the UK. The impact on Newham should be of particular
concern: it has among the highest proportions of black, Asian and minority ethnic people, and
among the highest levels of poverty, in the UK. Research supported by the British Heart
Foundation showed that – shortly prior to the Covid-19 lockdown, which temporarily reduced
pollution – levels in Newham were highest in the country, and Newham and Greenwich were
among the boroughs where the levels exceeded legal limits.16
Possible impact of Heathrow judgement
It is possible that the role of major road projects in adding to the UK’s greenhouse gas
emissions could be tested in court. Following the Court of Appeal decision against Heathrow
airport expansion, on the grounds that aviation planning policy had failed to take climate
targets into account, transport campaigners have been consulting with lawyers about whether
a similar challenge could be mounted to the National Networks National Policy Statement,
the policy framework for road schemes. After the judgement, the Transport Action Network
stated:
We think the NNNPS is challengeable on the same grounds as Heathrow. Whilst we
have an outdated NNNPS and a biased appraisal process, we will see more
roadbuilding and rising emissions from road transport. It is critical that the NNNPS and
the Department for Transport’s appraisal system are both updated to reflect the
government’s commitment to net zero emissions by 2050, and the importance the
public attach to tackling climate change.17
It is clear that the transport policy context in which the Silvertown Tunnel was approved has
changed, and is changing further. The Silvertown Tunnel decision is certainly out of date and
probably flawed. For this reason, the GLA should pause and review the decision.
15A. Bigazzi and M. Figliozzi, “Congestion and emissions mitigation: a comparison of capacity, demand and vehicle based
strategies”, Transportation Resarch Part D: Transport and Environment 17:7 (October 2012), pp. 538-547
16“Newham has ‘most toxic air in the UK’, study finds”, The Londonist, 3 February 2020; “Research highlights 2019 –
December: effect of air pollution likened to smoking”, BHF web site
17 Transport Action Network, “The road to tackling climate change”, 2 March 2020
8The Silvertown Tunnel is in a hole, so STOP DIGGING
2. The tunnel, if built, will cause induced traffic
In order to sustain the claim that the Silvertown tunnel project will not add to London’s
greenhouse gas emissions, the GLA and Mayor of London claim that it will not add to the
city’s total volume of traffic. This contradicts a substantial body of research, conducted over
many decades in various countries, on the “induced traffic” effect: simply put, that more
roads produce more traffic.
The GLA’s political leaders say that the proposed user charge will cancel out “induced
traffic”. But the research conducted by TfL does not support this conclusion. Firstly, TfL has
presented its modelling of scenarios, in which the tunnel would not substantially increase
traffic volumes, with numerous caveats. Secondly, the modelling uses assumptions that
appear to have perversely minimised the induced traffic effect. Thirdly, no account has been
taken of the real experience of other projects that use road charges.
Given the body of research on induced traffic, the limited help provided by the modelling, the
real experience of other projects with road charging, and the climate emergency, confident
assertions that the project will not add to London’s total volume of traffic are foolhardy.
In this section, (a) “induced traffic”, (b) other projects with user charges, and (c) the GLA’s
research, and claims based on it, are reviewed.
(a) Induced traffic
Historically, the largest body of research on induced traffic has been in the USA, where large-
scale car use and traffic jams emerged in the 1940s, decades ahead of the rest of the world.
One recent summary of the research stated:
[W]hen more lane-miles of roads are built, more miles are driven, even more so than
might be expected by ‘natural’ increases in demand, like population growth. In other
words, the new lanes may immediately bring relief to those who wanted to use the
highway before, but they will also encourage those same people to use the highway
more […] and they will bring new drivers onto the highway, because they suddenly find
it a better deal.18
Research on induced traffic has shown that new road projects, designed to minimise
congestion, release “latent demand”, i.e. journeys that would not otherwise have been made.
As a group of US researchers wrote:
Since the real constraint on driving is traffic, not cost, people are always ready to make
more trips when the traffic goes away. The number of latent trips is huge – perhaps
30% of existing traffic. Because of latent demand, adding lanes is futile, since drivers
are already poised to use them up.19
A further complexity relates to the Braess paradox, a mathematical formula: adding a new
road can actually produce not only more traffic, but more congestion. 20 This is because if
18 Tom Vanderbilt, Traffic (London: Allen Lane, 2008), p. 155
19
Andres Duany, Elizabeth Plater-Zyberk and Jeff Speck, Suburban Nation: the rise of sprawl and the decline of the
American Dream (New York: North Point Press, 2000), p. 91
20 Vanderbilt, Traffic, p. 159
9The Silvertown Tunnel is in a hole, so STOP DIGGING
more roads are built, it becomes individually more time-saving for people to use them, even
going longer distances.
In 1994, the UK government commissioned a study to verify the induced traffic effect and
consider its consequences. It concluded:
[I]nduced traffic can and does occur, probably quite extensively, though its size and
significance are likely to vary widely in different circumstances.21
A further study, published in 1998, confirmed not only that more roads produce more traffic,
but also that the opposite is true: fewer roads reduce the amount of traffic, an effect named
“disappearing traffic”. Follow-up research recommended ways of reducing road space and re-
using it for a range of policy objectives.22
The authors of this study made significant comments on how “induced traffic” and
“disappearing traffic” are analysed. They cautioned, first, that a range of social, economic and
behavioural factors had to be taken into account that defy simple analysis; and, second, that
“simple before-and-after aggregate traffic counts, separated by a few months” could not
satisfactorily detect these phenomena, because behavioural changes triggered by changes in
the road network continued over lengthy time periods.23 These are exactly the sort of errors
that appear to have been made by TfL in assessing the likely impact of the Silvertown tunnel.
Twenty years later, in 2018, the Department for Transport commissioned a report by the
consultants WSP and Rand24 to test the conclusions of these earlier reports in the light of new
evidence. This report concluded that “induced demand continues to occur and may be
significant in some situations”; the evidence reviewed “supports the findings of the SACTRA
(1994) report that induced traffic does exist, though its size and significance is likely to vary
in different circumstances”.
The 2018 report said it “was not possible to obtain any qualitative understanding about the
composition of induced traffic in terms of new trips, redistributed trips, transfers between
modes and trips associated with new developments”. This caution strikes a contrast with
TfL’s claims that the Silvertown Tunnel would evade the induced traffic effect. Moreover,
among the report’s “tentative conclusions” was: “Induced demand is likely to be higher for
capacity improvements in urban areas or on highly congested routes.” This throws further
doubt on the claim that the Silvertown Tunnel would not produce induced traffic.
(b) The effect of user charges
TfL’s modelling has assumed that the application of a user charge to the Silvertown and
Blackwall tunnels can reduce traffic flows.25 But no account has been taken of real-life
examples of user charges, which suggest that, while they can delay the induced traffic effect,
it may well cancel out their effect over longer time periods. Three examples are:
21The Standing Advisory Committee on Trunk Road Assessment (SACTRA), Trunk Roads and the Generation of Traffic
(London: HMSO, 1994)
22Sally Cairns, Carmen Hass-Klau and Phil Goodwin, Traffic Impact of Highway Capacity Reductions: assessment of the
evidence (London: Landor Publishing, 1998); S. Cairns et al, “Disappearing traffic? The story so far”, Proceedings of the
Institution of Civil Engineers, 2002:1, pp. 13-22
23 Cairns et al, Traffic Impact of Highway Capacity Reductions, p. 4 and pp. 52-54
24 Department for Transport, Latest Evidence on Induced Travel Demand: An Evidence Review (Project no. 1-396), May 2018
25There is no publicly available information about the assumptions made on elasticity of demand for road space to the
user charge (i.e. the extent to which the level of demand would change in response to a user charge).
10The Silvertown Tunnel is in a hole, so STOP DIGGING
■ The Dartford crossing. The crossing opened in 1963 as a single tunnel; a second tunnel was
added in 1980 and the Queen Elizabeth Bridge in 1991. There has been a user charge since
the crossing opened. The total traffic volume, and congestion on the crossing and adjoining
roads, seem to have been impervious to increases in the charge. Traffic volumes have risen
relentlessly, together with those on the entire M25 ring road, of which the crossing forms
part. The volume of traffic rose steadily and peaked in 2006, at a daily average of 149,602
crossings. It then fell slightly for five years in succession, in the context of an overall
reduction in traffic volumes. In 2009, daytime charges were increased and night-time charges
abolished; it is difficult to say what difference these changes made. In 2012 the charge was
increased, and in 2014 toll booths were taken away and a free-flow scheme used, under
which drivers pay the charge electronically. Traffic volumes increased, regardless: by 2015
the daily average of journeys had risen to 146,292. It soon returned to, and surpassed, the
level of 2006. In 2016 it surpassed 150,000 (compared to a design capacity of 135,000) for
the first time. It has risen every year since, reaching 157,023 in 2019. The government
expects average traffic flow to hit 160,000 by 2025.26 See Figure 1.27
Source: Highways Agency records in the National Archives web archive (up to 2012); Dart
Charge Data Table (2015-19)
■ The M6 toll road. This 27-mile privately financed tolled motorway, which runs around the
north west of Birmingham, opened in 2003 and was intended to relieve congestion on the
busiest section of the M6, by providing an alternative route. Initially, congestion was reduced
26Kent On Line, “Department of Transport figures reveal Dartford Crossing will be operating at 120% capacity”, 11
December 2016
27 The data in figure 1 are from: for 1990-2011 the National Archives
(accessed 25 May 2020); for 2015-2019, Dart Charge Data Table
(accessed 25 May 2020). Requests to Highways
England for a complete set of historical data were referred to the Data Charge Data Table web page, which displays only
incomplete information
11The Silvertown Tunnel is in a hole, so STOP DIGGING
as traffic diverted on to the toll road, but by 2008 the Highways Agency found that traffic
flows on the M6 “appear to have returned to near pre-M6 Toll opening levels”. The total
volume of traffic on the toll road and the parallel M6 increased, and peak-time traffic at
junctions on either side of the toll increased. A report by the Campaign for Better Transport,
which monitored the project, concluded that: “the only example of a private toll motorway in
the UK, the M6 Toll, has been a colossal and expensive failure. Any initial benefits were soon
eclipsed by rising traffic levels, and [...] journey times have scarcely improved”.28
■ The London congestion charge. The charge, introduced in 2003, is widely considered as
one of the most successful such charges. By 2006, the volume of traffic in the area covered
was down by 15%, and the levels of congestion by 30%. But by 2007, congestion levels were
the same as they had been in 2002. More recently, traffic volumes have been boosted by rapid
increases in the number of taxis and private for-hire vehicles in the congestion zone.29 The
long-term effect of the congestion charge on air pollution has also been shown to be very
limited by a number of academic studies.30
All road projects are different, and none of these projects are exact analogies of the
Silvertown tunnel. But some key trends are evident. Two road charges, introduced with the
primary objective of reducing congestion – on the Dartford tunnel and the M6 Toll road –
failed to do so. The London congestion charge, which covered a much wider area rather than
one specific route, achieved some success, but traffic volumes then moved towards their
previous levels. These examples suggest that not only do more roads produce more traffic,
but also that road charging does not reverse this trend, and at best slows it down a little.
(c) Likely induced traffic resulting from the Silvertown tunnel
The Preliminary Transport Assessment by TfL for the Silvertown Tunnel stated that:
[T]he ‘induced traffic’ effects [...] could operate both ways – it is plausible that the
scheme will result in no net additional traffic, possibly even an overall reduction.31
Three reasons were given for this assessment: (1) that a “powerful demand management
tool”, the user charge, would be available; (2) that public transport would be improved by
“dedicated bus lanes”; and (3) that “the scheme is being built in a congested urban
environment where capacity is constrained on the surrounding network”.
Reason (2) is frail at best. The “dedicated bus lanes” referred to would not be bus lanes at all.
There would be one such lane, described in TfL’s Case for the Scheme as “a dedicated bus,
coach and goods vehicle lane”32 – that is, it would be open to goods vehicles as well as buses.
(See also section 4 below.) Reason (3) is a tautology: as the M6 and other road projects has
28Highways Agency, Post Opening Project Evaluation: M6 Toll Five Years After Study (London: Highways Agency, 2009);
Campaign for Better Transport, The M6 Toll, five years on: counting the cost of congestion relief (London: CBT, 2010);
Campaign for Better Transport, The M6 Toll – ten years on (London: CBT, 2013)
29Nicole Badstuber, “London congestion charge: what worked, what didn’t what next”, The Conversation, 2 March 2018; S.
Beevers et al, “Traffic management strategies for emissions reduction: recent experience in London”, Energy and Emission
Control Technologies 2016:4, pp. 27-39
30The Mayor’s Transport Strategy, p. 89; Frank Kelly et al, “The Impact of the Congestion Charging Scheme on Air Quality in
London” (Health Effects Institute, 2015)
; Colin Green et al, “Did the
London Congestion Charge Reduce Pollution?” (Lancaster University Management School Economics Working paper Series
2018/007)
31 Silvertown Tunnel Preliminary Transport Assessment (London: TfL, 2015), p. 265
32 Silvertown Tunnel: Case for the Scheme (7.1) (London: TfL, 2015), p. 29
12The Silvertown Tunnel is in a hole, so STOP DIGGING
shown, when expansion of a main road puts pressure on the surrounding network, political
pressure builds for further expansion of the surrounding network. That is how the “induced
traffic” effect works.
That leaves reason (1), the user charge. The experience of the Dartford tunnel, M6 Toll and
London congestion charge shows that road charges, far from being a “powerful demand
management tool”, at best only delay the induced traffic effect. While it is theoretically
possible for user charges to counter the induced traffic effect, in practice it has not happened.
In the case of the Silvertown project, the level of the charge is a political decision in the
hands of the Mayor, who could in future decide to reduce it in line with other policy
objectives.
Despite the large body of research on the importance and complexity of, the induced traffic
effect, TfL conducted its computer modelling of the tunnel project using assumptions that
perversely minimised this effect. In particular, it was assumed that the total number of trips
made across the Thames would not be changed by the construction of the tunnel (see box).
This naturally produced modelling outcomes that minimised induced traffic effects. With
these in hand, TfL was able in its Transport Assessment to present conclusions, hedged with
numerous caveats, that the total traffic volume would not increase, in particular:
[I]t has not been possible to isolate the precise impact of any one factor individually on
highway demand with any degree of accuracy. However, the available evidence
indicates that the overall impact of the [Silvertown tunnel] Scheme is a reduction in
daily traffic demand on the road network in the study area, and in particular a reduction
in and a moderating regulation of cross-river highway demand.33
Important evidence – the accumulated experience of numerous other road schemes – has not
been considered. The evidence base for the tunnel project is TfL’s computer models. These
should clearly be re-run, with a wider set of assumptions in relation to induced traffic.
In the climate emergency, simply replacing the vehicle fleet with ultra low carbon vehicles
will not be sufficient. This is partly because of other emissions associated with vehicles and
road use, and partly because, even if the sale of new petrol and diesel cars is ended by 2035,
there will still be some highly emitting vehicles in use. One study shows that, if 50% of new
car sales are electric by 2030, it will be necessary for car mileage to be cut by 60% over that
period for emissions reductions to stay on track, and even if the new car fleet is completely
electrified by 2030, car mileage would still need to be reduced by 20%.34 The reduction of
total traffic volume and car mileage, and not only electrification, must therefore be an
overriding objective of transport policy. Without a scheme appraisal that takes this into
account, and only vague assertions on subsequent traffic volumes, the Silvertown tunnel is
unlikely to contribute to this aim.
How TfL’s models deal with induced traffic
The assumptions about induced traffic used in modelling the Silvertown tunnel
project are set out in Appendix B to the Silvertown Tunnel Preliminary Transport
Assessment (London: TfL, 2015), on pages 265-268. Induced traffic is broken down
into five phenomena: Continued ...
33 Silvertown Tunnel Transport Assessment (London: TfL, 2016), paragraph 7.2.6, p. 229
34
13The Silvertown Tunnel is in a hole, so STOP DIGGING
Trip generation “concerns whether the Scheme will change the overall number of
trips that a user will make over the whole day, regardless of their mode of transport,
location, and route taken.” The PTA says there is “some evidence suggesting that this
is dependent on the personal characteristics and situation of the individual making
the journey”, and that therefore the total number of trips is assumed in TfL’s
modelling to be “fixed for a given level of population and employment”. In other
words, it is assumed a priori that the existence of an additional tunnel will not
influence the number of trips.
Trip redistribution covers users who change the origin or destination of a trip because
of the additional route available. The PTA claims that “trip redistribution involves the
relocation of an existing trip and so does not result in any additional traffic”, and that
the modelling, undertaken according to government guidelines, “suggests that this
effect is not significant due to the estimated impact of charging and provision of an
enhanced bus network”.
Modal shift concerns travellers who switch between transport modes (e.g. between
cars and public transport). The modelling appears to have been based on
assumptions that the combination of the user charge and improved cross-river bus
connections will produce reductions in traffic that will counter any increases caused
by extra road space.
Route choice. The PTA says that if a driver chose to use the Silvertown tunnel instead
of e.g. the Blackwall tunnel or Rotherhithe tunnel, this would not alter the total
number of trips on the wider network, and that the models cover a wide enough area
for this to be taken into account.
Time of day effects concern the potential for drivers to change the time at which they
make trips. These effects are not considered in TfL’s models as induced traffic.
The assumptions on trip generation, trip redistribution and modal shift used here
appear to be restrictive and to take insufficient account of the theoretical body of
knowledge on induced traffic, and the practical experience of other schemes. Even
with these restrictions, the models support conclusions that there will be no induced
traffic hedged with numerous caveats. This is too shaky a basis for a £1.2 billion
project.
14The Silvertown Tunnel is in a hole, so STOP DIGGING
3. The London Mayor's targets for cutting greenhouse
gas emissions are way behind what is needed, and
building the tunnel will make things worse
The Silvertown tunnel project would be likely to contribute significantly to London’s
greenhouse gas emissions, both during construction and when operating (see sections 1 and
2). The Mayor and other GLA political leaders have claimed repeatedly that this contribution
has been taken into account in drafting the city’s decarbonisation strategy, which aims at
“zero carbon” (actually, net zero carbon, i.e. requiring negative emissions technologies35) by
2050. But this begs two questions:
1. The carbon budgets (i.e. the quantities of carbon that may be released into the atmosphere,
without breaching internationally agreed targets) that the GLA has set itself are far greater
than those calculated by the Tyndall Centre for Climate Research, one of the UK’s leading
centres of research on decarbonisation. So the GLA’s emissions trajectories (i.e. forecasts of
the volume of greenhouse gas emissions in future years) fall far less steeply than would be
required to remain in line with the goal of limiting global warming to 1.5 degrees above pre-
industrial temperatures. This means that, in the transport sector – which after electricity and
heat systems, and buildings, is London’s largest source of emissions – plans to move away
from motorised transport are such that they would contribute to missing the Paris targets by a
long way.
2. London’s transport policy, while including many measures to encourage non-motorised
transport, nevertheless retains pride of place for cars and trucks for the indefinite future, and
relies heavily on imperfect technologies (e.g. electric cars and hydrogen cars) to reach its
(inadequate) decarbonisation goals. It is this insistence on retaining large volumes of road
traffic that may undermine decarbonisation efforts, and form the context for carbon-heavy
projects such as the Silvertown tunnel. Furthermore, the policy is predicated on assumptions
about traffic demand that are now in doubt, in the light of the Covid-19 pandemic and the
changes in work and transport practices it has caused.
This section of the report looks in more detail at decarbonisation scenarios. The next section
comments on the transport strategy.
In November 2019, in response to campaigners’ claims that the Silvertown tunnel would
undermine decarbonisation efforts, Sadiq Khan, the Mayor of London, stated:
London’s 1.5C trajectory takes the Silvertown Tunnel into consideration as it is based
on modelling of London’s entire transport system. London’s carbon reduction pathway
is in line with the Committee on Climate Change’s pathway and IPCC trajectories that
are consistent with a limited probability of overshooting 1.5C warming.36
Heidi Alexander, Deputy Mayor for transport, stated, similarly:
London’s 1.5C trajectory has been developed using detailed bottom up modelling of the
carbon emissions from transport and buildings and other sectors. [...] The trajectory has
35 See Mayor of London, Zero carbon London: a 1.5 deg compatible plan (2018), p. 17; London Environment Strategy, p. 208
36
Letter from Sadiq Khan to Victoria Rance of Stop the Silvertown Tunnel Coalition (SSTC), 21 November 2019 (reference
MGLA071019-4151)
15The Silvertown Tunnel is in a hole, so STOP DIGGING
been independently assessed by C40 [the C40 cities climate leadership group] to be in
line with the advice of the Intergovernmental Panel on Climate Change on the level of
carbon emission reduction required to put us on track to staying within 1.5C global
warming.37
The C40 assessment actually does no more than to confirm that London's policies are in line
with a C40 check-list (see section 6 below). Here we focus on the assertion that London’s
emissions trajectories are based on detailed modelling, and are in line with CCC and IPCC
trajectories.
First, let us recall that all emissions trajectories, and the models on which they are based, are
only educated guesses about the possible outcomes of different policies. Second: none of the
three trajectories published in the London Environment Strategy reach the Mayor’s declared
goal of a 100% reduction compared to 1990 levels.
The trajectories are: (i) reflecting “existing policies [...] at a UK and city level”, which might
achieve a 35% reduction; (ii) assuming “additional electricity and gas grid decarbonisation”
as a result of government (not GLA) policies, which might achieve a 65% reduction, and (iii)
assuming both government action and “increased action at city level”, which might achieve a
90% reduction. The GLA assumes that the final 10% can be “achieved” by negative
emissions technologies or carbon offsetting.38
The inherent risks – which, if we are to give meaning to the phrase “climate emergency” are
very grave risks – are obvious. Government policy may not work in the desired direction.
Both government and GLA policies aimed at the desired targets might not – as with all
policies, in every sphere – hit the targets, for reasons as yet unclear.
But a further, more serious, shortcoming is in the Mayor’s claim that London’s trajectories
are “consistent with a limited probability of overshooting 1.5C warming”. The Mayor argues
that the trajectories are in line with those of the IPCC and the CCC. This does not tell us very
much. The IPCC, an advisory body, produces a wide range of trajectories reflecting a
multitude of scenarios. The CCC produces trajectories associated with the UK government’s
climate policy, that is itself inadequate for achieving the goal of limiting global warming to
1.5 degrees.
The value of the Tyndall Centre’s carbon budgets – which it has calculated for all local
authority areas in the UK – is that they are worked out independently, and are linked directly
to the global temperature targets (“well below 2degC and pursuing 1.5deg C) and the equity
principles (i.e. principles of equity between developed nations and poorer nations) enshrined
in the UN Paris agreement.39
There are two key differences between Tyndall’s carbon budgets and the CCC’s. First, the
equity principles of the Paris agreement are explicitly and quantitatively applied, an approach
which allocates a smaller share of the global carbon budget to rich countries such as the UK,
and also includes global “overheads” for land use, land use changes and forests, and cement
process emissions related to poorer countries’ development. Second, the Tyndall carbon
budgets do not include negative emissions technologies and carbon offsets, which form a
37 Letter from Heidi Alexander to Victoria Rance (SSTC), 20 September 2019 (reference MGSL070819-9567)
38 Zero carbon London: a 1.5 deg compatible plan, pp. 16-17; London Environment Strategy, pp. 207-208.
39The Tyndall Carbon Budget Tool for local authorities is at . For more
background on the Tyndall global carbon budget, see
16The Silvertown Tunnel is in a hole, so STOP DIGGING
significant part of the CCC’s trajectories. The researchers specify that they regard their UK
carbon budget as “at the upper end of the range” aligned with the Paris agreement’s
objectives.
The Tyndall Centre has defined carbon budgets for Greater London covering five-year
periods, starting with 2018-22, which is associated with an emissions reduction rate of
minus12.2% per year.40 The gap between these budgets, and those used by the GLA, is shown
in Figure 2.
Note. The GLA’s emissions totals for five-year periods are based on the London Zero
Carbon Pathway model (downloadable at https://data.london.gov.uk/dataset/london-s
-zero-carbon-pathways-tool).
In their conclusions, the Tyndall Centre’s researchers state that:
[F]or Greater London to make its fair contribution to delivering the Paris agreement’s
commitment to staying “well below 2degC and pursuing 12.5degC” global temperature
rise, then an immediate and rapid programme of decarbonisation is needed. At 2017
CO2 emission levels, Greater London will exceed the recommended budget available
within seven years from 2020. To stay within the recommended carbon budget Greater
40 J. Kuriakose et al, Setting Climate Commitments for Greater London: quantifying the implications of the UN Paris
Agreement for Greater London (Manchester: Tyndall Centre, 2019). To access this document, go to
, click the tab "London", and select all the local authorities
listed (which are the boroughs that make up Greater London). This will generate a copy of the document, including carbon
budgets and commentary.
17The Silvertown Tunnel is in a hole, so STOP DIGGING
London will, from 2020 onwards, need to achieve average mitigation rates of CO2 from
energy of around minus 12.2% per year. This will require that Greater London rapidly
transtions away from unabated fossil fuel use.
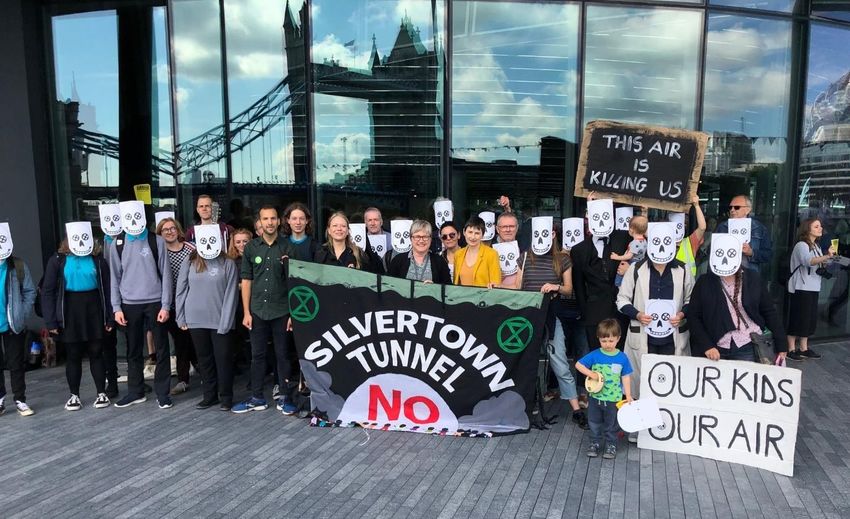
The importance of taking the Tyndall Centre research into consideration may be illustrated
with reference to the gaps, at the global level, between (i) emissions trajectories directly
related to the 1.5 degrees target, (ii) trajectories related to a 2 degrees target, and (iii) those
correlated with the commitments made by national governments, including the UK’s, at the
Paris conference and subsequent international climate negotiations, which would lead to a 2.8
degree warming if unchanged. This is illustrated by the “emissions gaps” graph, published
and regularly updated by Climate Action Tracker (Figure 3).
Figure 3.
Source:
In July 2019, the GLA agreed, for the first and so far only time, to meet with representatives
of the local campaign opposing the Silvertown tunnel. The gap between the Tyndall Centre’s
carbon budgets was explained in preparatory documentation and at the meeting itself.41
Furthermore, the campaigners pointed to a major anomaly in TfL’s operational assumptions
and the GLA’s emissions trajectories (let alone e.g. the Tyndall Centre’s trajectories), as
follows:
The GLA’s Zero Carbon Pathways model projects that emissions from London’s transport
sector will fall from 8.22 million tonnes of CO2 equivalent (mtCO2e) in 2015 to 3.97
mtCO2e in 2036, a reduction of more than half. But the Silvertown tunnel environment
41SSTC memorandum “The case against Silvertown Tunnel”, July 2019 (available from SSTC on request); author’s notes of
the meeting
18The Silvertown Tunnel is in a hole, so STOP DIGGING
statement projects that transport emissions in the area covered by the modelled regional
network (smaller than the entire GLA area) will fall from 5.63 mtCO2e in 2012 to 5.16
mtCO2e in 2036 if the tunnel is not built, and 5.19 mtCO2e in 2036 if it is built – that is, a
reduction of less than one tenth.42 So while the GLA claims that its strategy will make it
possible to reduce emissions from the transport sector by half, TfL is working, and
presumably taking executive and investment decisions each day, on the basis that carbon
emissions from transport will be reduced by less than one tenth.
In other words, not only do London’s carbon budgets fall far short of what is needed to tackle
global warming, but TfL’s working assumptions fall far short of London’s carbon budgets.
When the GLA, like parliament and many other local authorities, declared a climate
emergency in 2019, it would have been logical to review climate policies overall; the
institutional changes that they will require; and projects that will affect them, such as the
Silvertown tunnel. In 2020, such a review is even more urgent.
42The Zero Carbon Pathways model is here: .
The Silvertown Tunnel Environmental Statement contains estimates of future emissions of Nitrogen oxides, particulate
matter and Carbon Dioxide, in line with its assessment of the regional road network, in paragraphs 6.6.57 to 6.6.63, on
pages 6-131 and 6-132. Table 6-25 on page 6-131 displays the estimates: the “reference case 2036” reflects a scenario in
which the tunnel is not built; the “assessmed case 2036” reflects a scenario in which it is built. For this report, the figures
have been rounded to two decimal places
19The Silvertown Tunnel is in a hole, so STOP DIGGING
4. The GLA’s transport strategy falls far short of what
is needed to stop dangerous global warming: the
proposed Silvertown Tunnel is part of this larger
problem
The Silvertown tunnel is presented in the Mayor’s Transport Strategy as, principally, a public
transport project. This is a gross exaggeration of the likely role public transport would play.
Even TfL’s optimistic projections suggest that, if the tunnel were to be built and all the
planned bus routes to operate, the proportion of person trips in private vehicles would only
fall to 73%, from the current 89% through the Blackwall tunnel, while the total traffic volume
would rise.43
The larger problem, though, is that – while the Mayor’s Transport Strategy includes measures
to encourage modal shift away from cars towards walking and cycling – it is based on
assumptions that cars and other motorised transport will remain the central, dominant feature
of the transport system. The Strategy endeavours to reconcile this motor-transport-centred
vision with decarbonisation, by making exaggerated claims for electric and hydrogen
vehicles. The Covid-19 pandemic has created an opportunity to call a halt to this car-centred
vision, in London and more broadly, that must not be missed.
This section will look first at the claim that the Silvertown project supports public transport,
and then at the underlying problem with the persistent role of motor transport.
Public transport and the Silvertown tunnel
Leading GLA politicians have stated repeatedly that the Silvertown tunnel will make room
for 37.5 buses per hour (7.5 via the Blackwall tunnel, 30 via the Silvertown tunnel) –
estimated in the Case for the Scheme as “a five-fold increase over the current cross-river
service”. But the reality would probably be less impressive. The “dedicated bus lanes” to
which some documents refer, would, according to TfL’s planning, also be used by goods
vehicles. The Development Consent Order, the legal framework for the tunnel project,
requires only “provision of not less than 20 buses per hour during peak periods in each
direction”, for the duration of the three-year initial monitoring period.44
The danger is that, once the tunnel is built, relentless pressure from ever-expanding traffic
will take up available road space before public transport providers deliver on their pledges.
This is exactly what has just happened with the new Queensferry Crossing across the River
Forth north of Edinburgh. This bridge was opened in 2017 to replace the Forth Road Bridge.
Scottish ministers had pledged that incremental journeys would be made by public transport.
But in the year to October 2019, 27.73 million vehicles had crossed the bridge, compared to
26.68 million in the year to October 2018, and 26 million across the Forth Road Bridge in
2014. The director of Transport Scotland admitted at parliamentary hearings that the increase
in private vehicle traffic was “not the direction we would want to go in”. Transform Scotland,
a transport policy campaign group, reported in January 2020 that, of 18 commitments made
43 The Mayor’s Transport Strategy, p. 236 and pp. 238-239; Silvertown Tunnel Transport Assessment, p. 239 and p. 288
44Silvertown Tunnel: The Case for the Scheme (London: TfL, 2016), pp. 149-150; Infrastructure Planning statutory
instrument no. 574 (2018): The Silvertown Tunnel Order 2018, pp. 68-69
20The Silvertown Tunnel is in a hole, so STOP DIGGING
by Public Transport Scotland to ensure better quality public transport across the Forth, seven
were incomplete and the status of five was unclear.45
At a minimum, the GLA could inquire into why public-transport-oriented policy with respect
to the Queensferry Crossing has failed, and why the Queensferry Crossing project – in spite
of intentions at political level that it should support public transport – did not do so
sufficiently, and at the same time produced induced traffic.
Aims of the Mayor’s Transport Strategy
The Mayor’s Transport Strategy (henceforth, the Strategy), published in 2018, includes many
proposals to move away from motor transport, and a headline policy aim that, by 2041, 80%
of all trips should be made by foot, cycle or public transport, up from 63% at present. But the
Strategy does not seek to remove cars and lorries from their dominant, central role in the
city’s transport system. Instead, it bases itself on scenarios that rely heavily on the
substitution of petrol vehicles by electric and hydrogen vehicles – which are more carbon-
intensive than often supposed, and have not yet been shown to work practically at large scale.
This motor-vehicle-centred transport policy forms the context for the Silvertown tunnel
project. The Strategy’s commitment to expand the road network – and thus make room for
more traffic – does not stop at Silvertown; there is also a pledge to consider further road
crossings across the Thames.
The Strategy states that, once the Silvertown tunnel, the government’s proposed Lower
Thames Crossing further east, and the extension of the Docklands Light Railway (DLR) to
Thamesmead are complete, the Mayor would “give consideration to the case for further road
crossings of the river in east London”. Proposed crossings should be “consistent with the
Mayor’s overall vision for a healthy city”, with “relevant environmental limits” and that
“legal limits for air quality are met” – but no reference to global warming, the most serious
environmental threat.46
The Strategy’s view of future transport modes is a double-edged sword. On one hand, it
commits to “addressing car dependency” and increasing the number of journeys made on
foot, bicycles or public transport.47 On the other, it says little about the potential for avoiding
trips all together. The growth of home working and other changes during the Covid-19
lockdown should push this issue to the top of the policy agenda.
The Strategy projects that the number of car journeys will fall from 9.88 million in 2015 to
6.6 million in 2041 – a 33% reduction, but far from adequate in terms of the climate
emergency. The expected reduction in traffic overall – i.e. the total number of vehicle-km per
year – if the Strategy is successfully implemented, is estimated to be only 10-15% by 2041.48
45“New bridge brings a million extra journeys”, The Scotsman, 1 December 2019; “Transport chiefs admit unwanted
Queensferry Crossing traffic increase”, Edinburgh Evening News, 8 January 2020. For details of the commitments made,
and not fulfilled, on public transport, see: Transform Scotland, Queensferry Crossing Public Transport Strategy Briefing, 6
January 2020, and Transform Scotland, Forth Replacement Crossing Public Transport Strategy, 30 January 2018.
46 Mayor’s Transport Strategy, p. 243
47 Mayor’s Transport Strategy, pp. 20-22 and 94-98
48Mayor’s Transport Strategy, p. 22; author’s extrapolation from Figure 2, Mayor’s Transport Strategy, p. 21; Element
Energy, London’s Climate Action Plan: WP3 Zero Carbon Energy Systems (Cambridge: Element Energy, September 2018), p.
31
21You can also read