Car Sharing in Germany - A Case Study on the Circular Economy - CIRCULAR IMPACTS
←
→
Page content transcription
If your browser does not render page correctly, please read the page content below
Car Sharing in Germany

A Case Study on the Circular Economy

AUTHORS
 Aaron Best, Ecologic Institute
 Marius Hasenheit, Ecologic Institute

 With contributions by:
 Laurens Duin, Ecologic Institute

 With thanks to:
 Participants in the “Car Sharing in Germany” Expert Workshop, 8 March 2018, Berlin

 Project coordination and editing provided by Ecologic Institute.

 Manuscript completed in September 2018
 This document is available on the Internet at:
 http://circular-impacts.eu/deliverables

 Document title                Car Sharing in Germany: A Case Study on the Circular Economy

 Work Package                  4

 Document Type                 Deliverable

 Date                          21 September 2018

 Document Status               Final

ACKNOWLEDGEMENT & DISCLAIMER
This project has received funding from the European Union’s Horizon 2020 research and
innovation programme under Grant Agreement No. 730316.
Neither the European Commission nor any person acting on behalf of the Commission is
responsible for the use which might be made of the following information. The views expressed
in this publication are the sole responsibility of the author and do not necessarily reflect the views
of the European Commission.
Reproduction and translation for non-commercial purposes are authorized, provided the source
is acknowledged and the publisher is given prior notice and sent a copy.

i :: Car Sharing in Germany: A Case Study on the Circular Economy
1 ::        Abstract

This case-study paper examines future scenarios for car sharing in Germany, analysing drivers
and impacts. Enabled by disruptive technological changes, car sharing is an example of a
“product as a service” and becoming an increasingly viable alternative to the private ownership
of cars. By intensifying the use of vehicles, car sharing has the potential to provide mobility using
fewer physical and energy resources. However, other models of shared mobility, such as
ridesharing enabled by autonomous vehicles, could actually have countervailing effects, drawing
passengers away from public transit. Two future circular scenarios for 2030, Circular “Green” (car
sharing) and Circular “Gray” (a broader concept of shared mobility) are developed and compared
to a business-as-usual scenario. The paper highlights the impacts of the scenarios on motor-
vehicle travel and production as well as greenhouse-gas emissions, also describing likely
economic and policy implications. The case underlines the importance of analysing specific
circular opportunities like car sharing in the context of a broader system of multi-modal transport.

Car Sharing in Germany: A Case Study on the Circular Economy :: ii
Table of Contents
1 :: Abstract ii
2 :: Executive Summary 1
1 :: Introduction 5
2 :: Step 1: Defining the Baseline 8
2.1 Understanding the business models 8
2.2 Current use of motorised passenger vehicles in Germany 11
2.3 Current use of car sharing in Germany 13
2.4 Base-year parameters 17
2.5 Business-as-usual scenario for 2030 20
2.5.1 Scenario definition 20
2.5.2 Assumptions 21
3 :: Step 2: Defining the Circular Scenario 22
3.1 Scenario parameters 22
4 :: Step 3: Changes in the Key Sector 23
4.1 Scenario results 23
5 :: Step 4: Expected Effects on Other Parts of the Economy 26
5.1 Potential modal shifts 26
5.1.1 Potential effects of car sharing on modal shift 26
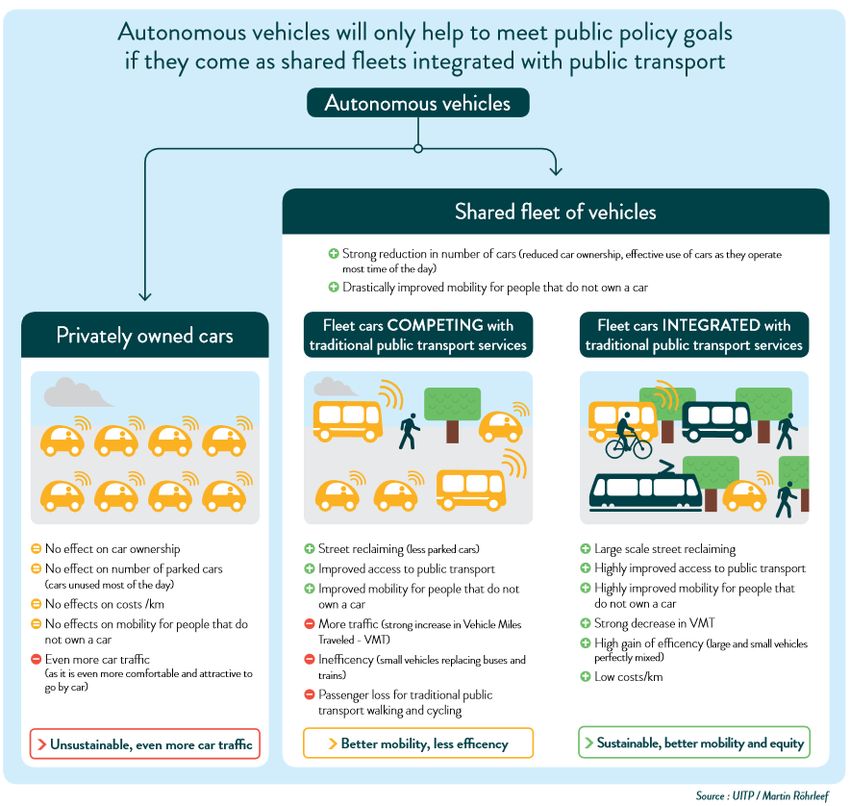
5.1.2 Potential effects of autonomous vehicles on modal shift 27
5.1.3 The impact of autonomous vehicles – estimations 28
6 :: Step 5: The Impact on Society 29
6.1 Societal impacts 29
6.2 Environmental impacts 29
7 :: Step 6: Are Alternatives Available? 32
8 :: Step 7: Policy Options 33
8.1 Need: Adaptive and holistic transport policy mix 33
8.2 Policies that directly support car sharing 33
8.3 Policies that indirectly support car sharing 34
9 :: Step 8: Overall Conclusions 36
10 :: References 37
11 :: List of Partners 45
iii :: Car Sharing in Germany: A Case Study on the Circular EconomyList of Tables Table 1. Passenger trips by mode of motorised transport in Germany in 2016 11 Table 2. Average annual costs per driver-owned car and car sharing costs (8,000 km per year, 667 km per month) in EUR 15 Table 3. Base-year parameters for passenger vehicles: production, stock, lifespan and use 17 Table 4. Base-year parameters for vehicle production 19 Table 5. Base-year parameters for vehicle use 19 Table 6. Additional assumptions for the 2030 BAU Scenario 21 Table 7. Assumptions used in the scenario analysis 22 Car Sharing in Germany: A Case Study on the Circular Economy :: iv
List of Figures
Figure 1. Annual passenger-km in Germany (motorised passenger vehicles)                   2
Figure 2. CO2e emissions from motorised passenger vehicles in Germany                     3
Figure 3. New passenger vehicles in Germany                                               4
Figure 4. Impact chain – Product-as-a-Service                                             6
Figure 5. Predominant model of private motorised transport (cars)                         9
Figure 6. Car sharing model for private motorised transport (cars)                        9
Figure 7. Passenger-kilometres by mode of motorised transport in Germany (in billions)   12
Figure 8. Average cost comparison: driver-owned car versus car sharing                   15
Figure 9. Annual passenger-km in Germany (motorised passenger vehicles)                  23
Figure 10. New passenger vehicles in Germany                                             24
Figure 11. Passenger-vehicle stock in Germany                                            25
Figure 12. Potential effect of autonomous vehicles on modal shift                        28
Figure 13. CO2e emissions from motorised passenger vehicles in Germany                   30

v :: Car Sharing in Germany: A Case Study on the Circular Economy
List of Abbreviations

 ADAC             German automobile club (Allgemeine Deutsche Automobil-Club e.V.)

 BAU              Business as usual (scenario)

 BEV              Battery-electric vehicle

 BMVI             Federal Ministry for Transport and Digital Infrastructure (Bundesministerium für
                  Verkehr und digitale Infrastruktur)

 CO2e             CO2 equivalent

 EUR              Euros (currency)

 GHG              Greenhouse gas

 LOHAS            Lifestyles of Health and Sustainability

 NMVOCs           Non-methane volatile organic compounds

 PHEV             Plug-in hybrid-electric vehicle

 Pkm              Passenger-kilometres

 UBA              German Federal Environment Agency (Umweltbundesamt)

 Vkm              Vehicle-kilometres

Car Sharing in Germany: A Case Study on the Circular Economy :: vi
2 :: Executive Summary Globally, more than one billion vehicles are currently in use and this number is expected to reach two billion units by 2030 (Sperling and Gordon, 2009). This growth brings with it challenges for both industrialised and emerging countries, including air pollution, urban congestion, surface sealing and additional resource consumption related to producing and operating these vehicles. In the EU, the number of passenger cars now exceeds 250 million and continues to grow (Eurostat, 2018). Car sharing as a circular-economy transformation Recent technological developments have increased the convenience of car sharing as an alternative form of providing mobility. Car sharing could potentially lower the number of passenger motor vehicles required to provide the same level of car-based mobility. However, many questions remain regarding the nature and magnitude of the future impacts of car sharing, especially given its expected convergence with ride sharing in the future (facilitated by the advent of autonomous vehicles). Given the enormous impacts of motor vehicles, and with the use of car sharing undoubtedly growing, it is of critical importance to clarify questions related to the expected future impact of these changes in car-based mobility. In the circular-economy context, car sharing is an example of a product as a service, wherein consumers, rather than buying and owning a product, purchase the services a product provides (e.g. mobility in the case of car sharing). With Germany by far the largest car-sharing market in the EU, this CIRCULAR IMPACTS case study examines possible future impacts of car sharing in the country, starting with the reality today and comparing potential scenarios for the year 2030, each with different levels and effects of car sharing. This case study does not provide a prediction of the future, which would be an impossible task given the remarkable innovations, disruption and uncertainties now taking place in the transport sector. Disruptive changes for the sector are in store, such as car sharing, ride sharing, autonomous vehicles, robo-taxis and electric vehicles. However, this case study does shed light on the role that the circular economy could play in transport use and its effects, explains some of the trade-offs involved and identifies key driving factors that should be considered when making transport-related policy decisions. Though it investigates the case of Germany and specifies the year 2030, the underlying technological developments examined here are global in nature, meaning useful insights can be drawn from the case more generally. Three 2030 scenarios: BAU, Circular “Green” and Circular “Gray” In this case study, three scenarios of car sharing development in Germany through 2030 are developed: a business-as-usual (BAU) scenario with lower levels of car sharing and two circular scenarios with significantly higher levels of car sharing. All 2030 scenarios are based on a set of underlying assumptions wherein the passenger-vehicle sector achieves greenhouse-gas emission reductions at levels in line with the German government’s climate commitments under the Paris agreement (Agora Verkehrswende, 2018). In addition, in all 2030 scenarios, the number of electric vehicles on German streets reaches 5 million by 2030. Achieving these ambitious assumptions is contingent on corresponding and effective policy interventions in Germany and the EU. With this common substrate to all the 2030 scenarios, the specific effect of car sharing can be better analysed. 1 :: Car Sharing in Germany: A Case Study on the Circular Economy
Presently, car sharing makes up just one tenth of one percent (0.1%) of passenger-km delivered
by motorised passenger vehicles in Germany. In the BAU 2030 scenario, car sharing rises to one
half of one percent (0.5%) of all automotive passenger-kilometres by 2030 (a five-fold increase
above today). In the Circular “Green” 2030 scenario, today’s mobility pattern is significantly
disrupted, with car sharing growing to cover 2.5% of total automotive passenger-kilometres while
reducing road traffic and CO2 emissions. In contrast, though the Circular “Gray” scenario sees the
same number of shared vehicles as the Circular “Green” scenario, this additional shared mobility
fails to substitute private-vehicle traffic, actually fostering additional travel by motorised passenger
vehicles along with the highest CO2 emissions of the three 2030 scenarios. The Circular “Green”
scenario is based on a continuation of present-day car-sharing effects in Germany, which studies
show has the net effect of reducing users’ reliance on private passenger cars. The Circular “Gray”
scenario, however, is consistent with the convergence of car sharing and ride sharing (driven by
market adoption of autonomous vehicles), which can be expected to decrease prices for car-based
mobility and entice away users of public transport services.
Case-study results: future car sharing in Germany
Effects on passenger-km. Figure 1 shows the case-study results for the annual passenger-km
travelled in Germany by motor vehicles in 2030, breaking them down by use application (private
car or car sharing) as well as energy source (fossil fuel or electric). Including the base year of 2017
allows a comparison to the present-day situation. In the Circular “Green” scenario, the total
passenger-km of motorised passenger vehicles are reduced by 7% compared to the BAU
scenario, whereas the Circular “Gray” scenario drives an increase of 2% in passenger-km.

Figure 1. Annual passenger-km in Germany (motorised passenger vehicles)
                                      1,200

                                                          0.1
                                                                              1.0
                                                           1.0       3.9                                           5
                                                  2.0
                                      1,000
                                                                                            5                 18
                                                                        104                                  102
                                                                                           18
                                                                                           102
                                       800
             Passenger-km (bilions)

                                       600

                                                    962
                                                                        866                                  869
                                       400                                                 783

                                       200

                                         0
                                                                                     Circular "Green"   Circular "Gray"
                                              Base Year (2017)   BAU Scenario 2030
                                                                                      Scenario 2030     Scenario 2030
    Car sharing (electric)                          0.1                 1.0                 5                 5
    Car sharing (fossil-fuel)                       1.0                 3.9                18                 18
    Private electric cars                           2.0                104                 102               102
    Private fossil-fuel cars                        962                866                 783               869

Car Sharing in Germany: A Case Study on the Circular Economy :: 2
Effects on greenhouse-gas emissions. Significant reductions in greenhouse-gas emissions are
evident in all the 2030 scenarios vis-à-vis present-day emissions (see Figure 2). The most
important factor behind the significant drop in 2030 emissions from present-day levels is the
authors’ underlying assumption of an ambitious rise in the average energy-efficiency of vehicles
of all fuel types combined with a shift to electric vehicles. By contrast, the additional contribution
of car sharing is modest. The BAU scenario delivers CO2e emissions reduction of 28% by 2030
compared to 2017. In the Circular “Green” scenario, the additional car sharing reduces the total
emissions a further 10% beyond those achieved in the BAU 2030 scenario. By contrast, the
Circular “Gray” scenario sees no climate benefits compared to the BAU scenario, with emissions
actually increasing by 1%.
Figure 2. CO2e emissions from motorised passenger vehicles in Germany
180
0.1
0.0
160
140
0.3
0.2 1.3
CO2e emissions (billion kg)
120 1.0 1.2
1.0
100
135
80
86 86
60 78
40
20
23 28 23 27
0
Circular "Green" Circular "Gray"
Base Year (2017) BAU Scenario 2030
Scenario 2030 Scenario 2030
Car sharing cars (use) 0.1 0.3 1.0 1.3
Car sharing cars (production) 0.0 0.2 1.0 1.2
Private cars (use) 135 86 78 86
Private cars (production) 23 28 23 27
Note: the decrease in CO2e emissions for the 2030 scenarios results primarily from ambitious gains in vehicle-
fleet efficiency (at levels in line with Germany achieving its climate targets).
Effects on vehicle production. The most dramatic differences amongst the scenarios relates to
the production of new vehicles. Currently, the average lifespan of a car-sharing vehicle in that
application is three years. After this period of time, car-sharing vehicles are typically sold in the
used-car market and become private vehicles. Due to decreased demand for vehicles overall in
the Circular “Green” scenario, car production for the German market falls 16%, while 5% of new-
3 :: Car Sharing in Germany: A Case Study on the Circular Economycar production is for the car-sharing market. In contrast, car production actually increases slightly
(by 1%) in the Circular “Gray” Scenario.
Figure 3. New passenger vehicles in Germany
4,000,000 8,100
520 46,300
2,800 18,700
54,000
3,500,000 109,500
57,900
97,900
3,000,000 1,083,000 1,040,100
2,500,000
1,067,600
New passenger vehicles
2,000,000
3,382,700
1,500,000
2,504,000 2,463,400
1,000,000
1,806,500
500,000
-
Circular "Green" Circular "Gray"
Base Year (2017) BAU Scenario 2030
Scenario 2030 Scenario 2030
Car-sharing cars (electric) 520 8,100 57,900 46,300
Car-sharing cars (fossil-fuel) 2,800 18,700 97,900 109,500
Private cars (electric) 54,000 1,083,000 1,067,600 1,040,100
Private cars (fossil-fuel) 3,382,700 2,504,000 1,806,500 2,463,400
Conclusions
This circular-economy case study on car sharing examines an area of dynamic and large-scale
change driven by rapidly evolving technologies. Key insights from the study include:
Car sharing will likely blur into ride sharing in the coming decades - Car sharing is likely to
merge with ride sharing from both a usage and business-model perspective as autonomous
vehicles enter the market. Car manufacturers are already positioning themselves for a major
revolution in urban mobility.
Future impacts depend on the policy framework - Car sharing could be headed for a significant
scaling up. However, the degree to which shared mobility attracts users from private vehicles or
from public transit will determine car sharing’s urban, environmental and resource impacts.
Policies such as congestion pricing, parking fees, fuel taxes and other measures can address the
implicit subsidies that encourage private-vehicle use. Particular policy attention is needed on ways
to address the negative effects of increased ride sharing and the market adoption of autonomous
vehicles on public transit use. The energy efficiency of the vehicle fleet, cleaner engine exhaust
and the widespread uptake of electric vehicles will remain the decisive contributors to reducing
negative environmental impacts of passenger transport. Car sharing vehicles, are on average
more fuel efficient and more likely to be electric vehicles, and thus can make a supporting
contribution.
Car Sharing in Germany: A Case Study on the Circular Economy :: 41 :: Introduction The mobility sector is currently undergoing a series of fundamental changes, including a shift towards non-fossil fuels, autonomous driving and to mobility as a service. Car sharing is a crucial part of this mobility-as-a-service sector. Its rising importance can be explained by several factors: the increasing availability and diffusion of mobile electronic devices and software capabilities; a growing technological connectivity within society; and shifting societal values with respect to mobility in general and specifically regarding cars. Today, especially for young adults, the ownership of a car no longer plays as dominant role as a symbol for mobility and status as it did just a few years ago (Canzler and Knie, 2015). Driving licenses are increasingly being acquired later and the share of young people among car buyers has been declining for some time (Canzler and Knie, 2015; Schönduwe et al., 2012). At the same time, the demand for mobility is increasing and expected to rise through 2030 (BMVI, 2014a). The car has shifted from being a symbol of status and personal independence to being seen as a rather pragmatic component of a mobility pattern wherein several intermodal means of transport are used, with the modal choice depending on the specific circumstances. The focus has thus shifted toward accessing mobility services in a flexible way rather than possessing a car as such. This change of expectations towards mobility in general and cars specifically has allowed car sharing to escape its marginal niche to become increasingly mainstream, leading to the question what its future social, environmental and economic impacts could be. Car-sharing vehicles put on a higher annual mileage per vehicle than private cars due to their more intensive use. Car sharing could also mean that fewer cars would be necessary to meet the demand for mobility services. Hence, car sharing has the potential to generate significant social, environmental and economic impacts, ranging from employment effects, energy and resource consumption to significant changes in the modal split. Car sharing within the context of the circular economy Product-as-a-service is the underlying concept behind the so-called sharing economy, which is often summarised as “using instead of owning” (Rifkin 2014). As such, product-as-a-service reflects a trend of preferring fluid and frequently digitised goods over tangible goods. This includes digital services and renting, as well as lending and exchanging of goods and services, such as cars and accommodation. Figure 4 shows schematically how the product-as-a-service model affects economic processes and results in various environmental, economic and social impacts. 5 :: Car Sharing in Germany: A Case Study on the Circular Economy
Figure 4. Impact chain – Product-as-a-Service
Source: own illustration.
As a means of investigating the product-as-a-service phenomenon, the project team selected a
final case-study topic of car sharing in Germany for these reasons:
Car sharing has transformative potential. The transportation sector is responsible for
a large portion of energy consumption and greenhouse-gas emissions. Car sharing is a
transition that is already underway, with car-sharing services rapidly expanding across the
globe.
The sector is facing rapid changes, contradictory effects and high uncertainties.
Car sharing’s future effects are highly uncertain and the effects will differ depending on
future technological, economic and policy developments.
Germany is an important automotive market. Germany is one of the world’s major car-
producing countries. At the same time, it is among the world leaders in adoption of car
sharing. Germany offers a rich case study on both the demand and supply sides of car-
sharing developments. With Germany a frontrunner country in a new and rapidly evolving
sector, the current and near-term developments in Germany also offer one of the best
glimpses into possible future developments elsewhere.
This CIRCULAR IMPACTS case study provides a prospective overview of potential changes and
impacts related to car sharing in Germany. In line with the CIRCULAR IMPACTS case-study
methodology1, this case study report uses the following stepwise approach to examine possible
future scenarios for 2030:
1 For a full description of the case-study methodology, see Smits & Woltjer (2017).
Car Sharing in Germany: A Case Study on the Circular Economy :: 6 Step 1: Defining the baseline Step 2: Defining the new business case Step 3: Changes in the key sector Step 4: Effects on other parts of the economy Step 5: The impact on the environment and society Step 6: Are alternatives available? Step 7: Policy options Step 8: Overall conclusions Though it employs the best available data in its analysis, the case study is explicitly not a forecast of the future—the uncertainties are far too high, especially given the long-term time horizon of 2030 and rapid technological developments. By focusing so tightly on motorised passenger vehicles, it is also does not holistically address the transport sector. However, the results of the scenario analyses do provide useful insights for policymakers wishing to understand the dynamics behind car sharing and considering how best to foster and shape those dynamics through public policy. The quantitative data collected, the method of analysis, and the scenario results are also useful inputs for further research in the field. 7 :: Car Sharing in Germany: A Case Study on the Circular Economy
2 ::        Step 1: Defining the Baseline

This section provides a conceptual understanding of the two business models at the centre of this
case study: private car ownership versus car sharing. This case study examines station-based
sharing and free-floating sharing. The present market for car sharing in Germany is described,
providing details on the structure and magnitude of this rapidly growing mode of transport. With
that background knowledge in place, we list the various base-year parameters used in the scenario
analysis along with the assumptions used for the BAU scenario for 2030.

   2.1 Understanding the business models
The two business models compared in this case study co-exist in both the baseline and circular
scenarios. The scenarios are distinguished from one another by the differing degrees to which car
sharing is used vis-à-vis private vehicles.
Private motorised transport
In the predominant business model of private motorised transport, the car manufacturer supplies
a vehicle to a retailer and the retailer then sells the vehicle to the end consumer. In this model, the
consumer takes care of all maintenance costs, such as insurance, taxes and repairs, which are
frequently provided by independent garages. In this linear model, the car may be used by several
consumers sequentially (via resale of the used vehicle to a new private owner), but the use
intensity of the vehicle is relatively low. Eventually, the car is sold or scrapped, in which a portion
of the material stream is recycled while the other portion is permanently disposed.
Figure 5 depicts the business model of private motorised transport.
Car sharing
In the car-sharing business model, the car remains in the ownership of the mobility service
provider, which could either be the car manufacturer or a service provider. Hence, the maintenance
costs are undertaken by the service provider, which is likely to cooperate with a pre-determined
set of garages for repairs.
Figure 6 depicts the business model of car sharing.

Car Sharing in Germany: A Case Study on the Circular Economy :: 8
Figure 5. Predominant model of private motorised transport (cars)

Figure 6. Car sharing model for private motorised transport (cars)

Own illustrations. After its use as a car-sharing vehicle, the vehicle is typically sold as a used vehicle, with
the remainder of its life as a private vehicle.

9 :: Car Sharing in Germany: A Case Study on the Circular Economy
Box 1. The product-as-a service model
For many products, the same person or organisation has both ownership and usage rights. In a
product-as-a-service model, however, this can be the case but it does not have to be. Two types of
product-as-a-service models are:
Models of leasing or renting. The respective production companies remain the owners of the
assets and maintain them, selling the services of those assets to a consumer or business customer
(e.g. ‘power-by-the-hour’, light as a service). A very recent form of this business model in car
sharing has been car companies that found daughter companies for short-term rental (e.g. Car2go
or DriveNow).
Sharing models. Private companies or non-profit organisations can assume ownership of the
products and enable a shared use e.g. in peer-to-peer car sharing
If products are shared, leased or rented instead of owned and used exclusively, three direct impacts
could occur:
Fewer products may be needed due to more frequent utilisation, leading to less value-added in the
production sector.
The additional coordination and maintenance service needed could increase value-added in the
respective branches.
Over the mid and long term, if producers bear the costs of repair, they could change their designs
to make products more sharable and longer lasting.
Indirect impacts also occur as consumer behaviour changes and as the value chains linked to the
older and newer economic models adapt.
Types of car sharing
Car sharing means organised, shared use of vehicles by a larger number of people (Pieper et al
2013). This study focuses on two types: station-based car sharing and free-floating car sharing.
Peer-to-peer car sharing is not explicitly examined further in this case study, due to the limited
data available at present.
Station-based car sharing
With station-based car sharing (e.g. Cambio, Stadtmobil), a driver picks up the car at fixed
locations (i.e. stations) and typically brings it back to the same station after use. In Germany,
station-based providers now have 10,050 car-sharing vehicles at about 5,000 stations throughout
Germany (BCS, 2018a).
Free-floating car sharing
With free-floating car sharing (e.g.DriveNow, Car2Go), a driver finds the car-sharing vehicle by
mobile phone, drives it to his or her destination, and simply parks the vehicle nearby. Free-floating
providers in Germany now provide 7,900 vehicles serving several large urban centres (BCS,
2018a).
Peer-to-peer car sharing
Hiring and renting cars among individuals who do not know each other is known as peer-to-peer
car sharing. The mediation between the private car owner and the person searching for a car is
provided by a platform (e.g. Drivy), where one can typically register without any cost. For the use
of this mediation service, and often insurance, the platform usually charges a fee.
Car Sharing in Germany: A Case Study on the Circular Economy :: 10Box 2. Other types of shared mobility
Car sharing is one of several types of shared mobility available today. Other types of shared mobility
can also contribute to a more circular economy wherein resources are used more intensively. These
other shared-mobility options including the following transportation modes.
Public transport
By far, the most widely used form of shared mobility is public transport. In Germany, urban transit and
rail services accounted for 17.2% of passenger trips in 2016 (BMVI, 2017, p. 217).
Ride sharing
Ride sharing allows passengers to be picked up by a driver, either on a peer-to-peer model (wherein
passengers share in the travel costs) or as a commercial service (wherein paid drivers chauffeur
passengers to their destinations). Forms include platform-based ride sharing (e.g. Blablacar) and
dynamic ride sharing (e.g. Flinc) that helps match drivers and passengers in real time. Commercial ride-
sharing platforms (e.g. Uber) resemble the taxi-service model in many respects. Ride sharing can also
provide pooled transport of several passengers who may not know one another or share only proximate
(i.e. not the same) destinations.
Taxis
Taxis are chauffeured vehicles for hire, typically licensed for operation in a specific geography and with
regulated fares and metering.
Shared non-car modes of travel
Increasingly, other forms of mobility besides passenger vehicles are being shared via means similar to
car sharing; this includes bicycles, mopeds and electric kick scooters.
2.2 Current use of motorised passenger vehicles in
Germany
The demand for mobility services in Germany is high and growing. The German government
reports that 72 billion passenger trips were made in Germany in the year 2016, with over 80% of
these trips made by motorised passenger vehicles (see Table 1).
Table 1. Passenger trips by mode of motorised transport in Germany in 2016
Mode of Passenger trips % of total
transport (millions) trips
Motorised passenger
vehicles 59,512 82.5%
Public transit
9,568 13.3%
Rail
2,830 3.9%
Air
201 0.3%
Total
72,111 100%
Source: BMVI (2017, p. 217)
11 :: Car Sharing in Germany: A Case Study on the Circular EconomyPassenger kilometres by mode
The distances that passengers are travelling in Germany are also increasing for all modes of
transport. Over the 10-year period from 2006 to 2016, the distance travelled in Germany by
passengers in motor vehicles has increased by 9.4%. Similar growth has been seen for public
transport (transit and rail combined) at 10.9%, while air-travel distances increased by 15% over
the period (BMVI, 2017, p. 219). Figure 7 provides an overview of passenger-kilometres by mode
of transport over the most recent decade for which statistics are available (2007-2016).
Figure 7. Passenger-kilometres by mode of motorised transport in Germany (in billions)
1,400
1,200
1,000
Billion passenger-km
800
600
400
200
0
2007 2008 2009 2010 2011 2012 2013 2014 2015 2016
Year
Motorised passenger vehicles Public transit Rail Air
Data source: BMVI (2017, p. 219)
Number of passenger vehicles in Germany
As of January 2018, there were nearly 46,475,000 motorised passenger vehicles registered in
Germany (Kraftfahrt-Bundesamt, 2018a). In recent years, the number of vehicles has increased
by about 1.3% annually (BMVI, 2017, p. 133).
Fuel types and emission standards
The most commonly used fuels for passenger cars in Germany as of 2018 are petrol (65.5%) and
diesel (32.8%) (Kraftfahrt-Bundesamt, 2018a). The number of electric vehicles increased to
53,861 (a dramatic increase of 53.3% over the previous year) and the stock of plug-in hybrid
vehicle to 44,419 vehicles (an even higher annual growth of 111.8%) (Kraftfahrt-Bundesamt,
2018a). Though this growth rate of e-mobility is significant, electric vehicles (BEV and PHEV)
remain a very small share of the vehicle fleet at only 0.2% (i.e. 2/10 of 1%).
Car Sharing in Germany: A Case Study on the Circular Economy :: 12The number of passenger cars with the currently best emissions class (Euro 6) rose to nearly 9,318,000 vehicles and Euro 6 vehicles now make up 20% of the motor-vehicle fleet in Germany (Kraftfahrt-Bundesamt, 2018a). Most passenger cars in Germany only comply with the weaker emission classes Euro 5 and 4 (about 28% and 31%, respectively) (Kraftfahrt-Bundesamt, 2018a). Transport emissions in Germany Over the period 1995-2014, exhaust-gas volumes of nitrogen oxides (NOx) dropped by 55% and particulate-matter (PM) emissions dropped by 68% (UBA, 2017b). These emission reductions would have been even higher if the vehicle-kilometres travelled by passenger vehicles in Germany had not been increasing over the same period. The increasing share of diesel-powered vehicles over the period also prevented further emission reductions in NOx and PM than would have happened otherwise (UBA, 2017c). During the period 1995-2014, motorised passenger vehicles produced less greenhouse-gas emissions per passenger-kilometre in Germany. However, the passenger-kilometres travelled by these vehicles increased by 17% over the period 1995-2014 (UBA, 2017c). The rise in demand for mobility largely offset gains in vehicle efficiency, leading to a modest reduction of 2% in the overall carbon emissions of cars from 1995 to 2014 (UBA, 2017b). This dynamic within the car sector in Germany is an example of the rebound effect, wherein efficiency gains are partly, completely or over-compensated by increases in overall consumption. From 1990 to 2014, while the total GHG emissions in Germany declined by 27.7%, the GHG emissions of the transport sector decreased by only 2.6% in that period (UBA, 2017b). Greenhouse gases from traffic have even risen recently. Germany’s Federal Environmental Agency estimated that 2016 GHG emissions were 1.8 million tonnes (1.1%) higher than they were in 1990 (UBA, 2017b). A central climate-policy challenge for the German is how to ensure the transportation sector contributes to achieving the country’s emissions targets. Box 3. The German automotive industry The automotive industry plays a crucial role in the German economy, with Germany currently the fourth largest automobile-producing nation in the world (after China, the USA and Japan) (BMWI 2017). Employment in the German automotive industry There were 820,200 employees working in the production of automobiles and automotive parts. Compared to the previous year, this number has risen by 1%, and is now at its highest level since 1991 (VDA, 2018). The sector includes manufacturers of motor vehicles and engines (479,800 employees), parts suppliers (305,200 employees) as well as manufacturers of automobile frames, trailers and accessories (35,200 employees) (VDA, 2018). Turnover and gross value added The German manufacturers of automobiles and engines accounted for a revenue of 331.3 billion euros in 2017, which was 5% higher than in the previous year (VDA, 2018). The overall gross value added of the vehicle manufacturing sector was 139 billion euros, which corresponds to about 5% of total gross value added in Germany. (Statistisches Bundesamt, 2018, p. 20). 2.3 Current use of car sharing in Germany In Germany, the number of people using car sharing has grown rapidly in recent years. As of January 2018, there were 2,110,000 customers registered with 165 car-sharing providers in 677 different German cities and communities (BCS, 2018a). Compared to the previous year, 80 additional cities and communities now offer car sharing (BCS, 2018a). In absolute numbers, Berlin 13 :: Car Sharing in Germany: A Case Study on the Circular Economy
is the city with the most car-sharing cars. However, when calculated per 1,000 inhabitants,
Karlsruhe has the highest car-sharing density (BCS, 2017b).

Though the car-sharing sector is growing quickly in Germany, it remains a small portion of overall
motor-vehicle transportation. We estimate that in 2017, about one billion passenger-km were
provided by car sharing. This represents about 0.1% (i.e. 1/10 of 1%) of total motor-vehicle
passenger-km in Germany in 2017, which totalled 965.5 billion passenger-km in 2017 (BMVI,
2017, p. 219). Currently, ten percent of car-sharing vehicles in Germany are electric or hybrid
vehicles (BCS, 2018b), a percentage share that is around 100 times higher than the national
passenger car fleet (Kraftfahrt-Bundesamt, 2017).

According to Firnkorn and Shaheen (2014), two key methodological challenges make empirical
evaluations of car sharing difficult: 1) impacts only stabilise over a timeframe of years; and 2) there
is a lack of consistent standards for car sharing evaluations, with results strongly dependent on
the method chosen.
Generally, car ownership is linked to various factors, such as the personal situation of a person
(e.g. family structure) or the accessibility of different modes of transport. Additionally, policy
decisions can have a significant impact on consumers’ behaviour, e.g. the introduction of city tolls
or parking fees.
The extent to which car sharing makes economic sense for a person is closely related to the
distance driven per year. As shown in Figure 8, driver-owned cars have fixed costs that must be
paid regardless of how far the vehicle is driven, making private ownership more expensive than
car sharing at a low annual mileage. On average, a person would need to drive more than 10,000
kilometres per year until the cost of a private car becomes cheaper than the cost of using car
sharing (BCS, 2017a).

Car Sharing in Germany: A Case Study on the Circular Economy :: 14
Figure 8. Average cost comparison: driver-owned car versus car sharing

                            5,000 €

                            4,500 €

                            4,000 €

                            3,500 €
  Total cost per year (€)

                            3,000 €

                            2,500 €

                            2,000 €

                            1,500 €

                            1,000 €

                             500 €

                               - €
                                      0   1,000   2,000   3,000    4,000     5,000 6,000 7,000 8,000            9,000 10,000 11,000 12,000
                                                                            Vehicle kilometres per year

                                                          Private vehicle           Station-based car sharing

Source: Adapted from BCS (2017a). In this comparison, the driver-owned car is one of the 10 cheapest
compact cars in Germany. The monthly costs were calculated using the ADAC car cost calculator, while the
car-sharing rate is a standard rate of a station-based provider without any discount. Fixed costs for car sharing
include the registration fee, security package and the basic price of membership.

Table 2 shows a cost breakdown. A significant portion of private-car costs are fixed costs or
depreciation, which are typically considered only at the time of purchase but not taken into account
in everyday decision-making regarding the costs and benefits of making a particular trip.

Table 2. Average annual costs per driver-owned car and car sharing costs (8,000 km per year, 667 km
per month) in EUR

                                                               Driver owned cars                    Car sharing

 Fixed costs
                                                               €960                                 €176
 Costs for repair
                                                               €298                                 -
 Operating costs / travel costs
                                                               €605                                 €2,780
 Loss in value
                                                               €1.620                               -
 In total
                                                               €3,483                               €2,956
Source: Adapted from BCS (2017a). The monthly costs were calculated using the ADAC car cost calculator,
while the car-sharing rate is a standard rate of a station-based provider without any discount. Fixed costs for
car sharing include the registration fee, security package and the basic price of membership.

One of the central questions related to the use of car sharing is the extent to which private cars
are replaced by the use of car-sharing services. Box 4 provides a brief overview of recently
estimated and observed replacement rates relevant to the German context.

15 :: Car Sharing in Germany: A Case Study on the Circular Economy
Box 4. Replacement of private cars and passenger kilometres due to car sharing – as overview
Private-car replacement
Studies examining the question of private-car replacement rates have returned widely differing
results. Reported replacement-rate figures dependent on the car-sharing scheme (e.g. free-floating or
station-based), location-specific factors (e.g. availability of public transport) and also the study design
itself. Findings of recent studies include:
One car-sharing vehicle (free-floating and station-based) replaces three private cars on average
(team red, 2015, p. 19).
One car-sharing vehicle (free-floating and station-based) replaces four to eight vehicles. (MOMO,
2010, p. 80).
One car-sharing vehicle (station based) replaces 16 private cars (team red, 2018).
One car-sharing vehicle (station based) replaced 8 to 20 private cars (BCS, 2016, p. 4).
Fifteen percent (15%) of users of station-based car sharing reported that they shed their private
vehicle due to car sharing, while 7% of users of free-floating car sharing reported this (Giesel &
Nobis, 2016, p. 1).2
Together, the above studies identify a range of replaced private vehicles due to car sharing of
between 3 and 20 cars.
Reduction in net vehicle-kilometres due to car sharing
A 2015 study of car sharing carried out for the city of Munich found that use of car sharing led to a
reduction in total vehicle-kilometres driven. While car-sharing customers drove an additional 11.2 million
yearly kilometres via car sharing, the vehicle-replacement effect also led to a reduction of 52.5 million
yearly kilometres driven via private vehicles. Thus, for every car-sharing kilometre driven, 4.7 private-
vehicle kilometres were not driven by the group that would have been otherwise, yielding a net reduction
of 3.7 vehicle-kilometres (team red, 2015, p. 25).
Implications for this scenario analysis
Based on the above data, the following assumptions will be taken into the 2030 scenario analysis:
Private-car replacement: a car-sharing vehicle replaces three private vehicles, yielding a net
reduction of two passenger vehicles (Basis: team red, 2015)
Reduction in vehicle-kilometres: for every passenger-kilometre covered via car-sharing vehicle
covers, 4.7 private-vehicle kilometres are not driven, yielding a net reduction of 3.7 passenger-
kilometres (Basis: team red, 2015)
However, due to the high degree of uncertainty around these parameters, especially in the long-
term future wherein autonomous vehicles are expected to drive down costs and blur the boundaries
amongst ridesharing, car sharing and public transport, a third 2030 scenario will relax these two
assumptions as a form of sensitivity analysis.
2 Applying these findings of Giesel & Nobis (2016) to the 2018 car-sharing data provided by BCS
(2018a) would yield a private-vehicle replacement rate of 11 private vehicles per car-sharing
vehicle in Germany (a replacement rate of 8 for each station-based car-sharing vehicle and a rate
of 14 for each free-floating car-sharing vehicle); author‘s own calculation.
Car Sharing in Germany: A Case Study on the Circular Economy :: 162.4 Base-year parameters
For this case study, the base-year situation was defined by using the most recent reliable data
available as of June 2018. The data years for the base-year parameters generally range from 2016
to 2017. The data collected for the base year focus on automotive transport only, including
privately owned cars as a whole as well as the use of car-sharing vehicles (see Table 3). Official
statistics of the German government were used wherever possible. The car-sharing statistics used
were mostly based on the annual statistic reported by the German car-sharing association
(Bundesverband CarSharing e.V.) or taken from prior car-sharing studies. If the year 2030 is also
shown in the column “Data year” that parameter is also used as an assumption in the 2030
scenarios.
Table 3. Base-year parameters for passenger vehicles: production, stock, lifespan and use
Parameter Parameter value Source
(Data years)
VEHICLE PRODUCTION
New vehicles produced 3,440,000 (2017) Kraftfahrt-Bundesamt (2018b,
for German market (all p. 1).°
fuel types)
New vehicles produced 54,492 (2017) Kraftfahrt-Bundesamt (2018b,
for German market p. 1).°
(electric) BEV and PHEV only.
VEHICLE STOCK
Total number of 46,474,594 (2017) Kraftfahrt-Bundesamt (2018a,
motorised passenger p. 1).° As of 1.1.18.
vehicles (all fuel types)
Total number of 98,280 (2017) Kraftfahrt-Bundesamt (2018a,
motorised passenger p. 1).° As of 1.1.18. BEV and
vehicles (electric) PHEV only.
Total number of car- 17,950 (2017) BCS (2018a, p. 1).° As of
sharing vehicles (all fuel 1.1.18.
types)
Percentage of car- 10.3% (2017) BCS (2018c, p. 1).° As of
sharing vehicles that are 1.1.18.
electric BEV and PHEV only.
VEHICLE LIFESPAN
Average lifespan of 13 years (2017, 2030) Kraftfahrt-Bundesamt (2011, p.
passenger motor vehicle 9).°
Average lifespan of a 3 years (2017, 2030) UBA (2013, p. 1).° Authors
car-sharing vehicle (in assume vehicles then enter
first use) used-vehicle market.
Average remaining 7 years* (2017, 2030) Authors assume all cars reach
lifespan of a car-sharing same average vehicle-
17 :: Car Sharing in Germany: A Case Study on the Circular Economyvehicle kilometres (i.e. 175,000 km)
before scrapping.
VEHICLE USE
Total number of annual 965.5 billion (2016) Kraftfahrt-Bundesamt (2017c,
passenger-km p. 219).°
Total number of annual 625.5 billion (2016) Kraftfahrt-Bundesamt (2017b,
vehicle-km p. 1).°
Total number of annual 59.5 billion (2016) Kraftfahrt-Bundesamt (2017c,
passenger trips p. 217).°
Annual vehicle-km per 13,459* (2016, 2030) Calculated from parameters in
private vehicle this table.
Annual vehicle-km per 30,500* (2016, 2030) ifmo (2016, pp. 104-5).°
car-sharing vehicle Calculation is a weighted
average for station-based and
free-floating car sharing.
Average private-vehicle 1.54* (2016, 2030) Calculated from parameters in
occupancy (number of this table.
persons)
Average private-vehicle 1.94 (2017, 2030) BCS (2018, personal
occupancy (number of communication, 12.07.2018)
persons)
Average passenger-km 16.2* (2016, 2030) Calculated from parameters in
per trip (private vehicles) this table.
Average passenger-km 36.0* (2016, 2030) ifmo (2016, p. 105).°
per trip (car-sharing Calculation is a weighted
vehicles) average for station-based and
free-floating car sharing.
EFFECTS OF CAR SHARING ON VEHICLE COUNTS AND TRAVEL
Net reduction of 2 vehicles (2016, 2030) team red (2015, p. 19)°
passenger vehicles per
car-sharing vehicle
Net reduction in total 3.7 pkm (2016, 2010) team red (2015, p. 25)°
pkm of motor vehicles
per pkm covered by car
sharing
* Own calculation
° Hyperlink to source data
Production-related impacts
This case study includes an analysis of the expected climate impacts of both vehicle production
and use. Table 4 provides an overview of the estimated average greenhouse-gas emissions
(measured in CO2e) stemming from automobile production. Average-value estimates,
differentiated for fossil-fuel vehicles as a whole and electric vehicles as a whole are provided based
on Helms, et al (2016).
Car Sharing in Germany: A Case Study on the Circular Economy :: 18Table 4. Base-year parameters for vehicle production
Parameter Parameter value Source data used
(Data year)
CO2e emissions (kg) per 6,700§ (2016, 2030) Helms, et al (2016, p. 79)°
vehicle produced (fossil-
fuel vehicles)
CO2e emissions (kg) per 10,100§ (2016, 2030) Helms, et al (2016, p. 79)°
vehicle produced
(electric vehicles)
§ Own estimate of average value based on provided data
° Hyperlink to source data
Use-related impacts
Table 5 provides the average climate impacts for fossil-fuel and electric vehicles, respectively.
According to the German Ministry for Environment (UBA), due to several factors (average size,
age and power-train differences), car-sharing vehicles emit 16% less CO2 per kilometre on
average than private passenger vehicles (UBA, 2013).
Table 5. Base-year parameters for vehicle use
Parameter Parameter value Source data used
(Data year)
Average CO2 emissions .216* (2016) UBA (2018, p. 1)° Note:
(kg) per vehicle-km Calculated from source data
(private vehicle; fossil- (.140 kg per pkm) using
fuel) average vehicle occupancy for
private vehicles (see Table 3)
Average CO2 emissions .117§ (2015) Schallaböck & Fischedick
per vehicle-km (private (2012, p. 9)°
vehicle; electric)
Carsharing per-km 84% (2013, 2030) UBA (2013, p. 1)°
climate impacts, as % of
private cars
* Own calculation
§ Own rough estimate of average value based on provided data
° Hyperlink to source data
The above parameters were entered into a spreadsheet model to establish the functional
relationships amongst these variables, both for the base-year results as well as their role as bases
for the 2030 scenarios.
19 :: Car Sharing in Germany: A Case Study on the Circular Economy2.5 Business-as-usual scenario for 2030 2.5.1 Scenario definition In the BAU Scenario 2030, car sharing continues its rapid growth while largely retaining its present- day definition as a mix of station-based and free-floating car sharing. In this scenario, ridesharing is not considered nor do autonomous vehicles make large inroads into driving down costs and blurring the boundaries amongst various shared-mobility schemes. By 2030, ½ of 1% of passenger-kilometres are covered by car sharing in the BAU scenario. This represents ambitious compound annual growth of around 12% per year but is not a fundamentally disruptive transformation. Also in this scenario, German public policy and automobile-industry innovation are able to steer the passenger-vehicle sector toward a set of technological innovations that contribute to the country being able to achieve its greenhouse-gas emissions targets. For the specifics of how this is accomplished, the BAU 2030 scenario is based on recent scenarios developed by Öko-Institut for Agora Verkehrswende (2018), which provides a set of parameters for our scenario model, wherein an acceleration of electro-mobility puts 5 million electric vehicles (BEV and PHEV) on the road in Germany by 2030. More importantly, however, the scenario assumes significant improvements in the average fuel efficiency of new vehicles over the 12-year period will dramatically drive down average greenhouse-gas emissions per vehicle-kilometre. The Circular 2030 scenarios also use this same set of underlying vehicle-efficiency achievements, the assumption of 5 million electric vehicles and the assumption that 20% of car-sharing vehicles are electric by 2030. Using this same set of assumptions in all scenarios isolates the effect of the circular-economy aspects of interest in this case study Car Sharing in Germany: A Case Study on the Circular Economy :: 20
2.5.2 Assumptions
Table 6. Additional assumptions for the 2030 BAU Scenario

 Parameter                    Parameter value                  Source data used
                              (Data year)

 Total number of annual       991.8 billion                    BMVI (2014, p. 5)
 passenger-km (as in          (all 2030 scenarios)
 government forecast
 before applying BAU
 2030)
 Total number of electric     5 million                        Agora Verkehrswende (2018,
 vehicles (BEV and            (all 2030 scenarios)             p. 5)°
 PHEV)
 Percentage of car-           20%                              Own assumption. As car-
 sharing vehicle stock that   (all 2030 scenarios)             sharing vehicles are only used
 is electric (BEV and                                          3 years in that application, they
 PHEV)                                                         are on average newer, so a
                                                               higher % of electric vehicles is
                                                               reasonable.
 Average CO2 emissions        .146§ (all 2030 scenarios)       Agora Verkehrswende (2018,
 (kg) per vehicle-km                                           p. 10)°
 (private vehicle; fossil-
 fuel)
 Average CO2 emissions        .059 (all 2030 scenarios)        Schallaböck & Fischedick
 per vehicle-km (private                                       (2012, p. 9)°
 vehicle; electric)
 Percentage of                0.5% (i.e. 1/2 of 1%)            Assumption: Corresponds to
 passenger-kilometres                                          12% compound annual growth
 covered by car sharing                                        rate (see text above).
* Own calculation
§ Own rough estimate of average value based on provided data

° Hyperlink to source data

21 :: Car Sharing in Germany: A Case Study on the Circular Economy
3 :: Step 2: Defining the Circular Scenario Departing slightly from the CIRCULAR IMPACTS case-study methodology laid out by Smits & Woltjer (2017), this case study will include two circular scenarios for 2030. The reason for this is the high degree of uncertainty surrounding the assumptions related to how car sharing will affect other modes of transport in 2030. In the first circular-economy scenario (titled Circular “Green” 2030), car sharing experiences disruptive growth while acting as a catalyst for reducing private-vehicle ownership and use. In the second circular-economy scenario (titled Circular “Gray” 2030), the disruptive growth of shared mobility attract users from public transport, while the dynamics associated with autonomous vehicles (lower costs, higher convenience) lead to an increase in the number of motor vehicles and their travel. The concept of “car sharing” as used today is no longer of central importance in a world of multimodal shared mobility. In both circular scenarios, there is disruptive growth, with 2.5% of the passenger-kilometres in motorised passenger vehicles taking place via car sharing (shared mobility in the Circular “Gray” scenario). While this percentage seems small, it would mean car-sharing passenger-kilometres rise to a level equivalent to 28% of public transport’s current passenger-kilometres by 2030. 3.1 Scenario parameters Table 7. Assumptions used in the scenario analysis Assumption Circular “Green” 2030 Circular “Gray” 2030 Percentage of 2.5% covered by car sharing 2.5% covered by shared passenger-kilometres mobility covered by car sharing Net reduction of Reduction of 2 vehicles Increase of 0.1 vehicles (10%) passenger vehicles per car-sharing vehicle Net reduction in total Reduction of 3.7 pkm Increase of 0.1 pkm (10%) pkm of motor vehicles per pkm covered by car sharing With all the scenarios and parameters defined, the various scenarios were analysed using a spreadsheet model. Car Sharing in Germany: A Case Study on the Circular Economy :: 22
4 ::                             Step 3: Changes in the Key Sector

   4.1 Scenario results
Effects on passenger-km. Figure 9 shows the case-study results for the annual passenger-km
travelled in Germany by motor vehicles in 2030, breaking them down by use application (private
car or car sharing) as well as energy source (fossil fuel or electric). Including the base year of 2017
allows a comparison to today’s situation. In the Circular “Green” scenario, the total passenger-km
of motorised passenger vehicles is reduced by 7% compared to the BAU scenario, whereas the
Circular “Gray” scenario drives an increase of 2% in passenger-km.

Figure 9. Annual passenger-km in Germany (motorised passenger vehicles)
                                      1,200

                                                          0.1
                                                                              1.0
                                                           1.0       3.9                                           5
                                                  2.0
                                      1,000
                                                                                            5                 18
                                                                        104                                  102
                                                                                           18
                                                                                           102
                                       800
             Passenger-km (bilions)

                                       600

                                                    962
                                                                        866                                  869
                                       400                                                 783

                                       200

                                         0
                                                                                     Circular "Green"   Circular "Gray"
                                              Base Year (2017)   BAU Scenario 2030
                                                                                      Scenario 2030     Scenario 2030
    Car sharing (electric)                          0.1                 1.0                 5                 5
    Car sharing (fossil-fuel)                       1.0                 3.9                18                 18
    Private electric cars                           2.0                104                 102               102
    Private fossil-fuel cars                        962                866                 783               869

Effects on vehicle production. The most dramatic differences amongst the scenarios relates to
the production of new vehicles. Currently, the average lifespan of a car-sharing vehicle in that
application is three years. After this period of time, car-sharing vehicles are typically sold in the
used-car market and become private vehicles.

23 :: Car Sharing in Germany: A Case Study on the Circular Economy
Figure 10. New passenger vehicles in Germany
4,000,000 8,100
520 46,300
2,800 18,700
54,000
3,500,000 109,500
57,900
97,900
3,000,000 1,083,000 1,040,100
2,500,000
1,067,600
New passenger vehicles
2,000,000
3,382,700
1,500,000
2,504,000 2,463,400
1,000,000
1,806,500
500,000
-
Circular "Green" Circular "Gray"
Base Year (2017) BAU Scenario 2030
Scenario 2030 Scenario 2030
Car-sharing cars (electric) 520 8,100 57,900 46,300
Car-sharing cars (fossil-fuel) 2,800 18,700 97,900 109,500
Private cars (electric) 54,000 1,083,000 1,067,600 1,040,100
Private cars (fossil-fuel) 3,382,700 2,504,000 1,806,500 2,463,400
The circular scenario does differ significantly from the BAU scenario in the way that increases in
car sharing could alter the make-up of the vehicle fleet (Figure 11). In the BAU scenario, without
a significant share of car sharing and barring changes in usage rates of passenger vehicles, the
number of cars would increase by 0.5%, in line with the expected increase in passenger-km. The
circular scenario, subject to the underlying assumptions about passenger-km per vehicle, would
enable the size of the passenger-vehicle fleet to decrease slightly in Germany compared to 2017.
As per the scenario definitions, in each 2030 scenario, the electric-vehicle fleet (BEV and PHEV)
reaches five million units. In the circular scenario, the fleet of fossil-fuel vehicles is reduced quite
substantially by 2030, by 8%.
Car Sharing in Germany: A Case Study on the Circular Economy :: 24Figure 11. Passenger-vehicle stock in Germany
50,000,000 16,000 1,800 70,000
96,000 141,000 697,000
45,000,000 4,930,000
1,415,000
4,303,000
40,000,000
Number of passenger vehicles
35,000,000
30,000,000
25,000,000
46,360,000
42,333,000
20,000,000 38,663,000
15,000,000
10,000,000
5,000,000
-
Base Year (2017) BAU Scenario 2030 Circular Scenario 2030
Car-sharing cars (electric) 1,800 70,000 697,000
Car-sharing cars (fossil-fuel) 16,000 141,000 1,415,000
Private cars (electric) 96,000 4,930,000 4,303,000
Private cars (fossil-fuel) 46,360,000 42,333,000 38,663,000
In this case-study analysis, former car-sharing vehicles were assumed to achieve the same
lifetime vehicle kilometres, on average, as their private-use counterparts. This means, however,
that due to their intensive first use in car sharing, former car-sharing vehicles can be expected to
have a total useful life of only 10 years on average (compared to 13 years for private vehicles).
25 :: Car Sharing in Germany: A Case Study on the Circular EconomyYou can also read