Understanding Saudi Private Sector Employment And Unemployment
←
→
Page content transcription
If your browser does not render page correctly, please read the page content below
Understanding Saudi Private Sector Employment And
 Unemployment
 Farah Hani, Michael Lopesciolo

 CID Research Fellow and Graduate Student
 Working Paper Series
 No. 131
 March 2021 (original draft March 2019)

 © Copyright 2021 of Hani, Farah; Lopesciolo, Michael; and the President and
 Fellows of Harvard College
Understanding Saudi Private Sector Employment And Unemployment

Farah Hani1, Michael Lopesciolo2

Working Paper, March 2021

Abstract:

This paper analyzes the changes in Saudi employment and unemployment between 2009 and 2018
and argues that a supply-demand skill mismatch exacerbated by insufficient job creation, and
prevalent Saudi preferences and beliefs about employment underpin the high unemployment
problem that coexists with low Saudi employment in the private sector in the country.

Keywords: Saudi Arabia, Employment, Unemployment, Occupations, Jobs

JEL Codes: J21, J23, J24

This paper was originally written in fulfillment of the requirements for the degree of Master in
Public Administration in International Development, at John F. Kennedy School of Government,
Harvard University. The work was made possible by the Growth Lab’s “Industry Diversification
and Job Growth in Saudi Arabia” initiative, which provided access to Saudi labor market data
extending between the years 2009-2016. The opinions expressed in this paper do not reflect those
of Harvard University, The Growth Lab or the Government of Saudi Arabia. The usual disclaimers
apply.

We thank Ricardo Hausmann, Anders Jensen, Michael Walton and colleagues at the Growth Lab
for their valuable comments on this work.

1
 Research Fellow at Harvard’s Center for International Development – the Growth Lab; MPA/ID 2019
2
 MPA/ID 2019

 2
Executive Summary
Why does unemployment persist in Saudi Arabia, a country with labor shortages that had
compelled the private sector to recruit workers from abroad?
Unemployment is a top policy priority for Saudi Arabia. Saudi Arabia has been facing the
challenge of high unemployment amid low private sector employment of its citizens for over two
decades. The unemployment rate in Saudi Arabia has hovered around 12% since at least 2001;
with youth and female unemployment at much higher level; ~27% and 33%, respectively, in 2017.
In the same year, only 18.6% of private sector jobs in Saudi Arabia were held by Saudi nationals.
This paper follows a problem-driven diagnostic approach to characterize the phenomenon of high
Saudi unemployment, and its coexistence with low employment levels of Saudis in the private
sector. We analyze the most important trends related to Saudi employment and unemployment in
the private sector, including the cost of hiring Saudi versus expatriate workers, to assess the factors
prohibiting greater Saudi employment.
We observe that while Saudis have become more educated, unemployment among this group is on
the rise, and it is driven by educated youth – rather than educated and experienced workers. By
2018, high unemployment has become a problem among women with a college degree, followed
by men with a college degree. This has shifted from the situation in 2009, where the numbers of
unemployed Saudi men and women were comparable. The increase in female labor participation
over the past decade happened at a faster pace than female employment in the private sector. This
is similar to the increase in supply of educated youth happening at a faster pace than youth
employment. Simultaneously, we observe significant wage gaps between men and women across
industries and occupations.
From a cost perspective, we provide evidence suggesting that the cost or price to hiring Saudi
workers remains high compared to expatriate workers. Not only does wage data depict Saudis as
costlier than expatriates across the skill distribution, we also find the de facto minimum wage to
be binding. The minimum wage has been hiked over the past decade to encourage Saudis to take
up private employment. While Saudi workers are more expensive, low Saudi job tenure is an
additional notable concern for integration into the private sector. Interestingly, we provide
evidence suggesting fixed costs associated with hiring women. This could potentially affect firms’
decisions to hire Saudi women.
Based on these symptoms, we conclude high unemployment persists in Saudi Arabia for two main
reasons. The first is, a supply-demand skill mismatch, exacerbated by insufficient job creation
(relative to increasing Saudi labor supply). This is evident due to significant concentration of new
jobs in low-skilled labor-intensive sectors, potentially unattractive to educated men and women.
The second is, Saudi workers’ preferences and beliefs on what is considered to be suitable work,
generating a high reservation wage among Saudi workers. This is evident due to low Saudi tenure,
and reasons given as to why Saudi workers leave their employment.

 3
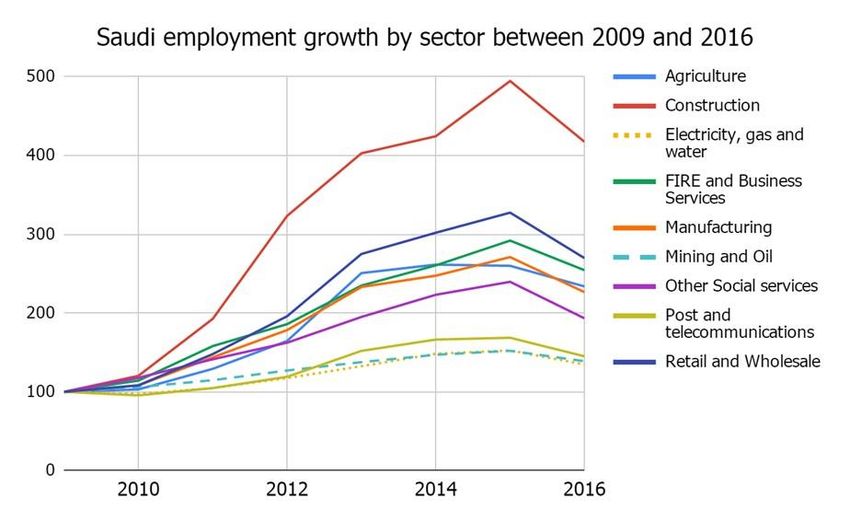
Table of Contents
1. Introduction ........................................................................................................................................... 6
2. Saudi Development Model And Labor Market Policies ....................................................................... 9
3. Labor Market Diagnostic .................................................................................................................... 12
 Data ......................................................................................................................................................... 12
 The Structure Of Employment And Unemployment In Saudi Arabia .................................................... 14
 Cost Barriers Influencing Saudi Employment ........................................................................................ 22
 Notes on the Nitaqat (Saudization) program........................................................................................... 29
4. Saudi Syndrome: Explaining The Persistence of High Unemployment-Low Private Sector
Employment ................................................................................................................................................ 31
 Supply-Demand Mismatch, Coupled With Insufficient Job Creation .................................................... 31
 Saudi Preferences And Beliefs................................................................................................................ 36
5. Conclusion .......................................................................................................................................... 37
References ................................................................................................................................................... 39

 4
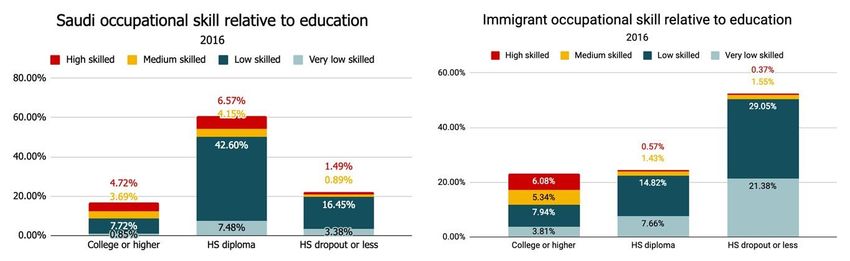
Table of Figures

FIGURE 1: SAUDI UNEMPLOYMENT RATE....................................................................................................................... 9
FIGURE 2: SAUDI EMPLOYMENT RATE ........................................................................................................................... 9
FIGURE 3: SAUDI LABOR FORCE COMPOSITION: SECTORAL AND SKILL MIX ............................................................... 10
FIGURE 4: NITAQAT COMPLIANCE RATES, FIRMS WITH AT LEAST 10 EMPLOYEES ..................................................... 11
FIGURE 5: LABOR FORCE PARTICIPATION IN SAUDI ARABIA ........................................................................................ 15
FIGURE 6: FEMALE LABOR PARTICIPATION BY INCOME LEVEL (2017) ........................................................................ 15
FIGURE 7: SAUDI LABOR FORCE PARTICIPATION, BY SCHOOLING LEVEL .................................................................... 16
FIGURE 8: EMPLOYMENT OF SAUDI WOMEN................................................................................................................ 17
FIGURE 9: SAUDI UNEMPLOYMENT .............................................................................................................................. 17
FIGURE 10: SAUDI WOMEN WAGE PREMIA .................................................................................................................. 18
FIGURE 11: SAUDI AND EXPATRIATE OCCUPATIONAL SKILL LEVEL, BY EDUCATION GROUP ..................................... 19
FIGURE 12: CHANGE IN SAUDI UNEMPLOYMENT, 2011 VERSUS 2018, BY GENDER AND EDUCATION LEVEL ............. 19
FIGURE 13: SAUDI UNEMPLOYMENT BY AGE GROUP .................................................................................................. 20
FIGURE 14: CHANGE IN SAUDI EMPLOYMENT, BY AGE ............................................................................................... 20
FIGURE 15: UNEMPLOYMENT AMONG SAUDIS HOLDING AT LEAST A DIPLOMA (OR ABOVE) – 2018Q2 .................... 21
FIGURE 16: SAUDI VERSUS EXPATRIATE WORKERS - WAGE DISTRIBUTION ................................................................ 23
FIGURE 17: SAUDI EMPLOYMENT BY WAGE CATEGORY.............................................................................................. 24
FIGURE 18: CHANGE IN FEMALE EMPLOYMENT IN FIRMS ............................................................................................ 26
FIGURE 19: TENURE VARIATION BY WAGE LEVEL, FOR EXPATRIATES AND SAUDIS (2016) IK ................................... 27
FIGURE 20: COMPLETED TENURE BY OCCUPATION (2016) .......................................................................................... 28
FIGURE 21: SAUDI WORKER TENURE DISTRIBUTION (PRE- AND POST-2013) .............................................................. 28
FIGURE 22: GROWTH IN SAUDI EMPLOYMENT, BY SECTOR ......................................................................................... 32
FIGURE 23: JOB APPEARANCES IN THE SAUDI ECONOMY (2015-2016) ........................................................................ 32
FIGURE 24: DISTRIBUTION OF INDIVIDUAL LABOR MARKET ENTRANTS AND EXITERS (2010-2016) .......................... 33
FIGURE 25: EXPORTERS’ LABOR PRODUCTIVITY AND WORKFORCE COMPOSITION ..................................................... 35
FIGURE 26: SECTOR PREFERENCE FOR SAUDI WORKERS ............................................................................................. 36
FIGURE 27: WAGE PREMIUM FOR SAUDIS IN THE PRIVATE SECTOR, COMPARED TO EXPATRIATES ............................ 37
FIGURE 28: SAUDIZATION SCORES WITHIN THE INITIAL COHORT, JUNE 2011 VERSUS JUNE 2012 .............................. 43
FIGURE 29: SUMMARY STATISTICS, SAUDIZATION SCORES WITHIN THE INITIAL COHORT OF FIRMS .......................... 43

 5
1. Introduction
Saudi Arabia has been facing the challenge of high unemployment amid low private sector
participation of its citizens for over two decades. The unemployment rate in Saudi Arabia, high
and stagnant, has hovered around 12% since at least 2001; with youth and female unemployment
at much higher level; ~27% and 33%, respectively, in 2017.3 At the same time, only 18.6% of
private sector jobs in Saudi Arabia were held by Saudi nationals in 2017. The rest were held by
expatriates, who receive lower pay and thinner benefits.4
This relatively low private sector employment of Saudi nationals resulted in large part from Saudi
Arabia’s oil wealth which facilitated widespread and lucrative public sector jobs. A full 42% of
employed Saudis worked directly for the government in 2017. These jobs are widely desired for
their high pay and lenient demands. Expatriates, on the other hand, hold most positions in the
private sector, and have long been favored given significant wage gaps; the government’s National
Transformation Plan reports the ratio of Saudi to expatriate cost of labor at 400%. In 2016, for
instance, the median monthly wage for expatriates was only 900 SAR (US$240), compared to
around 3000 SAR (US$800) for Saudis.
Confounding demographic, political, and fiscal dynamics have made this situation a top concern
for Saudi policymakers. First, according to population data published by the Saudi General
Authority for Statistics, 59% of Saudi Arabia’s population was under 30 years old in 2016. Second,
the 2015 collapse of oil prices has added a fiscal dimension to the problem: The Saudi
government’s wage bill reached 45% of total expenditure in 2016, with a fiscal deficit of 17% of
GDP (IMF 2018a). This has constrained its ability to create swaths of public sector jobs for young
college graduates, 250,000 of whom are exiting university annually (Diwan 2018).
The above factors have compelled Saudi policymakers to actively intervene in the management of
the labor market since 2011, to increase Saudi participation in the private sector. The Saudi
government, similar to other Gulf countries, has always sought to integrate its talent in the private
sector, but the year 2011 marks a distinct turn in its approach to the private sector. More
specifically, the government moved to pursuing a series of price and quantity policies, which aim
to increase the percentage of private sector jobs held by nationals, in an attempt to manage the
unemployment problem. Most distinctively, the lax style that has allowed the private sector to
freely hire expatriates without restrictions and costs came to an end, as the government imposed
binding quota restrictions (Nitaqat program)5 and expatriate levy fees, thus “taxing” the
employment of expat labor to motivate the private sector to absorb Saudi labor.

3
 The Labor Market Bulletin Methodology from the General Authority for Statistics defines an unemployed individual as someone greater than
15-years old who was workless in the week prior to having their household visited as part of the Labor Force Survey, while also having looked
for a job in the past four weeks (and is thus considered economically active). Given that unemployment among expatriates is negligible, only
unemployment rates among nationals are considered throughout this paper.
4
 Data for this section taken from the Labor Force Survey (GASTAT) (2017) and refers to values from 2017 unless otherwise specified.
5
 Nitaqat - the Saudi nationalization (Saudization) program is a minimum quota system mandating Saudi participation in the private sector at the
firm size-industry level

 6
These policy efforts, particularly Nitaqat, have improved the labor market outcomes of Saudi
workers – if measured as increased participation and employment – but have also come at a
significant cost to businesses, which therefore brings about questions on their effectiveness at
nudging the labor market towards the desired equilibrium in the long-run. Saudi employment in
the private sector accelerated after 2011, the year during which Nitaqat program was launched. In
2017, 1.3 million more Saudis were employed than in 2011, and only 20% of those additions were
in the public sector (Labor Force Surveys). The private sector Saudization rate increased from 11%
to 19% over the same period, representing a significant increase in total Saudi private sector
employment. Yet, the 16-month period following the 2011 implementation of Nitaqat, for
example, witnessed a spike in the rate of firm exit, from a pre-reform rate of 19% to 28%,
representing nearly a million lost jobs (Peck 2017).
The tension between Saudi Arabia’s short-term socio-economic goals and long-run diversification
ambitions makes unemployment one of the most pressing priorities facing the country today.
Understanding the dynamics behind unemployment and low Saudi employment in the private
sector can inform future policy choices. In this paper, we aim to analyze the patterns of Saudi
unemployment and employment in the private sector to explain a puzzling phenomenon: persistent
unemployment which coexists with low private sector employment (Figures 1 and 2).
We follow a problem-driven, diagnostic approach to analyze the phenomenon. We start, in Section
2, by providing an overview of the Saudi economic model, to illustrate the symptoms of the labor
market.
The analysis begins in Section 3 which examines employment and unemployment trends, at
individual and sectoral levels. This section presents facts that are relevant to any labor market
policy design in Saudi Arabia. We find that the composition of the employed and unemployed
Saudis has shifted since 2009. In 2009, the numbers of unemployed men and women were
comparable, and the employment of Saudi women in the private sector was modest. By 2018, the
employment of both Saudi men and women has increased, but at the same time the supply of
college-educated Saudis has increased at a faster pace than employment – making the
unemployment problem worse. Additionally, Female labor force participation, especially among
college-educated women – increased. The women entering the labor market are predominantly
college-educated and over the past decade, college-educated women the largest group of
unemployed Saudis, surpassing the quantities of unemployed men.
At the same time, we provide evidence suggesting that the cost or price to hiring Saudi workers
remains high compared to expatriate workers. On one hand, despite the unemployment problem in
Saudi Arabia and the increased supply of educated Saudi workers entering the labor market, the
Saudi minimum wage (also the median wage) is increasing.6 We present evidence of the Saudi, de
facto, minimum wage being highly distortive, with the Saudi wage distribution bunching around

6
 In 2013, the minimum wage for a Saudi worker to count towards a firm’s Nitaqat score changed from SAR 1,500 to SAR 3,000. By the end of
year 2020, after this paper was completed, the new “de facto” minimum wage increased to SAR 4,000.

 7
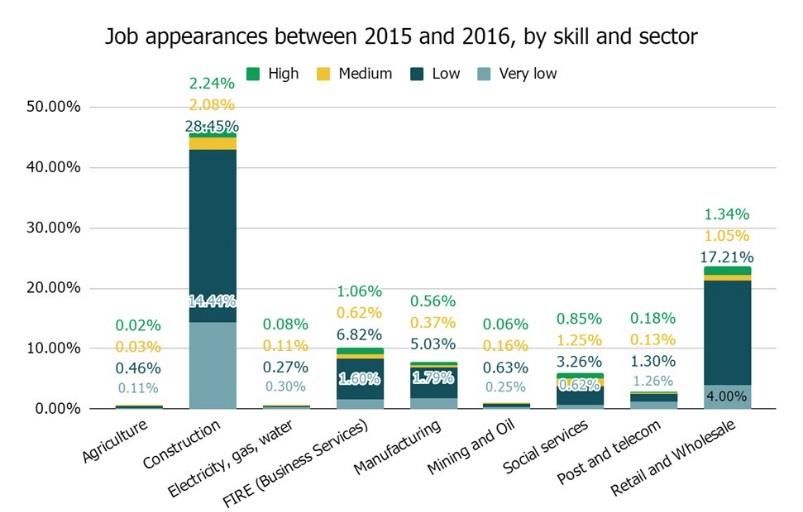
the minimum wage. On the other hand, we discuss job tenure where the mean tenure across the
Saudi labor market equaled around 2.2 years in 2016 – a low average compared to other countries;
for example, the figure in USA is 4 years, and European Union 10 years. While the tenure of both
Saudi and immigrant workers is low, that of Saudi workers is consistently lower than that of
expatriate workers across occupations. We argue this imposes further burden on employers.
Finally, we find evidence suggesting upfront fixed costs associated with female unemployment,
such as those required to prepare the workplace. These additional costs could constrain firms’
ability to hire more women.
Section 4 goes beyond section 3 and asks why these employment and wage dynamics persist, thus
keeping unemployment high and undermining private sector employment. We prioritize two main
pillars that, we believe, answer this question. The first pillar is a supply-demand skill mismatch,
exacerbated by insufficient job creation (relative to increasing Saudi labor supply). Observing job
appearances over the past years reveals that 70% of job appearances between 2015 and 2016 were
suitable for low- or very-low skilled workers. At the same time, between 2010 and 2016, Saudi
entrants to the labor market were concentrated in a 2-3 primarily in clerical occupations. These
imply that the majority of jobs appearing in the economy may not be suitable for the group of
unemployed: increasing educated and increasingly women, and suitable jobs are not available at
an adequate pace.
The second pillar we discuss is Saudi workers’ socioeconomic beliefs and preferences related to
work, generating a higher reservation wage among Saudi workers. In 2015, a Gallup survey asking
Saudis about the sector they prefer to work in revealed that 78% of the unemployed preferred to
work in the public sector. These preferences stem from the perceived probability of lucrative
employment in the public sector and drive a reservation wage that, first, lead to less commitment
to private sector employment – as revealed through the short tenure of Saudi workers. And second,
Saudi workers’ reservation wage in turn compels policymakers to ensure a relatively high
minimum wage to encourage Saudis to take private sector jobs.
We conclude in Section 5, that the instruments put in place throughout the Saudization era were
successful in increasing Saudi employment in the private sector over the past decade. Yet,
ultimately, the unemployment challenge cannot be met by shifting the existing stock of well-
paying jobs from expatriate to Saudi workers. Instead, necessary policy reforms must seek to create
more skilled jobs, while effectively addressing Saudi’s beliefs on employment and their role in the
country’s development. Understanding female unemployment and promoting female inclusion
will require particular attention and a special effort.

 8
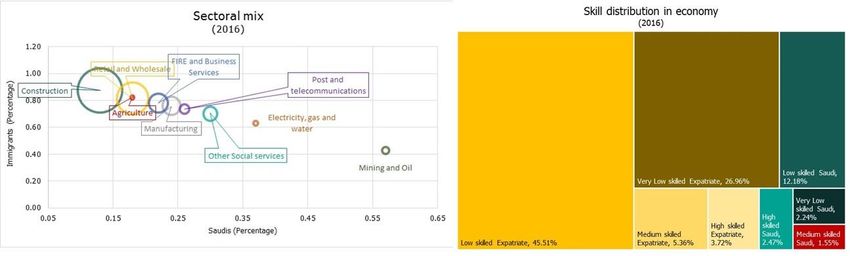
Figure 1: Saudi Unemployment Rate

 Saudi Unemployment Rate
 40%
 35%
 30%
 25%
 20%
 15%
 10%
 5%
 0%
 2009 2010 2011 2012 2013 2014 2015 2016 2017 2018

 Male Female Total

Source: Labor Force Surveys
Figure 2: Saudi Employment Rate

 Saudi Employment Rate
 70% 16%
 60% 14%

 50% 12%
 10%
 40%
 8%
 30%
 6%
 20% 4%
 10% 2%
 0% 0%
 2007 2008 2009 2010 2011 2012 2013 2014 2015 2016 2017

 Saudi Males Total Saudi Females (RHS)

Source: Labor Force Surveys
 2. Saudi Development Model And Labor Market Policies
Following the 1974 oil boom and to expedite its development, Saudi Arabia adopted a model
driven by heavy reliance on oil revenue. Similar to other Gulf countries, infrastructure investments
in Saudi Arabia expanded with the influx of oil revenue; with labor shortages, Saudi businesses
were able to recruit expatriates across the skill distribution, to cover the country’s need for both
labor to work in construction, retail, accommodation sectors and also technical sophistication
beyond the Saudi workforce (Diwan 2016). As such, non-Saudis went from constituting 20% of
the labor force in 1970 to around 60% by the 1990s (Fakeeh 2009). The impact has been long-

 9
lasting: in 2016, more than 80% of non-civil servant jobs are held by foreigners who continue to
lift up the Saudi economy; the majority of sectors, in 2016, constituted predominantly of foreign
workers, with less than 50% of their labor force being Saudi. Finally, 45% of labor in the economy
were low-skilled immigrants (Figure 3).
Figure 3: Saudi Labor Force Composition: Sectoral And Skill Mix

Source: Saudi Social Security Dataset (GOSI)
At the same time, as Saudi businesses turned towards foreign labor, the Saudi government
redistributed oil revenue to citizens by providing lucrative public sector jobs. This is thought to
have dis-incentivized Saudi citizens from pursuing private sector employment. Recent estimates
show that Saudi men working in the public sector make about twice as much as they would in the
private sector (Diwan 2018). Furthermore, female labor participation has been traditionally low in
the conservative Saudi society, where social norms restrict the role of women (Bursztyn, Gonzalez,
and Yanagizawa-Drott 2018). This is further complicated by gender segregation policies requiring
women and men to operate in separate premises of the workplace.
Saudization efforts have been in place since the 1970s, as the Saudi government recognized the
importance of integrating the Saudi workforce in the economy. Yet, enforcement was lax. Some
ad-hoc attempts were made to fully convert specific sectors to national labor, such as a ban on
expatriate labor in wholesale produce markets, gold and jewelry markets, and the taxi market in
2004 (Fakeeh 2009). However, these attempts were short-lived, with public outcry over the 200-
300% price increases in the limousine sector, for example, leading to a reversal of the policy (Al-
Ghamdi 2018). Instead, the Saudi government focused on expanding and nationalizing jobs within
the government and state-owned enterprises.
More recently, several confounding factors created an urgency to diversify as well as a need for
creating new jobs for the growing young population (Diwan 2018). The 2011 regional political
crises, coupled with high youth unemployment, shed the light on the need for more jobs. While
the public sector had been a significant employer, the large Saudi population makes this option

 10
insufficient. Additionally, the oil price shock in 2015 drove revenues down such that the deficit
jumped from 3.4% to 15.8% of GDP. Heavy spending on public wages -- 18.5% of GDP in 2015,
or 45% of public spending -- suddenly looked unsustainable (IMF, 2018a). By 2016 the Saudi
government responded with Vision 2030, a development strategy outlining ambitious plans for
modernizing the country into a diversified, knowledge-based economy (Diwan, 2016). This not
only makes achieving diversification a top priority, but equally important the issue of Saudi
employment in the private sector, as policymakers understand the need for high-skilled labor to
move the economy forward. Combined with a rapidly growing young population; these pressures
have pushed the government to take active measures to address Saudi unemployment.
In June 2011, the country’s Saudization efforts intensified. The economy-wide 30% Saudization
target was swapped for Nitaqat, a system of quotas that varied by firm size and industry (see
Appendix 1), backed up by the option of tightening visa and hiring restrictions for noncompliant
firms. With data monitored credibly through visa records and social security data, compliance was
rapid, with the vast majority of firms shifting from red (insufficient Saudization) to green (meets
Saudization targets) within a year of its implementation (Figure 4). Employment increased
substantially among red and yellow firms, with firms marked as green showing no trend towards
additional employment. Reforms making quotas more stringent were adopted in 2017, with some
sectors targeted for near-100% Saudization, particularly in retail.
Figure 4: Nitaqat Compliance Rates, Firms With At Least 10 Employees

Source: Nitaqat Dataset, Ministry of Labor
Nitaqat was complemented by changes to prices in the labor market, to encourage the Saudi
workforce to accept private sector jobs and reduce the reliance of the private sector on expatriate
workers. Specifically, a monthly expatriate levy of SAR 200 (US$26.70) was enacted in 2012,
payable by firms for each expatriate worker employed. This is a significant surcharge, given that
about a quarter of expatriates are paid only 400 SAR per month. It aimed to reduce the wage gap
between Saudi and expatriate workers. Additionally, in February 2013, the Saudi minimum wage
was doubled to SAR 3,000 per month. These increases were partially borne by the government
through payroll rebates tied to a firm’s Nitaqat band (Evidence for Policy Design, 2015). The

 11
monthly levy was doubled to 400 SAR at the start of 2018, with smaller charges on expatriate
dependents and expatriates working in Saudi-majority firms also put in place (IMF, 2018b). Other
investments have aimed at improving the productivity of Saudi workers and addressing market
failures. Private sector internships were made mandatory, and substantial investments were made
in vocational and university education, job fairs, and job matching programs (Evidence for Policy
Design 2015).
 3. Labor Market Diagnostic
 Data
We follow a diagnostic approach to analyze and understand the factors contributing to the high
unemployment-low private sector employment in Saudi Arabia. We explore:
 • The structure of employment and unemployment in Saudi Arabia, by examining supply
 and demand dynamics from gender, educational and age lenses; and,
 • Cost barriers influencing employment, such as labor regulations, the fixed cost associated
 with hiring Saudis, and worker tenure.
The diagnostic allows us to draw conclusions about the labor market, which we use to construct a
syndrome (Section 4) explaining the persistence of high Saudi unemployment with low Saudi
private sector employment. We leverage literature on the Saudi labor market, overall Gulf labor
trends and dynamics.
To do so, we rely on two data sources: The General Organization for Social Insurance (GOSI) and
the Nitaqat program. The GOSI data is the full, longitudinal social security data of private sector
employees in Saudi Arabia (except for domestic workers), running from 2009 to 2016. Jobholder
and firm characteristics are collected, at the job spell/ contract level, and these start and end date
of employment, monthly wage, age, education, gender, region, sector, sub-sector, occupation title,
and nationality. It includes public sector workers that are enrolled in the insurance scheme (such
as those working for SOEs) but does not include civil servants, military personnel, or police
employees. The dataset available is the full set of contract data between the years 2009 and 2016;
because the policy push for Saudization begins in 2011, we largely focus on 2011 to 2016 data. A
1% random sample of contracts (236,000) is used for the ease of Stata processing. This data can
also be collapsed to the firm level. Some known limitations with the data include:
 ● Data collection on expatriate employment before 2013, and especially before 2011, was
 incomplete, with many expatriates not formally registered with GOSI.

 12
● In addition to the problem of “Ghost Saudization”,7 inconsistencies between wages
 reported to GOSI and actual wages paid, especially to expatriates, may be prevalent.
 Informal employment is also not captured.
 ● The dataset does not give an indication of whether workers that leave their jobs become
 unemployed or join the public sector.
 ● Education data is missing for about 15% of Saudis and 70% of non-Saudis.
The Nitaqat data spans from June 2011 to April 2017 and is comprised of weekly verifications of
a firm’s size, economic activity, Saudization score, and corresponding color band. Both datasets
span the entire private sector. A major limitation is that while both the GOSI and Nitaqat data are
intended to represent the full private sector, the two datasets do not match/merge well.
Additionally, we utilize customs data provided by the Ministry of Economy and Planning in some
calculations of firm exports per capita in Section 4. This is a full set of import and export
declarations for firms and individuals for the years 2009 to 2016, include information on the item
imported/exported by HS code, the time and location of the transaction, the trading partner country,
the value exported or imported, and the firm doing the importing/exporting. This dataset could be
matched with GOSI firm-level aggregations.
Finally, we leverage the publicly available Labor Force Surveys published by the General
Authority for Statistics, as well as Annual Statistics published by the central bank (SAMA).
A larger limitation to the analysis presented in this paper is the omission of the informal economy.
Saudi Arabia defines informal workers as “individuals who have not lawfully entered the country;
not authorized to work, do not have a contract with the employer or not registered at the Ministry
of Labor and Social Development” (Takamol 2017). Informality was estimated at 21.4% in 2016,
a sizeable sector that we are unable to capture or represent in this paper. We note that accounting
for these shadow activities, especially in a future effort succeeds in capturing them would imply
different results than reported in later sections.

7
 Discussions on Nitaqat are often accompanied by anecdotal reports of “Ghost Saudization” – that is, fake
employment whereby Saudi individuals appear on a firm’s payroll but do not assume any tasks or duties. Yet, there
is no concrete evidence or measures of the phenomenon.

 13
The Structure Of Employment And Unemployment In Saudi Arabia
In this subsection, we examine the most important labor supply and demand trends, with the
purpose of clearly defining the attributes of employed and unemployed Saudis, along gender,
schooling level and age dimensions. Unemployment is the concern, and hence characterizing the
unemployed in Saudi Arabia helps inform policy strategies. Yet, the focus solely on the
unemployed is misleading in the context of Saudi Arabia and understanding the characteristics of
Saudis and expatriates employed by the private sector has equal, if not greater, importance.
On one hand, Saudis’ traditional preference for public sector jobs, and the open immigration
system that allows a flexible flow of foreign labor to private firms imply that the composition of
Saudi private sector participation and employment is worthy of close examination to understand
the determinants of their employment. On the other hand, the government’s policies over the past
decade, particularly the Nitaqat program, or the Saudization quota system, has changed the
composition of Saudi (and expatriate) employment in the Saudi private sector. This changing
composition potentially carries several lessons particularly on the areas of success and failure of
these policies. This can ultimately inform a diagnosis of the constraints or enablers of greater Saudi
employment in the private sector.
Gender
Female labor participation in Saudi Arabia has been and remains very low. In 2010, female labor
force participation was 12.9% (Figure 5). Since then, Saudi female labor force participation grew
at a much fast. By 2018, female labor force participation increased to ~20% - a 7.3 pp gain
compared to 2011. Male labor force participation witnessed an increase of ~2 pp. Yet, female labor
participation in Saudi Arabia remains at some of the lowest level, particularly taking into
consideration the country’s income per capita (Figure 6). The problem of low female labor
participation seems to be a problem among women with low levels of schooling: for example,
2018 figures show that female labor force participation increases from less than 10% for women
with secondary schooling or equivalent to more than 60% for women with a diploma or bachelor
degree (Figure 7).

 14
Figure 5: Labor Force Participation in Saudi Arabia

 Labor Force Participation Rate, By Gender
 70.0% 25.0%

 60.0%
 20.0%
 50.0%

 40.0% 15.0%

 30.0% 10.0%
 20.0%
 5.0%
 10.0%

 0.0% 0.0%
 2007 2008 2009 2010 2011 2012 2013 2014 2015 2016 2017 2018

 Saudi Male Total Saudi Female (RHS)

Source: Labor Force Surveys
Figure 6: Female Labor Participation By Income Level (2017)

 Female Labor Participation (2017)
 80

 ISL
 KHM
 VNM
 UZB SWE
 PER
 BLR SYC
 LCA NZL MAC
 AZE CAN CHE
 NOR
 60

 MLI BOL JAMTHA
 GEO ISRGBR AUS
 SGP
 NLD
 QAT
 PRY
 ECU COL URYEST CYP
 BRN DNK
 NAC
 USA
 TGO GHA UKRMNG RUS LTU
 MYSLVA DEU
 AUT IRL LUX
 FIN
 PST
 ARM BRA PRT
 SVKSVN
 KOR
 ESP HIC
 ARE
 CPV
 IDN ECA
 LAC
 TLA
 LCN
 TEC CZE
 ECS OED
 FRA
 EMU
 EUU JPN
 MWI ALB DOM
 BLZ BGR PAN CEB
 MMR ZAF
 MNEARG CHL
 HUN MLT
 POL BEL
 RWA KGZ CIV HNDPHL
 SLV SRB ROUHRV GRC
 MUS
 MKD CRI
 MEX
 UGA
 40

 ITA
 %

 MDA
 GTM
 BGD LAO LKA
 TUR
 WSM BIH
 NPL ZMB
 MRT
 AFG EGY
 20

 MEA SAU
 MNA
 TMN IRN
 PSE XKX
 NER DZA
 IRQ
 0

 6 8 10 12
 GDP per capita in constant 2010 USD, in logs
 Source: World Development Indicators

 15
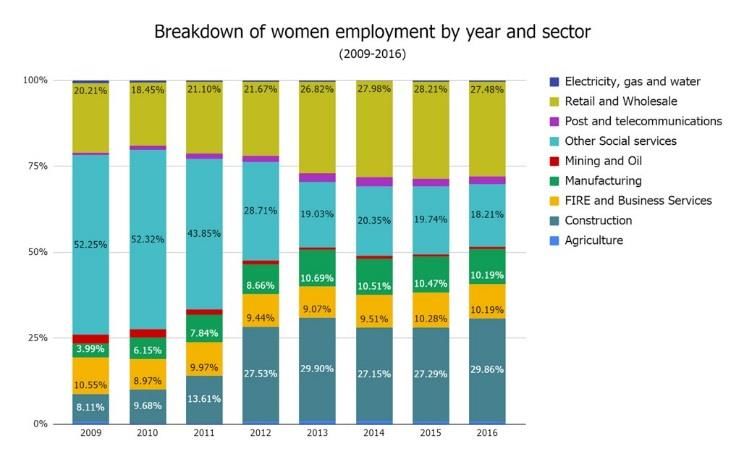
Figure 7: Saudi Labor Force Participation, By Schooling Level

 Saudi LF Participation, by Schooling Level (2018)
 100.0
 90.0
 80.0
 70.0
 60.0
 50.0 Female LF Participation
 40.0 Male LF Participation
 30.0 Total LF Participation
 20.0
 10.0
 0.0
 Illiterate Read & Write Primary Intermediate Secondary or Diploma Bachelor Advanced/ Doctorate
 Equivalent Degree Master
 Degree

Source: Labor Force Survey (2018Q4)
Saudi employment in the private sector has followed a similar dynamic and has increased
significantly for both men and women. Similar to men, jobs held by women are concentrated in
the public sector (Labor Force Surveys). Since 2011, the change in private sector employment has
been rapid: while male Saudis saw an increase in private sector employment of about 45% in 2011
and 2012 and little growth thereafter, Saudi female non-government employment more than tripled
in 2011 and 2012, and has grown by another 50% since 2013. This improvement in female
employment comes from a very low level and therefore is still low.
Saudization policies have helped propel this growth. Nitaqat has contributed to boosting Saudi
women employment, as a premium on Saudization score for each woman hired was initially part
of the quota package (Saudi women counted as two Saudi men). This provision was abolished by
2015 (Husein, Balouziyeh & Burns 2016). Figure 8 provides an indication of the changing female
employment over the past decade: 30% of Saudi women worked in construction, followed by
27.5% in the retail sector in 2016, while social services are the sector where Saudi women make
up the largest percentage of the workforce. According to the Saudi Social Security data (GOSI),
at least 63% of these women are employed in clerical, services and sales; followed by 16% in
specialized jobs and only 7% in managerial jobs.8

8
 Female employment is perceived as more susceptible to Ghost Saudization, yet there is no concrete evidence or
measures of the phenomenon.

 16
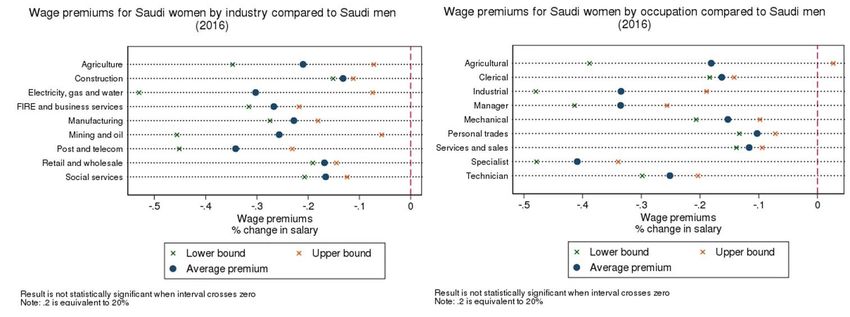
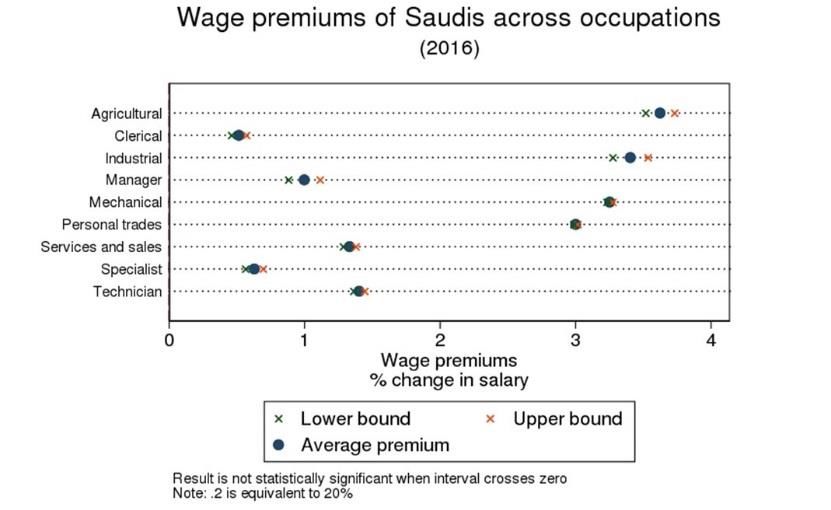
Figure 8: Employment Of Saudi Women

Source: Saudi Social Security Dataset (GOSI)
Yet, more needs to be done as women still represent the biggest fraction of unemployed Saudis.
According to the 2018Q2 Labor Force survey, out of 787,895 million unemployed Saudis, ~40%
are women, with college-educated women the largest group of unemployed individuals in Saudi
Arabia. This figure was ~31.4% in 2011Q2. That is, while female labor participation has been
increasing, especially among college-educated women, this increase in participation is yet to
translate to high female employment. Female unemployment exceeds that of men across age
groups and especially among college-educated individuals (Figure 9).
Figure 9: Saudi Unemployment

Source: Saudi Labor Force Survey (2018Q2)
Wage return may be contributing to this trend. While we expect women in Saudi Arabia to exhibit
high reservation wages, given the externalities associated with female employment in a
conservative society, social security data reveals differences in the wage distributions of Saudi

 17
men and women. Both distributions are bunched around the minimum wage: 43.7% of working
Saudi men earned less that SAR 3,100 in 2016, whereas 65.9% of working Saudi women earning
less than SAR 3,100 in 2016 (GOSI dataset). We estimate the wage premium associated with
gender, by occupation (j) or industry (n), based on equation (1), and find Saudi women facing a
negative wage premium compared to Saudi men in the private sector across industries and
occupations (Figure 10). That is, holding the level of schooling, occupation [industry], age and
tenure constant, women, across industries [occupations] face a negative wage premium associated
with their gender. Negative wage premiums in the context of higher reservation wages for women,
given social restrictions (mobility, low female labor force participation) could discourage women
from taking employment, and make them more selective than men.
Equation (1):
 _ , = + 1 . , + 2 . , + 3 . ℎ , +
 4 . , + / . / + for individual i in occupation j (or industry
n)
Figure 10: Saudi Women Wage Premia

Source: Author’s calculation using the Saudi Social Security Dataset (GOSI)

Education And Age
As of 2016, about 60% of the Saudi private sector workforce were secondary school graduates.
An additional 17% had received some sort of tertiary education, with the remainder not having
completed high school. Yet slightly more than 12% of Saudis occupy high skilled (managerial and
professional), 7% occupy medium-skilled jobs (technical jobs), while ~78% work in very low- or
low-skilled occupations (skill level defined based on ILO ISCO classification). 30% of these
occupations are clerical, and the rest are personal trades, sales and services, and mechanical
occupations (Figure 11).

 18
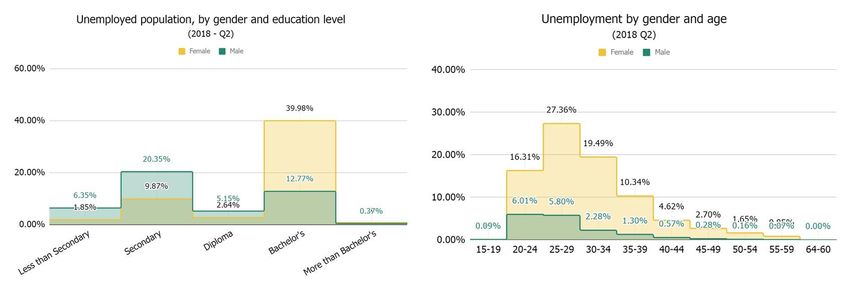
Figure 11: Saudi And Expatriate Occupational Skill Level, By Education Group

Source: Constructed using the Saudi Social Security Dataset (GOSI), based on ILOSTAT
Employment by Occupation Classification
Recently, unemployment has shifted towards better educated Saudis. Figure 12 illustrates this
trend, driven primarily by a significant increase in unemployed bachelor’s degree holders,
particularly women. The unemployment rate among bachelor’s holders was 17.7% in 2018,
compared to 11% among high school graduates, a major divergence from 2011, during which the
unemployment rate for both groups was around 15%.
Figure 12: Change In Saudi Unemployment, 2011 Versus 2018, By Gender And Education level

Source: Saudi Labor Force Survey (2011, 2018Q2)
Unemployment is concentrated in younger cohorts. In fact, youth unemployment (the youth
defined as those between 15 and 30 years of age) stood at 29% in 2018. Figure 13 shows that the

 19
age distribution of unemployment has not changed since Saudization efforts intensified, despite an
acceleration in the employment of young Saudis (Figure 14). This leaves us with the idea that
current employment trends seem insufficient compared to the number of graduates entering the
labor force annually.
Figure 13: Saudi Unemployment By Age Group

Source: Saudi Labor Force Survey
Figure 14: Change In Saudi Employment, By Age

Source: Saudi Social Security Dataset (GOSI)
Inadequate schooling quality may be one of the reasons for disappointing labor market results
among holders of bachelor’s degrees. Initial analysis on the return to tertiary shows positive and
significant wage premiums to tertiary education in 2016 for both Saudi and expatriate workers, but

 20
that of expatriate workers is higher than Saudi workers. Yet, the education data for expatriate
workers in the GOSI dataset includes missing values which may bias the results and thus we do
not report these numbers. Yet, if this result is correct, then: holding age, occupation and gender
constant, tertiary education for expatriate workers is associated with higher wages premiums than
Saudi workers, which implies that expatriate workers with tertiary education must be contributing
additional valuable skills to justify the premium.
A close look at unemployment rates by field of study shows disparities among the fields:
unemployment rates among Saudis specialized in humanities is high. It is also surprising that
unemployment is high While no general conclusion can be drawn at this stage with regards to the
impact of the field of study on individuals’ labor market outcomes, there is an initial indication of
excess supply of skills among nationals (Figure 15).
Figure 15: Unemployment Among Saudis Holding At Least A Diploma (Or Above) – 2018Q2

Source: Saudi Labor Force Survey (2018Q2)

 21
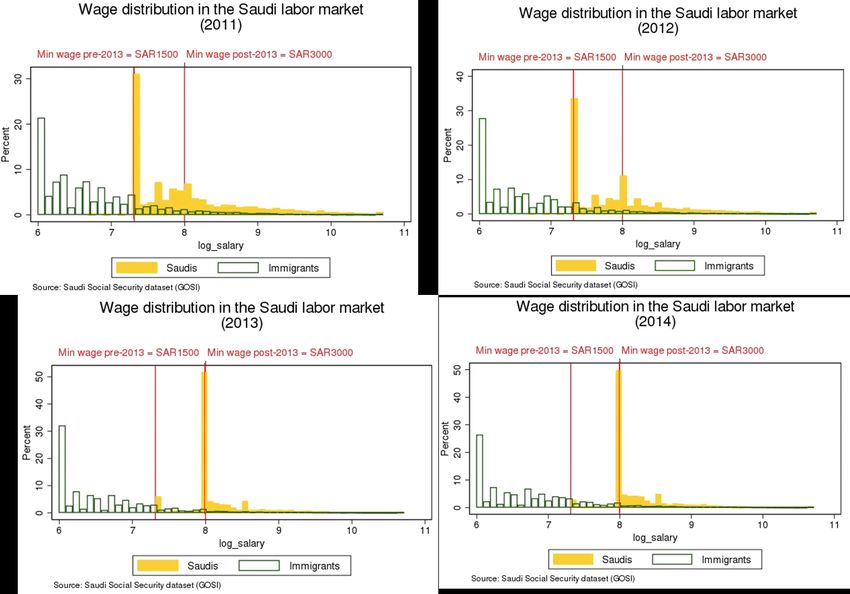
Cost Barriers Influencing Saudi Employment
In this subsection, we examine the cost elements hindering greater employment of Saudis in the
private sector jobs, with the purpose of understanding whether the price of hiring Saudis is a
binding barrier to firms. Existing studies on the Saudi labor market (Ramady 2013; Peck 2017)
illustrate hiring Saudis, from firms’ perspective, as costlier than hiring expatriates. This cost
differential persists across the skill or occupational spectrum and is the result of direct government
policies or indirectly incurred due to risks, to firms, associated with hiring Saudi workers.
An example of direct government policies making Saudi workers costlier to firms than expatriate
is an increasing minimum wage – applicable to Saudi workers and is binding for a firm’s Saudi
workers to count towards its Saudization score.9 Additionally, norms as well as rules on coworking
spaces require employers to provide separate working spaces for women and men, a potential
upfront cost that might be prohibitive in some cases. Finally, we attempt to assess costs or risks
associated with Saudi employment by examining worker tenure.
Wages
A high minimum wage requirement for Saudis in the private sector has aggravated the dualism
between Saudi and expatriate labor markets. Traditionally, the policy and practice of placing
premiums on Saudi workers’ wages has resulted in two distinct distributions of wages for
expatriates and Saudis (Figure 16). In 2013, Saudi labor regulations doubled the Saudi minimum
wage to SAR 3,000 (US$800), 7.5 times the minimum reportable expatriate wage (SAR 400, or
US$106). This significant difference in wages is most pronounced among low- and medium-
skilled workers, where a median Saudi wage is around SAR 3,000, whereas a median expatriate
wage stands at SAR 800.

9
 A firm’s Saudization score determines a firm’s placement in the Nitaqat band system. For Saudi workers to count
towards the Nitaqat quota, they must earn at least the minimum wage.

 22
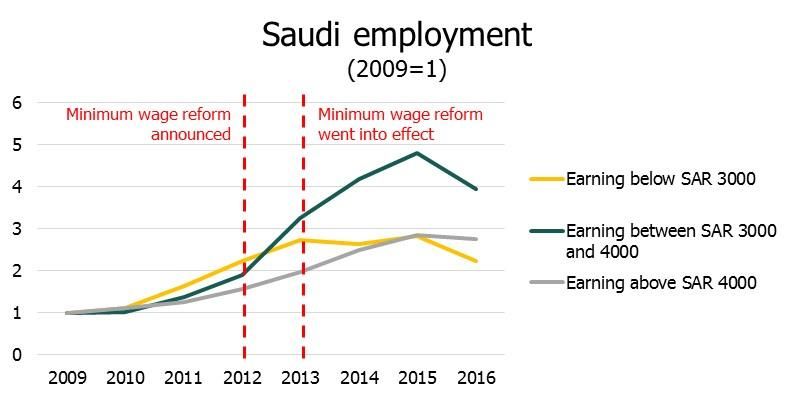
Figure 16: Saudi Versus Expatriate Workers - Wage Distribution

Source: Saudi Social Security Dataset (GOSI)
In theory, minimum wage reforms aim to close the gap between public and private sector wages,
increasing the supply of Saudi workers in the private sector. Yet, it is not clear how much of a
push the 2013 increase in minimum wage has provided. Job creation near the bottom of the Saudi
wage distribution was rapid in the early Saudization years, but has stagnated following the
minimum wage increase, while jobs less impacted by the minimum wage increase (those earning
between SAR 3000 and 4000) have grown at a healthier rate (Figure 17).

 23
Figure 17: Saudi Employment By Wage Category

Source: Saudi Social Security Dataset (GOSI)
The minimum wage may be hindering job creation in entry level positions by potentially
discouraging firms from hiring Saudis. In 2012, 33% of Saudis earned SAR 1,500 per month, the
de facto minimum wage at the time. In 2016, around 50% of Saudi workers earned exactly the
minimum wage (Figure 16). This significant bunching of the labor force at the minimum wage
points to a substantially curtailed wage distribution. Bunching is even more severe in provinces
like the Northern Region, Hail, and Tabuk, where the portion of Saudi workers making SAR 3,000
was 82%, 79%, and 75% respectively. Comparing wage distributions by industry, we observe
bunching in most industries, with the exception being Mining and Oil (with a median wage of SAR
10,400); Electricity, Gas, and Water; and Post and Telecom. Regions and industries that show
greater bunching may be struggling to add Saudi workers: for example, in 2018, the Northern
Region, Hail, and Tabuk had Saudi unemployment rates of 22.9%, 16.2%, and 14.5%, all
substantially higher than the 12.9% national rate.
Fixed Costs
As private firms were urged to hire more Saudi workers since 2011, another important factor
influencing their willingness and ability were fixed costs. Firms potentially face considerable fixed
costs as they begin to hire Saudis. Peck (2017) explains the fixed cost as the need to establish
referral networks, build experience screening and selecting Saudi candidates, and acquire physical
working space appropriate to include women. An interview conducted with a business leader in
Saudi Arabia confirmed this dynamic, citing the importance of learning when it comes to Saudi
recruitment as an example, and noted that this can put disproportionate pressure on small firms.
Empirical evidence is in line with the theory, especially at low levels of Saudization. Peck (2017)
underscores that firms that did not employ Saudis before the June 2011 imposition of Nitaqat shut

 24
down at a higher rate than red firms that employed at least one. Yet, stagnant recruitment of Saudis
in firms initially marked as green, which had incurred any fixed costs, suggests this hypothesis
may be limited to firms only beginning to hire Saudis.
The discussion on the fixed costs associated with hiring Saudi workers is likely to be of high
importance when it comes to Saudi female employment. Our analysis suggests a possible positive
association between fixed costs and the hiring of women. We estimate a linear regression with
year fixed effects, to analyze the change in a firm’s female employment in year t, given the firm
having hired at least one woman in years t-1 and t-2. We use the Social Security data between
2011-2016 to obtain a firm-level dataset, with variables on the number of employees, by gender
and main economic activity. The regression is based on Equation (2).
Figure 18 summarizes the result. Column (1) shows the results of regressing the absolute change
in a firm’s female employment on two lags of a dummy variable, where a value of 1 signals at
least one female employee at the firm, a lag of the total number of female employees and a lag of
total employment. Column (2) shows a similar regression but with year-on-year percentage change
in female employment as a dependent variable. Column (3) shows the results of regressing a
dummy variable of whether a firm hired women during the past year on the same variables.
The result in column (1) suggest that, on average holding a firm’s economic activity, its size (total
employment) female employment in 2011 and its location constant, having had at least one woman
in the firm’s workforce in year 2011 is associated with an increase of 6 female employees by year
2016. The result in column (2) suggest that on average, holding all else constant, having had at
least one female employee in year 1 is associated with a ~4 percentage-point increase in female
employment in year 3. Finally, the result in column (3) suggests that on average, holding all else
constant, having had at least one female employee in year 1 is associated with a ~5 percentage-
point increase in the likelihood that the firm hires a woman in year 2. These results are large and
statistically significant.

Equation (2):
 ℎ , = + 1 . , −1 +
 2 . , −1 + 3 . , −1 + for each firm i at time t

 25
Figure 18: Change In Female Employment In Firms
 OLS Regression, Firm level, 2011-16
 Do firms with women employees at the beginning of a period hire more women by the end of the period?
 (1) (2) (3)
 Absolute change in 2016, Year on Year % change Did firm hire any female
 relative to 2011 between 2011-2016 employee this year?
Women employees 6.56*** 5.33%-point ***
dummy in T-1 [0.915] [0.13%-point]
Women employees 4.16%-point*** 4.4%-point ***
dummy in T-2 [0.69%-point] [0.13%-point]
Total female employees 0.233** -0.1%- point** 0.06%-point***
in T-1 [0.107] [0.043%-point] [0.0014%-point]
 0.0037 0.008%-point 0.0012%-point
Total employment in T-1
 [0.0031] [0.005% point] [0.00%-point]

Observations (Firms) 312,623 153,474 422,334

 Firm size, sector, region
Controls Firm size, sector, region Firm size, sector w year FE
 w year FE
Robust standard errors in brackets
*** p
Figure 19: Tenure Variation By Wage level, For Expatriates And Saudis (2016)

Source: Saudi Social Security Dataset (GOSI)
Saudi tenure is lower than expatriate tenure across the majority of occupations and sectors (Figure
20). An analysis of tenure by occupation and industry shows Saudis’ tenure falls below that of
expatriates across occupations and in most industries. Troublingly, the minimum wage increases
in 2013 does not seem to have lengthened Saudi tenure meaningfully. We observe worker tenure
“completed” by 2013 – that is the tenure of workers who had left the private sector by 2013 – and
compare it to those who continued to work after 2013 or entered the market after 2013. The means
of these distributions were 1.33 years and 1.9 years respectively (Figure 21). These figures are 3.2
years and 2.9 years respectively, for expatriate workers.
Saudi attrition may be problematic for employers, who incur fixed costs and high wages to hire
Saudis. In a 2018 study on Saudization in four- and five-star hotels in Saudi Arabia, 70% of HR
managers interviewed agreed that Saudi attrition is a source of frustration (Azhar et al. 2018). As
such, the attractiveness of Saudis may be affected - as the rate of return on investment in Saudi
employees is negatively affected given their higher cost and faster turnover (implying increased
search and training costs). Additionally, with low tenure, Saudis are likely to struggle to build job-
and firm-specific experience.10

10
 The Social Security data (GOSI) does not include reason for exiting a job; therefore, we are unable to comment on the nature of these
departures

 27
Figure 20: Completed Tenure By Occupation (2016)

 Average Tenure By Occupation (as of 2016)
 5
 4.5
 4
 3.5
 3
 In Years

 2.5
 2
 1.5
 1
 0.5
 0
 Managers Professionals Technicians Clerical Service and Skilled Craft and Plant and Elementary
 and associate support sales workers agricultural, related trades machine occupations
 professionals workers forestry and workers operators,
 fishery and
 workers assemblers

 Saudi workers Immigrant workers

Figure 21: Saudi Worker Tenure Distribution (Pre- And Post-2013)

Source: Saudi Social Security Dataset (GOSI)

 28
Notes on the Nitaqat (Saudization) program
The set of Saudization policies put in place since 2011 add an important layer of complexity on
top of the long-standing policy framework or structural dynamics. This subsection considers
policymakers’ theory of change with regards to the country’s labor market policies since 2011, in
comparison to the actual outcomes discussed in the previous subsection.
Saudization seems to be an attempt to overcome the economic and cultural barriers that have
hindered the participation of Saudis in productive economic activities, without extreme disruption
to the private economy and Saudi living standards. The policy package is aimed at moving the
country towards equilibrium, beginning a virtuous cycle of increased and improved national
involvement in the private sector and a reduced reliance on low-cost labor.
The government’s theory of change behind the reform is that it will speed up accumulation of
knowhow and boost productivity of Saudi workers, especially in light of heavy investment in
university education, vocational training, and private internships. The government also possibly
considers the program as a method to correct for the information asymmetry facing Saudis (with
regards to private employment) and business owners (perception of Saudis’ skills and productivity)
by instituting quotas mandating businesses hire Saudi beyond current levels. This may discourage
firm reliance on foreign labor, and the imposition of levies on expatriate labor serves to
complement the effort,11 while making private sector jobs more appealing to Saudi workers and
incentivize tenure in the private sector, through a high minimum wage (Ramady 2013).
On the supply side, Saudi labor would face stronger incentives to engage in private sector work
and become more adept in these roles. Taboos against working in certain sectors or against female
employment in the private sector would wane as both become normalized. Indeed, recent academic
research shows that perceived misgivings about female work are greater than actual misgivings,
implying that norms could update rapidly after an initial push from policy, improving absorption
of job-seeking women into the workforce (Bursztyn, Gonzalez, and Yanagizawa-Drott 2018).
Saudi workers would be exposed to sectors and skills currently dominated by expatriates, receive
training and gradually develop managerial skills. Yet, these reforms do not affect Saudis’ high
reservation wages and assume an increase in minimum wage will make private jobs more
attractive, correcting for this issue.
On the demand side, firms would be forced to shift their business models away from low-cost
labor, rebalancing production methods to rely on technology, capital, and middle-skilled workers.
Businesses accustomed to ignoring Saudis as a possible part of their workforce may hold incorrect
or incomplete assumptions about their potential. Working with Saudis might correct this
asymmetric information; improved perceptions of national work ethic were documented in the
UAE following increased exposure in the workplace (Al-Waqfi and Forstenlechner 2010).

11
 There is ample room for this transfer of value between sectors. In 2011, for example, the labor share of GDP in Saudi Arabia, per the
Conference Board’s 2018 Total Economy Database, was only 22%, placing it 123th out of 125 countries measured.

 29
Moreover, the reforms assume low and declining labor productivity in Saudi Arabia is in part due
to the availability of very cheap labor (Diwan 2018). Pushing the firms least able to adjust to higher
labor costs to shrink or close could increase the allocation of resources to firms better able to utilize
technology, capital, and middle-skilled workers, a boon for the economy overall.
The government has not been reluctant to use fiscal space to absorb some of the increased costs
through payroll rebates to prevent sharp increases in consumer prices or firm shutdowns.12 The
government has also investment in an array of labor market policies to eliminate other frictions to
private sector work; such as promoting of job matching services, part-time and flexible work, and
other arrangements for students, women, and other sensitive groups.

12
 While large deficits during the oil price crash are a concern, the fiscal deficit was reduced to around 5% of GDP by 2018. Moreover, central
government gross debt remains low at around 19% of GDP, compared to assets held by the Public Investment Fund worth 33% of GDP and
foreign reserve holdings of 71% of GDP (IMF, 2018a).

 30
You can also read