The Quest for Increased Saudization: Labor Market Outcomes and the Shadow Price of Workforce Nationalization Policies
←
→
Page content transcription
If your browser does not render page correctly, please read the page content below
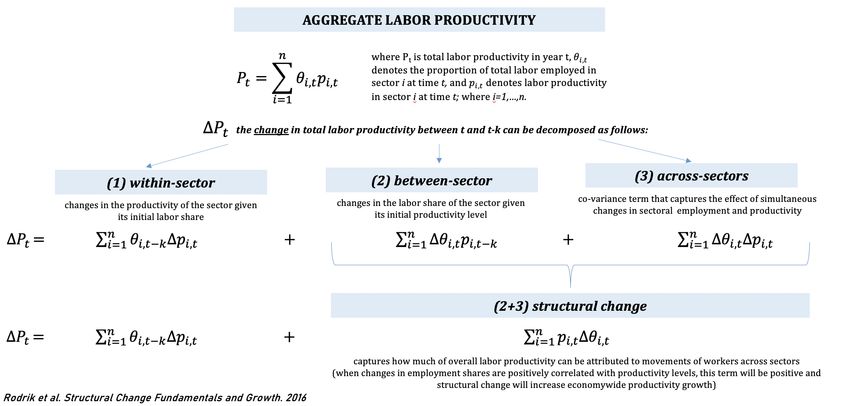
The Quest for Increased Saudization:
Labor Market Outcomes and the Shadow Price
    of Workforce Nationalization Policies

    Michael Lopesciolo, Daniela Muhaj, and Carolina Pan

             CID Research Fellow and Graduate Student
                     Working Paper No. 132
                            July 2021

      © Copyright 2021 Lopesciolo, Michael; Muhaj, Daniela; Pan, Carolina;
               and the President and Fellows of Harvard College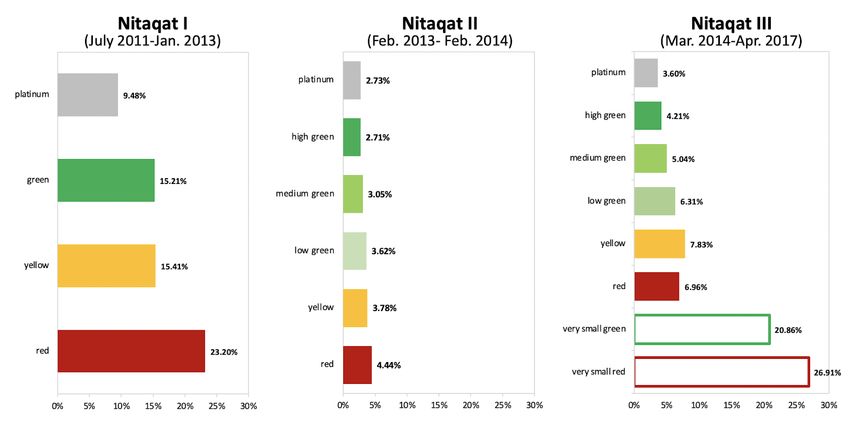
Acknowledgments
This paper was written in support of the Economic Diversification & Growth Diagnostics in
Saudi Arabia project at the Center for International Development’s Growth Lab at Harvard
University. This paper benefited from the feedback of Ricardo Hausmann, Tim Cheston,
Semiray Kasoolu, Farah Hani, Matte Hartog, Ricardo Villasmil, Can Soylu, and Shreyas Matha.
The authors are grateful to the Labor Market Program in Public Policy General Department at
the Ministry of Economy and Planning for their valuable comments.

Abstract
Few countries have embraced active labor market policies to the same extent as Saudi Arabia. In
the aftermath of the Arab Spring, the imperative of increasing Saudi employment became
paramount. The country faced one of the highest youth unemployment rates in the world while
over 80 percent of its private sector consisted of foreign labor. Since 2011, a wave of
employment nationalization efforts has been mainly implemented through a comprehensive and
strictly enforced industry and firm specific quota system known as Nitaqat. This paper assesses
the employment gains as well as the costs and unintended consequences resulting from Nitaqat
and related policies between 2011 and 2017. We find that while job nationalization policies
generated significant initial gains in Saudi employment and labor force participation, the effects
were heterogeneous across workers, firms and sectors. Moreover, our analysis suggests that the
resulting unintended consequences far outweighed the benefits over time generating a less cost-
effective and productivity inhibiting labor market composition.

Keywords: labor market, employment quotas, expatriate workers, workforce nationalization,
Saudi Arabia, occupation, skills, labor productivity

JEL Codes: J21, J23, J24, J31, J42
1. Introduction and motivation

Few countries have embraced active labor market policies to the same extent as Saudi Arabia.
The idea of workforce nationalization (henceforth Saudization) has been a recurring theme in the
Saudi public policy arena for several decades. In the aftermath of the Arab Spring, the imperative
of increasing Saudi employment became paramount; the kingdom faced one of the highest youth
unemployment rates in the world while over 80 percent of its private sector consisted of foreign
labor.

Since 2011, Saudization efforts have been mainly implemented through the Nitaqat program.
Nitaqat operates based on industry and firm size specific quotas for the share of employed Saudi
nationals. Firms above the quota are granted benefits, while those below face restrictions for
expat hiring 1. Nitaqat has gone through different iterations since launching in 2011 and remains
in effect to this day. The quota requirements have also been complemented by other instruments
(like job training, visa fees, differential minimum wages) aimed at making Saudis relatively
more attractive to private sector employers, and vice versa. Despite the size and economic
relevance of Nitaqat, there are no recent studies that weigh its long-term costs and benefits.
Existing studies find that the first wave of Nitaqat (July 2011-January 2013) was successful in
increasing overall Saudi employment in the private sector, however it came at the high cost of
firm exits, increasing labor costs, shrinking firm size, declining labor productivity, and falling
output among exporting firms 2.

The goal of our paper is to provide a more comprehensive overview of Nitaqat and related
Saudization policies' impact on labor market outcomes over the long-term policy horizon. Most
importantly, we aim to understand not only the employment gains and other benefits, but also
assess the costs and unintended consequences that resulted from stricter implementation.
Specifically, we look into the sectoral, demographic and productivity changes that have taken
place since 2011. A detailed analysis of the labor market outcomes during the first wave of the
Nitaqat policy is provided to highlight the nature of the initial gains, which were also the more
sizable ones. The paper then examines relevant patterns and developments that resulted from
subsequent iterations of Nitaqat and a related cohort of Saudization policies, which include the
further tightening of the quotas and an increase in the Saudi minimum wage.

1
    Refer to Appendix I for details on the timeline and details on program design as well as enforcement.
2
  There are some qualitative studies about employment frictions in the region. Forstenlechner et al. (2012) find that education
and reservation wages are significantly less important in explaining the lack of nationals working in the UAE private sector
compared to a perceived lack of work ethic and strong preference for public sector employment among Emiratis. Their study is
based on national labor force data and surveys with company executives. Alshanbri et al (2015, 2016) interview human resource
managers in Saudi private sector firms to understand how they adjusted to the implementation of Nitaqat. The findings emphasize
a lack of vocationally driven education, missing local expertise, low levels of motivation in general and especially for long hours
or physically demanding jobs, and mounting costs of employee turnover as challenging aspects for firm compliance with Nitaqat
quotas. From an empirical policy evaluation perspective, Peck (2017) uses a regression kink design to estimate the impact of
Nitaqat quotas on the Saudi private sector. She finds that while the program created 63,000 out of the 169,000 new jobs over 16
months, Nitaqat led to a decrease in total private sector employment of about 948,000 workers due to significant firm exit
(11,000 firms). Cortes, Kasoolu, and Pan (2020) employ a difference-in-difference approach and find that while Nitaqat
succeeded in encouraging private sector firms to hire Saudis, it also resulted in firm size reduction, productivity decline, a fall in
the output of exporting firms, and an increase in labor costs, low-skill Saudi workers and firm exit. Both studies focused only on
the effects of Nitaqat I.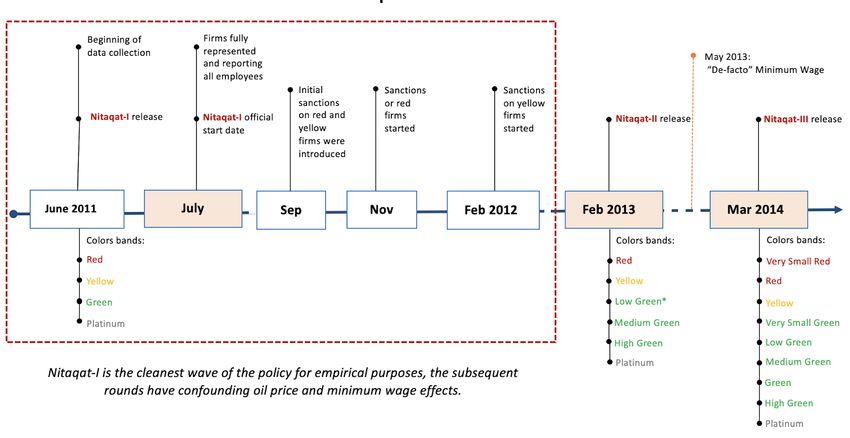
Our findings suggest that Nitaqat and related Saudization policies generated significant
improvements in both Saudi employment and labor force participation. The gains were
significant for all Saudis entering the labor market and particularly substantial for women. We
present evidence on a number of breaks in labor market trends post-2011 compared to the pre-
Nitaqat period. On employment, the higher participation and unemployment trend broke as the
chances of new labor market entrants finding a job increased. Labor market outcomes continued
to steadily improve for Saudi men as well. More tenured workers also benefitted from significant
wage gains in addition to the de-facto minimum wage. Their prior private sector work experience
became a more valuable asset to firms in need of workers to help meet employment quotas.
Increased participation and improved labor market prospects for Saudis in the private sector were
a beneficial push in the right direction. However, these labor market gains were concentrated
during Nitaqat I when the policy was least restrictive and came at a high cost to firms and the
economy.

Costs and unintended policy consequences compounded while the benefits tapered off as
Saudization requirements and enforcement tightened over time. Even though Saudi employment
increased across the private sector, the Saudi employment share declined in high-wage and high-
quality jobs. On the other hand, Saudi workers gravitated into low-wage low-skill industries and
were disproportionately concentrated in smaller firms. Minimum wage requirements tied to
Nitaqat further increased the cost of Saudi labor for firms relative to expats. Firms with a high
initial concentration of Saudi workers decreased their Saudization shares, on average, after the
introduction of the quotas. Furthermore, with increased labor costs, firms facing strict quota
requirements faced a higher exit probability and were less likely to engage in exporting behavior.
These trends further exacerbated the country’s state of low productivity with Saudi employment
continuing to increase in sectors with larger and growing employment shares but low and
decreasing productivity in response to policy induced hiring restrictions.

What remained entrenched and continues to persist, despite the policy efforts, is the Saudi-
worker preference for public sector work and the correspondingly high reservation wages. This
dynamic has resulted in a large unexplained wage premium that continues to drive firm
preference for expat workers. These trends suggest that a job creation strategy by way of
prioritizing diversification efforts and transforming the role of the public sector could have been
then and is now, the more beneficial and effective approach to sustainable long-run Saudization.

The rest of the paper is organized as follows. Section 2 presents the Saudi macroeconomic and
labor market context to better understand the magnitude of the problem and the policy choice.
Section 3 describes the program in detail. Section 4 assesses whether the policy achieved its
goal. Section 5 dives deeper into the effects on the composition of the labor market. Section 6
examines the unintended consequences and the sustainability of the policy efforts over the long
run. Finally, Section 7 concludes and discusses implications of our work as well as future
research.
2. Origin and Evolution of Saudization Policies

The challenges faced by policymakers today attempting to increase Saudi participation in the
private sector can be traced to the country’s history of managing its oil booms and busts. With oil
wealth came growth and prosperity, but also imported labor. Over time, expat workers became a
core component of a segmented labor market. In an era of rapid population growth and uncertain
future oil demand, the sustainability of this arrangement, with the majority of Saudis working in
the public sector and most private sector jobs filled by expatriates, has become an urgent policy
question.

         2.1. The Macroeconomic Making of a Dual Labor Market

The Saudi labor market has its roots in the windfall from its massive oil wealth, combined with a
uniquely open immigration system. Saudi oil production rose from around 1.4 million
barrels/day in 1962 to 4 million barrels/day in 1970 and 10 million barrels/day in 1980. Increased
production and the high oil prices of the 1970s and early 1980s meant a booming
economy: Saudi GDP jumped from $5.3 billion in 1970 to $164.5 billion in 1980, a 31-fold
increase. Saudi GDP per capita, as a percentage of that of the United States, rose from 20% in
1970 to 135% in 1980 3.

This sudden, enormous increase in Saudi purchasing power outstripped the capacity of the
country’s productive base. Imported goods increased from around $1.2bn in 1970 to $44.9bn in
1980, a pattern typical in resource booms worldwide. Where Saudi Arabia differs from many
other countries is that, with ample financial resources but little in the way of local human capital
to draw on (in the early 1970s, only 15% of Saudi men and 2% of Saudi women were literate),
Saudi businesses secured a deal with the government allowing them to bring in large quantities
of migrant workers (Allahmorad and Zreik 2020). Saudi brought in both low-skill laborers to
work in construction and other low-paying fields and highly skilled expats prized for their
technical sophistication (Diwan 2016). As such, expats went from constituting 20% of the labor
force in 1970 to around 60% by the 1990s (Fakeeh 2009).

At the same time, the government, flush with oil revenues, spent massively to build out
infrastructure, expand public services, and employ large numbers of Saudi workers. Well-paying
public sector jobs became a key conduit for the redistribution of oil rents to the Saudi population,
allowing households and businesses to benefit from oil-driven purchasing power while keeping
costs low through imported goods and a highly competitive, expat-driven private sector labor
market. Figure 2.1 illustrates the tight relationship between private sector economic activity and
the government’s fiscal impulse (spending minus non-oil revenues) tracing from the start of the
oil boom in the 1970s until the mid-2010s.

3
  Oil production statistics are Ministry of Energy, Industry and Mineral Resources data taken from SAMA’s Annual Statistics.
Statistics on GDP, imports, and exports are from the World Bank World Development Indicators.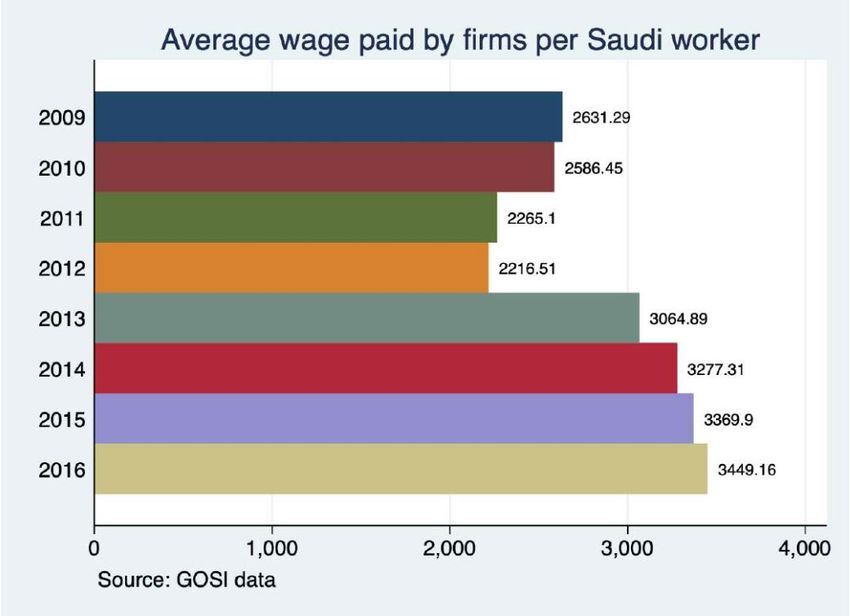
Figure 2.1. Private sector output and fiscal impulse, 1970-2018

                             1,400                                                                                            1,400

                                               Net Government Spending (Total Expenditures Less Non-Oil Revenues)
                             1,200                                                                                            1,200
                                               Non-Oil Private Sector GDP

                             1,000                                                                                            1,000

                              800                                                                                             800
              SAR Billions

                              600                                                                                             600

                              400                                                                                             400

                              200                                                                                             200

                                0                                                                                              0
                                 1970   1974    1978    1982   1986    1990   1994   1998   2002    2006   2010     2014   2018

Source: Saudi Arabia Monetary Authority (SAMA), Annual Statistics.

The dependence on foreign labor has persisted to the present day. The General Organization for
Social Insurance (GOSI) reports that roughly 80% of the private sector labor force are non-Saudi
males 4, representing more than 110 different nationalities. As Figure 2.2 shows, non-Saudi males
work primarily in construction, as domestic workers (such as drivers), and in wholesale and retail
trade, largely in low-skill, low-wage positions. On the other hand, there is a pronounced public-
private sector duality for Saudi workers given a large wage gap driven by a roughly 50 percent
public sector wage premium in 2014 5. Figure 2.3 illustrates the private-public wage gap in the
Saudi labor markets in 2015 and highlights the concentration of Saudi workers in public sectors
such as government, health, and education as well as low-wage low-skill sectors such as retail,
construction, household services and agriculture. The duality and segmentation of the labor
market both motivated Saudization policies and determined the degree of their success.

4
   Non-Saudi females just account for 3% of the expats.
5
   Based on McKinsey Global Institute analysis using data from the Central Department of Statistics and Information, Saudi
Ministry of Economy and Planning; Saudi General Organization of Social Insurance; and Saudi Ministry of Civil Service. After
the Global Financial Crisis public wages started increasing at a fast pace, while those in the private sector decreased, culminating
in a private-public wage gap of about 50 percent.
Figure 2.2: Occupational Distribution of Non-Saudi Males in the Private and Household Sectors

 Source: GASTAT/GOSI 2019Q1

Figure 2.3: The Saudi Dual Labor Market

Source: Central Department of Statistics and Information; 2015 Labor Force Survey.
Note: The size of the bubble represents total employment in the sector. Green indicates public sectors, and blue
represents the private sector.
2.2. Workforce Nationalization as a Policy Goal

The de facto segmentation of the labor market has long been a source of political and economic
tension. Article 45 of the Saudi Labor and Workmen Law, passed in 1969, declares at least 75%
of a firm’s workforce and 51% of its wage bill must be tied to Saudi employees. In the decades
that followed, the Ministry of Economy and Planning generally set ambitious targets for an
economy wide Saudization rate as part of its five-year plans to conform with the law. By the
mid-1990s, firms were required to increase their Saudization rate by 5 percentage points per year
until a 50% target was hit (Perrin 2013). In 2006, the annual increments were discontinued, with
an across-the-board 30% requirement imposed on the private sector as a whole. Some expedient
attempts were made to fully convert specific sectors - wholesale produce, gold and jewelry, taxis
- to Saudi labor, but these attempts tended to be short-lived and stunted by public outcry over
subsequent price increases (Fakeeh 2009). In general, however, the challenges of meeting targets
for both workers and firms meant that Saudization targets were weakly enforced.

More serious Saudization efforts were undertaken within the government and its state-owned
firms. Efforts were mostly centered on the public sector, which, per statistics from the Saudi
Arabian Monetary Authority, saw an increase in its Saudization rate from around 70% in the late
1980s to 90% at the start of the 2000s oil boom to 95% today. Saudization targets were put into
place for contractors working with national oil company Saudi Aramco (Fakeeh 2009) and
petrochemicals giant SABIC (Saudi Hollandi Capital 2011). While successful, these efforts were,
by their nature, limited in scope.

In more recent years, however, expanding private sector employment for Saudis became a much
more urgent priority for the Saudi government. The unemployment rate among Saudi nationals
increased from 9.8% in 2008 to 12.4% in 2011, despite strong macroeconomic conditions
following the recovery of oil prices in late 2009. Following the oil boom and subsequent
expansion of the expat labor force of the 2000s, the government was under serious pressure to
ensure that its flood of oil revenues translated into improved labor market conditions for Saudi
workers.

Demographic factors are also important in this shift in policy focus. Rapid Saudi population
growth of about 2.5% annually, which resulted in a demographic youth bulge, made finding jobs
for new entrants to the labor force increasingly pressing. Figure 2.4 underscores the urgency of
the situation - youth unemployment is high in Saudi Arabia even when compared to the rest of
the MENA region, which struggles with the phenomenon more than any other region worldwide.
While the hundreds of thousands of Saudis graduating from university annually are a valuable
potential resource, failing to meet their high expectations would be enormously costly
economically and a threat to social stability 6.

6
  Saudi Jobs for Saudis Is Crown Prince’s Generational Challenge. Bloomberg. Retrieved March 26, 2021, from
https://www.bloomberg.com/news/articles/2021-03-18/saudi-jobs-for-saudis-is-crown-prince-s-generational-challenge.
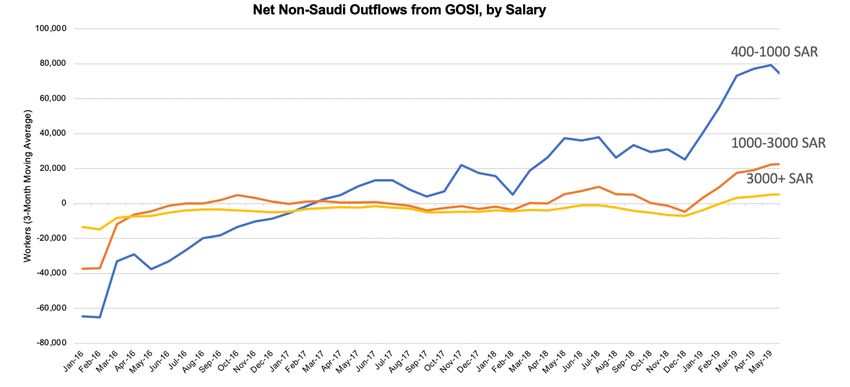
Figure 2.4: Youth Unemployment 7 Rates by Region

               40

               35

               30

               25                                                                                        Saudi Arabia
                                                                                                         Middle East & North Africa
     percent

                                                                                                         South Asia
               20
                                                                                                         Latin America & Caribbean
                                                                                                         Europe & Central Asia
               15                                                                                        Sub-Saharan Africa
                                                                                                         East Asia & Pacific

               10

                5

                0
                    1991 1993 1995 1997 1999 2001 2003 2005 2007 2009 2011 2013 2015 2017 2019

Source: World Bank, World Development Indicators.

3. Nitaqat: A Comprehensive Quota Based Employment Program

The imperative of increasing Saudi employment in general and especially that of the growing
youth population entering the labor force gave rise to a new and more aggressive wave of
Saudization policies. The Nitaqat (in Arabic, “bands”) program was launched in 2011 by the
Saudi Ministry of Labor (MoL), to replace the existing sector-wide 30% Saudization target with
a system of industry-firm specific quotas 8. The singular focus of Nitaqat was to increase Saudi
employment in the private sector, with hopes that it would help reduce high unemployment. The
program was also combined with a crackdown on visa irregularities, which resulted in the
departure of 1.4 million migrant workers from Saudi Arabia since 2013 (EUI 2015) 9.

Figure 3.1 shows the Nitaqat timeline for the first several years of the program’s existence. The
first iteration, Nitaqat 1.0, imposed quotas that varied by firm size and industry, for Saudi
employment across all firms with more than 10 employees across an expat abundant private
sector. The initial announcement of the program details was made in May 2011, while data

7
    Youth unemployment refers to the share of the labor force ages 15-24 without work but available for and seeking employment.
8
  There exists a body of literature that evaluates in what context and through what mechanisms quota-based active labor market
policies can be successful. Holzer and Neumark (2000) use U.S. survey data to assess the impact of affirmative action in
recruiting and hiring, and find that the increases in screening, evaluation, and training investment more than outweigh any impact
from hiring workers with less experience or weaker credentials. Howard and Prakash (2012) assess the impact of public sector
employment quotas in India and show that high-skilled employment increased among the relatively favored group of scheduled
castes, while it decreased among the less favored group of scheduled tribes. The quota system also had a positive impact on
occupational choices, and the effect increased with years of schooling.
9
  EIU. 2015. Country report: Saudi Arabia.
collection on firms began a month later. Sanctions came into effect in September 2011. Red and
yellow firms could no longer issue new work visas, and existing ones could be renewed for a
maximum of three months 10. Additionally, companies could not open new branches or change
the expats’ job description. In November 2011 and February 2012 visas could no longer be
renewed in red and yellow firms, respectively, with their expat employees allowed to freely
transfer to Green or Platinum firms, which also benefited from expedited visa processing and tax
deferrals.
Figure 3.1. Nitaqat timeline
Source: Ministry of Labor
The quotas varied by firm size and industry. Large firms and sectors with traditionally high
utilization of Saudi labor faced higher quotas, while smaller firms and expat-dominated sectors
had looser requirements. Figure 3.2 displays quota requirements and color bands for a Saudi-
intensive sector (insurance and business services) and an expat-intensive one (construction). A
medium-sized construction firm, for example, could be marked as Green with a Saudization rate
of 6%, while a similarly sized insurance firm would require a rate of 20%. Quota figures were
roughly based on pre-existing Saudization rates; quotas were theoretically chosen so that
(slightly less than) half the firms would be above. However, the impact of the quota and the
portion of firms that faced immediate hiring needs varied substantially across sectors.
10
Renewals could only be done for workers already in the company.Figure 3.2: Color bands by industry and firm size Source: Saudi Hollandi Capital (2012) Scores for each firm were roughly based on the percent of a firm’s workforce made up of Saudi nationals, with some modifications – most importantly, Saudi women counted as two full-time employees at program onset, although the bonus was abolished by 2015 (Husein, Balouziyeh and Burns 2016). Data was updated weekly through visa records from the Ministry of the Interior and employment records from the social security agency, allowing for rigorous enforcement. Extensions: Expat levy, wage requirements, Nitaqat 2.0 and 3.0 and other initiatives The implementation of Nitaqat created a framework that has been both expanded and complemented with other policies aimed at boosting Saudi employment. While Nitaqat did push Red and Yellow firms to meet their quotas, skill mismatches and the large wage gap between Saudi and expat employees continued to discourage businesses from further expanding Saudi hiring. In response, in late 2012 the government implemented the “expat levy,” which charged firms a flat fee of 2400 SAR per expat per year if they employed more expats than Saudis; in practice, this applied to a large majority of firms. Since 2017, the levy has been increased substantially in the face of fiscal pressures. While Nitaqat and the expat levy aimed to change the incentives facing businesses, the low wages offered in many private sector jobs relative to posts in the government continued to discourage many Saudis from looking for work outside of the public sector. In response, in May 2013, the government implemented a wage component to Nitaqat. In order for a Saudi employee to count in full towards meeting a firm’s quota, they had to be paid 3000 SAR per month or more. The median monthly private sector wage for Saudis in 2012 was 2000 SAR, so the effective impact of this policy change was substantial. The vast majority of Saudi salaries rose to meet this de facto minimum. The Nitaqat quotas themselves were modified several times, as well. In February 2013, the Green band was broken into Low, Medium, and High Green in order to sharpen incentives for better-than-the-minimum compliance (“Nitaqat 2.0”). In February 2014, firms with less than 10 employees were included for the first time, via a mandate that they must hire at least one Saudi. A more complicated system known as “balanced Nitaqat” was unveiled in mid-2016, with Saudization quotas replaced with a score based on five characteristics of a firm’s workforce: hiring of Saudis, hiring of Saudi females, average wages paid to Saudi, Saudis in very high-wage
positions, and average Saudi tenure (EY 2016). Eventually, this idea was scrapped, and replaced
in September 2017 with a revamped quota system, which shrank the dividing line between micro
and small firms from 10 to 6, added two additional size categories, and substantially tightened
the bands. Specific sectors have once again been targeted for 100% Saudization, particularly in
retail.

4. Labor market trends
                                  4.1. Employment

Did Nitaqat and related Saudization policies work as intended? On the aggregate level, the
starting point for evaluation is looking at employment growth for Saudis in the private sector,
where the impact appears to be very positive (see Figure 4.1). Taking June 2011, when Nitaqat
was announced, as a starting point, Saudi private sector employment doubled in the span of
about 15 months. This rate was not sustained - firms who had met their Nitaqat targets had less
of an incentive to continue hiring, and the implementation in early 2013 of a de facto Saudi
minimum wage likely discouraged additional Saudi hiring. Still, job growth between June 2011
and April 2017 totaled 233%. This is much higher than expat employment growth of 58%, a
figure which is likely to be inflated by reduced informality 11. Given historical aversion to
employment in the private sector, these are remarkable gains.

Figure 4.1: Employment growth in the Saudi private sector
                                  300%
                                  275%                                                                                                                                                                          total workers
                                                                                                                                                                                                                saudis
                                  250%                                                                                                                                                                          foreigners
                                                                                                                                                 Nitaqat III
                                  225%
 % growth relative to June 2011

                                  200%
                                                                                                          Nitaqat II
                                  175%
                                  150%
                                  125%
                                                  Nitaqat I
                                  100%
                                  75%
                                  50%
                                  25%
                                   0%
                                                  Sep-11

                                                                    Mar-12

                                                                                      Sep-12

                                                                                                        Mar-13

                                                                                                                          Sep-13

                                                                                                                                            Mar-14

                                                                                                                                                              Sep-14

                                                                                                                                                                                Mar-15

                                                                                                                                                                                                  Sep-15

                                                                                                                                                                                                                    Mar-16

                                                                                                                                                                                                                                      Sep-16

                                                                                                                                                                                                                                                        Mar-17
                                         Jun-11

                                                           Dec-11

                                                                             Jun-12

                                                                                               Dec-12

                                                                                                                 Jun-13

                                                                                                                                   Dec-13

                                                                                                                                                     Jun-14

                                                                                                                                                                       Dec-14

                                                                                                                                                                                         Jun-15

                                                                                                                                                                                                           Dec-15

                                                                                                                                                                                                                             Jun-16

                                                                                                                                                                                                                                               Dec-16

Source: Nitaqat dataset; Ministry of Labor.
Note: The red vertical line indicates November 2011, when sanctions on Red firms were enforced. February 2012 is marked by
the yellow vertical line and it indicates the enforcement of Nitaqat sanctions on Yellow firms. The blue vertical line in May 2013
represents the implementation of the de-facto minimum wage.

11
   Official government data collection efforts intensified with the implementation of Nitaqat for monitoring and enforcement
purposes.
Another relevant comparison is the differential growth in Saudi employment between the public
and private sectors. Comparing the size of the private sector labor force with the number of
government employees highlights the rapid acceleration in private job growth in 2011 and 2012,
followed by a sustained growth trend over several years. By these metrics, Saudi private
employment went from representing about half of total formal employment to around 60% by the
mid-2010s. These aggregate data also highlight labor stagnation towards the end of the decade,
with the size of the Saudi private sector labor force actually larger in 2015 than in 2019, as
macroeconomic conditions worsened, and net government spending was reduced.
Figure 4.2: Saudi employment by sector
Source: SAMA Annual Statistics 2019. Government sector statistics based on the Ministry of Civil Service, and
Ministry of Labor for private sector statistics.
4.2. Labor Force Participation and Unemployment
Rapid job creation in the private sector, however, contrasts sharply with the unemployment
statistics. The rate of unemployment for Saudi nationals - a publicly known and politically
important statistic - reached 12.4% in 2011 and has remained in a fairly narrow band ever since,
bottoming out at 11.5% in 2015 and then rising again to 12.8% in 2017.
Reconciling these two trends requires looking at the Saudi working age (15+) population -
composed of employed, unemployed, and non-participating individuals - holistically. Looking
first at Saudi males, the last 20 years have seen a fairly steady trend of increased employment,
while the mass of unemployed and inactive individuals stays fairly constant. There is a slight
increase in the inactive share of the population in 2009 and 2010, followed by a recovery over
the next few years, coinciding with the implementation of Nitaqat in late 2011(see Figure 4.3).
However, on a longer time frame, these fit with the dominant trends, rather than break from it.Figure 4.3: Labor market indicators for Saudi males Source: GASTAT Labor Force Survey data. The share of the working age population that is inactive has fallen from 52% in 1999 to 37% in 2019, while the share of the working age population that is unemployed has hovered between 3% and 5%. Put another way, as the working age population has grown, so has the share of Saudi men seeking employment, and the majority of them have been able to find it. This means rising participation and, especially since roughly 2005, falling unemployment. Figure 4.4 shows that the experience of Saudi females has been very different. The number of working age women outside of the labor force rose steadily from 1999 to 2010, while the employment track record of those in the labor was quite poor. The share of working age women who were unemployed more than tripled from 1.3% to 4.5% between 1999 and 2011, while the share who were employed increased from only 7.0% to 9.2%. Figure 4.4: Labor market indicators for Saudi females Source: GASTAT Labor Force Survey data.
For women, 2011 is a more visible turning point. The number of inactive individuals falls in
absolute terms between 2010 and 2014, corresponding to an acceleration in the relative fall.
Importantly, more Saudi women become employed- the employed share of the working age
population increases from 9% in 2011 to 14% by 2017, while the share of unemployed moves
only from 5% to 6%. The pre-Nitaqat period was characterized by slowly increasing
participation and rapidly increasing unemployment, while participation has accelerated since
2011 and unemployment has fallen modestly from a 2012 peak, although it remains very high.

In the aggregate level, the impact of Nitaqat and the Saudization push on employment patterns is
nuanced. The gradual increase in the share of the working age population that is employed has
been a long-running trend, and the increase in employment and reduction in the inactive
population in 2011 and 2012, while indicative of a strong labor market, may be more easily
attributable to an improvement macroeconomic conditions following the weak crisis-era labor
markets of 2009 and 2010. For Saudi women, however, the early 2010s are a more visible
turning point, where unemployment began to stabilize and fall after a decade of ongoing
increases and participation in the labor market grew rapidly.

           4.3. Saudization
While not the standard metric for labor market performance evaluations, the Saudization rate or
the share of Saudis in total employment in the firm/industry has become the de-facto key
performance indicator (KPI) of Nitaqat. Saudization is the enforcement mechanism of the
program, as the bands are defined around the Saudi employee percentages (Saudization rates) at
the industry-firm size level. According to Figure 4.6, the bulk of Saudi employment growth
happened within the first 12 to 16 months of the policy implementation with very little growth
afterwards. Between June 2011 and April 2017, the average Saudization rate doubled (but was
never above 20%).

Figure 4.5: Monthly Saudization Rates in the Saudi Private Sector
                                                                                                                         20
                                                                                                                 18.24
     1.9
                                                             16.62                                                       18
                                       15.81
     1.7                                                                                                                 16
                         13.87                                                                                           14
     1.5
                                                                                saudi employment (in millions)
                                                                                                                         12
     1.3
             9.59                                                                                                        10
                                                                                saudization rate (RHS, in percent)
     1.1                                                                                                                 8
                                                            Nitaqat III                                                  6
     0.9
                                                                                                                         4
     0.7                                 Nitaqat II
                                                                                                                         2
             Nitaqat I
     0.5                                                                                                                 0
           Oct-11

           Oct-12

           Oct-13

           Oct-14

           Oct-15

           Oct-16
           Jun-11

           Dec-11
           Feb-12
           Apr-12
           Jun-12

           Dec-12
           Feb-13
           Apr-13
           Jun-13

           Dec-13
           Feb-14
           Apr-14
           Jun-14

           Dec-14
           Feb-15
           Apr-15
           Jun-15

           Dec-15
           Feb-16
           Apr-16
           Jun-16

           Dec-16
           Feb-17
           Apr-17
           Aug-11

           Aug-12

           Aug-13

           Aug-14

           Aug-15

           Aug-16

Source: Nitaqat dataset; Ministry of Labor.
Note: The red vertical line indicates November 2011, when sanctions on Red firms were enforced. February 2012 is marked by
the yellow vertical line and it indicates the enforcement of Nitaqat sanctions on Yellow firms. The blue vertical line in May 2013
represents the implementation of the de-facto minimum wage. Monthly Saudization is calculated as the share of Saudis to total
employment and is different from the Saudization score used for Nitaqat classification purposes.
These labor market trends show interesting dynamics around the Nitaqat program but do not
imply any causality. There is, however, empirical evidence that the policy in fact increased Saudi
employment and Saudization rates; see Peck (2017) and Cortes, Kasoolu and Pan (2020). These
papers use regression discontinuity and difference-in-difference approaches to study the effects
of Nitaqat on firms and employment. They find that the success of the program employment-
wise came at a high cost: increased firm exit and lower productivity as well as exports. Thus,
Saudization rates increased, but were conditional on firm survival. That is, those firms that
managed to increase their Saudi share to comply with the required quota managed to survive
with higher Saudization rates during Nitaqat I, but many others were forced to exit.
5. Labor market composition
To understand the overall impact of the Nitaqat policy, we need to dig deeper into the
composition of the labor market. While Nitaqat induced increased Saudi employment, this was
not homogenous across firms and sectors. The program was designed to target specifically firms
with low Saudization rates, which are overrepresented in some sectors and underrepresented in
others; thus, creating a differential impact across economic activities. Additionally, because of
existing constraints and frictions in the Saudi labor markets (i.e., duality and segmentation), the
new entrants were demographically different to the Saudis already employed. In the following
subsections we will analyze the changes in the labor market at the industry, firm, and individual
worker level.
5.1. Industry level: where were Saudi jobs created?
Based on the GOSI industry classification, employment in the private sector in Saudi Arabia is
concentrated in a handful of sectors 12. Construction was by far the largest sector, representing
about 42% of total private sector employment in 2011, followed by Retail and wholesale at 24%
and Manufacturing at 11% (see Appendix Figure A1). Employment for Saudi nationals, which
grew about 34% between 2011 and 2012, did rise in all the ten broadly defined economic sectors
between 2011 and 2012, ranging from 7% growth in Electricity, gas, and water to 68% growth in
Construction. Despite overall increases in the number of Saudis employed, it is worth asking
whether the new entrants are evenly distributed across these different sectors.
Figure 5.1 A) shows the distribution of Saudi employment by economic activity in 2012 for the
existing workers (those who were registered in GOSI before Nitaqat) and the new entrants.
Workers entering the private sector in 2012 were overwhelmingly more concentrated in
Construction, which accounted for 40% of the cohort of entrants, than those who had already
been active. On the other hand, sectors where Saudis have traditionally dominated – Mining and
oil, FIRE and business services – employed very few new entrants. As a result, Saudization rates
did not increase across the board, as depicted by Figure 5.1 B) Saudization rates increased, from
2011 to 2012, in Construction, Agriculture, Retail and Wholesale, and Manufacturing; all sectors
with less than 25% average Saudization. Contrastingly, Saudization rates decreased in FIRE and
12
These are: Agriculture, Construction, Electricity, gas and water, Finance, Real Estate (FIRE) and business services,
Manufacturing, Mining and Oil, Post and Telecommunications, Retail and Wholesale trade, Other Activities and Other social
services.business services, Other social services, Electricity, gas and water, and Mining and oil. These
were sectors with over 30% Saudization, on average, so the quotas were not binding for most
firms.
Figure 5.1: Saudi employment and Saudization by sector
A) B)
Source: GOSI
Therefore, while there was employment creation across the board, with Saudi entrants in all
sectors, Saudization rates only increased in those sectors with the lowest starting Saudization
rates and decreased in most of the others. This was a direct consequence of the program design,
as we show in the next subsection.
Figure 5.2: Saudi education by sector
In addition, this pattern implied an
interesting shift in Saudi hiring: from
high-skill, high-wage, Saudi-intensive
sectors (pre-Nitaqat) to low-skill, low-
wage, expat-intensive sectors (post-
Nitaqat). Figure 5.2 shows that the four
sectors that increased their Saudization
percentages–Construction, Agriculture,
Retail and wholesale and
Manufacturing– had in 2011 the highest
shares of Saudis with less than high
school education and the lowest shares
of Saudis with tertiary education. These
four sectors also made up four of the five
poorest paying sectors for Saudi
workers––together with Other Social
Services, which, while intensive in
highly educated workers, employs a Source: GOSIdisproportionate number of women, who are paid less across the education spectrum. Figure 5.3
plots the 2011 salary distribution for all economic activities. Saudization thus increased in those
sectors with the lowest mean and median salaries (green arrows) and decreased in the highest
paying ones (red arrows).
Figure 5.3: Saudi initial salary distribution
Source: GOSI
Note: Sectors are ordered by median wage. Green arrows indicate sectors in which Saudization increased,
and red ones where it decreased.
Finally, Saudi labor in 2012 increasingly shifted towards the only sectors where Saudis had low
revealed comparative advantage (RCA) relative to non-Saudi workers, as depicted by Figure 5.4.
The RCA here is used as a measure of how intensive each sector is in Saudis and expats,
weighted by the size of each group 13 (since naturally expat workers are more abundant than
Saudis in all sectors). The increase in Saudization rates across sectors where Saudis had low
RCA is particularly noticeable in small firms. This could be due to smaller firms being on
average “more red” and thus having greater needs to increase Saudization.
13
Computed as: RCA in sector A = (share of Saudis in sector A/overall Saudis)/(share of expats in sector A/overall expats).Figure 5.4: Saudi RCAs by industry
Source: GOSI
This dynamic of increased Saudization in low-skill, low-wage, expat-intensive sectors (and vice
versa) may be a cause for concern given Saudi Arabia’s strategic and labor market goals. While
increasing Saudi employment in sectors where they have not traditionally worked is not
inherently problematic, enlarging sectors that already dominate the private sector runs counter to
efforts to diversify the economy (a Vision 2030 goal). This is particularly true for Construction
and Retail, non-tradable sectors that ultimately depend on domestic demand, fueled by oil
revenues and public spending. Additionally, given that the fastest growing pool of unemployed
Saudi workers are college-educated women, increasing the demand for Saudi labor in blue collar
jobs may not address their labor market ambitions.
Falling Saudization in higher paying, more skill intensive industries is a more pressing concern.
These higher-paying, skill-intensive sectors are more likely to be attractive to Saudi jobseekers
and hold greater potential for job creation and productive diversification. We discuss below
whether the divergence in trends in Saudization could be related to Nitaqat.
5.2. Explaining Sectoral Trends – Potential Drivers
What mechanism drove the changes in sectoral aggregates from 2011 to 2012? The nature of the
Nitaqat program design – quotas with heavy punishments at the lower end of the Saudization
spectrum – coincided with an increase in demand for Saudi labor, but only among firms that, in
the pre-period, did not hire many Saudis and thus were in danger of being sanctioned. Quota
needs were largely met through the hiring of marginal Saudi employees at low cost, resulting in a
visibly two-tiered market of Saudi employees.While the intention of the quotas was to align Saudization requirements with the pre-period
norms, having 50% of the firms above and 50% below the Yellow-Green quota in every firm
size-industry cell, that was not the case in practice. The low utilization of Saudi labor in the
private sector made the quotas more binding by default in certain areas. A larger portion of
Construction and Wholesale and Retail firms were marked as Red than in other sectors,
particularly among small firms. For example, 77% of small construction firms employed no
Saudis before the introduction of Nitaqat, making it difficult to calibrate the severity of the
quota. As a result, Saudization rates in Construction among small firms increased between 2011
and 2012 by almost 7 percentage points. On the other hand, Saudization rates in medium firms,
which had fewer Red firms and tended to employ Saudis more heavily, stagnated or fell.
Virtually all Red firms initially employed no Saudis, but the vast majority of those still operating
a year later had added Saudis to their payroll. Figure 5.5 A) compares the June 2011 and June
2012 Saudization score registered in the Nitaqat data among firms marked as Red at program
onset. Given that about 80% of non-micro firms are Small, firms could generally comply with
the quota by hiring 1 or 2 Saudi employees. On the other hand, among firms that were marked as
Green when Nitaqat went into effect, there was no statistically significant increase in
Saudization, as shown in Figure 5.5 B).
Figure 5.5: Distribution of Saudization scores for red and green firms
A) B)
Source: Nitaqat data
This dynamic becomes more visible when comparing the hiring choices between 2011 and 2012
made by low Saudization firms (which were more likely to be marked as Red and need to
increase their Saudi-to-expat ratio) to those made by high Saudization firms (which were more
likely to be marked as Green and not require hiring changes), as in Figure 5.6. The distribution
for low Saudization firms is skewed to the right: on average, most firms increased their
Saudization ratio. The opposite is true, however, for high Saudization firms, with the leftward
skew reflecting, on average, a reduction in Saudization among firms less impacted by the quotas.
By contrast, between 2010 and 2011, the distribution of the change in Saudization rates for highSaudization firms was symmetric around zero. The tendency for firms with a large share of Saudi
employees to reduce their Saudi-expat ratio was new to the year when Nitaqat went into effect.
Figure 5.6: Changes in Saudization scores among non-micro firms
A)
B)
Source: Nitaqat data
Firms with differing Saudization quotas exhibit sharp distinctions in hiring behaviors: firms with
low initial Saudization levels increased their share of Saudi workers, while firms with high initial
Saudization levels reduced their share of Saudi workers, a dynamic not present in earlier years.
Specifically, the median firm with a Saudization rate of less than 10% -- most of whom would
fall into the Red or Yellow bands -- increased their rate by 3.5pp within a year. On the other
hand, the median firm with a Saudization rate above 20% decreased their rate by 8.4pp.
The design of the Nitaqat quotas created several notable incentives for Green and Platinum firms
to reduce the Saudi workforce. One was facilitating the free movement of expats: In November
2011 and February 2012, Green and Platinum firms could freely 14 hire expat workers from Red
and Yellow firms, respectively, without the permission of the Red and Yellow firm managers. At
the same time, firms that needed to increase their Saudization rates were ramping up hiring,
putting upward pressure on Saudi wages. Green and Platinum firms could take advantage of this
decrease in the relative cost of expat labor by reducing their Saudization rate, since they were far
above the quota levels. This effect has become even more noticeable in later years (under Nitaqat
2.0 and 3.0), as quotas tightened at higher levels and wage rates. These findings are consistent
with Peck (2017), who shows that firms that were 5 or more workers above their Green cutoff
reduced their Saudization percentage by 3.67pp compared to Green firms right at the cutoff, both
through hiring fewer Saudis and more expatriates.
Thus, the quotas not only pushed Saudis into low-wage employment-heavy segments of the
private sector in which they had previously not been heavily utilized, but also reduced the
utilization of Saudi labor in firms and sectors that had traditionally used Saudi labor profitably.
14
Freely here means without permission from the Red and Yellow firms.Overall Nitaqat gains were reduced by actions of Green firms, resulting in a weakened overall
effect, particularly considering the skills and wages required by the sectors hiring more Saudis.
5.3. Individual level: who were the new entrants?
How were these hiring needs met? Firms Figure 5.7: Saudi worker distribution by age
that were suddenly in need of new Saudi
employees to meet the required quotas
brought in workers that, based on wage,
demographic, and skill information, form a
more marginal 15 cohort on average. This is
consistent with the sector-level findings in
the previous section, that show that Saudis
were predominantly hired in low-skill, low-
wage sectors. At the same time, while the
Saudi labor force was adding large
numbers of new and inexperienced
workers, Saudis with a proven track record
in the private sector benefited from
additional premia for their labor.
A gap between new and existing private Source: Nitaqat data
sector workers is visible in a demographic
comparison between the two cohorts. Figure 5.7 compares the age distribution of Saudis by their
age, which we use as a proxy for work experience, with the existing cohort of workers much
more concentrated in their prime working years. New entrants to the private sector, by contrast,
are overrepresented primarily at younger ages. Additionally, 32% of Saudis new to GOSI in
2012 are women, compared to 15% of existing Saudi workers in 2011.
These differences are also reflected in the types of jobs taken up by new Saudi workers. broadly,
new Saudi jobs in 2012 were more concentrated in clerical and sales/service roles and in
construction. For example, in 2010, before Nitaqat had been announced or discussed publicly,
5.5% of new Saudi entrants to GOSI worked in clerical roles in the construction sector. By
contrast, in 2012, amidst the Nitaqat hiring boom, 13.5% of first-time Saudi workers were
registered as clerical workers in construction. More broadly, jobs were more concentrated in
clerical and service/sales positions, and less in personal services and technician roles.
Figure 5.8 A) compares 2012 salaries by level of education of Saudis and cohort 16. While the
overall distribution of Saudi salaries did not change significantly between 2011 and 2012 (see
Appendix Figure A2), workers with (more) experience had significantly higher salaries across
the board. In addition, median wages for Saudis with work experience with primary, secondary,
and tertiary education rose 22%, 25%, and 30% between 2011 and 2012 (not pictured). On the
15
Here marginal refers to the left-hand side of the distribution.
16
The two cohorts are: workers new to the private sector in 2012 and those who had worked at some point between 2009 and
2011.other hand, median wages for Saudis new to the private sector with primary and secondary
education were 29% and 25% lower than they were for Saudis in 2011. The difference shrunk to
only 4% when comparing wages for tertiary graduates.
These differences are likely due to Saudi hiring predominantly at the lower end of the income
distribution. Figure 5.8 B) shows that new labor market entrants were overwhelmingly clustered
at the de facto minimum wage of 1500 SAR compared to more experienced workers that had a
“flatter” distribution. Finally, regression analysis (see Appendix Table A1) confirms that there
are persistent wage premia for Saudis, men, prime-age workers, and educated workers, along
with a specific premium for Saudi workers that only occurs once Nitaqat is enacted.
Figure 5.8: Saudi salary distribution by cohort and education
A) B)
Source: GOSI
5.4. Later policy changes
So far, we have discussed the main labor market changes after the imposition of Nitaqat 1.0.
However, the Nitaqat program is still underway, and has gone through several adjustments, also
known as Nitaqat 2.0 and Nitaqat 3.0 (see the timeline in Figure 3.1). While Saudi employment
increased until 2016, the growth rate diminished significantly after the first 16 months of the
program. Similarly, Saudization rates had very little growth (and even stagnated) after June 2013
(see Figure 4.6). This could be an indication that all changes that occurred after the main policy
was launched were marginal.
Regarding Nitaqat 2.0, we have no reason to suspect that the breakdown of the green bands had
different effects than what we have already described. If anything, we would expect that the “low
green” category to have yellow-type incentives to increase Saudization. Similarly, the further
addition of new bands and incorporation of the micro firms into the programs (Nitaqat 3.0)
tightened the already existing requirements. Thus, we will look into the only policy that couldhave had a differential impact, the minimum wage imposition, since it imposed a price constraint
rather than a quantity.
Recognizing any consequences of the 2013 change in the Saudi minimum wage, however, is
challenging. This is mostly due to compounding effects, as it is very difficult to isolate minimum
wage from the Nitaqat band effects. However, we present some descriptives below which
suggest that an increase in minimum wage for Saudi nationals raises costs for firms and makes it
harder to comply with the quota requirements.
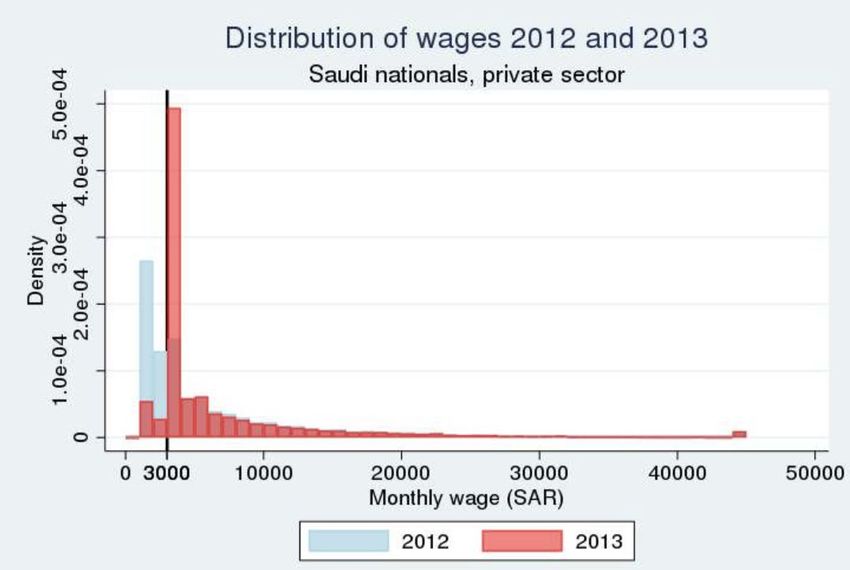
In 2012, before the increase in the minimum wage to 3000 SAR (approximately US$800), almost
40% of the Saudi private sector workers
Figure 5.9: Distribution of Saudi wages in 2012 and 2013
earned below 3000 SAR. In fact, there was a
bunching at 1500 SAR, the then “de facto”
Saudi minimum wage. Interestingly, even at
that wage, Saudi Arabia had one of the
highest minimum wages in the world (in
PPP), and a significantly higher one than
expected for its level of economic complexity
(see Appendix Figure A3). Almost 95% of
this “under 3000 SAR” pool were males,
mostly with a high-school degree or less.
Figure 5.9 depicts how the implementation of
the de-facto minimum wage resulted in
bunching of salaries at the new cut-off, with
less than 10% of the workers earning below Source: GOSI data
3000 SAR. While the rationale for the
minimum wage increase was to reduce the existing gaps between the public and private sectors
in order to increase labor supply in the private
sector, this widened the gap between Saudi Figure 5.10: Historical wage gap between Saudis and
labor costs and expat labor costs. Figure 5.10 expats
below shows that this measure led the lowest-
wage decile Saudis to become over seven
times more expensive than the average wage
of the lowest-decile wage expats. Such a
disproportionate wage differential makes
worker substitution between Saudis and
expats highly infeasible.
This extraordinary level of clustering at the de
facto minimum also raises concerns that some
hiring may be overstated. While Nitaqat was
implemented rigorously, anecdotes abound
that some of the hires at the minimum wage
are “ghost workers,” or Saudi nationals
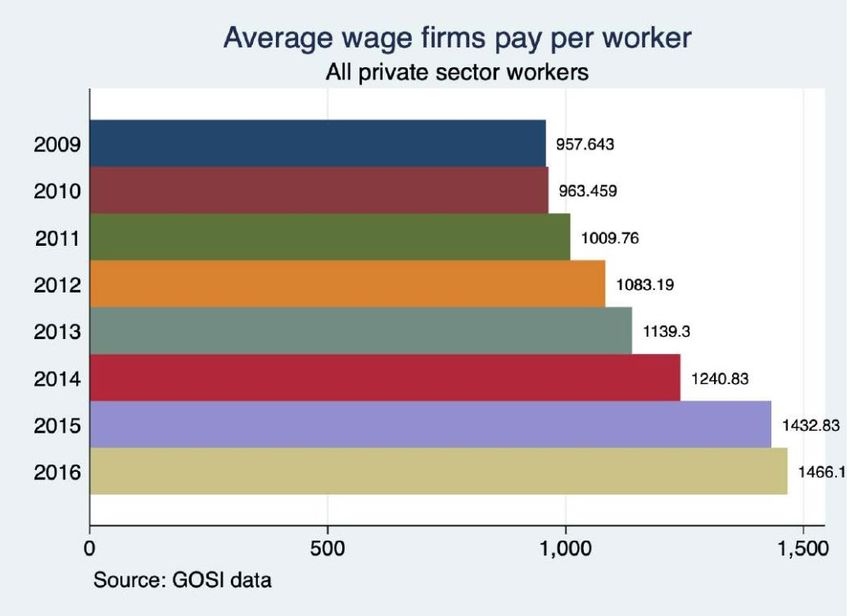
needed to meet quota requirements that do not Source: Juan Obach using GOSI dataactually work at the establishment. Quantifying this effect is difficult; however, it is worth bearing in mind that some of the impact of the policy (in terms of increased employment) and its positive spillovers (in terms of skill-building and productivity) may be overstated. Average monthly wages per worker paid by firms increased from SAR1,083 in 2012 to SAR1,139 in 2013 and kept rising afterwards, presumably as the quotas became more binding. The increase in average wages was clearly driven by the sharp rise in average Saudi wages, which after 4 years of a decreasing trend, jumped from 2216 SAR in 2012 to 3065 SAR in 2013 – an almost 40% rise (see Appendix Figures A4 and A5). In the later years of the program, strategic firm behavior to get as close as possible to the quota became more obvious, possibly as a response to more expensive Saudi labor. Firms show a tendency to move towards the Low Green category, whether from below (as Red or Yellow Firms) or above (in the case of High Green or Platinum firms reducing their Saudization rates). Figure 5.11 illustrates this dynamic between 2014 and 2015, showing a convergence towards the mandated level. Figure 5.11: Saudization scores by color band, June 2014 vs. 2015 Source: Nitaqat data
This sharper pattern raises the concerns that the quotas are creating a cost incentive large enough
to meaningfully change firm behavior. Red and Yellow firms are forced to seek out Saudi
employment, while Green and Platinum businesses with a track record of employing large shares
of Saudis face no such pressure. As a result of this mismatch, Saudization rates show a tendency
to collapse towards the Yellow-Low Green threshold, with firms well above their quotas
reducing the Saudi share of their workforce, usually through hiring expats. In the absence of a
quota, it is plausible that many of these firms would have continued to fill positions with Saudi
workers.

In more recent years, lower oil prices and subsequent fiscal pressures have pushed the
government towards heavier reliance on non-oil revenues, including the expat levy. When
introduced in 2012, the levy was aimed more at altering firm hiring choices than making a
macroeconomic impact - fiscal surpluses in 2011, 2012, and 2013 were 11.6%, 11.9% and 5.5%
of GDP, respectfully. Since then, however, levies on expats have increased drastically, to 400
SAR in January 2018, 600 SAR in January 2019, and 800 SAR in January 2020 with fewer
exemptions and only a 100 SAR discount for Saudi-majority firms. Additionally, a 100 SAR
monthly levy on expat dependents was introduced in July 2017 and increased by 100 SAR with
each subsequent year. As a result, expat levy revenues increased to 28 bn SAR in 2018 and 56.4
bn SAR in 2019, or about 1.8% of GDP. Finally, as of November 2020, it was announced that
the Saudi wage requirement for Nitaqat would be further increased to 4000 SAR.

Together with an economic slowdown, these substantially higher fees and a tightening of Nitaqat
led to a large outflow of expat workers from the country. The number of expat workers in GOSI
fell by about 2.2 million between January 2017 and June 2019 (Figure 5.12). However, the Saudi
employment response was weak, with only a few months of increases in Saudi employment in
GOSI in late 2017. Admittedly this was against the backdrop of tighter fiscal policy and a weak
economy, but the lack of substitution in the face of widespread reducing expat employment is
still highly visible in the data.

Figure 5.12: Inflows and outflows of workers from GOSI

Source: GOSI data
The underlying salary distributions of the expats exiting from GOSI sheds light on the lack of
compensating growth in Saudi employment. The increased exit trend since 2017 is much
stronger amongst the lowest-paid expats, who are unlikely to hold jobs for which Saudi workers
are suitable substitutes (Figure 5.13). Considering the heavy weight placed on the private sector,
these policy instruments may have reached the point of sharply diminishing returns in terms of
fomenting Saudi employment with higher fees or tighter quotas. The increase in the minimum
wage in November 2020 to 4000 SAR, together with tighter quotas, increases the likelihood of
firm exit, as the costs on businesses continue to rise. Less competitive labor markets may also
hamper diversification and FDI-attraction efforts underway.

Figure 5.13: Expat outflows by salary level, 2016-19

Source: GOSI data

6. Costs, consequences and policy sustainability

The Nitaqat policy will be considered successful as long as the long run benefits outweigh the
costs, which include the unintended consequences. Quotas that changed preconceived notions
about private sector employment and led to investment in Saudi human capital, worker training,
and long-term productivity gains would be positive, while quotas that merely impose costs would
be less notable and more likely to see reversed gains if policy is eased. While increased Saudi
employment has been widely celebrated, both the implementation of the program and its
compliance have been very strict––thus translating into onerous burdens to firms. Significant
challenges to the Saudi economy, and the private sector in particular, have been amassing since
the start of Nitaqat in 2011. The falling oil prices after 2015 have further exacerbated these
challenges by increasing the fiscal burden on firms and draining fiscal stimulus from the
domestic market.
You can also read