2019 Global Status Report for Buildings and Constructi on - Towards a zero-emissions, effi cient and resilient buildings and constructi on sector
←
→
Page content transcription
If your browser does not render page correctly, please read the page content below

2019 Global Status
Report for Buildings and
Construction
Towards a zero-emissions, efficient and resilient
buildings and construction sector
Acknowledgements
The 2019 Global Status Report for Buildings and Construction was prepared by the International Energy Agency (IEA) for
the Global Alliance for Buildings and Construction (GlobalABC). The report was co-ordinated by the United Nations
Environment Programme and was made possible by the generous support of the governments of Canada, France,
Germany and Switzerland.
ISBN No: 978-92-807-3768-4
Job No: DTI/2265/PA
Cover Images: © Shutterstock
Copyright © United Nations Environment Programme, 2019.
The United Nations Environment Programme and GlobalABC members acknowledge the IEA’s role in generating the
analysis in this report based on IEA data and the data of GlobalABC members. The IEA shall retain ownership of its
underlying data and analysis included in this report.
This publication may be reproduced in whole or in part and in any form for educational or non-profit purposes without
special permission from the copyright holders, provided acknowledgement of the source is made. The IEA and the United
Nations Environment Programme would appreciate receiving a copy of any publication that uses this publication as a
source.
No use of this publication may be made for resale or for any other commercial purpose whatsoever without prior
permission in writing from the IEA and the United Nations Environment Programme.
The electronic copy of this report can be downloaded at www.iea.org or www.globalabc.org.
Citation: Global Alliance for Buildings and Construction, International Energy Agency and the United Nations
Environment Programme (2019): 2019 global status report for buildings and construction: Towards a zero-emission,
efficient and resilient buildings and construction sector.

Disclaimer
The views expressed in this 2019 Global Status Report are not necessarily those of GlobalABC partners. Moreover, the
views expressed do not necessarily represent the decision of the stated policy of the IEA, the United Nations Environment
Programme (UNEP), or its individual member countries or the United Nations Environment Programme, nor does citing
of trade names or commercial process constitute endorsement. The IEA and the United Nations Environment Programme
do not make any representation or warranty, express or implied, in respect of the report’s contents (including its
completeness or accuracy) and shall not be responsible for any use of, or reliance on, the report.

Geographical disclaimer
The designations employed and the presentation of the material in this report do not imply the expression of any opinion
whatsoever on the part of the authors, the GlobalABC, the IEA or the United Nations Environment Programme
concerning the name or legal status of any country, territory, city or area, nor of its authorities, nor concerning the
delimitation of its frontiers or boundaries.

2019 Global Status
Report for Buildings and
Construction
Towards a zero-emissions, efficient and resilient
buildings and construction sector

2019 Global Status Report for Buildings and Construction
                                      Towards a zero-emissions, efficient and resilient buildings and construction sector

Foreword
Decarbonising the buildings and construction sector is critical to achieve the Paris Agreement
commitment and the United Nations (UN) Sustainable Developments Goals (SDGs): responsible for
almost 40% of energy- and process-related emissions, taking climate action in buildings and
construction is among the most cost-effective. Yet, this 2019 Global Status Report on buildings and Page | 3
construction tells us that the sector is not on track with the level of climate action necessary. On
the contrary, final energy demand in buildings in 2018 rose 1% from 2017, and 7% from 2010.
These findings stand in stark contrast with the 2019 Emissions Gap Report, which states that we
will have to cut almost 8% of emissions each year from 2020, and are confirmed by the
International Energy Agency (IEA) World Energy Outlook 2019, which found that in 2018 the rate
of improvement in energy intensity had slowed to 1.2% – less than half the average rate since 2010.
Both reports underline the need for urgent action by policy makers and investors. To meet the
SDGs and the IEA Sustainable Development Scenario, we need to reverse the trend and make a
concerted effort to decarbonise and enhance energy efficiency in buildings at a rate of 3% a year.
In 2020, Nationally Determined Contributions (NDCs) under the Paris Agreement are due for
revision – an opportunity that cannot be missed to ramp up ambition in the buildings and
construction sector. The 2018 Global Status Report on buildings and construction found that a total
of 136 countries have mentioned buildings in their NDCs, yet few have specified the actions they
will use to reduce emissions. Therefore, in their new NDCs, nations must prioritise actions to
decarbonise this essential sector. This means switching to renewable energy sources. It means
improving building design. It means being more efficient in heating, cooling, ventilation, appliances
and equipment. It means using nature-based solutions and approaches that look at buildings within
their ecosystem, the city.
The report also tells us that the building stock is set to double by 2050, which presents another
important opportunity not to be missed. In making good on SDG 11 with its provision for affordable
and adequate housing for all, we need to make sure we promote clean solutions and innovations
to make buildings future-proof. In line with SDG 7, we have to double our efforts on energy
efficiency to bring gains of at least 3% per year.
Such efforts must be supported through investments in energy efficiency; but here also, the
numbers show that we are headed in the wrong direction: investment in buildings sector energy
efficiency flattened in 2018 instead of showing the growth needed. In September, at the UN
Secretary General’s Climate Summit, countries as well as the private sector made commitments to
a zero-carbon buildings sector, and the goal of mobilising USD 1 trillion in “Paris-compliant”
building investments in developing countries by 2030 was set. At the same time, the Net-Zero Asset
Owner Alliance was founded with the world’s largest pension funds and insurers – responsible for
directing more than USD 2.4 trillion in investments – committed to carbon-neutral investment
portfolios by 2050.
These are signs of hope. And change is in the works. This report provides examples of country, city
and private sector actions, of how the buildings and construction sector is reforming. Through this
Global Status Report series, we are keeping an eye on progress made. And through another joint
product – a series of regional roadmaps – we are working with experts and policy makers in
defining their regionally appropriate actions across eight priority action areas to put the sector on
track: urban planning; new buildings; retrofits for existing buildings; building operations;
appliances, lighting, cooking and systems; materials; resilience of buildings; and clean energy.
These roadmaps and actions can then be further adapted nationally.
2019 Global Status Report for Buildings and Construction
           Towards a zero-emissions, efficient and resilient buildings and construction sector

           It is well within the realm of possibility for the buildings and construction sector to deliver its full
           mitigation potential and help the world achieve its climate and sustainable development goals.
           Together, we can build for the future.

Page | 4
            Dr. Fatih Birol                                                    Inger Andersen
            Executive Director                                                 Executive Director of the UN Environment
            International Energy Agency                                        Programme and Under-Secretary-General
                                                                               United Nations
2019 Global Status Report for Buildings and Construction
                                     Towards a zero-emissions, efficient and resilient buildings and construction sector

Acknowledgements
Thibaut Abergel, John Dulac, Ian Hamilton, Maxine Jordan and Aparna Pradeep prepared this
report with the support of Brian Dean, Chiara Delmastro, Brian Motherway and Melanie Slade from
the International Energy Agency (IEA) and also with support from Natacha Nass, Martina Otto and
Nora Steurer from the United Nations Environment Programme (UNEP) for the Global Alliance for Page | 5
Buildings and Construction (GlobalABC).
The authors would like to thank the following partners who supported this report with their
important contributions, input, comments and reviews:
Adrian Joyce, EuroACE ASBL, Brussels
Carlos Bohorquez Gutierrez, Medellin City Hall, Colombia
José Nicolás Moya Ortíz, Sacromonte Ganuc de México SC, Cuernavaca, Morelos, México
Roger Eriksson, Ministry of Finance, Sweden
Luca De Giovanetti, Manager, Science Based Targets, WBCSD, Geneva
María Fernanda Aguirre, Chile Green Building Council, Santiago Metropolitan Region
Dheeraj Arrabothu, Global Green Growth Institute, Kigali, Rwanda
Eddy Lau, Hong Kong Green Building Council, Hong Kong
Jason John, Emirates Green Building Council, Dubai
Mounir Bahri, MB Consultant, Ariana
Ommid Saberi, World Bank, Washington, DC
Yuri Konishi, Ministry of Land, Infrastructure, Transport and Tourism, Tokyo
Silke Krawietz, SETA Network, London
BK Sinha, Malaysia GBC, Kuala Lumpur, Asia Pacific Network, Malaysia
Cécilia Rinaudo, Nubian Vault Association, France
Utsav Biharilal Tayade, Confederation of Indian Industry, India
Susanne Dyrbøl, ROCKWOOL Group, Denmark
Dr. Christine Lemaitre, German Sustainable Building Council - DGNB, Germany
Monika Henn, Urban Land Institute, New York
Ernest DIONE, Direction Environnement et des Etablissements Classés / MEED, Sénégal
Rasmi Hamzeh, Ministry of Energy and Mineral Resources, Jordan
Iva Fakin, Croatian Government Real Estate Agency, Zagreb
Rusmir Music, IFC, World Bank Group, Washington, DC
Carlos Carrazco, Alliance for Energy Efficiency/Alianza por la Eficiencia Energética (ALENER),
Mexico
Mirjam Macchi Howell, Swiss Agency for Development and Cooperation, Switzerland
Ernest Dione, Ministère de l'Environnement et du Développement Durable, Sénégal
Maria Fernandez, Secretaría de Ambiente y Desarrollo Sustentable, Argentina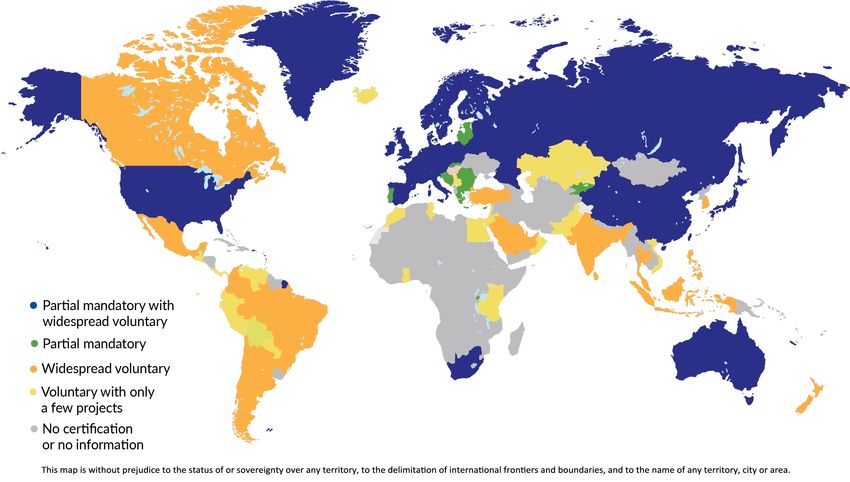
2019 Global Status Report for Buildings and Construction
           Towards a zero-emissions, efficient and resilient buildings and construction sector

           Tatsatom Goncalves, World Resources Institute, Washington, DC
           Véronique Pappe, CONSTRUCTION21, Paris
           Soraya Khalil, Ministère de l'Aménagement du Territoire National, de l'Urbanisme, de l'Habitat et
           de la Politique de la Ville, Maroc
Page | 6   Kouadio Kouakou Parfait, Ministère de l'Environnement et du Développement Durable, Côte
           d'Ivoire
           Mirjam Macchi, Swiss Agency for Development and Cooperation, Switzerland
           Jordan Parnass, Jordan Parnass Digital Architecture, Brooklyn, United States
           Usha Iyer-Raniga, RMIT University, Melbourne, Australia
           Sophia Krietenbrink, BMWi, Germany
           Hernàn Baulo, Architect-Consultant, Buenos Aires, Argentina
           Michael Scharpf, LafargeHolcim, Switzerland
           Cristina Gamboa, CEO, World Green Building Council, London
           Georgina Eldridge, World Green Building Council, London
           Celia Martinez, UNEP, Paris
           Margaux Barrett, Buildings Performance Institute Europe (BPIE), Brussels
           Katie Hicks, Natural Resources Canada, Ottawa, Ontario, Canada
           Catriona Brady, World Green Building Council
           Mariano Fernández, Environment Ministry, Argentina
           Paula Rey Garcia, Energy Efficiency, DG Energy, European Commission
           Christiana Hageneder, Programme for Energy Efficiency in Buildings (PEEB), France
           Sigrid Lindner, Navigant
           Regis Meyer, Ministry of Ecological and Inclusive transition, France
           York Ostemeyer, Chalmers Technical University, Sweden
           Tadj Oreszczyn, UCL Energy Institute, United Kingdom
           Shivraj Dhaka, CII-Sohrabji Godrej Green Business Centre
2019 Global Status Report for Buildings and Construction
                                                      Towards a zero-emissions, efficient and resilient buildings and construction sector

Table of contents
Executive Summary ................................................................................................................ 9
   Global building stock emissions continue to rise .......................................................................... 9
   2020 NDC revisions are a new opportunity to reduce buildings sector emissions..................... 10                                               Page | 7
   New policies lead the way forward ............................................................................................. 10
Global status .........................................................................................................................12
   Energy and emissions in the buildings and construction sector ................................................. 12
      Energy trends .......................................................................................................................... 12
      GHG emissions trends ............................................................................................................. 15
   Sustainable buildings and construction policies ......................................................................... 17
      Nationally Determined Contributions (NDCs) ......................................................................... 17
      Building energy codes ............................................................................................................. 20
      Building energy certification ................................................................................................... 21
   Investment and financing for sustainable buildings ................................................................... 23
Global survey ........................................................................................................................24
   Survey findings ............................................................................................................................ 24
Global Roadmap recommendations .......................................................................................26
   Updates on Global Roadmap activities ....................................................................................... 26
      Urban planning ........................................................................................................................ 26
      New buildings .......................................................................................................................... 26
      Existing buildings ..................................................................................................................... 27
      Building operations ................................................................................................................. 27
      Systems.................................................................................................................................... 27
      Materials ................................................................................................................................. 28
      Resilience................................................................................................................................. 28
      Clean energy ............................................................................................................................ 28
GlobalABC work areas ...........................................................................................................33
GlobalABC members and activities.........................................................................................35
      Programme for Energy Efficiency in Buildings ........................................................................ 35
      National alliances: Mobilising for a buildings sector transition .............................................. 35
References ............................................................................................................................37
Acronyms, abbreviations and units of measure ......................................................................38
   Acronyms and abbreviations....................................................................................................... 38
   Units of measure ......................................................................................................................... 39
2019 Global Status Report for Buildings and Construction
           Towards a zero-emissions, efficient and resilient buildings and construction sector

           List of figures
                           Changes in floor area, population, buildings sector energy use and .............................
                           energy-related emissionsglobally, 2010-18 ................................................................. 9
                           Global share of buildings and construction final energy and emissions, 2018 ........... 12
Page | 8                   Global buildings sector final energy use by fuel type, 2010-18 .................................. 13
                           Global buildings sector final energy consumption by end use, 2010-18 .................... 13
                           Global buildings sector final energy intensity changes by end use, 2010-18 ............. 14
                           Factors influencing building energy use, 2010-18....................................................... 15
                           Factors influencing building energy use by building type, 2010-18 ............................ 15
                           Global buildings sector energy-related emissions by building type and .......................
                           indicator, 2010-18....................................................................................................... 16
                           Changes in floor area, population, buildings sector energy use and .............................
                           energy-related emissions globally, 2010-18 ............................................................... 16
                           NDCs and buildings sector policy coverage, 2018-19 ................................................. 19
                           Global energy efficiency investments and total spending on buildings, 2018 ........... 23

           List of maps
                           Buildings sector emissions coverage in NDCs, 2018-19 .............................................. 18
                           Building energy codes by jurisdiction, 2018-19 .......................................................... 20
                           Building energy certification programmes by jurisdiction, 2017-18 ........................... 21
                           GlobalABC membership and participation .................................................................. 35

           List of boxes
           Box 1 •          2018-19 NDC updates related to buildings and construction .................................... 18
           Box 2 •          Examples of building energy codes ............................................................................ 21
           Box 3 •          Examples of building energy certifications, ratings and labels................................... 22
           Box 4 •          Examples of country strategy updates for 2050......................................................... 25
           Box 5 •          Examples of other sustainability commitments and actions ...................................... 29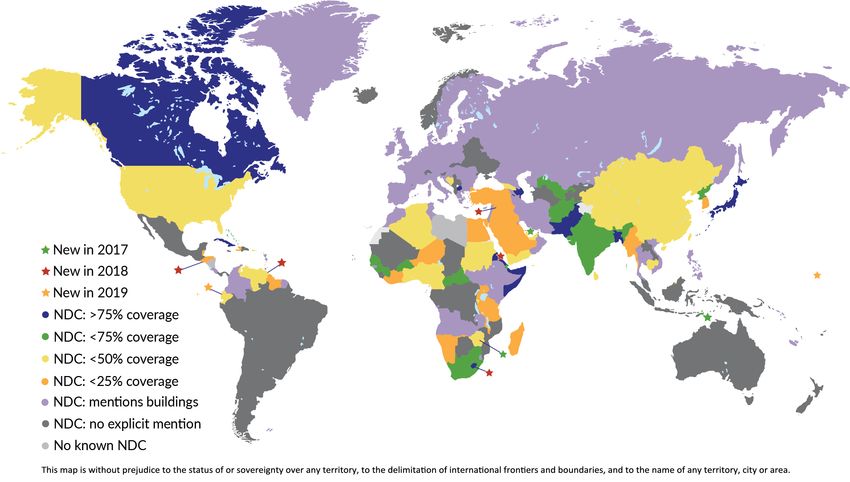
2019 Global Status Report for Buildings and Construction
                                                   Towards a zero-emissions, efficient and resilient buildings and construction sector

Executive Summary
The buildings and construction sector accounted for 36% of final energy use and 39% of energy
and process-related carbon dioxide (CO2) emissions in 2018, 11% of which resulted from
manufacturing building materials and products such as steel, cement and glass. This year’s Global
Status Report provides an update on drivers of CO2 emissions and energy demand globally since Page | 9
2017, along with examples of policies, technologies and investments that support low-carbon
building stocks.
The key global buildings sector trends are:
    •    Global buildings sector emissions increased 2% from 2017 to 2018, to reach a record high,
         while final energy demand rose 1% from 2017 and 7% from 2010.
    •    Increases were driven by strong floor area and population expansions. While efficiency
         improvements continued to be made, they were not adequate to outpace demand growth.
    •    2020 is a key year for countries to enhance their Nationally Determined Contributions
         (NDCs), especially concerning further actions to address energy use and emissions including
         embodied emissions in the buildings and construction sector.
    •    Countries are innovating and implementing measures to improve efficiency and reduce
         emissions from their building stock. As sharing effective measures globally would amplify
         their impact, regional roadmaps are being developed for this purpose.

Global building stock emissions continue to rise
In 2018, global emissions from buildings increased 2% for the second consecutive year to
9.7 gigatonnes of carbon dioxide (GtCO2), suggesting a change in the trend from 2013 to 2016,
when emissions had been levelling off. Growth was driven by strong floor space and population
expansions that led to a 1% increase in energy consumption to around 125 exajoules (EJ), or 36%
of global energy use.

               Changes in floor area, population, buildings sector energy use and energy-related emissions
               globally, 2010-18

         Change since 2010
 25%

 20%                                                                                                                    Floor area

 15%                                                                                                                    Population

 10%                                                                                                                    Energy

  5%                                                                                                                    Emissions

  0%
                                                                                 Emissions increasing
                                                 Period of levelling emissions
 -5%
           2010       2011       2012       2013       2014       2015       2016       2017       2018
                                                                                                        IEA (2019). All rights reserved.
Source: Derived from IEA (2019a), World Energy Statistics and Balances 2019, www.iea.org/statistics and IEA (2019b) Energy Technology
Perspectives, buildings model, www.iea.org/buildings.
2019 Global Status Report for Buildings and Construction
Towards a zero-emissions, efficient and resilient buildings and construction sector
A major source of rising energy use and emissions by the global building stock is electricity, the use
of which has increased more than 19% since 2010, generated mainly from coal and natural gas.
This indicates how crucial it is to make clean and renewable sources of energy accessible, and to
use passive and low-energy designs more widely in building construction.
From 2017 to 2018, energy intensity continued to improve for space heating (-2%) and lighting
Page | 10 (-1.4%), but increased for space cooling (+2.7%) and remained steady for water heating, cooking
and appliances. At an 8% increase in 2018, space cooling became the fastest-growing use of energy
in buildings since 2010, though it accounted for only a small portion of total demand at 6%.
2020 NDC revisions are a new opportunity to reduce buildings
sector emissions
As part of their plans to limit greenhouse gas (GHG) emissions, 184 countries have contributed
NDCs under the United Nations Framework Convention on Climate Change (UNFCCC). Although
most countries (136) mention buildings in their NDCs, few detail explicit actions to address
emissions within the buildings sector. In the next round of NDCs, covering 2020 to 2025, further
focus is needed on actions to mitigate building emissions through switching to low-carbon and
renewable energy sources, and greater attention should be paid to low-carbon building materials,
building envelope improvements, nature-based solutions, and equipment and system efficiency.
These efforts will require higher investments than the USD 139 billion of 2018 – which was a 2%
drop from the previous year. To tackle emissions and reduce energy intensities in the buildings and
construction sector, governments, companies and private citizens must raise investments in
efficiency adequately to offset growth.
New policies lead the way forward
Although greater ambition is needed, policy makers, designers, builders and other participants in
the buildings and construction value chain globally are undertaking activities to decarbonise the
global building stock and improve its energy performance.
• In a number of countries, building codes are being introduced for the first time or are being
strengthened, for example in India through the Eco-Niwas Samhita India’s first energy
conservation code for the residential sector, and in Rwanda through the Green Building
Minimum Compliance System. Policies regulating the energy performance of new buildings
are a powerful means to address future emissions growth.
• Building owners continue to adopt advanced certifications for high energy performance or
low- and zero-carbon buildings, which stimulates improvements in both the new and
existing building stock. The World Green Building Council offers support for such actions
through its Net Zero Carbon Buildings Commitment that is being developed among its
partners.
• Investors are establishing dedicated products and funding schemes for low-energy and low-
carbon buildings across the world. For example, the EU Green Tagging strategy that sets
rules for European green financing is the first to include recommendations for net-zero-
energy buildings (nZEBs) and green renovation.
These activities to enact regulations and enable greater market adoption of low-energy buildings
are encouraging signs of efforts to curb future energy demand and emissions.2019 Global Status Report for Buildings and Construction
Towards a zero-emissions, efficient and resilient buildings and construction sector
Some countries have also established strategies to work towards achieving a net-zero-carbon
building stock by 2050 or earlier. For example, Japan and Canada are developing new policies to
achieve net-zero and net-zero-ready standards for buildings by 2030. As more countries prepare
their NDCs, more ambitious strategies to address existing building stocks will be put forward.
The Global Alliance for Buildings and Construction (GlobalABC) and the International Energy
Agency (IEA), in collaboration with regional members and stakeholders, are developing Regional Page | 11
Roadmaps for Latin America, Africa and Asia to forge pathways towards efficient and resilient zero-
emissions buildings and construction sectors. The roadmaps:
• Highlight priority actions for each region in eight key areas: urban planning; new buildings;
existing building retrofits; building operations; systems; materials; resilience; and clean
energy.
• Are being developed through consultations, workshops and webinars held across the three
regions to gather insights and opinions from regional, national and local stakeholders on
the targets and timelines for delivering an energy-efficient, low-carbon building stock.
• Are regionally owned living documents that will be shared by the end of 2019 and continue
to be developed throughout 2020.
• Support activities such as national alliances that unite local construction value chains to
enable the development and implementation of national strategies for zero-net-energy and
-emissions buildings.2019 Global Status Report for Buildings and Construction
Towards a zero-emissions, efficient and resilient buildings and construction sector
Global status
The buildings and construction sector globally is showing an increase in both emissions and energy
use, limited progress on new and existing policies, and a further slowdown in energy-efficiency
investment growth. More action is therefore needed to curb emissions and deliver a low-carbon,
Page | 12 sustainable built environment.
Energy and emissions in the buildings and construction sector
Building construction and operations accounted for the largest share of both global final energy
use (36%) and energy-related CO2 emissions (39%) in 2018 (Figure 2).
Global share of buildings and construction final energy and emissions, 2018
Non-residential
Energy 8% Emissions Residential (direct)
Transport 6%
Transport 23%
28% Residential (indirect)
Other 11%
7%
Residential
Other Non-residential (direct)
22%
4% 3%
Other industry
31% Non-residential (indirect)
Other industry 8%
32% Construction industry Construction industry
6% 11%
IEA (2019). All rights reserved.
Notes: Construction industry is the portion (estimated) of overall industry devoted to manufacturing building construction materials
such as steel, cement and glass. Indirect emissions are emissions from power generation for electricity and commercial heat.
Sources: Adapted from IEA (2019a), World Energy Statistics and Balances (database), www.iea.org/statistics and IEA (2019b), Energy
Technology Perspectives, buildings model, www.iea.org/buildings.
Key message • The buildings and construction sector should be a primary target for GHG emissions
mitigation efforts, as it accounted for 36% of final energy use and 39% of energy- and process-related
emissions in 2018.
Energy trends
Global final energy consumption in buildings in 2018 increased 1% from 2017, and by more than 8
EJ (about 7%) since 2010 (Figure 3). While strong growth in the main buildings sector resulted from
floor space and population expansion outpacing energy efficiency gains, floor area growth
continues to decouple from energy demand, with floor area in 2018 having increased 3% from
2017 and 23% since 2010.
From 2010 to 2018, global electricity use in buildings rose by over 6.5 EJ, or 19%. Emissions, which
result from the fuel sources used for electricity generation and still include high levels of coal,
especially in emerging economies, also rose in 2018. Continued decarbonisation of the electricity
supply is therefore needed to transition to clean-energy, low-carbon buildings. Also during
2010-18, renewable energy became the fastest-growing energy source for buildings, with its use
increasing 21% (up 3% during 2017-18 alone). Natural gas use rose 8% during the same period,
meeting new demand as well as displacing coal use, which dropped by almost 10% globally during
2010-18 (-2% from 2017 to 2018).2019 Global Status Report for Buildings and Construction
Towards a zero-emissions, efficient and resilient buildings and construction sector
Global buildings sector final energy use by fuel type, 2010-18
Final energy (EJ)
150 Fuel type
Coal
120
Oil
Page | 13
Biomass (traditional)
90
Commercial heat
60 Renewables
Natural gas
30
Electricity
0
2010 2011 2012 2013 2014 2015 2016 2017 2018
IEA (2019). All rights reserved.
Notes: Energy data are not normalised for weather, so yearly energy changes may be due to climatic differences. Biomass (traditional)
refers to conventional solid biomass (e.g. charcoal and forest or agricultural resources) used in inefficient heating and cooking
equipment. Renewables includes solar thermal technologies as well as modern biomass resources (e.g. pellets and biogas).
Sources: Adapted from IEA (2019a), World Energy Statistics and Balances (database), www.iea.org/statistics and IEA (2019b), Energy
Technology Perspectives, buildings model, www.iea.org/buildings.
Key message • Global growth in buildings sector fuel use has concentrated on electricity, natural gas and
traditional biomass since 2010, and higher electricity use in recent years has further increased CO2
emissions.
Globally, greater end-use energy consumption due to significantly higher electricity use since
2010 for space cooling, appliances and hot water, is resulting in increased emissions (Figures 4
and 5). Space cooling demand rose more than 33% during 2010-18 and by 5% in 2017-18, while
energy demand for appliances in 2018 increased by 18% since 2010 and for water heating by
11%. At the same time, space heating demand decreased 1% from 2010, though it has remained
stable for the past five years at one-third of total global energy demand in buildings.
Global buildings sector final energy consumption by end use, 2010-18
Final energy (EJ)
150
125 Space heating
Space cooling
100
Water heating
75
Lighting
50 Cooking
25 Appliances and other
0
2010 2011 2012 2013 2014 2015 2016 2017 2018
IEA (2019). All rights reserved.
Sources: Adapted from IEA (2019a), World Energy Statistics and Balances (database), www.iea.org/statistics and IEA (2019b), Energy
Technology Perspectives, buildings model, www.iea.org/buildings.
Key message • Although space heating, water heating and cooking continue to be the primary end-use
energy demands in the buildings sector globally, the fastest-growing end uses are still space cooling,
appliances and other plug loads.2019 Global Status Report for Buildings and Construction
Towards a zero-emissions, efficient and resilient buildings and construction sector
From 2010 to 2018, changes in buildings sector energy intensity per unit of floor area (as a proxy
for energy efficiency) show that the greatest improvements (i.e. reductions) were in global
average space heating (-20%) and lighting (-17%) (Figure 5). Light-emitting diodes (LEDs)
continue to be important in reducing energy consumption for lighting as floor area increases and
falling consumption for space heating indicates that building envelopes have improved.
Page | 14 However, as floor area has been expanding rapidly in hot countries, cooling demand is increasing.
As better building envelopes are crucial to reduce energy use for heating and cooling, building
codes must remain a policy priority along with technology efficiency improvements.
Global buildings sector final energy intensity changes by end use, 2010-18
Change in energy intensity since 2010
10%
Space cooling
5%
Appliances and
0% other
Cooking
-5%
-10% Water heating
-15% Lighting
-20% Space heating
-25%
2010 2011 2012 2013 2014 2015 2016 2017 2018
IEA (2019). All rights reserved.
Notes: Energy intensity is final energy used per unit of floor area. Appliances and other includes household appliances
(e.g. refrigerators, washers and televisions), smaller plug loads (e.g. laptops, phones and other electronic devices) and other service
equipment.
Sources: Adapted from IEA (2019a), World Energy Statistics and Balances (database), www.iea.org/statistics and IEA (2019b), Energy
Technology Perspectives, buildings model, www.iea.org/buildings.
Key message • Owing to technological improvements, overall reductions have been made in energy
intensity for space heating, lighting, appliances, cooking and water heating. However, space cooling
energy intensity has increased as a result of greater cooling demand in hot regions.
Factors influencing global buildings sector energy use include changes in population, floor area,
energy service demand (e.g. more household appliances and cooling equipment), variations in
climate and how buildings are constructed and used. Those that have contributed most to higher
energy demand since 2010 are floor area, population and building use, while improvements in
building envelopes (e.g. better insulation and windows) and in the performance of building
energy systems (e.g. heating, cooling and ventilation) and components (e.g. cooking equipment)
have helped to offset energy demand growth (Figure 6). Nevertheless, total energy demand in
buildings continues to increase and greater investments in efficiency and passive design
strategies are needed to limit demand and reduce energy intensity.
Final energy consumption in residential buildings made up more than 70% of the global total in 2018,
with growth resulting primarily from floor area and population increases, while floor area alone
remains the main driver of higher consumption in non-residential buildings (Figure 7). Consumption
in residential buildings rose more than 5 EJ during 2010-18, and 3 EJ in non-residential buildings.
Growth in residential demand continues to reflect population and floor area increases as well as
development in emerging economies, along with a continued shift away from the traditional use of
biomass towards modern fuels (e.g. electricity, liquefied petroleum gas and natural gas).2019 Global Status Report for Buildings and Construction
Towards a zero-emissions, efficient and resilient buildings and construction sector
Factors influencing building energy use, 2010-18
PJ Energy saved owing to efficiency
180
150
120 Page | 15
90
60
30
0
2010 energy use Activity Structure Efficiency 2018 energy use
IEA (2019). All rights reserved.
Notes: PJ = petajoule. Activity includes changes in population, climate and the use of buildings and appliances. Structure includes
changes in floor area, occupancy and access to services.
Sources: Adapted from IEA (2019a), World Energy Statistics and Balances (database), www.iea.org/statistics and IEA (2019b), Energy
Technology Perspectives, buildings model, www.iea.org/buildings.
Key message • Strong floor area and population expansions continue to raise buildings sector energy use;
building envelopes and systems have not improved enough to offset this growth.
Factors influencing building energy use by building type, 2010-18
Residential PJ Non-Residential PJ
150 Energy saved owing to efficiency 150
120 120
Energy saved owing to efficiency
90 90
60 60
30 30
0 0
2010 Activity Structure Efficiency 2018 2010 Activity Structure Efficiency 2018
energy use energy use energy use energy use
IEA (2019). All rights reserved.
Notes: Activity includes changes in population, climate and the use of buildings and appliances. Structure includes changes in floor area,
occupancy and access to services.
Sources: Adapted from IEA (2019a), World Energy Statistics and Balances (database), www.iea.org/statistics and IEA (2019b), Energy
Technology Perspectives, buildings model, https://www.iea.org/etp/etpmodel/buildings/.
Key message • Energy-efficient building systems and envelopes continue to limit growth in both residential
and non-residential building energy use, though continued effort is needed to reduce energy intensity.
GHG emissions trends
In a reversal of the previous five years, buildings sector emissions appear to have risen to 9.7 GtCO2
in 2018 – an increase of 2% since 2017, and 7% higher than in 2010. Buildings represent 28% of
global energy-related CO2 emissions (39% when construction industry emissions are included).
Indirect emissions (i.e. from power generation for electricity and commercial heat) account for the
largest share of energy-related CO2 emissions in the buildings sector, representing around 68% of
total buildings-related emissions from energy consumption in 2018 (Figures 8 and 9). The increases
in emissions in 2016 and 2017 correspond with floor area and population expansions as well as2019 Global Status Report for Buildings and Construction
Towards a zero-emissions, efficient and resilient buildings and construction sector
growth in electricity demand (i.e. indirect emissions). Building construction emissions – those
related to the manufacturing of building materials – amounted to a further 11 GtCO2 in 2018, for
a total of 39% of global energy-related emissions.
Global buildings sector energy-related emissions by building type and indicator, 2010-18
Page | 16 Emissions (GtCO2)
10
Non-residential
8 (indirect)
Non-residential
6 (direct)
Residential
4
(indirect)
2 Residential
(direct)
0
2010 2011 2012 2013 2014 2015 2016 2017 2018
IEA (2019). All rights reserved.
Sources: Adapted from IEA (2019a), World Energy Statistics and Balances (database), www.iea.org/statistics and IEA (2019b), Energy
Technology Perspectives, buildings model, www.iea.org/buildings.
Key message • Global buildings sector emissions are dominated by indirect sources, mostly power
generation, and reflect the fuels used to meet end-use heating, lighting, cooking, etc. demand.
Changes in floor area, population, buildings sector energy use and energy-related emissions
globally, 2010-18
Change since 2010
25%
20%
15% Floor area
Population
10%
Energy
5% Emissions
0%
-5%
2010 2011 2012 2013 2014 2015 2016 2017 2018
IEA (2019). All rights reserved.
Sources: Derived from IEA (2019a), World Energy Statistics and Balances (database), www.iea.org/statistics and IEA (2019b), Energy
Technology Perspectives, buildings model, www.iea.org/buildings.
Key message • In 2018, global buildings sector emissions increased for the second consecutive year, rising
by 2% from 2017 to a record high of 9.7 GtCO2. This growth resulted from increases in floor space and
demand for electricity, which is still primarily fossil fuel-generated.2019 Global Status Report for Buildings and Construction
Towards a zero-emissions, efficient and resilient buildings and construction sector
Sustainable buildings and construction policies
By 2020, countries are requested to communicate their new or updated nationally determined
contributions (NDCs) setting out their efforts to reduce national emissions and adapt to the
impacts of climate change. 2020 is therefore a key year for countries to enhance their NDCs and
commit to more aspirational targets. Page | 17
In addition to NDCs, the coverage and strength of energy performance building codes and
certification policies have continued to expand, and in 2018 several countries with updated codes
adopted meaningful improvements that should reduce buildings sector energy demand growth,
especially for heating and cooling, and make buildings and construction more sustainable.
Nationally Determined Contributions (NDCs)
Reporting on NDCs is an international process during which countries announce their national-level
commitments to reduce emissions to limit the rise in average global temperature to less than two
degrees Celsius (°C) above pre-industrial levels by 2100, as set out in the Paris Agreement.
The 24th Conference of the Parties (COP24) in Katowice, Poland, presented the Katowice Climate
Package that sets out the procedures and mechanisms to operationalise the Paris Agreement.
Within the package is guidance on communicating efforts to adapt to climate impacts; a
transparency framework for efforts on climate change; a process for conducting a global stocktake
of overall progress towards the aims of the Paris Agreement; and directions for assessing progress
on technology development and transfer. The package also contains directions for a further round
of NDCs to be submitted by 2025.
To ensure comparability across all NDCs, it outlines how to develop mitigation goals and activities,
specifically covering:
• mitigation co-benefits
• capacity-building support to help developing countries produce their NDCs
• a common time frame for communicating NDCs
• negative impacts of response measures on certain countries and sectors
• modalities for operating and using the public NDC registry.
To date, most countries (184) and the European Union have submitted NDCs, and many countries
(136) mention buildings, although most NDCs still do not include explicit actions to address
buildings sector energy use and emissions (Map 1). Seven countries updated their NDCs in 2018-19,
and the Marshall Islands submitted their second NDC in 2019.
To help countries address buildings-related emissions, GlobalABC has developed guidance on how
to include buildings in the NDCs through mapping, prioritising, implementing and monitoring
(UNEP, 2018). GlobalABC supports ambitious buildings sector climate actions, defined as those that
will move the sector towards zero emissions by 2050 while increasing the built environment’s
resilience and adaptive capacity.2019 Global Status Report for Buildings and Construction
Towards a zero-emissions, efficient and resilient buildings and construction sector
Buildings sector emissions coverage in NDCs, 2018-19
Page | 18
IEA (2019). All rights reserved.
Notes: Emissions coverage is estimated based on specific mentions of measures related to the buildings sector, building end uses and
technology with respect to 2018 buildings sector CO2 emissions. Country NDCs that do not explicitly mention measures or actions for
buildings, for example the economy-wide targets in the European Union, have not been counted in emissions coverage.
Source: Adapted from UNFCCC (2019), Interim NDC Registry.
Key message • Most current NDCs do not explicitly cover buildings sector emissions.
NDCs submitted in 2018-19 focus on improving building performance codes and standards, fuel
conservation and phasing out inefficient products and equipment (Box 1).
Box 1 • 2018-19 NDC updates related to buildings and construction
Kuwait
In May 2018, the Government of Kuwait submitted its NDC that proposes a set of large projects aimed at reducing
the GHG emissions of the energy sector. As part of its climate commitment, the country has developed legal and
regulatory instruments, including an Environmental Protection Law in which Article 11 highlights the government’s
interest in improving energy efficiency in the buildings sector through the use of better materials and equipment
(light bulbs, air conditioning, retrofitting, etc.).
Oman
Oman intends to reduce its GHG emissions by 2% during 2020-30. The government plans to adopt various
mitigation measures for the energy, industrial processes and waste sectors, including promoting energy efficiency
and reducing the use of HCFCs (hydrochlorofluorocarbons) in foam and refrigeration. Oman has also requested
special support for funding, capacity-building and technology transfer to effect further action on sustainable
buildings.
San Marino
Despite contributing only 0.00052% of global emissions, San Marino has committed to reduce its GHG emissions
to 20% below the 2005 level by 2030. Since 2008, San Marino has deployed environmental policies to improve
buildings sector energy efficiency, promote renewable energy through solar photovoltaic (PV) and reduce energy
consumption. Additional efforts on waste management, solvent emissions and new technologies have been made
in recent years.2019 Global Status Report for Buildings and Construction
Towards a zero-emissions, efficient and resilient buildings and construction sector
Suriname
In February 2019, Suriname submitted its NDC that focuses on promoting further actions for forest management
and renewable energy. The government prepared a National Energy Plan 2013-2033 that outlines PV, waste-to-
energy, micro-hydro power, wind, and biomass initiatives. The plan also includes a national energy efficiency
programme to support efficient appliances, energy-saving in buildings and consumer awareness in electricity
consumption. Additional climate change actions have been taken through the National Climate Change Policy,
Strategy and Action Plan (NCCPSAP) that provides the legislative and administrative framework for low-carbon Page | 19
development in the country.
Uzbekistan
Uzbekistan intends to reduce its specific carbon emissions per unit of gross domestic product (GDP) to 10% below
the 2010 level by 2030. The efforts of the country cover three main pillars: energy efficiency; research, education
and training; and control and monitoring of GHG emissions. Specific measures to improve energy efficiency in
buildings to reduce the country’s overall energy consumption and to develop financial schemes to support these
actions are key measures within the energy efficiency pillar.
Of the 136 NDCs that now reference the buildings sector, most do not have specific targets or
policy actions (Figure 10). While existing policies and NDCs covered more than 50% of buildings-
related CO2 emissions as of 2018, 1 if committed NDCs were to become policy, the coverage would
increase to more than 60%.
NDCs and buildings sector policy coverage, 2018-19
NDC submissions Building energy codes
NDCs 194
Country policy 62
Country NDC 46
Buildings 136
0 Number of Parties 197
Energy Building energy certifications
efficiency 104
Country policy 84
Renewables 51 Country NDC 2
0 Number of Parties 197 0 Number of Parties 197
IEA (2019). All rights reserved.
Notes: The left figure shows the number of Parties having submitted an NDC and mentioning specific actions related to buildings, energy
efficiency in buildings or renewables in buildings. The right figure shows the number of Parties with energy codes or certifications, as
well as the number of Parties mentioning those policies in their NDCs.
Source: Adapted from IEA (2019b), Energy Technology Perspectives, buildings model, www.iea.org/buildings.
Key message • With a new reporting phase beginning in 2020, NDCs should increasingly target the
buildings sector through policies and codes to support improvements in building energy performance.
1 IEA analysis has estimated the portion of energy use and emissions associated with building end uses covered under policies
or mentioned in NDCs. It does not reflect reductions in energy use or emissions, and is an indicator only of the portion of current
energy and emissions falling under existing or expected policies.2019 Global Status Report for Buildings and Construction
Towards a zero-emissions, efficient and resilient buildings and construction sector
Building energy codes
Building energy codes, or standards, are requirements set by a jurisdiction (national or subnational)
that focus on reducing the amount of energy used for a specific end use or building component. In
2018, 73 countries had mandatory or voluntary building energy codes or were developing them.
Page | 20 Building energy codes by jurisdiction, 2018-19
IEA (2019). All rights reserved.
Source: Adapted from IEA (2019c), Energy efficiency policies: Buildings, www.iea.org/topics/energyefficiency/policies/buildings.
Key message • Although many developing economies still do not have mandatory building energy codes
despite high construction rates, changes are beginning in regions that have traditionally not had codes,
such as sub-Saharan Africa.
Building energy codes play an important role in setting standards for building construction that will
reduce the long-term energy demands of the buildings sector. With mandatory and progressive
codes, energy use can be better managed as floor space expands, and progressive codes can respond
to changes in legislation and the availability of cost-effective technologies. For maximum impact, it is
essential that a building code be strong, be improved progressively over time and be implemented
effectively. It is also advisable to move towards mandatory codes for both residential and non-
residential buildings.
Of the 73 countries with codes, 41 have mandatory residential building codes and 51 have mandatory
non-residential codes; 4 have voluntary residential codes while 12 have voluntary non-residential
codes; and 8 more are in the process of developing building codes. Greater coverage, adoption and
strength are needed to continue improving the energy performance of new buildings and major
refurbishments.
There is still considerable need for countries and subnational jurisdictions to develop and effectively
implement building energy codes to reduce future energy demand and avoid expensive retrofits
later. There are signs, however, that such codes are being considered by a number of countries in
central Africa and Central America.2019 Global Status Report for Buildings and Construction
Towards a zero-emissions, efficient and resilient buildings and construction sector
Box 2 • Examples of building energy codes
US code updates
Many US states and cities are adopting more stringent residential and non-residential building energy codes. States
that have updated their building energy codes include California, Florida, Idaho, Illinois, Utah, Vermont and
Wisconsin, in addition to cities such as Chicago.
Eco-Niwas Samhita (Part 1: Building Envelope), India Page | 21
India’s Ministry of Power launched ECO Niwas Samhita, an Energy Conservation Building Code for Residential
Buildings (ECBC-R) to promote the energy-efficient design and construction of homes, apartments and townships.
Given the pace at which India’s building stock is expanding, it is a landmark policy that introduces energy efficiency
into the buildings sector and is relevant for all involved in the construction process. The code is being implemented
at the state level with national support.
Rwanda Green Building Minimum Compliance System, Rwanda
The Green Building Minimum Compliance System is point-based and applies to new commercial buildings, public
buildings, assembly buildings, health facilities and educational buildings to help owners and developers choose
indicators based on building type, usage and associated benefits. The system identifies 29 indicators for the basic
green features any building should have, such as appropriate orientation, daylighting, natural ventilation, rainwater
harvesting, efficient plumbing fixtures, low-impact refrigerants, greenery protection and safe paints.
Building energy certification
Building energy certification involves programmes and policies that evaluate the performance of a
building and its energy service systems. Certification may focus on rating a building’s operational or
expected (notional) energy use, and can be voluntary or mandatory for all or part of a particular
buildings sector. The aim of energy performance certification for buildings is to provide information
to consumers about their buildings and to gradually create a market for more efficient buildings.
Building energy certification programmes by jurisdiction, 2017-18
IEA (2019). All rights reserved.
Source: Adapted from IEA (2019c), “Energy efficiency policies: Buildings”, www.iea.org/topics/energyefficiency/policies/buildings.
Key message • Certification programmes are still primarily voluntary in most countries.2019 Global Status Report for Buildings and Construction
Towards a zero-emissions, efficient and resilient buildings and construction sector
As of 2018, 85 countries had adopted building energy performance certification programmes
(Map 3), and several countries and subnational jurisdictions also updated their building energy
certification policies in 2017-18 (see Box 3). The use of certification programmes is growing, with
voluntary certification for high-end buildings becoming a popular means of adding value, but there
is still a lack of large-scale adoption of full, mandatory certification programmes outside the European
Page | 22 Union and Australia. This means that tracking building energy performance over time and
subsequently disclosing the information is still limited.
Box 3 • Examples of building energy certifications, ratings and labels
Green buildings for financial institutions, global
Property developers are beginning to benefit from financing offered by forward-thinking banks that encourage the
construction sector to design better-performing buildings. These banks offer financing to developers for projects that
are certified green at the design stage through EDGE and other leading certification systems. In turn, banks benefit
from owning a portfolio of green assets with greater value and less risk. In Colombia, there were no green-certified
homes before banking incentives were introduced, but the market was transformed when the International Finance
Corporation (IFC) launched EDGE and collaborated with local financial institutions and the government. Now,
hundreds of residential (as well as commercial) buildings are being certified as green.
Energy Efficiency in Municipalities Project, Ukraine
More than 50 municipalities in Ukraine are participating in a benchmarking system for the energy performance of
their buildings. It comprises a dataset of about 2 000 municipal buildings and compares their energy performance,
allowing each municipality to better plan and prioritise renovation activities.
Building Efficiency Accelerator (BEA) project, Dubai, United Arab Emirates
Dubai is the first and only city in the Middle East committed to the BEA project, aiming to accelerate implementation
of building efficiency policies and programmes and to double the global energy efficiency improvement rate by 2030.
A demonstration project was conducted to benchmark the energy performance of existing hotels, schools and
shopping malls. The project covers 121 UAE properties, 103 of which are in Dubai.
Green Building Councils’ Net-Zero Certification, global
Green building rating tools increase awareness and uptake of green building measures, encouraging a holistic
approach to sustainability in the built environment and acknowledging performance beyond local regulatory
requirements. To recognise buildings that are responding to the climate crisis, Green Building Councils (GBCs) globally
have been developing or adapting tools to certify net-zero-carbon buildings. Under the WorldGBC's Advancing Net
Zero project, these tools are developed within a framework of common principles to ensure alignment in their
approach while applying locally specific criteria such as energy efficiency standards or inclusion of whole lifecycle
emissions. Nine certification schemes and two frameworks have been released so far, including Leadership in Energy
and Environmental Design (LEED) Zero from the US GBC. The performance-based approach ensures that there is a
focus on the way buildings actually perform, and flexibility for projects to achieve the same performance standards in
a contextually appropriate way.
WorldGBC’s Net-Zero-Carbon-Buildings Commitment, global
WorldGBC’s Net-Zero-Carbon-Buildings Commitment challenges businesses, organisations, cities, states and regions
to reach net-zero operating emissions in their portfolios by 2030 and to advocate for all buildings to be net-zero-
carbon by 2050. It currently has more than 60 signatories from 31 businesses and organisations, including developers,
real estate investors and property funds, manufacturers and global design firms. Six states and regions are involved,
as well as 26 cities including London, Tokyo and New York.You can also read