Cleaning up their act? - G7 fossil fuel investments in a time of green recovery - Tearfund Learn
←
→
Page content transcription
If your browser does not render page correctly, please read the page content below
Cleaning up their act?
G7 fossil fuel investments in
a time of green recovery
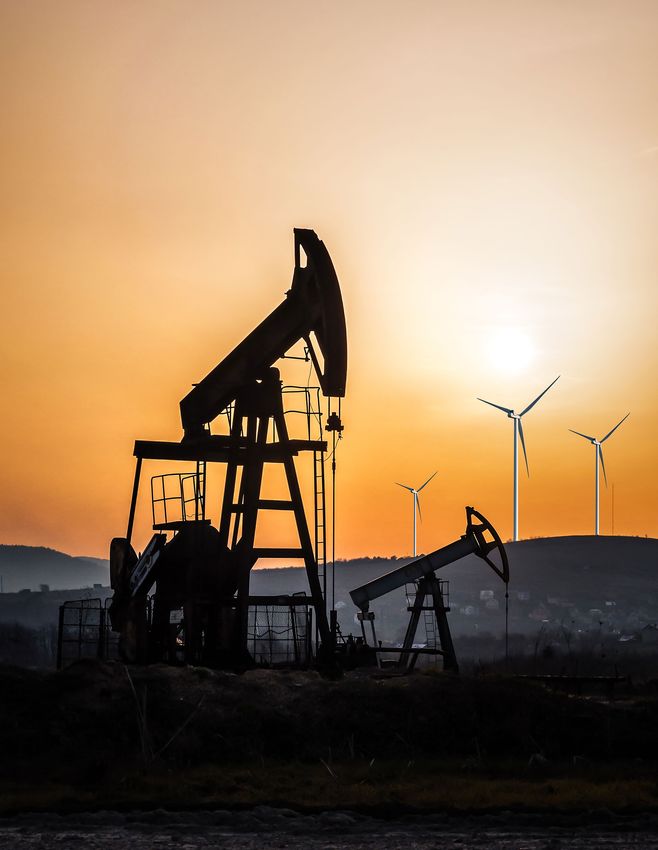
iAcknowledgements This report is published by Tearfund, in collaboration with the International Institute for Sustainable Development (IISD) and the Overseas Development Institute (ODI). The authors are grateful to the following reviewers: Alia Armistead (The Australia Institute), Andrea Biancardi (Bocconi University), Paola Casati (Bocconi University), Paul Cook (Tearfund), Vanessa Corkal (IISD), Vibhuti Garg (IISD), Ipek Gençsu (ODI), Miles Giljam (Tearfund), Rich Gower (Tearfund), Felix Heilmann (E3G), Julia Kendal (Tearfund), Louise Kessler (I4CE), Jo Knight (Tearfund Australia), Satoshi Kojima (IGES), Greg Muttitt (IISD), Chido Muzondo (IISD), Audrey Quicke (The Australia Institute), Sue Willsher (Tearfund), Peter Wooders (IISD). CREDITS Authors: Lucile Dufour (IISD), Tom Moerenhout (IISD), Angela Picciariello (ODI), Estan Beedell (IISD) Copy-editor: Hannah Caddick Design work: Metronome Design Cover photo: Petroleum pump and windmills (iStock/vovashevchuk) ISBN: 978-1-916507-89-0 The e-version of the report can be found at www.tearfund.org/g7recovery © 2021 Tearfund Published by Tearfund ii
Executive summary
    Since the beginning of the Covid-19 pandemic, and despite collective pledges to
    ‘build back better’, G7 nations have been pumping more money into fossil fuels than
    they have into clean energy. The choices G7 countries make this year will have a
    critical impact on the direction of the global economy for decades; these seven
    nations rank among the most polluting countries in the world, representing only
    ten per cent of the global population but more than 24 per cent of CO2 emissions.
    At a time when emissions reductions are urgently needed, G7’s Covid-19 response
    will either accelerate the transition towards cleaner, more equitable societies or
    lock the planet into catastrophic and irreversible climate change.

    This report reviews all new support to energy-intensive sectors approved between
    January 2020 and March 2021 by G7 nations and other participants at the G7
    Leaders’ Summit (11–13 June 2021).1 We assess the contribution of these policies
    towards building back better and, specifically, their impact on climate action.
    The analysis uses data from the Energy Policy Tracker,2 complemented by a
    suite of other recovery tracking tools.

    On 22 April 2021, the Leaders’ Summit on Climate signalled renewed international
    momentum for climate cooperation. New commitments from the US, Canada and
    Japan – alongside recent announcements from the EU, UK and China – are a
    positive step towards keeping global warming to 1.5°C, but don’t go far enough.
    Achieving this objective will require governments to step up climate action and
    honour their collective pledges to ‘build back better’ in the wake of Covid-19.
    This report reviews how the G7 are doing thus far.

Key findings
    This analysis shows that, between January 2020 and March 2021, G7 nations
    committed more than US$189 billion to support coal, oil and gas, while clean forms
    of energy received only $147 billion. In other words, fossil fuels received more than
    half of the total support to energy-intensive sectors. These investments – including
    the many direct support measures and environmental deregulations adopted
    in favour of the fossil fuel industry – are inconsistent with the steep decline in
    emissions needed to limit global warming to 1.5°C and with G7 countries’ own
    net-zero targets.

    1
          Australia, India, the Republic of Korea and South Africa will also attend the summit.
    2
          This online dataset tracks real-time data on public finance for energy around the world
          (www.energy policy tracker.org).

    iii
G7 nations also missed major opportunities to make their response to Covid-19
greener. More than eight in every ten dollars committed to fossil fuels came with
no ‘green strings’ attached: they benefited fossil-fuel intensive activities without
requirements for any climate targets or reductions in pollution. Meanwhile only one
in every ten dollars committed to the Covid-19 response benefited the ‘cleanest’
energies measures,3 like renewables or energy efficiency. G7 countries are not yet
investing at sufficient scale in technologies that support the fast decarbonisation
of their economies and have therefore also forgone the greater job creation that
could be brought about by greener Covid-19 response. These countries can do
much more to progressively transition away from fossil fuels while also supporting
livelihoods in affected sectors.
Support for the transport sector, which received two-thirds of all commitments,
illustrates this dynamic. Although some support benefited cleaner transport, such
as public transport infrastructure or electric vehicles, the G7 also threw massive
lifelines to the airline and car sectors, to the tune of $115 billion – more than
80 per cent of which came with no conditionalities to limit future emissions.
200
180 Clean
unconditonal
160
140 Clean
conditional
US$ billion
120
Fossil
100 unconditional
80
Fossil
60 conditional
40 Other
20 energy
0
Clean energy Fossil fuels Other energy
Figure 1: Public money commitments to fossil fuels, clean energy and other
energy in G7 nations
Source: Energy Policy Tracker (nd).
3
See Table 1 for a presentation of classifications used in this report.
ivThe climate crisis will top the agenda at the 2021 G7 Leaders’ Summit, yet none of
the 11 participating countries – including Australia, India, Republic of Korea and
South Africa – has a fully green track-record when it comes to economic recovery
responses. While eight out of 11 countries substantially improved the greenness
of their plans over the last year,4 at the time of writing only four (Canada, France,
Germany and the UK) have developed plans that will cause more environmental
good than harm.5
Recommendations
The window of opportunity is small, but Summit participants can still get back on
track and tip the balance from a dirty recovery to one that is clean and resilient.
The G7 Leaders’ Summit must send the right signal to the world and take concrete
steps towards building back better. To achieve this, the G7 must:
• Adopt a ‘do-no-harm’ principle for all spending. This includes ending all support
to the production of fossil fuels in recovery responses. It also requires attaching
significant ‘green strings’ to any other support to fossil fuel intensive sectors
that is required to assist companies, workers and affected communities in a
just transition towards a 1.5°C future.
• Dedicate a minimum of 40 per cent of total Covid-19 recovery spending to
policies and measures supporting clean investments and priorities aligned
with the 2015 Paris Climate Agreement. This will help enable the rapid shift
towards clean energy. A steep increase in public finance commitments to clean
energy is needed to meet this: estimates indicate that current green spending
would represent only 22 per cent of total recovery spending in G7 countries
(O’Callaghan et al, 2020).
• Enable a green recovery for all and stand in solidarity with low- and middle-
income countries, which should include ending overseas finance to fossil
fuels, using the G7’s influence on multilateral development banks to align their
activities with the Paris Agreement, announcing a doubling of climate finance
pledges and continuing to ease the debt burden faced by a rising number of
low- and middle-income countries.
4
Australia, Canada, France, Germany, India, Republic of Korea, the US, the UK made considerable
progress; only Japan, Italy and South Africa made little progress (Vivid Economics, 2021).
5
Assessment of greenness of recovery plans according to Vivid Economics’ Greenness of Stimulus
Index (Vivid Economics, 2021).
vContents
1 Introduction............................................................................................................................................... 1
1.1 About this report.................................................................................................................................................. 3
2 Covid response and climate commitments in G7 nations, Australia,
India, Republic of Korea and South Africa.................................................................................6
2.1 Overview analysis of Covid response in G7 nations................................................................ 6
2.2 Sectoral commitments in G7 nations...................................................................................................7
2.3 ‘Clean policies with caution’ and dirty policies with green
strings attached................................................................................................................................................10
2.4 Uneven performance across G7 countries, Australia, India,
Republic of Korea and South Africa...................................................................................................12
2.5 Trends over time: towards cleaner recovery plans?.............................................................. 14
3 Covid response in low- and middle-income countries.......................................................15
3.1 Public money committed in low- and middle-income countries................................15
3.2 Multilateral support received by low- and middle-income countries..................... 17
4 Country case studies......................................................................................................................... 18
4.1 Australia.................................................................................................................................................................. 18
4.2 Canada.....................................................................................................................................................................20
4.3 France.........................................................................................................................................................................23
4.4 Germany.................................................................................................................................................................. 26
4.5 India............................................................................................................................................................................ 29
4.6 Italy...............................................................................................................................................................................31
4.7 Japan..........................................................................................................................................................................34
4.8 Republic of Korea............................................................................................................................................. 36
4.9 South Africa......................................................................................................................................................... 38
4.10 United Kingdom............................................................................................................................................ 40
4.11 United States...................................................................................................................................................43
vi5 Recommendations...............................................................................................................................46
References...................................................................................................................................................48
Annexes......................................................................................................................................................... 53
1. Annex 1: Energy Policy Tracker’s methodology............................................................................ 53
2. Annex 2: Climate commitments and performance of participating
countries to the G7 Leaders’ Summit.................................................................................................. 55
Tearfund........................................................................................................................................................ 56
International Institute for Sustainable Development........................................................... 56
Overseas Development Institute...................................................................................................... 56
viiAcronyms and abbreviations CO2 carbon dioxide COP Conference of the Parties Covid-19 novel coronavirus disease 2019 EU European Union G7 Group of Seven (Canada, France, Germany, Italy, Japan, the UK and the US) G20 Group of Twenty GDP gross domestic product GW gigawatt km kilometre MDB multilateral development bank MW megawatt NDC nationally determined contribution ODA official development assistance SO2 sulphur dioxide tCO2 tonnes of carbon tCO2e tonnes of carbon dioxide equivalent UN United Nations UNFCCC United Nations Framework Convention on Climate Change viii
1   Introduction
    Since the beginning of the Covid-19 pandemic, governments have injected
    unprecedented amounts of public money into their economies. It is estimated
    that the 50 largest world economies committed at least US$14.6 trillion in fiscal
    stimulus measures in 2020 (O’Callaghan and Murdock, 2021). To date, this has
    largely taken the form of short-term relief packages designed to contain the
    immediate social and economic impacts of Covid-19 and the lockdowns, border
    closures and other measures. Now, these packages are giving way to more
    structural recovery policies and measures that aim to build back economies in the
    long term.

    Early on in the crisis, studies pointed out the critical role that Covid-19 responses
    will play in the struggle against climate change. If well-designed and carefully
    targeted, both stimulus measures and economic recovery efforts can help
    countries achieve long-term decarbonisation goals and align emissions reduction
    pathways with the 2015 Paris Climate Agreement goal of limiting global warming
    to 1.5°C (UNEP, 2020; Climate Action Tracker, 2020). Conversely, when Covid-19
    responses are directed at fossil fuel-intensive sectors – as happened after the
    2008 financial crisis – they can lock countries in to carbon intensive pathways, as
    infrastructure built today will operate for decades (Hepburn et al, 2020; SEI et al,
    2020). Choices made now will either accelerate the transition towards a clean, just,
    climate-safe and job-rich future for all, or jeopardise efforts to date to tackle the
    climate crisis and achieve the sustainable development goals.

    Using Covid-19 recovery as a springboard towards low-carbon societies makes
    both environmental and economic sense. The world is not on track to meet the
    2015 Paris Climate Agreement and faces a huge challenge in doing so. The
    temporary decline of 6.4 per cent in CO2 emissions observed in 2020 (Tollefson,
    2021) would have to be sustained, and even increased – to 7.6 per cent – year on
    year, to close the emissions gap by 2030 (UNEP, 2019; 2020). Yet, CO2 emissions
    are already bouncing back to pre-2020 levels (IEA, 2021). Moreover, clean solutions
    that accelerate the decarbonisation of the economy can create thousands of
    decent and sustainable jobs – a central focus of Covid-19 response.

    The pandemic has also highlighted the vulnerabilities and lack of resilience of
    our carbon-intensive development model, which we now have the opportunity to
    reshape. But despite the many international calls to ‘build back better’,6 global
    estimates show that a very small share of the fiscal stimulus provided so far,
    representing as little as 2.5 per cent of total spending, will contribute to building

    6
        See, for example, United Nations Secretary-General remarks in July 2020, UK Prime Minister Boris
        Johnson’s statement in May 2020 (Prime Minister’s Office, 2020) or collective statement from 40
        ministers in July 2020 (IEA, 2020).

    1
a cleaner economy (O’Callaghan and Murdock, 2021). As of early 2021, most
countries’ recovery packages still do more environmental harm than good (Vivid
Economics, 2021). While countries continue to battle Covid-19, 2021 is a decisive
year for climate targets. Governments thus face the difficult – but urgent –
challenge of shifting their recovery spending in a way that addresses the health,
economic and social consequences of the pandemic while tackling climate change.
G7 nations have a special responsibility to deliver on this challenge. They are
among the countries that have mobilised the greatest amounts of public support
in response to Covid-19, representing $6.5 trillion of the total fiscal stimulus so
far (Vivid Economics, 2021). Critically, the Energy Policy Tracker estimates that a
significant proportion – $372 billion – of public money commitments supported
energy producing and consuming activities (Energy Policy Tracker, nd),7 which will
have a disproportionate impact on climate change and on the achievement of
other Sustainable Development Goals (Hepburn et al, 2020).
Moreover, despite being home to only ten per cent of the global population, G7
nations together account for 24 per cent of global CO2 emissions.8 Because of their
current – and historic – responsibility in climate change and given the magnitude
of their Covid-19 response, the direction of G7 recovery spending will have a
considerable influence on the global ambition for climate action in the decades to
come. Their actions will also affect low- and middle-income countries’ ability to
build back better, given the weight of the G7 in the mobilisation of international
support. Signals sent by G7 members at the Leaders’ Summit in June 2021 are
therefore critical and will set the tone for other key international moments in 2021,
including the G20 Summit in Rome (30–31 October) and the 26th Conference
of the Parties to the United Nations Framework Convention on Climate Change
(COP26) in Glasgow (1–12 November).
With the recent commitment from the US in January 2021 (White House, 2021a),
all G7 nations have now adopted objectives to reach carbon neutrality by 2050,
either through official declarations, policy documents or national laws.9 To align
with the 1.5°C temperature goal, these so-called net-zero commitments must be
translated into drastic cuts in greenhouse gas emissions within the next decade10
and support deep decarbonisation in the power generation, transportation and
7
When adding the four democracies invited to the 2021 G7 Leaders’ Summit – Australia, India,
Republic of Korea and South Africa – these figures grow to $11.3 trillion and $504 billion,
respectively.
8
When adding the four democracies invited to the 2021’s Leaders’ Summit, these figures grow to 29.6
per cent of the global population and 35.2 per cent of global CO2 emissions. See also Annex 2 for a
synthesis of climate commitments and performance for participating countries to the G7 Summit.
9
See Annex 2 for a summary of climate commitments and performance in G7 nations and invited
countries to the G7 Leaders’ Summit.
10
The IPCC estimates that CO2 emissions alone must decrease globally by 45 per cent by 2030
compared to 2010, to be in line with a 1.5°C pathway (IPCC, 2018).
2building sectors (Kuramochi et al, 2017). These reforms must in turn be supported
by a complete shift in public money commitments away from fossil fuels.
4000
3500
3000
2500
US$ billions
2000
1500
1000
500
0
India
Japan
Germany
Italy
US
France
Canada
Republic
of Korea
UK
Australia
South Africa
Figure 2: Total fiscal recovery spending between January 2020 and February
2021 in G7 countries, plus Australia, India, Republic of Korea and South
Africa, $ billions
Source: Vivid Economics (2021).
1.1 About this report
This report looks at whether G7 nations are delivering against their commitment
‘to beat COVID-19 and build back better’ and to ‘put our global ambitions on climate
change […] at the center of our plans’ (G7 Leaders’ statement, 2021). We analyse all
new policies and measures related to energy production and consumption approved
by the G7 and other nations invited to attend the 2021 G7 Leaders’ Summit
(Australia, India, Republic of Korea and South Africa) between the beginning of
the Covid-19 pandemic (taken as 1 January 2020) and 3 March 2021,11 assessing
the type of energy each of them supports according to five categories (Table 1).
The report uses data from the Energy Policy Tracker and draws on findings
from other recovery trackers such as the Greenness of Stimulus Index, the
Green Recovery Tracker and the Global Recovery Observatory (Box 1).
11
This report analysed 517 policies approved between January 2020 and 3 March 2021 in Australia,
Canada, France, India, Italy, Japan, Germany, Republic of Korea, South Africa, the UK, the US.
3Section 2 of the report highlights the key characteristics of energy policies and
measures adopted in G7 nations and invited nations to the G7 Leaders’ Summit,
while Section 3 reviews trends related to Covid-19 response in low- and middle-
income countries and implications for the G7. Section 4 of the report focuses on
country case studies for G7 and invited nations Australia, India, Republic of Korea
and South Africa. Finally, Section 5 provides recommendations to G7 nations in
light of the G7 Leaders’ Summit in June 2021.
Table 1: Definition of the five key policy categories used in this report
Energy Terminology
Policy Tracker used in this
category name report Description
Clean Cleanest Includes support to energy that is both
unconditional policies/energy low-carbon and has negligible impacts on the
policies environment if implemented with appropriate
safeguards, such as energy efficiency and
renewable energy coming from naturally
replenished resources like sunlight, wind,
small hydropower, rain, tides and geothermal
heat. Also includes ‘green’ hydrogen and
active transport (cycling, walking).
Clean Clean with Includes support to clean energy, but whose
conditional caution environmental and social impacts can be
policies substantial in the absence of safeguards.
It includes, eg large hydropower or public
transport and electric vehicles, which
contribute to accelerating the clean energy
transition but may still rely on fossil fuel-
powered electricity in the short term.
Fossil Dirty with green Includes support to fossil fuel-intensive
conditional strings projects that is conditional on green
policies requirements, such as setting climate targets
or implementing pollution reduction plans.
While such conditionality is a step in the right
direction, the policies in this category are still
providing significant funding to fossil fuels.
Fossil Dirty energy Includes policies supporting the production
unconditional or consumption of fossil fuels (oil, gas, coal)
policies without any climate targets or additional
pollution reduction requirements. Such policies
can lock economies in to high-polluting
carbon-intensive pathways.
Other policies Other policies Includes policies that can’t be labelled as
‘clean’ or ‘fossil fuels’, such as support to
nuclear energy; ‘first generation’ biofuels,
biomass and biogas; incineration; and support
that benefits multiple energy types, eg
intertwined fossil fuels and clean energy.
4Box 1: Approaches to tracking Covid-19 responses
and policy categories used in this report
Since 2020, several recovery trackers have been launched to bring transparency
to Covid-19 response. These trackers vary in scope, coverage and the method
they employ to track policies. Although their findings are broadly aligned
(recovery plans adopted so far are mostly inconsistent with green recovery
commitments) they highlight different realities, which can lead to slight
variations in findings:
• The Energy Policy Tracker focuses specifically on the scale and direction
of public money committed to energy consuming and producing activities
in four sectors of the economy: transport, building, power and resource
extraction. It determines whether policies approved by governments
(including rescue and recovery policies at national and subnational
level) support fossil fuels or clean energy, with or without environmental
conditionalities attached. It then classifies policies according to five
categories (Table 1). The Energy Policy Tracker’s full methodology can be
found in Annex 1.
• Vivid Economics’ Greenness of Stimulus Index provides an indicator of
the greenness of recovery measures in five key sectors of the economy
– agriculture, energy, transport, building and waste – based on the total
stimulus funds flowing to these sectors, the existing green orientation
of those sectors and the green orientation of new stimulus measures. It
analyses both proposed and approved policies (the Energy Policy Tracker
only assesses those that are approved).
• The Global Recovery Observatory, led by the University of Oxford, tracks
fiscal stimulus policies approved by governments in all sectors of the
economy. It assesses the theoretical environmental and social impact of
recovery policies using policy archetypes. The Observatory doesn’t assess
the impact of rescue policies (such as company bailouts).
• The Green Recovery Tracker from E3G and Wuppertal Institute assesses
the contribution of EU member states’ national recovery plans to climate
change mitigation efforts. The assessment is based on quantitative and
qualitative analyses of long-term recovery measures only.
52 Covid response and climate commitments
in G7 nations, Australia, India, Republic of
Korea and South Africa
2.1 Overview analysis of Covid response in G7 nations
G7 nations have pledged over $189 billion to fossil
fuel production and consumption, while clean energy
received only $147 billion.
10% 10%
9% Clean unconditonal
Clean conditional
29%
Fossil unconditional
Fossil conditional
42%
Other energy
Figure 3: Share of public money committed to clean, dirty and other energy in
G7 nations
Source: Energy Policy Tracker (nd).
Between January 2020 and March 2021, G7 governments have pumped more public
money into fossil fuels than clean energy. According to conservative estimates
from the Energy Policy Tracker, they have pledged more than $189 billion to fossil
fuel production and consumption, while clean energy received only $147 billion. In
6other words, dirty energy received more than half of the total support to energy-
intensive sectors. This trend not only mirrors the heavy subsidies provided to fossil
fuels before 2020 (Geddes et al, 2020) but also reflects the poor track-record of
G7 countries in terms of short-term climate action: their current 2030 targets and
policies would, at best, lead the world to a +3°C warming (Climate Action Tracker,
2020). This sits in stark contrast to their long-term commitment to achieving
carbon neutrality by 2050.
2.2 Sectoral commitments in G7 nations
Two-thirds of commitments supported the transport
sector, with more than eight out of ten dollars supporting
dirty energy with no green strings attached.
Buildings
Transport
Multiple
sectors
Power
Resource
extraction
0 50 100 150 200 250
US$ billions
Clean Clean Fossil Fossil Other
unconditional conditional unconditional conditional energy
Figure 4: Public money committed in different sectors of the economy in G7
nations, $ billion
Source: Energy Policy Tracker (nd).
The bulk of G7 public money commitments flowed to the transport sector, which
received $247 billion between January 2020 and March 2021 (66 per cent of all
energy commitments). Almost two-thirds of this supported dirty energy, with
7more than eight of every ten dollars having no environmental strings attached. As in many other countries, G7 nations approved large plans to bail out the aviation and car industries in the early stages of the pandemic. Among the most notable companies benefiting from these relief schemes are Air France, British Airways, Ryanair, EasyJet, Lufthansa, Japan Airlines, Alitalia, US airline companies (through the Coronavirus Aid, Relief, and Economic Security Act), Renault and Honda. This support, which was generally adopted on social and economic grounds – notably to protect jobs in badly affected sectors – will also sustain highly polluting industries in the decades to come, with very little or no pressure to ‘go green’. Since these initial bailouts, G7 nations have substantially scaled up support to clean policies to develop public transportation (rail) and electric vehicles and to encourage active mobility such as cycling. Despite this, investments in the transport sector remain significantly skewed towards fossil fuels and are at odds with G7 commitments to build back better. The power generation and resource extraction sectors received much less direct money ($25 billion and $14 billion respectively, or seven per cent and four per cent of all energy commitments), but with particularly unfavourable trends for clean energy. As little as 15 per cent of commitments in these sectors will directly aid the transition towards 100 per cent renewables through various small to medium-sized wind, solar or green hydrogen projects. Conversely, 46 per cent of commitments will fuel the climate crisis by propping up the coal, oil and gas industry (Box 2). The remainder of approved policies in these sectors will at best sustain the status quo by subsidising existing energy systems or investing in non-consensual energy such as nuclear. Moreover, there are many indirect support policies, such as tax incentives, that could not be quantified by the Energy Policy Tracker but which could provide additional billions to dirty energy in the power generation and resource extraction sectors. On a more positive note, public money pledged to the buildings sector ($23 billion, or six per cent of total commitments), although limited in scale, was all aimed at improving energy efficiency and will therefore support the clean transition. More than half of commitments directed to cross-cutting sectors also included green components, often linked to energy efficiency. 8
Box 2: Direct support to the fossil fuel industry:
    when recovery policies fuel the climate crisis
    The emissions of already-developed reserves of oil, gas and coal alone could
    bring the world beyond the +1.5°C warming limit set by the Paris Agreement
    (Oil Change International, 2016). Yet the recovery policies of some G7 nations
    threw major lifelines to the oil and gas industry, risking an increase in the
    production and lock-in of these energy systems for decades.

    This was particularly the case in oil and gas producing countries, such as the
    US and Canada. In Canada, the Alberta government pledged $5.5 billion in
    guarantee and equity loans to the now cancelled Keystone XL pipeline, despite
    the project’s well-documented detrimental climate, environmental and human
    impacts (Banktrack, nd). The US and Canadian governments also rolled back
    regulations affecting the fossil fuel industry, which included putting in place
    waivers on the impact assessment process, suspending penalties for companies
    in breach of environmental obligations, introducing fuel tax exemptions and
    extending deadlines for greenhouse gas emissions reporting. In the US and
    Canada, government responses to Covid-19 made it easier – and cheaper – for
    the oil and gas industry to pollute.

    In Australia, India, Republic of Korea and South Africa, public support was even
    directed at the expansion of coal production, despite the urgent need and
    widespread international calls to phase out coal (SEI et al, 2020). In Australia,
    7,000km² of additional land was released for coal and gas exploration, while
    Republic of Korea and India supported thermal power plants through bailouts
    and the dropping of environmental regulations, respectively.

    As a positive sign, a few G7 nations took bold steps towards halting support
    to large incumbent industries. In February 2021, Italy extended a moratorium
    on fossil fuel drilling, affecting new drilling concessions until September 2021.
    France and the UK also introduced policies aiming at ending international
    finance to fossil fuels. The UK’s new policy stops all direct support to the fossil
    fuel energy sector overseas from 31 March 2021; France’s commitment is less
    ambitious and will exclude guarantees to projects involving dirty forms of oil
    such as shale from 2021, followed by all types of oil from 2025 and gas from
    2035. These actions are still the exception but should serve as precedent for
    other G7 countries.

9
2.3 ‘Clean policies with caution’ and dirty policies with
green strings attached
Less than one in ten dollars committed to Covid
response supported ‘cleanest’ energy measures,
like renewable energy or energy efficiency.
In G7 countries, a first step towards delivering their net-zero commitments should,
at the very least, be to ensure that no public money commitment supports fossil
fuel activities without environmental conditionality. However, so far only 17 per cent
of energy commitments to fossil fuel intensive sectors had green strings attached
(Box 3); the overwhelming majority (83 per cent, or $157 billion) failed to include
any climate targets or additional pollution reduction requirements. This is a lost
opportunity for G7 countries to support a just transition and the managed decline
of fossil fuels in their economies.
Of the Covid-19 response and recovery commitments that didn’t go to fossil
fuel intensive sectors and was therefore categorised as either ‘cleanest’ or ‘clean
policies with caution’ (see Table 1), the Energy Policy Tracker found that $39 billion
(27 per cent) supported the ‘cleanest’ policies while $108 billion (73 per cent)
were considered as ‘clean policies with caution’ – measures that could lead
to detrimental impacts if not deployed with the right social or environmental
safeguards in place.12
‘Cleanest’ policies only include no-regret policies such as the deployment of
renewable energies (solar, wind, small hydropower), energy efficiency and active
mobility measures, which are central to the decarbonisation of economies. Many
of these policies are also increasingly cost effective, with sharp cost reductions
in renewable energies and significant savings generated by energy efficiency
measures. But with only ten per cent of their total pledges falling into this ‘cleanest’
category, G7 countries are instead betting on clean policies whose environmental
and climate benefits may take longer to realise in the absence of more broader
shifts in energy systems. G7 nations have also forgone the greater job creation
that could be brought about by cleaner Covid-19 responses (OECD, 2020).
12
See Table 1 for the five main classifications of the policies and public money commitments.
10Box 3: Support to fossil fuels with green strings:
a tool to accelerate the transition of highly
emitting industries
Support with ‘green strings’ is conditional upon other measures aimed at
reducing emissions, protecting the environment, and granting a just transition
for workers and affected communities. Although policies with environmental
strings attached still pump money into traditional polluting industries, there are
examples in G7 nations of how such policies can support the transformation of
our economy while leaving no-one behind.
• In Canada, the federal government offered public assistance to the oil and
gas sector to finance the cleaning up of abandoned oil and gas wells. If
well implemented, the policy – which is worth $1.3 billion – should limit the
negative environmental impact of the industry while supporting local job
creation. However, stronger conditionality could have been implemented to
ensure enforcement of the polluter-pays principle by Canadian provinces.
• In France, the loan to bail out the airline company Air France came with
conditions to reduce emissions through energy efficiency measures and
ending some short-haul flights where there is an alternative journey by rail
that takes less than two-and-a-half hours. Campaigners, however, noted
that only six per cent of aviation emissions globally come from flights under
500km (Graver et al, 2020).
• Although not directly linked to Covid-19 economic recovery, Germany’s
landmark Coal Phase‑out Act adopted in July 2020 is also an example of
policy with green strings attached. It plans to compensate utilities operating
lignite power stations, such as RWE and Leag, for the accelerated shutdown
of coal power plants by 2030. Additional support is also provisioned
to support workers who are affected by power plant and coal mine
decommissioning.
Perfecting and systematically applying green strings should be the absolute
minimum approach for G7 nations. Including conditions for a net-zero transition,
enabling a just transition and building the future of infrastructure and industry
should be key principles that drive the development of ambitious green strings
(Corkal et al, 2020).
112.4 Uneven performance across G7 countries, Australia,
India, Republic of Korea and South Africa
Only four of 11 countries – India, Canada, Japan and
Australia – committed more money to clean energy
than to fossil fuels.
No single country has a fully green track record when it comes to Covid-19
response. However, some countries have been performing better (or worse) than
others at ‘walking the talk’ of their climate and green recovery commitments. In
this subsection, we compare all G7 countries and the four other nations invited
to this year’s G7 Summit in light of their energy policies approved between
January 2020 and 3 March 2021.
India
United States
Germany
United Kingdom
France
Canada
Japan
Republic of Korea
Italy
Australia
South Africa
0 25 50 75 100 125
US$ billions
Clean Clean Fossil Fossil Other
unconditional conditional unconditional conditional energy
Figure 5: Public money committed to clean, fossil fuel and other energy in
G7 nations, Australia, India, Republic of Korea and South Africa, $ billion
Source: Energy Policy Tracker (nd).
The magnitude of energy commitments varies widely across countries. The total
amounts approved in India and the US outweigh by far their counterparts, while
Australia, Italy, Republic of Korea and South Africa have so far pledged relatively
small amounts of money to energy-intensive sectors (Figure 5). France, Canada,
Germany and the UK pledged large amounts of money proportionate to the size of
their populations (Figure 6). Per capita figures also highlight clear inconsistencies
between build back better commitments and recovery decisions: those countries
12that champion the mobilisation of public money for clean energy also invested
heavily in dirty energy, with the risk of wiping out their clean recovery efforts.
With $72 billion committed to dirty energy, the US pledged the greatest amount
of public money to fossil fuel-intensive activities at the time of writing. None of
these policies had environmental strings attached. Similarly, Australia, Japan,
Republic of Korea and South Africa didn’t include environmental conditionalities
when supporting the fossil fuel industry and other fossil fuel consuming activities.
France, Germany, India, Italy, Canada and the UK all introduced various levels of
conditionalities – but the UK also stands out as the country with the highest per
capita commitments to fossil fuels (Figure 6).
Overall, only four countries of the 11 (India, Canada, Japan and Australia) committed
more money to clean energy than to fossil fuels. Canada provided the highest
per capita commitments to clean energy. Meanwhile Australia, France and Italy
were the only three countries to pledge more money to ‘cleanest’ policies, such
as renewable energies or energy efficiency, than to ‘clean policies with caution’.
This fact does point to the fact that the other eight countries didn’t seize the
opportunity to invest at scale in renewable energy and energy efficiency through
their recovery plans. South Africa is the only country with no public money
commitment registered towards clean energy (although non-monetary
support was granted to clean energy).
800
700
600
US$/individual
500
400
300
200
100
0
Australia
Germany
Italy
France
Canada
United
Kingdom
United
States
Republic
of Korea
South
Africa
India
Japan
Clean per capita Fossil fuel per capita Other per capita
Figure 6: Per capita fossil fuel and clean energy commitments in G7, Australia,
India, Republic of Korea and South Africa
Source: Energy Policy Tracker (nd).
132.5 Trends over time: towards cleaner recovery plans?
Eight of the 11 countries substantially improved the
greenness of their plans throughout 2020.
In G7 countries and the invited nations, initial rescue measures disproportionately
benefited fossil fuel intensive activities, notably in the transport sector, and
supported projects often associated with carbon-intensive infrastructure
(SEI et al, 2020). However, recent signals show that newly approved and upcoming
recovery packages could progressively tip the balance from dirty to clean. For
instance, Canada’s Healthy Environment and Healthy Economy Plan, announced
in December 2020, contributed to injecting massive amounts of spending into
clean energy (Corkal and Beedell, 2021). Similarly, the yet-to-be-implemented EU
recovery plan is set to earmark 37 per cent of its $830 billion to green initiatives.
US President Biden’s proposed American Jobs Plan, worth $2 trillion, should also
green the US recovery package13 (Vivid Economics, 2021). In fact, eight of the
11 countries substantially improved the greenness of their plans throughout
2020; Japan, Italy and South Africa made little progress.
Despite these improvements, as of February 2021, only four of the G7 members
(Canada, France, UK and Germany) have developed recovery plans with an
overall positive impact on climate and the environment. An urgent shift is
therefore needed to ensure that G7 nations make good on their build back
better commitments and net-zero pledges.
100
First Index Score Current Index Score
Greenness of stimulus index
80
60
40
20
0
-20
-40
-60
-80
-100
India
Japan
Australia
South
Africa
United
Kingdom
States
United
Germany
France
Italy
Canada
Republic
of Korea
Figure 7: Current and first Greenness of Stimulus Index scores
Source: Vivid Economics and Finance for Biodiversity (2021).
13
See the country case study on the US for more details on the potential impact of the American Jobs
Plan on US response to Covid-19.
143 Covid response in low- and middle-income
countries
Covid-19 could force an additional 150 million people into extreme poverty by
the end of 2021, especially in low- and middle-income economies (World Bank,
2020). The capacity of these countries to build back better is therefore essential
to mitigate the worst impacts of the health and economic crises and to secure a
sustainable future for all. However, while G7 countries have been able to mobilise
substantial amounts of public money, initial recovery spending estimates in
low- and middle-income countries are far smaller. The G7 plays a critical role in
influencing the mandate of international finance institutions and in providing a
significant proportion of all official development assistance (ODA).14 This section
looks at the money mobilised and multilateral support received for recovery in
12 low- or middle-income countries – Argentina, Bangladesh, Brazil, China,
Colombia, India, Indonesia, Mexico, Saudi Arabia, Vietnam, South Africa, Turkey –
and suggests ways in which the G7 can support a cleaner and more resilient
recovery for all.
3.1 Public money committed in low- and middle-income
countries
The Global Recovery Observatory, which covers 50 countries, shows that in 2020,
advanced economies pledged measures accounting for 22.5 per cent of their
combined gross domestic product (GDP), while low- and middle-income countries
committed to measures worth 10.6 per cent of their GDP (O’Callaghan and
Murdock, 2021). We see similar trends when it comes to energy commitments: on
average, G7 countries pledged an average of $664 per capita to energy consuming
and producing activities, while the 12 low- or middle-income economies tracked by
the Energy Policy Tracker allocated an average of $23 per capita (and none more
than $169), a figure which stands in sharp contrast with the large energy financing
requirements for improving energy access in these countries.15
14
G7 members together reported $115 billion in ODA in 2019 (grant equivalent) – almost three-
quarters of all support reported by donor countries (OECD, 2021).
15
he UNDP estimates renewable energy financing requirements to meet SDG7 on energy access are
between $442 billion and $650 billion per year until 2030 (UNDP, nd).
15Total commitments per capita, US$
0.7 1312.8
Figure 8: Total per capita commitments to energy consuming and producing
activities in G7 nations and 12 selected low- and middle-income
countries, US$
Source: Energy Policy Tracker (nd).
This substantial gap can be explained by the uneven capacity of countries to
expand their fiscal space in the short term. While developed countries benefited
from favourable monetary policies and small interest rates on international
markets, low- and middle-income countries had much less room for manoeuvre,
facing unfavourable borrowing terms reinforced by rising levels of debt and debt
costs over the past decade (Kose et al, 2020).
Even before the pandemic, emerging markets and developing economies faced a
‘fourth wave’ of debt (World Bank, 2021). The additional impact of Covid-19 and
the cost of pandemic response will have long-lasting effects on the ability of these
countries to build back better and could create a downward spiral of dangerously
high levels of debt that hinder development prospects, decrease adaptive capacity
to climate impacts and delay energy transition (Fresnillo, 2020). In this context, the
debt payment suspension adopted by G20 countries in 2020 (G20, 2020) was a
crucial but insufficient step towards mobilising public money for recovery in low-
and middle-income countries.
163.2 Multilateral support received by low- and middle-
income countries
G7 nations play a prominent role on the boards of many multilateral development
banks (MDBs) and therefore have a responsibility to ensure that multilateral
support is directed towards building back better objectives – especially as
responses seem particularly skewed towards fossil fuels. Throughout 2020,
international finance institutions developed plans to support the deployment
and implementation of Covid-19 response policies in low- and middle-income
countries. The Energy Policy Tracker reviewed the projects directly approved by
MDBs over the course of 2020 and, encouragingly, initial findings showed that
MDBs provided $12.5 billion to clean energy projects – more than four times the
$3 billion that went to fossil fuel financing.
Clean unconditonal
21%
Clean conditional
37%
Fossil unconditional
30% Fossil conditional
10% Other energy
2%
Figure 9: Share of public money committed to clean, fossil fuel and other energy
by multilateral development banks
Source: Energy Policy Tracker (nd).
However, the combined support of $3 billion to fossil fuels – including 75 per cent
for gas projects – is still fundamentally inconsistent with MDB commitments
to build back better and to align with the Paris Agreement. Moreover, the
disaggregated data shows uneven performance across MDBs, with the European
Investment Bank standing out as the largest supporter of clean energy while other
banks, such as the World Bank and the Asian Development Bank, still lag behind.
But the overall shift in MDB’s spending towards supporting clean energy could help
move the needle towards cleaner recovery measures in low- and middle-income
countries, while also supporting the achievement of Sustainable Development
Goals. G7 nations have the opportunity to build on and strengthen this MDB energy
spending trend, to support a fossil-free recovery and energy access in low-income
countries. MDBs must urgently commit to end support to any kind of oil, gas and
coal project and sharply increase support for clean energy, energy efficiency,
just transition plans and energy access – notably through off-grid and mini-grid
renewable energy (The Big Shift Global, 2021).
174 Country case studies
4.1 Australia
4.1.1 OVERVIEW
Quantified energy policy funding
Net-zero target status None commitments since Covid-19
2%
Climate Action Tracker Rating Insufficient
27%
Share of global population 0.33%
65%
6%
Share of global emissions 1.13%
Tonnes of CO2 emissions Clean unconditional Fossil unconditional
16 (world average = 5)
per capita Clean conditional Fossil condtional
Other energy
Since the start of the Covid-19 crisis (between 1 January 2020 and 3 March 2021),
quantified energy-related funding commitments in Australia have totalled
US$3.2 billion,16 of which 27 per cent ($867 million) was pledged to fossil energy
and 71 per cent ($2.3 billion) to clean energy. Australia has also enacted a number
of energy policies that have not yet been quantified but are intended to strongly
support fossil fuel production (particularly gas, but also coal) and have a delaying
impact on the energy transition.
Top-three energy funding commitments in Australia (by amount committed)
$549 million for residential energy efficiency support, one-off power bill relief
1
payments for eligible recipients and an expansion of residential solar energy.
$492 million for support to airlines, including refunding and waiving aviation
2
fuel excise tax, air service changes and regional aviation security charges.
$372 million to support the development of six renewable energy zones
3
across Victoria.
16
Unless otherwise specified, all public money commitments mentioned in case studies are in
US dollars. Where equivalent dollar amounts are provided, we used 2020 annual average exchange
rates using OECD data
18Energy policies with no specific funding attached or no disclosed monetary value
The government introduced a gas-fired recovery policy, which included opening
up major gas basins (eg Beetaloo Basin, North Bowen and Galilee Basin) for
production.
In South Australia and Western Australia, governments committed to several
short- and medium-term tax deferrals and tax cuts for petroleum producers
and mining companies.
In Queensland, 7,000km2 of land was released for coal and gas exploration, with
the government also suspending fees and charges for exploration until July 2021.
Five parcels of land were released for tender for coal and gas in the region. In New
South Wales, the independent planning commission approved the Whitehaven
Coal’s Vickery mine to increase coal extraction by 25 per cent and expand the
disturbance area by 776 hectares.
4.1.2 ANALYSIS
Australia’s per capita greenhouse gas emissions are among the highest in
the world. Yet, Australia has insufficient short-term climate targets and no
commitment to go carbon neutral by 2050. It is encouraging that Australia’s
spending to support fossil fuel energy ($0.9 billion) over 2020 is lower than its
support for cleaner forms of energy ($2.3 billion). The power sector has received
the highest quantified contributions of Australian stimulus funding, at about
$1.5 billion out of a total of $3.2 billion.
But the country’s continuing commitment to fossil energy remains steadfast.
While these recent clean energy investments could cause a shift in the power
sector, Australia’s commitment to the exploration, extraction and production of
hydrocarbon resources will have a long-lasting impact by locking in fossil fuels in
the Covid recovery. All the country’s support to fossil fuels appears to be without
any environmental or carbon reduction conditionalities attached.
On the one hand, the government continues to support coal – the most
problematic fuel given its high warming and air pollution externalities. National
and regional governments in Australia have introduced tax breaks, opened tenders
for parcels of land for exploration and production and deferred the collection of
rent and fees to help the cash flow of mining companies, which will only incentivise
more coal mining. They have also committed to funding an upgrade of a coal fired
power plant, which will be used to provide new turbines and high-pressure heaters
by 2022/23, effectively extending the life of the plant, rather than supporting
its closure.
19Australia’s national and regional governments have also supported a natural gas-
based recovery. The national government allocated $217 million explicitly for road
upgrades to facilitate gas exploration and, as mentioned, opened several blocks
for production. Similarly, several other supportive measures are taken to help the
development of the natural gas industry. This includes a feasibility study for a
new gas pipeline and the freezing of fees for natural gas exploration.
On the other hand, the majority of Australia’s power sector funding has gone to
unconditional clean energy projects such as renewable energy and energy efficiency.
In addition to residential energy efficiency support and the development of
renewable energy zones, the Queensland government has pledged $344 million
to invest in publicly owned renewable energy projects and supporting infrastructure.
Several other regions have also pledged funding to dedicated Renewable Energy
Zones, which will mostly rely on wind and solar. The government of Victoria has also
committed $110 million to the development of a grid-level storage battery with
a capacity of 300 MW. Australia has also committed around $300 million of
national funding to the development of a green hydrogen industry.
It is noteworthy that in terms of the mobility sector, the Australian government
has, like many other countries, used public money to bail out airlines without
environmental conditions attached. Its investment in the electrification of
road transport, meanwhile, has been relatively limited.
4.2 Canada
4.2.1 OVERVIEW
Quantified energy policy funding
Net-zero target status In political pledge commitments since Covid-19
5%
8% 11%
Climate Action Tracker Rating Insufficient
Share of global population 0.49% 32%
44%
Share of global emissions 1.58%
Tonnes of CO2 emissions Clean unconditional Fossil unconditional
15 (world average = 5)
per capita Clean conditional Fossil condtional
Other energy
20Since the start of the Covid-19 crisis (between 1 January 2020 and 3 March
2021), quantified energy-related funding commitments in Canada have totalled
US$49.3 billion, of which 37 per cent ($18.1 billion) was pledged to fossil energy and
55 per cent ($27.3 billion) to clean energy.17
Top-three energy funding commitments in Canada (by amount committed)
1 $11.1 billion for investments in public transit infrastructure, over eight years.
$5.6 billion loan guarantee and equity investment from the Alberta government
2
for TC Energy’s Keystone XL pipeline.
$2.9 billion for Alberta’s capital plan and recovery plan spending for road
3
infrastructure, over three years.
Energy policies with no specific funding attached or no disclosed monetary value
Plan to increase the federal carbon price by CA$15 per year starting in 2023,
rising to CA$170/tCO2 in 2030.18
Establishment of oil and gas-specific Covid-19 response measures, such as the
expansion of eligibility for the Business Credit Availability Program (BCAP) for oil
and gas companies.
Changes to the Export Development Act, increasing the limits on the liability that
Export Development Canada can incur and expanding its domestic mandate.
17
The federal government and several provinces introduced new annual budgets in April 2021. At time
of writing, not all of these budgets have been formally passed. The federal government announced
over US$12.7 billion in new energy measures, including an additional $3.7 billion to assist high carbon
sectors to decarbonise (Department of Finance Canada, 2021a). They also provided $1.5 billion in
support to the aerospace sector, in addition to a previously announced US$4.4 billion bailout to Air
Canada that has some climate-related conditions (Department of Finance Canada, 2021b). Despite
some new clean energy measures, most provincial budgets have significant new commitments for
highway and road infrastructure, contributing to increased ‘fossil energy’ spending.
18
This policy is placed in the fossil fuel category in the Energy Policy Tracker because it primarily
affects fossil fuel energy. In this report, we have classified it as clean because of its positive
environmental impact.
21You can also read