The vulnerability of northern European vegetation to ozone damage in a changing climate - IVL Swedish Environmental ...
←
→
Page content transcription
If your browser does not render page correctly, please read the page content below
No. C 586
                                                                                          April 2021

The vulnerability of northern European vegetation to
ozone damage in a changing climate

An assessment based on current knowledge

Per Erik Karlsson, Håkan Pleijel*, Camilla Andersson**, Robert Bergström**, Magnuz Engardt###,
Aud Eriksen***, Stefanie Falk#, Jenny Klingberg####, Joakim Langner**, Sirkku Manninen##, Frode
Stordal#, Hans Tømmervik¤. Ane Vollsnes***
                                           In cooperation with * University of Gothenburg, **
                                           Swedish Meteorological and Hydrological Institute, ***
                                           Department of Biosciences, University of Oslo,
                                           #
                                             Department of Geosciences, University of Oslo, ##Faculty
                                           of Biological and Environmental Sciences, University of
                                           Helsinki, ### SLB-analys, Stockholm, Sweden,
                                           ####
                                                Gothenburg Botanical Garden, ¤The Norwegian
                                           Institute for Nature Research (NINA)
Authors: Per Erik Karlsson, Håkan Pleijel, Camilla Andersson, Robert Bergström, Magnuz Engardt,
Aud Eriksen, Stefanie Falk, Jenny Klingberg, Joakim Langner, Sirkku Manninen, Frode Stordal, Hans
Tømmervik. Ane Vollsnes
Funded by: Swedish Environmental Protection Agency
Photographer: Per Erik Karlsson
Report number C 586
ISBN 978-91-7883-270-5
Edition Only available as PDF for individual printing

© IVL Swedish Environmental Research Institute 2021
IVL Swedish Environmental Research Institute Ltd.
P.O Box 210 60, S-100 31 Stockholm, Sweden
Phone +46-(0)10-788 65 00 // www.ivl.se

This report has been reviewed and approved in accordance with IVL's audited and approved
management system.
Preface
This report describes an assessment of the potential vulnerability of far northern European
vegetation to ozone damage in a changing climate. This assessment has been made within the
framework of the research program “Swedish Clean Air and Climate Research Programme, phase
2”, financed by the Swedish Environmental Protection Agency. Furthermore, results from several
other ongoing research projects in the Nordic countries have contributed to the results presented
and conclusions made in this report.

One important research question has been if there are increasing risks for ozone impacts on the
tundra, arctic and sub-arctic vegetation as well as boreal forests in northern Fennoscandia due to
climate change, in combination with high spring ozone concentrations and in relation to the
advance of the start of the growing season. Another question has been if a high ozone vulnerability
of northern vegetation represents an argument to further reduce ozone precursor emissions,
compared to the current strategies, which are based on the risks for ozone impacts on the European
vegetation in general. The assessments that are described in this report are part of the attempts to
answer these research questions.

Scientists from three Nordic countries, Sweden, Norway and Finland, have joined in three
workshops, in Gothenburg 11th June 2018 and 27th August 2019 as well as in Oslo 12th November
2018, to present and discuss different aspects of exposure and effects of ozone on vegetation types
typical for northern vegetation zones. The assessments rely on the experience and expertise of the
authors.
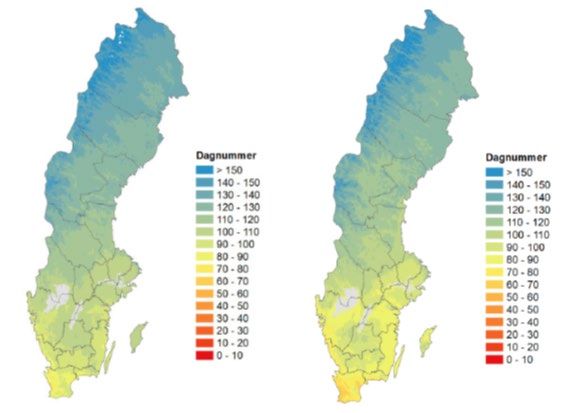
Table of contents
Summary ................................................................................................................................ 6

Sammanfattning..................................................................................................................... 9

1     Introduction .................................................................................................................. 12

2     Ongoing environmental changes affecting northern latitude ecosystems .................. 14
    2.1      Changes in climate .......................................................................................................................... 14
    2.2      Deposition of nitrogen .................................................................................................................... 17
    2.3      Artic greening and browning ........................................................................................................... 18

3     Changes in ozone exposure phenology ........................................................................ 18

4     Ozone concentrations at European northern latitudes ............................................... 21
    4.1      Background ozone concentrations .................................................................................................. 21
    4.2      Seasonal variation of near surface ozone at high northern latitudes ............................................. 23
    4.3      Changes in the seasonal variation over time and source attributions of northern ozone
             concentrations................................................................................................................................. 26
    4.4      Historical ozone episodes at far northern latitudes ........................................................................ 29
    4.5      Ozone concentrations close to the ground ..................................................................................... 31

5     Special environmental conditions at far northern latitudes affecting the
      vegetation vulnerability for ozone damage ................................................................. 32

6     What is known about the diurnal time course of gas-exchange for vegetation
      at far northern latitudes? ............................................................................................. 34

7     Other aspects of day length on the ozone susceptibility in plants .............................. 37

8     Ozone flux estimates for northern latitudes ................................................................ 38

9     Plant traits that might affect the ozone sensitivity of high-altitude plants ................. 39

10 Studies of ozone impacts on northern European vegetation ...................................... 40
    10.1     Northern European trees ................................................................................................................ 41
    10.2     Northern European (semi-)natural vegetation................................................................................ 41
    10.3     Northern European mosses and lichens.......................................................................................... 42
    10.4     The ozone vulnerability of northern European vegetation ............................................................. 42

11 Predictions of future near-surface ozone and its impacts on vegetation .................... 43
    11.1     The impact of future climate and precursor emissions on near-surface ozone exposure .............. 43
    11.2     Consequences of changed anthropogenic air pollution emissions in the north ............................. 45

12 Overall conclusions about the ozone vulnerability of northern vegetation ................ 46
13 Policy implications ........................................................................................................ 48

14 Important remaining knowledge gaps ......................................................................... 48

15 Acknowledgements ...................................................................................................... 49

16 References .................................................................................................................... 49

Report C 586 The vulnerability of northern European vegetation to ozone damage in a changing climate –
An assessment based on current knowledge
Summary
The potential vulnerability of vegetation at northern latitudes to ozone damage was assessed based
on current knowledge with regard to air ozone concentrations and leaf ozone uptake as well as to
plant traits affecting ozone tolerance. The focus was on the northern European arctic, alpine and
northern boreal vegetation zones, with a special focus on high-altitude vegetation. In particular, we
analysed if there are increasing risks for ozone impacts on northern vegetation due to high spring
ozone concentrations in relation to climate change induced shifts such as e.g. an earlier start of the
growing season.
The ozone concentrations in these regions are characterized by the influence of a combination of
conditions caused by high latitudes and high altitudes. Ozone concentrations increase with altitude
and the difference in ozone concentrations between day and night are smaller at high-altitude and
high-latitude sites. Summer periods with long daylight conditions potentially promote the leaf
ozone uptake through the open stomata.
The aims of this report were:
• To assess the current state of knowledge regarding the potential vulnerability of far
northern vegetation to ozone damage, today and in the future
• To provide advice for policy implications regarding necessary ozone precursor emission
abatement
• To provide advice for future research and monitoring of ozone impacts on the vegetation
at northern latitudes
Ongoing environmental changes affecting far northern latitude ecosystems were reviewed. Current
and novel methods were described for how to estimate the time of year during which the ozone
exposure for vegetation should be accumulated. Time trends for ozone concentrations at northern
latitudes were analysed. Ozone episodes with high concentrations at far northern latitudes were
described. Source attributions of northern ozone concentrations were analysed. Environmental
conditions at far northern latitudes that might be important for ozone damage were evaluated.
Plant traits that can influence the ozone vulnerability were discussed. Current experimental results
for ozone injury on northern plant species were evaluated. Future scenarios for ozone impact on
northern vegetation were discussed. Some important results from the analyses are described
below.
At high altitudes and high latitudes, the ozone concentrations are relatively similar during day-
and night-time. Furthermore, at high latitudes, the long daylight duration during the summer has
the potential to increase the duration of the daily period with plant gas exchange and leaf ozone
uptake. Therefore, the absorption of ozone through the stomata may potentially be higher at
northern latitudes. However, measurements of light intensity and quality at northern sites in
combination with a simple calculation example illustrated that this probably was not the case, since
the potential added ozone uptake in the early morning and late evening at northern sites may be
cancelled out by a lower ozone uptake in the middle of the day, as compared to southern sites.
Both data on budburst and data on ecosystem CO2 exchange as well as meteorological observations
show that there has been a development towards an earlier start of the growing season during the
year, with approximately 0.5 – 1 day per year. Thus, there is clear evidence for an earlier start of the
growing season, which is likely to continue. However, the timing of the spring ozone maximum is
6
Report C 586 The vulnerability of northern European vegetation to ozone damage in a changing climate –
An assessment based on current knowledge
also shifted towards earlier in the year. There is presently no evidence for an increasing overlap
between the growing season and the ozone peak. Despite this, there is a potential for increased
ozone uptake to vegetation in spring due to the earlier growing start of vegetation and increased
uptake of ozone to vegetation in May. The impact of this on the accumulated phytotoxic ozone
dose for northern vegetation needs to be investigated further.
The overall conclusions about the present and near future ozone vulnerability of northern
vegetation were:
• There remain uncertainties regarding to what extent northern vegetation is affected by
ozone exposure.
• According to current knowledge, we could not find evidence that expected changes in
ozone concentrations and climate would make the northern arctic, alpine and subalpine
vegetation substantially more vulnerable to ozone than other types of European
vegetation.
• The risk of significant and lasting negative impact of the current exposure to ozone on
northern boreal forests is most likely not greater than for boreonemoral and nemoral
forests in southern Fennoscandia.
• However, peak ozone concentrations occurring in spring and early summer may affect
vegetation at northern latitudes in Fennoscandia since the start of the growing season in
the future may occur earlier during the year.
The policy implications that can be derived from these conclusions were:
• The current state of knowledge implies that ecosystems in the far north are not more
susceptible to ozone than vegetation in other parts of Europe. Hence, we cannot advocate
for a stronger reduction of ozone precursors emissions based exclusively on the ozone
sensitivity of vegetation in the far north.
• Policies designed to reduce emissions of ozone precursors to protect vegetation in other
parts of Europe as well as in the entire northern hemisphere are likely to suffice to protect
vegetation in northern Fennoscandia.
There are important remaining knowledge gaps. Our conclusions are based on important, but
limited observations. Experimental evidence from investigations specifically designed to study
ozone sensitivity of high-altitude vegetation in northern Europe are to a large extent lacking. It is
recommended that further experimental research is undertaken to directly compare the ozone
sensitivity of plants of high-latitude/high-altitude origin with that of plants (species, genotypes)
representative of regions of the southern part of the Nordic region. This research should include
the characteristics of the high-latitude climate and other conditions.
A specific research question is if the new ozone critical levels for European vegetation based on
PODYSPEC (Mapping Manual, 2017) are correct, both regarding calculation methodology as well as
impact assessments? In particular, there is a lack of information about the degree of stomata
closure during nights in high-latitude area plants. This is important for the modelling of ozone
uptake (dry deposition) in these areas and requires coordinated measurement campaigns in close
cooperation with modelers.
Further research questions may be related to the future development of the northern regions – e.g.
oil and gas extraction including flaring, shipping, more tourism and climate change – how will that
affect the ozone exposure of in the northern vegetation? Do future ozone precursor emission
7
Report C 586 The vulnerability of northern European vegetation to ozone damage in a changing climate –
An assessment based on current knowledge
scenarios describe this correctly? Will warm and dry summers like 2018 become more frequent in
connection with climate change, and how will this affect ozone impacts on vegetation?
There are currently very few, long term ozone monitoring stations in the arctic and alpine
vegetation zones, in particular at high altitudes. Given the expected increase in anthropogenic
activities in these areas in combination with climate change, it is strongly recommended to increase
the number of high-altitude ozone monitoring sites in these regions.
8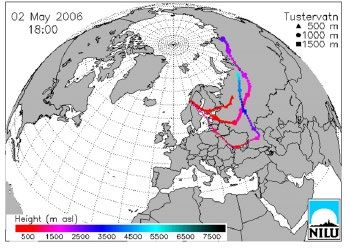
Report C 586 The vulnerability of northern European vegetation to ozone damage in a changing climate –
An assessment based on current knowledge
Sammanfattning
I denna rapport utvärderas riskerna för att växtligheten vid långt nordliga breddgrader i de
nordiska länderna påverkas negativt av marknära ozon, idag och i framtiden. Fokus ligger på
arktisk, alpin och nordlig boreal växtlighet.
Målsättningarna med de analyser som redovisas i denna rapport var:
• Att inventera och utvärdera nuvarande kunskap vad gäller riskerna för en negativ
påverkan av marknära ozon på växtligheten vid nordliga breddgrader, nu och i framtiden.
• Att ge förslag vad gäller eventuella ytterligare åtgärder för att minska utsläppen av
ozonbildande ämnen, som är motiverade utifrån att skydda den nordliga växtligheten mot
ozonskador.
• Att ge förslag på ytterligare kunskap som behövs vad gäller bedömningar av
ozonkänsligheten hos nordlig växtlighet.
• Att ge förslag på hur riskerna kring ozonpåverkan bör övervakas i framtiden.
Bedömningarna baseras på nuvarande kunskap vad gäller koncentrationerna av ozon i luften samt
i vilken utsträckning ozon tas upp till växternas blad och barr. I rapporten sammanfattas pågående
miljöförändringar vid nordliga breddgrader. Metodiken kring hur ozonexponeringen hos den
nordliga växtligheten bör beräknas diskuteras. Förändringar av ozonkoncentrationerna i luften och
dess orsaker sammanfattas. Hur egenskaperna hos den nordliga växtligheten kan tänkas påverka
känsligheten för ozonpåverkan utvärderas. Kunskaper från experimentella studier med särskild
inriktning på nordlig växtlighet sammanfattas.
Ozonkoncentrationerna i dessa områden påverkas av såväl det nordliga geografiska läget som höjd
över havet. Ozonkoncentrationerna ökar med ökad höjd över havet, och skillnaderna i ozonhalter
mellan dag och natt minskar på hög höjd. Dagsljus dygnet runt medför potentiellt att bladens
klyvöppningar kan stå öppna en stor del av dygnet och därmed även att upptaget av ozon till
bladen kan pågå en större del av dygnet, jämfört med vad som är fallet vid sydligare latituder.
Särskilt bör beaktas att det vid nordliga breddgrader förekommer höga – och ökande – ozonhalter
på våren och att de högsta ozonhalterna förskjuts till allt tidigare datum på året. Samtidigt medför
klimatförändringarna att växtsäsongen i dessa områden startar allt tidigare på året. Ett ökande
överlapp i tiden mellan höga ozonhalter och en tidigare start på växtsäsongen kan medföra att
riskerna för ozonpåverkan på den nordliga växtligheten ökar över tid.
Norr om polcirkeln är det under sommarmånaderna ljust, och ozonhalterna på hög höjd är höga,
dygnet runt. Bladens klyvöppningar öppnar i ljus, vilket gör att ozon potentiellt kan tas upp till
bladen dygnet runt. Det är därför möjligt att det vid en viss halt i luften är en större andel av ozon
som tas upp till bladens inre och därmed kan skada växternas metabolism och tillväxt. Dock visade
beräkningar baserade på ljusmätningar vid olika breddgrader i Norge att detta sannolikt inte är
fallet. Det ökade ozonupptaget som beräknades för tidiga morgnar och sena kvällar
kompenserades med ett minskat ozonupptag mitt på dagen. Detta berodde på att solen mitt på
dagen står lägre vid nordliga breddgrader, vilket resulterar i lägre ljusintensiteter och ett lägre
ozonupptag mitt på dagen, jämfört med vid sydligare breddgrader.
Observationer av tidpunkten för bladsprickning, mätningar av ekosystemens upptag av koldioxid
samt beräkningar baserade på meteorologiska observationer, pekar på att starten för växtsäsongen
vid nordliga breddgrader har förändrats och inträffar allt tidigare på året. Detta kan förväntas
9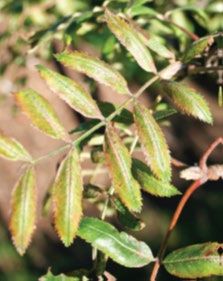
Report C 586 The vulnerability of northern European vegetation to ozone damage in a changing climate –
An assessment based on current knowledge
fortsätta de närmaste åren i takt med den fortsatta förändringen av klimatet. Vid nordliga
breddgrader förekommer de högsta ozonhalterna under våren, och halterna blir allt högre och
inträffar allt tidigare på året. Det är i nuläget osäkert om överlappet mellan dessa båda processer
kommer att öka i framtiden. Detta behöver utredas vidare.
Övergripande, baserat på den kunskap som sammanställts i rapporten, kan följande slutsatser dras
avseende riskerna för en ökad påverkan från marknära ozon vad gäller växtligheten vid nordliga
breddgrader:
• Det kvarstår betydande osäkerheter vad gäller i vilken utsträckning som nordlig växtlighet
påverkas negativt av ozon nära marken.
• Baserat på nuvarande kunskap har vi inte funnit tillräckliga argument för att dra slutsatsen
att de förväntade förändringarna vad gäller koncentrationer av ozon i luften, i
kombination med ett förändrat klimat, kommer att medföra en större påverkan på
växtligheten på nordliga breddgrader, jämfört med växtligheten i övriga Europa.
• Riskerna för betydande och bestående, negativ inverkan från nuvarande ozonexponering
av nordliga boreala skogar är sannolikt inte större, jämfört med boreo-nemorala och
nemorala skogar i södra delarna av de nordiska länderna
• Korta perioder med höga ozonhalter under vår och tidig sommar kan dock komma att
påverka växtligheten vid nordliga breddgrader i större utsträckning, om de höga
ozonhalterna sammanfaller tidsmässigt med en tidigare start på växtsäsongen.
Utifrån ovanstående slutsatser kan följande rekommendationer ges avseende åtgärdsstrategierna
på Europanivån vad gäller begränsningar av utsläpp av ozonbildande ämnen:
• Nuvarande kunskap tyder på att växtligheten vid nordliga breddgrader inte är mer
känsliga för ozonpåverkan jämfört med växtligheten i övriga delar av Europa. Därför kan
vi inte motivera ytterligare begränsningar av utsläppen av ozonbildande ämnen baserat
enbart på särskilda risker för denna nordliga växtlighet.
• Redan beslutade åtgärdsstrategier för att minska utsläppen av ozonbildande ämnen för att
minska påverkan på växtligheten i Europa som helhet, såväl som för hela norra halvklotet,
kommer sannolikt att vara tillräckliga även för att minska påverkan på växtligheten vid
nordliga breddgrader
Det finns viktiga, kvarvarande kunskapsluckor vad gäller påverkan av ozon på växtligheten vid
nordliga breddgrader. Våra slutsatser ovan baseras på viktiga, men begränsade, observationer. Det
saknas i stor utsträckning resultat från experimentella studier som är särskilt inriktade på de
förhållanden som råder vad gäller växtekosystem på hög höjd vid nordliga breddgrader. Vi
rekommenderar att man satsar på ytterligare experimentell forskning med en särskild inriktning
på att jämföra ozonkänsligheten hos olika växtslag med ursprung från hög höjd vid nordliga
breddgrader med motsvarande ozonkänslighet hos olika växtslag (arter, genotyper) med ursprung
från lågland vid mer sydliga breddgrader i de nordiska länderna.
En specifik forskningsfråga är om de kritiska belastningsnivåerna för ozonpåverkan på
växtligheten som används på Europanivå baserat på PODySPEC är korrekta, både vad gäller
beräkningsmetodik och utvärderingar av påverkan. I synnerhet är kunskapen bristfällig vad gäller
i vilken utsträckning klyvöppningarna står öppna nattetid, vilket i sin tur medger upptag av ozon
till bladen nattetid. Detta kräver gemensam, samordnad forskning med såväl modellerare som
mätinriktade forskare.
10Report C 586 The vulnerability of northern European vegetation to ozone damage in a changing climate –
An assessment based on current knowledge
Ytterligare frågor som behöver besvaras hänger ihop med den framtida samhällsutvecklingen vid
nordliga latituder – till exempel ökad förekomst av så kallad fackling vid utvinning av gas och olja,
utökad fartygstrafik samt en ökad turism – hur kommer detta att påverka den framtida
utvecklingen vad gäller förekomsten av ozon nära marken vid nordliga breddgrader? Är
nuvarande framtidsscenarier vad gäller utsläppen av ozonbildande ämnen korrekta?
I ljuset av framtida klimatförändringar, kommer varma och torra somrar, som den 2018, att bli
vanligare och kommer det att ha betydelse för hur ozonet påverkar den nordliga växtligheten?
Det finns i nuläget relativt få mätplatser för ozonhalter i de arktiska och alpina växtzonerna, i
synnerhet vad gäller mätningar på hög höjd. Mot bakgrund av ökade antropogena aktiviteter i
dessa områden rekommenderar vi att antalet mätplatser för ozon i dessa områden utökas.
11Report C 586 The vulnerability of northern European vegetation to ozone damage in a changing climate –
An assessment based on current knowledge
1 Introduction
Tropospheric ozone is a photochemical pollutant produced mainly from the precursors nitrogen
oxides (NOx), volatile organic compounds and carbon monoxide, under the influence of solar
radiation. Ozone has negative effects on human health (WHO, 2006) as well as on the yields of
crops and forests and it may affect semi-natural vegetation (Royal Society, 2008). In addition, it is
an important greenhouse gas (IPCC, 2013).
Observations as well as modelling studies show a decrease in the level and frequencies of high
ozone concentration peaks in large parts of Europe (e.g. Karlsson et al., 2017). Furthermore, there is
evidence that northern hemispheric background ozone concentrations have increased until about
2010 (Parrish et al., 2012; Monks et al., 2015; Derwent et al., 2018; Wespes et al., 2018). The
minimum daytime ozone concentrations have increased in northern Europe during 1990–2015
(Klingberg et al., 2019), and hence the ozone exposure of the vegetation has become more chronic,
with smaller variations during the course of the day as well as between days. Moreover,
measurements of ozone show an annual variation, with a distinct maximum during spring in the
Northern Hemisphere mid-latitudes (Monks, 2000; Vingarzan, 2004). This is particularly
pronounced in the far north of Europe (Klingberg et al., 2009; 2019), with a shift over time of the
spring maximum to earlier dates in the year (Andersson et al., 2017).
Presently, the vegetation growing season largely starts after the ozone spring maximum in
northernmost Europe, but studies have shown an earlier onset of spring and a lengthening of the
growing season at high latitudes (Menzel et al., 2006; Karlsson et al., 2007). An increasing overlap
between the spring ozone concentration maximum and the growing season could lead to an
increased risk of ozone impacts on vegetation in this region (Karlsson et al., 2007; Klingberg et al.,
2009). Finally, increasing human activities at northern latitudes, e.g. increased shipping in the
Arctic, has the potential to increase regional emissions of ozone precursors and hence increase
ozone formation in the north (Tuovinen et al., 2013).
Thus, it is important and timely to assess the potential vulnerability of northern vegetation to
ozone damage. This review focuses mainly on the impacts of ground level ozone on the vegetation
in the far northern European arctic, alpine and northern boreal vegetation zones, according to
Hagen et al. (2013). These types of vegetation cover large parts of inland northern Fennoscandia.
The environmental conditions in these regions are determined by the combination of high latitudes
and high altitudes. The vegetation in Denmark and on Iceland is not considered in this assessment.
Results from environmental monitoring, as well as other results, from a number of different sites in
Fennoscandia are used in this report. The geographical positions as well as the altitudes of these
sites are shown in Figure 1 and Table 1.
The aims of this report were:
• To assess the current state of knowledge regarding the potential vulnerability of far
northern vegetation to ozone damage, today and in the future
• To provide advice for policy implications regarding necessary ozone precursor emission
abatement
• To provide advice for future research and monitoring of ozone impacts on the vegetation
at far northern latitudes
12Report C 586 The vulnerability of northern European vegetation to ozone damage in a changing climate –
An assessment based on current knowledge
Figure 1. A map showing the positions for the different sites that are referred to in this report. The light
blue colour indicates past and present EBAS/EMEP ozone monitoring stations, measurement campaigns
including ozone observations are marked grey, while all remaining sites are coloured in black.
13Report C 586 The vulnerability of northern European vegetation to ozone damage in a changing climate –
An assessment based on current knowledge
Table 1. Geographical positions and altitudes for the different sites that are referred to in this report.
ID Name Latitude Longitude Altitude
[m asl]
1 Råö 57°23'N 11°55'E 5
2 Hønefoss 60°08'N 10°15'E 126
3 Åreskutan 63°24'N 13°06'E 1 250
4 Bredkälen 63°51'N 15°20'E 404
5 Flakaliden 64°07'N 19°27'E 310
6 Rosinedalsheden 64°10'N 19°45'E -
7 Vindeln 64°15'N 19°46'E 225
8 Tustervatn 65°50'N 13°55'E 439
9 Myrberg 66°03'N 20°38'E 220
10 Sodankylä 67°21'N 26°38'E 179
11 Nikkaluokta 67°51'N 19°01'E 465
12 Esrange 67°53'N 21°04'E 475
13 Pallas 68°00'N 24°09'E 565
Sammaltunturi
14 Abisko 68°21'N 19°3'E 385
15 Palovaara 68°13'N 22°53'E 310
16 Kilpisjärvi station 69°03'N 20°50'E 566
17 Svanvik/Pasvik 69°27’N 30°02'E 30
18 Karasjok 69°28'N 25°13'E 333
19 Kevo 69°45’N 27°01'E 100
2 Ongoing environmental changes
affecting northern latitude
ecosystems
This chapter contains a general description of the environmental changes, in addition to ozone, that
can affect vegetation and potentially modify its responses to ozone at northern latitudes, such as
climate change, air quality change, deposition of nutrient compounds, arctic greening and arctic
browning. In this context, it is important to stress that the vegetation at far northern mountain
areas is far from pristine in character (Kullman, 2016). It has been under human influence for more
than ten thousand years and to a large extent used as pasture ground for reindeer and livestock as
well as for forest management. The ecosystem recovery after human disturbance is very slow at far
northern latitudes (Becker and Pollard, 2016.)
2.1 Changes in climate
The global mean temperature has increased by approximately 0.8 °C since the late 19th century,
while the Arctic has warmed by 2 ° to 3 °C during the same time period (Post et al., 2019). To map
climate trends in Fennoscandia we explored the gridded temperature and precipitation dataset for
Fennoscandia (NGDC, Tveito and Lussana, 2018), with a high spatial resolution, 1 km. The dataset
14Report C 586 The vulnerability of northern European vegetation to ozone damage in a changing climate –
An assessment based on current knowledge
is an extension of the operational gridded datasets (called “Se Norge”) produced by MET Norway
for more than a decade (Lussana et al., 2018a; 2018b). The dataset is based on station observations
from Fennoscandia, Russia, the Baltic states, Poland and Germany, through Bayesian Optimal
Interpolation. It is openly accessible (http://thredds.met.no/thredds/catalog/ngcd/catalog.html).
A.
B.
Figure 2. Trends during 1971-2019, in A, temperatures (oC*yr-1); B, Precipitation (mm/month*yr-1), derived
from the NGCD dataset (Tveito and Lussana, 2018). Trends are shown for May-August averages. Plots by
courtesy of Hui Tang.
15Report C 586 The vulnerability of northern European vegetation to ozone damage in a changing climate –
An assessment based on current knowledge
Figure 2 shows changes in temperature and precipitation during the period 1971-2019, for May-
August, the bulk of the growing season. There is a unanimous warming in all Fennoscandia. The
warming is stronger toward the north, in agreement with the global picture. Trends in
precipitation follow a similar pattern, with unanimous increase in the same months. The strongest
absolute increase in precipitation is on the west coast of Southern Norway, which also has the
highest precipitation amounts. We have also analysed trends of total surface solar radiation from
the COSMO-REA6 reanalysis (https://reanalysis.meteo.uni-bonn.de/?COSMO-REA6), based on the
NWP model COSMO (Russo et al., 2019). Trends are quite scattered across Fennoscandia, although
mostly negative, indicating a somewhat increased cloud cover in much of Fennoscandia (not
shown). However, global radiation in Sweden has increased since 1983 based on homogenized
data from the Swedish solar radiation network, see https://www.smhi.se/klimat/klimatet-da-och-
nu/klimatindikatorer/stralning-1.17841.
Climate extremes may be just as important for ozone and vegetation as mean climate. In the recent
decades, Europe has experienced several heat waves, known to impose stress to trees and plants,
notably 2003, 2010, 2018 and 2019, indicating an increase in frequency over earlier periods (Russo
et al., 2015; Dirmeyer et al., 2020). The heatwave in 2018 was particularly pronounced in
Fennoscandia, with monthly mean temperatures 3–6 degrees warmer in May and July compared to
the 1981–2010 period (Skaland et al., 2019; Sagen, 2020). The maximum temperatures were even
more affected, with 4–7 degrees above normal in most of Fennoscandia in the same two months
(Dirmeyer et al., 2020). At the same time, precipitation was lower than normal in most
Fennoscandia, with the exception of the northernmost area which had normal or slightly more
precipitation than normal. As pointed out by Johansson et al. (2020), warm and dry summer
conditions normally promote higher ozone and larger risk of ecosystem effects. Climate projections
suggest a positive trend for heat waves, including in Europe (Seneviratne et al., 2006; Lau and
Nath, 2014; Wehner et al., 2018). The IPCC Special Report on Extremes (IPCC-SREX) estimated that
the hot day 20-year return period will be reduced to between 5 and 10 days in most climate
scenarios by the end of this century in Northern Europe. (Seneviratne et al., 2012).
An important effect of climate change in Fennoscandia is migration of vegetation. The tree line,
defined as the elevation above which trees taller than 2 m do not occur, is a good indicator for
monitoring the biological impact of climate change and variability (Kullman, 2017). As a
consequence of increased air temperatures over the past 100 years, the tree lines of all the major
species in the alpine region, i.e., mountain birch, Norway spruce and Scots pine, have shifted
upslope in close accordance with the temperature rise (Kullman, 2017). Also, latitudinal northward
shifts for birch and Scots pine have occurred (Hofgaard et al., 2013). The average northward
advances of the birch and pine forest lines for Finnmark county in the period 1914 and 2009 were
156 and 71 m per year, respectively.
Air temperatures as well as the amounts of precipitation have increased during the summer
months in Fennoscandia over the time period 1971–2019, while trends in amounts of solar
radiation are more variable and uncertain. Extreme events, like the hot and dry summer 2018 in
Fennoscandia, are expected to occur more frequently as a consequence of global warming.
The tree lines of all the major tree species have shifted upslope, as well as shifted northward in
latitude, in close accord with temperature rise.
16Report C 586 The vulnerability of northern European vegetation to ozone damage in a changing climate –
An assessment based on current knowledge
2.2 Deposition of nitrogen
Arctic ecosystems are nutrient limited and exhibit positive responses to nitrogen (N) enrichment,
in particular in combination with phosphorous deposition (Street et al., 2015). Moreover, N
addition rates at current critical loads strongly increase the grassland yield (Volk et al., 2014). The
suggested critical loads, i.e. the quantitative estimate of an exposure to pollutants below which
significant harmful effects on specified sensitive elements of the environment do not occur
according to present knowledge, for impacts of nitrogen deposition of boreal coniferous forests in
Sweden is 5 kg N ha-1 yr-1, for deciduous forests 10 kg N ha-1 yr-1 and for mountain areas
3 kg N ha-1 yr-1 (Moldan, 2011). Finnish studies suggest a critical load of 3–4 kg N ha-1 yr-1 for boreal
conifer forests based on N saturation of bryophytes (Salemaa et al., 2020) and turn off of N2 fixation
by cyanobacteria associated with bryophytes (Salemaa et al., 2019). A critical load has been
suggested to protect the vegetation at high altitudes in the Rocky Mountains in the USA of 3 kg N
ha-1 yr-1 (Bowman et al., 2006). Critical loads for N impact on vegetation in Alaska have been
suggested to be even lower, 1–3 kg N ha-1 yr-1 (Pardo et al., 2011).
The current N deposition to coniferous forests in northern Sweden is in the order of 1–2 kg N ha-1
yr-1 (Karlsson et al., 2019; Andersson et al., 2018; Simpson et al., 2014). Estimates from a reanalysis
(measurements and modelling combined) show that N deposition to coniferous and deciduous
forests is slightly higher than deposition to low vegetation such as alpine areas, including
meadows and wetlands. The deposition to ecosystems in northern Sweden has decreased by ca
30% from the 1980s until today (Table 2), mainly as a result of a decrease in the N emissions in
Europe. However, the N deposition in the southern parts of the Scandes Mountains is still
exceeding 3 kg N ha-1 yr-1, the critical load suggested for Swedish mountain areas, and in some
Swedish forests also the critical load for boreal coniferous forests (Andersson et al., 2018).
Table 2. Average deposition of reactive nitrogen to ecosystems in northern Sweden in two time periods,
and corresponding change in deposition between the periods, as estimated by the MATCH Sweden system
reanalysis (Andersson et al., 2017; 2018). Values extracted from Andersson et al. (2018).
1983–1992 mean 2004–2013 mean Change from 1983–
deposition [kg N ha-1 deposition [kg N ha-1 1992 until 2004–2013
yr-1] yr-1]
Coniferous forests 2.7 1.9 -29%
Deciduous forests 2.7 1.9 -30%
Pasture/meadow/arable 2.5 1.7 -30%
land
Wetland 2.5 1.7 -30%
Water 2.2 1.6 -30%
The past decrease in reactive N deposition will not necessarily continue until the middle of the 21st
century. While nitrogen oxides (NOx) emissions have decreased strongly in Europe, ammonia
emissions have not decreased as much, and may even increase in the future resulting in possible
increases in N deposition in the future in northern Fennoscandia (Simpson et al., 2014; Engardt et
17Report C 586 The vulnerability of northern European vegetation to ozone damage in a changing climate –
An assessment based on current knowledge
al., 2017). Over the whole 20th century, deposition of reactive N to Sweden peaked during the mid-
1980s (Ferm et al., 2019). Although the reductions in N emissions have been substantial over the
last decades, the deposition of reactive N today is still 2–3 times higher than in the year 1900 in
Europe (Engardt et al., 2017).
The nitrogen deposition to vegetation in northern Sweden is in the order of 1–2 kg N ha-1 yr-1
and has declined approximately 30 % since the 1980s.
2.3 Artic greening and browning
One of the most important climatic and environmental change in the Boreal and Arctic regions has
been the increase in biomass and productivity of tundra vegetation and the northernmost forests, a
phenomenon commonly termed “the greening of the Arctic” (Myneni et al., 1997; Myers-Smith et
al., 2020). The productivity, however, have not been uniform across the circumpolar Arctic-Boreal
regions and there has been substantial inter-annual variability (Bhatt et al., 2017; Park et al., 2016).
This variability arises from a web of interactions linking the vegetation with abiotic and biotic
processes (Duncan et al., 2019; Myers-Smith et al., 2020).
An increasing number of northern regions currently show declining productivity (browning). Such
trends are evident over the circumpolar-boreal area, and some of the factors assumed to contribute
to these declines include recent reductions in summer moisture or moisture stress (Verbyla, 2015),
increased frequency of wild fires (Chu et al., 2016), forest insect outbreaks (Bjerke et al., 2014),
increasing plant stress from winter warming events (Treharne et al., 2018), fungal infestations and
moose damage on young pine forests in the Nordic region (Normark, 2019) and spring freeze
damage after bud swelling (Chamberlain et al., 2019). Episodes of O3 exposure might have
contributed to local browning of different species like rowan (Sorbus aucuparia), birch (Betula.
pubescens) and Scots pine (Pinus sylvestris) in combination with deposition of nitrogen like the
events up-north in Fennoscandia in 2006 (Tømmervik pers. observations 2006; Manninen et al.,
2009a; Karlsson et al., 2013). Occasional frost nights after budburst during the spring (May-June) of
2006 (annual reports: www.met.no; www.smhi.se) may also have reinforced the sensitivity and
hence the injury (Manninen et al., 2009).
3 Changes in ozone exposure
phenology
The time of year when the vegetation is physiologically active is called the growing season. The
start of the growing season, SGS, is used as the time when the vegetation in boreal and temperate
climate zones starts its activities after the winter dormancy period. Ozone does not generally affect
the vegetation outside the growing season, i.e. when evergreen vegetation is in a stage of winter
dormancy or when deciduous vegetation does not have leaves. Each plant species has its own
specific growing season, due to genetic adaptation in combination with the meteorological
conditions. However, there are ways to describe the growing season accurately for a larger number
of important species.
Growing season indices can be defined through daily mean temperature, i.e. the thermal growing
season. The start of the thermal growing season has been defined as the first day of the year when
18Report C 586 The vulnerability of northern European vegetation to ozone damage in a changing climate –
An assessment based on current knowledge
the daily mean temperature has exceeded 5˚C four (Sjökvist et al., 2015) or five (IMPACT2C web
atlas; https://www.atlas.impact2c.eu/en/) days in a row, while the end is the last day of the year in
the last four or five day period with the same requirement, and the thermal growing season length
is the number of days in between these. The four-day thermal index is for example used by the
Swedish Meteorological and Hydrological Institute (SMHI) in analysing changes in growing
season from observed temperature as well as in historical and future climate scenarios and
published on the SMHI web page. There has been an earlier start of the thermal growing season at
northern latitudes (Karlsson et al., 2007; BACC 2015, Figure 3). Averaged over northern Sweden
the thermal growth season start has shifted to approximately 10 days earlier from the mid-1990s
until the late 2000s (Figure 3). There is a trend over the period 1994–2009 to an earlier thermal SGS
(-1.13 days year-1, statistically significant).
1961–1990 1991-2013
Figure 3. The estimated start of the thermal growing season calculated as when the 24h mean
temperature exceeds 5 °C four days in a row, based on spatially interpolated observed temperatures in
the periods 1961–1990 and 1991–2013. Extracted from the SMHI web site, http://www.smhi.se. Unit: Day
of year from 1st January.
The timing and trend in the SGS may however differ substantially between individual species as
compared to the thermal SGS. Species-specific methods to estimate the SGS (Karlsson et al., 2018b)
resulted in later SGS for European silver birch (Betula pendula) and earlier for Norway spruce (Picea
abies), compared to the thermal SGS (Figure 4). The SGS of birch and spruce has also shifted to
earlier in the year over time (significantly negative trend since 1994, -0.96 days year-1 and -0.98 days
year-1 respectively) in northern Sweden. The similar trend in the two species is likely a coincidence,
differences in the estimates of the start of the growing season using more advanced, species-
specific methods include that the thermal time is accumulated over different temperature
thresholds, for birch 5 °C and for spruce 0 °C (northern Sweden) or 1.5 °C (south Sweden)
(Karlsson et al., 2018a,b; Langner et al., 2019), which can lead to different trends when analysing
other time windows. This is also a cause to the difference in SGS between the species.
19Report C 586 The vulnerability of northern European vegetation to ozone damage in a changing climate –
An assessment based on current knowledge
Figure 4. The start of the growing season averaged over northern Sweden (Norrland), calculated using
three methods. The estimated start of the 4-day thermal growing season (middle green line). The start of
the growing season for birch (top line, fair green) and spruce (bottom line, dark green) modelled by more
advanced, species-specific methods (Karlsson et al., 2018b; Langner et al., 2019). Previously unpublished
data, C. Andersson. All values are based on a meteorological reanalysis, combining long-term high-quality
observations and modelling data (EURO4M; Dahlgren et al., 2016).
The timing of the spring bud burst of downy birch (Betula pubescens) observed in the field in the
northern half of Finland changed annually by 0.5 day to earlier dates of the year over the time
period 1997–2013 (Poikolainen et al., 2016). The timing of birch leaf colouring and leaf fall in
Finland remained almost constant in the southern boreal zones, whereas it changed to earlier dates
annually by 0.3 and 0.6 day in the middle boreal zone and by 0.6 and 0.4 day in the northern boreal
zone, respectively (Poikolainen et al., 2016). Hence, the duration of the growth period of downy
birch in Finland remained constant in all boreal zones over this 16-year period, although it was
shifted to earlier dates. Böttcher et al. (2016) reported 155 as an average DOY (Day-Of-Year) for
bud break of downy birch in 2001–2008 at the northernmost Finland. In other words, the buds
broke between late-May and mid-June at Kevo.
The start of the thermal growing season may vary by approximately one month between years
(Böttcher et al., 2016) thus affecting the cumulative ozone exposure of vegetation potentially more
markedly than the average shift towards earlier start of growing season. For example, the thermal
growing season started on 13 May 2018 vs. 13 June 2017 in the Kilpisjärvi biological station and 6
May 2016 vs. 6 June 2017 in the Kevo biological station, both sites in northernmost Finland
(https://ilmatieteenlaitos.fi/terminen-kasvukausi).
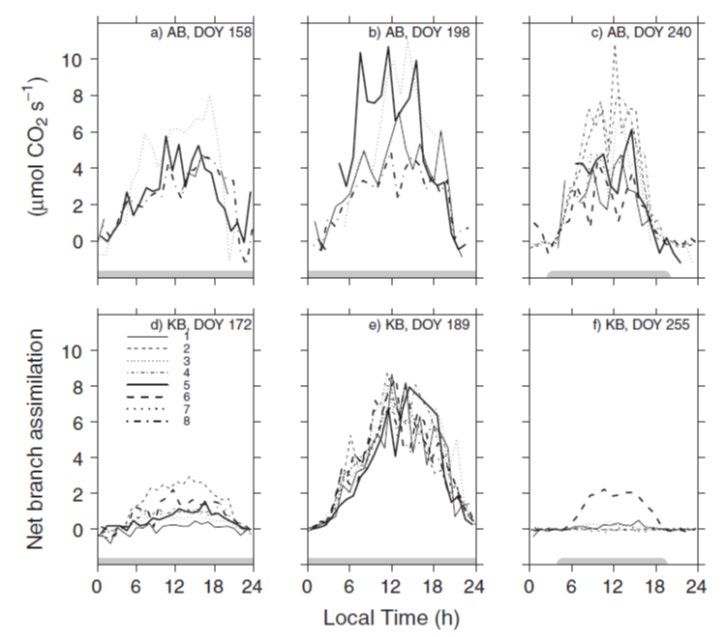
Wallin et al. (2013) measured gas-exchange of 40-year-old Norway spruce trees with branch
cuvettes in stands at Flakaliden in northern Sweden. Measurements of light-saturated
photosynthesis were made during spring recovery from dormancy during three years 2002–2004.
The recovery of gas-exchange from winter dormancy was non-linear over time and the first
recovery, up to 60% of summer maximum gas-exchange, occurred already in March, more than a
20Report C 586 The vulnerability of northern European vegetation to ozone damage in a changing climate –
An assessment based on current knowledge
month before the start of growing season calculated as when the 24-h mean temperatures exceeded
5 °C for five consecutive days.
Additional information about the start and end of the growing season comes from
micrometeorological measurements of the ecosystem exchange of CO2. The growing season of
evergreen conifers (defined from CO2 flux measurements during 2001–2010) was estimated to start
on average on DOY 123 (2001–2010) in Sodankylä in Finland Böttcher et al. (2016), and end DOY
267 (2008) and 248 (2009) in Flakaliden in Sweden (Kalliokoski et al., 2013).
Both data on budburst and data on ecosystem CO2 exchange as well as meteorological
observations show that there has been a development towards an earlier start of the growing
season during the year, with approximately 0.5–1 day per year. Thus, there is clear evidence for
an earlier start of the growing season, which is likely to continue.
4 Ozone concentrations at
European northern latitudes
4.1 Background ozone concentrations
Ozone concentrations in the northern parts of Fennoscandia are to a large extent determined by the
long-range transport of ozone from the surrounding regions. Available measurement data indicate
that the background concentration of ozone was increasing in Europe during the second half of the
20th century (e.g. Cooper et al., 2014 and references therein). However, the trend in tropospheric
ozone concentrations seem to have levelled off during the last decades and even started to decrease
in some regions. Trend analysis of measurements of ozone in Atlantic air from 1987–2017, at Mace
Head on the Irish west coast, (Derwent et al., 2018) has shown that the background ozone levels
were increasing with an average annual increase of 0.2 ppb year-1 but that the increase slowed
down during the time period and quadratic fits of the data imply that the ozone levels reached a
maximum at about 2007 and started to decrease after that. Negative trends from 2008 to 2017 have
also recently been reported for middle-low tropospheric ozone columns (from the surface to 300
hPa) for the Northern Hemisphere in the 40–75°N band covering Europe and North America,
especially during summer (Wespes et al., 2018). For a recent review of tropospheric ozone
distribution and trends on the global scale, see Gaudel et al. (2018).
Measured ozone concentrations at regional background sites in northern and central Fennoscandia
vary substantially between different locations. The year-to-year variability in daytime summer
half-year-mean concentrations is also relatively large, as illustrated in Figure 5. For the time period
1990-2016, 6-month (April–September) mean day-time ozone concentrations vary between ca 59
and 78 µg m-3 (1 µg m-3 equals 0.5 ppb) at five sites in mainland Norway, Finland and Sweden. The
highest concentrations were mostly observed during the time period 1994–2006. After this it seems
like the ozone levels during day time in summer have decreased somewhat in the region.
21Report C 586 The vulnerability of northern European vegetation to ozone damage in a changing climate –
An assessment based on current knowledge
Figure 5. Measured summer half-year (April–September) mean ozone concentrations during daytime (for
simplicity defined as 06:00–18:00 UTC) at five background sites in Northern/Central Norway, Sweden and
Finland. Based on hourly measurement data from EMEP (www.emep.int). Sites: NO15 Tustervatn, SE13
Esrange, SE05 Bredkälen, SE35 Vindeln, FI96 Pallas (Sammaltunturi). Further information on the sites can
be found in Table 1. Y axis unit: µg m-3 (1 µg m-3 equals 0.5 ppb).
At high altitudes (especially mountain tops, above the tree line) the ozone concentrations are
relatively similar during day- and nighttime. This is due to a larger influence of the free
tropospheric ozone at high-altitude sites and smaller loss of ozone due to surface deposition for
areas with little vegetation and/or long-lasting snow/ice cover. Ozone measurements near the top
of Åreskutan (1 250 m asl, 400m above the tree line) were performed during the late 1980s and
early 1990s (Bazhanov and Rodhe, 1996) and the hourly mean ozone concentrations during the
period April–September 1994 were essentially the same for day and night. For the same time
period, the ozone concentrations were very different at the boreal, low-altitude site Vindeln (225 m
asl), which had generally lower ozone concentration and a large difference between low night-time
concentrations and (relatively) high afternoon concentrations (Karlsson et al., 2007). Similar
differences are illustrated in Figure 6, which shows the mean diurnal variation of ozone
concentrations at Vindeln (low altitude forest site), Esrange (hilltop) and Pallas (hilltop above the
tree line), for the summer half-year 2016. All three sites have similar daily maximum ozone
concentrations but the concentrations during night-time are much lower at Vindeln.
The 24h mean concentrations can thus be much higher at high altitudes (especially on mountains
and hilltops, above the tree line) even if daytime concentrations are similar to low elevation sites at
the same latitudes. This means that plants growing at high-altitude sites may potentially be subject
to substantially larger ozone uptake than those found at lower altitudes.
22Report C 586 The vulnerability of northern European vegetation to ozone damage in a changing climate –
An assessment based on current knowledge
Figure 6. Mean hourly ozone concentrations calculated for the summer half-year (April–September) 2016 at
the EMEP monitoring sites SE35 Vindeln, SE13 Esrange and FI96 Pallas (Sammaltunturi). Unit: µg m-3.
Vindeln is positioned 225 m asl in the middle boreal zone in a forested area. The Esrange site is located 475
m asl on the top of a hill, approximately 170 m above the surrounding landscape. The Pallas
(Sammaltunturi) site is situated on top of a sub-arctic hill, ca. 100 m above the treeline; the vegetation on
the top is sparse, consisting mainly of low vascular plants, moss and lichen
(https://en.ilmatieteenlaitos.fi/ghg-measurement-sites#Pallas). More information about the sites can be
found in Table 1.
Ozone concentrations in the northern parts of Fennoscandia are determined by the background
concentration of ozone. The background concentration of ozone was increasing in Europe
during the second half of the 20th century, but seem to have levelled off and started to decrease
during the last decades.
At high altitudes the ozone concentrations are relatively similar during day- and night-time.
4.2 Seasonal variation of near surface ozone
at high northern latitudes
The ozone concentration in the troposphere shows an annual variation, which in some regions
exhibit a pronounced spring maximum. This spring ozone maximum is a Northern Hemispheric
phenomenon common across the mid-latitudes (Monks, 2000; Vingarzan, 2004). While
comparatively unpolluted sites have a pronounced spring ozone maximum and a summer
minimum, polluted continental sites are characterized by a broad late spring to summer maximum
(Jonson et al., 2006).
Klingberg et al. (2009) compared the seasonal variation in ozone concentrations at five sites in
northern Sweden with one site in southern Sweden (Figure 7). The northern sites exhibited a more
pronounced ozone spring maximum, which was higher and earlier (April maximum) compared to
23You can also read