Actions on Air Quality - Air Pollution Series A Global Summary of Policies and Programmes to Reduce Air Pollution - UNEP Document ...
←
→
Page content transcription
If your browser does not render page correctly, please read the page content below
Air Pollution Series
Actions on Air Quality

A Global Summary of Policies and
Programmes to Reduce Air Pollution
© 2021 United Nations Environment Programme

ISBN: 978-92-807-3880-3
Job number: DTI/2378/NA

This publication may be reproduced in whole or in part and in any form for educational or non-profit purposes without
special permission from the copyright holder, provided acknowledgement of the source is made. The United Nations
Environment Programme would appreciate receiving a copy of any publication that uses this publication as a source.

No use of this publication may be made for resale or for any other commercial purpose whatsoever without prior
permission in writing from the United Nations Environment Programme. Applications for such permission, with a
statement of the purpose and extent of the reproduction, should be addressed to the Director, Communication Division,
UNEP, P.O. Box 30552, Nairobi, 00100, Kenya.

Disclaimers

The designations employed and the presentation of the material in this publication do not imply the expression of any
opinion whatsoever on the part of the Secretariat of the United Nations concerning the legal status of any country,
territory, city or area or of its authorities, or concerning delimitation of its frontiers or boundaries. Moreover, the views
expressed do not necessarily represent the decision or the stated policy of the United Nations Environment Programme,
nor does citing of trade names or commercial processes constitute endorsement.

Links contained in the present publication are provided for the convenience of the reader and are correct at the time of
issue. The United Nations Environment Programme takes no responsibility for the continued accuracy of that information
or for the content of any external website.

Suggested citation: United Nations Environment Programme (2021). Actions on Air Quality: A Global Summary of Policies
and Programmes to Reduce Air Pollution. Nairobi.

© Maps, photos and illustrations as specified

Production
United Nations Environment Programme (UNEP)

https://www.unep.org

© Photo: Shutterstock

Layout: Jinita Shah, Publishing Section Nairobi                                                UNEP promotes
Publishing manager: Pouran Ghaffarpour (UNON Publishing Services Section)                  environmentally sound
                                                                                            practices globally and
                                                                                          in its own activities. Our
                                                                                     distribution policy aims to reduce
                                                                                          UNEP's carbon footprint.
Actions on
Air Quality
A Global summary
of policies and
programmes to
reduce air pollution

2                                                                            ACTIONS ON AIR QUALITY

Acknowledgements

This report is authored by the Pollution and Health Unit of the United Nations Environment Programme (UNEP).
Staff members involved in its production include Soraya Smaoun, Victor Nthusi, Maria Cristina Zucca,
Valentin Foltescu and Richard Miesen. The report was prepared with the assistance of Orbis Air, LLC including
Gary Kleiman and Susan Anenberg. The team expresses great appreciation to a number of internal UNEP
reviewers who provided comments on early drafts including Kakuko Nagatani-Yoshida, Maria Katherina Patdu,
Tomas Marques, Jordi Pon, Luisa Gonzalez, Hilary French, Iyngararasan Mylvakanam, Charles Sebukeera,
Sean Khan, Rob De Jong, Jane Akumu, Bert Fabian, Maria Socorro Manguiat, Pushpam Kumar, Atif Ikram
Butt, Monika MacDevette and Ligia Noronha. We also wish to thank a panel of external reviewers that included
Ernesto Sanchez-Triana of the World Bank, Sara Terry of the United States Environmental Protection Agency,
Beatriz Cardena of the World Resources Institute, Tirusha Thambiran of the Council for Scientific and Industrial
Research, South Africa, Sophie Gumy of the World Health Organization, Johan Kuylenstierna of the Stockholm
Environment Institute, George Mwaniki of the Patra Foundation, Kenya, Najat Saliba of the American University
of Beirut, Lebanon, Frank Murray of Murdoch University, Australia and Nguyen Thi Kim Oanh of the Asian
Institute of Technology. The team also wishes to thank all representatives of Member States that responded to
the survey, enabling this assessment.
ACTIONS ON AIR QUALITY
3
Table of Contents
Acknowledgements 2
List of abbreviations and acronyms 4
Executive summary 5
1. AIR QUALITY POLICY ACTIONS WORLDWIDE 13
A. Introduction 13
B. Trends in sectoral and non-sectoral air quality management actions 16
C. Objective and approach of the present report 17
2. GLOBAL AND REGIONAL STATUS OF AIR QUALITY POLICY 19
A. Status of ambient standards 19
B. Finance for comprehensive air quality management planning 22
C. Air quality monitoring and management: implementation approach 23
D. Non-financial barriers or obstacles to air quality action 24
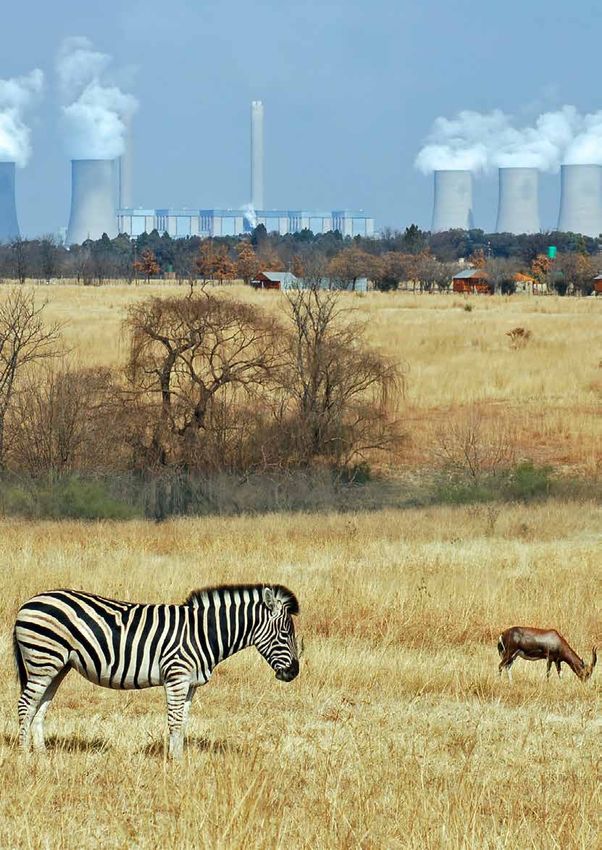
3. INDUSTRIAL EMISSIONS 27
4. ON-ROAD TRANSPORT 31
5. WASTE 37
6. RESIDENTIAL (HOUSEHOLD AIR POLLUTION) 41
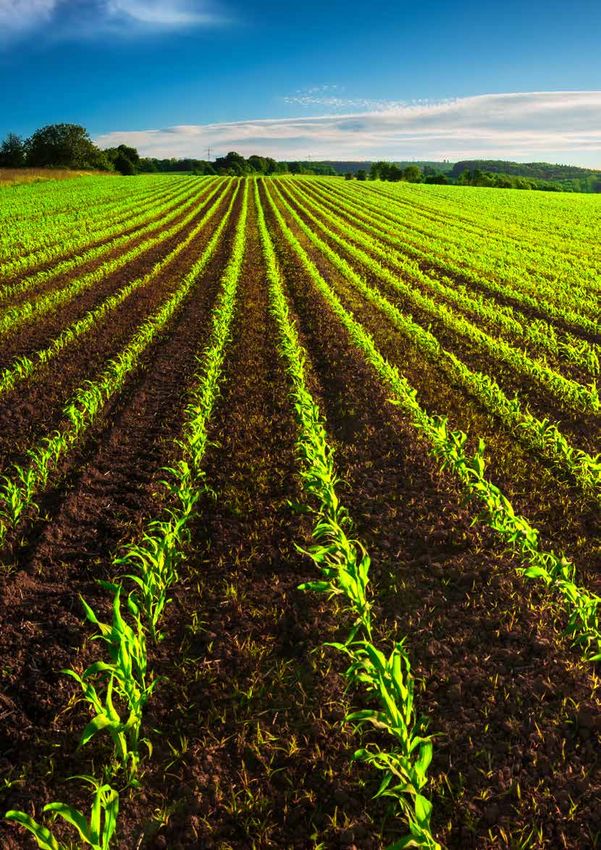
7. AGRICULTURE 45
8. GLOBAL SNAPSHOT 49
A. Global progress 49
B. Conclusion 50
REFERENCES 51
ANNEX A – METHODOLOGICAL NOTES 55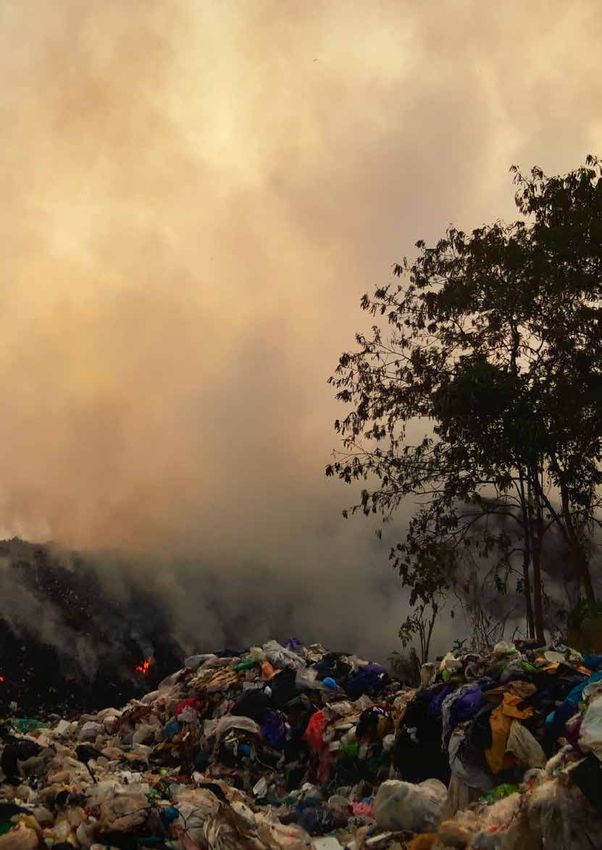
4                                                      ACTIONS ON AIR QUALITY

List of abbreviations
and acronyms
AAP      ambient air pollution               HAP     household air pollution

AAQS     ambient air quality standards       IHME    Institute for Health Metrics and
                                                     Evaluation
ALRI     acute lower respiratory infection
                                             LMICs   low- and middle-income countries
AQM      air quality management
                                             LPG     liquefied petroleum gas
ASEAN    Association of Southeast Asian
         Nations                             MECS    modern energy cooking services

CA       conservation agriculture            MMT     million metric tons

CCAC     Climate & Clean Air Coalition       NDC     nationally determined contribution

CLRTAP   Convention on Long-range Trans-     NOX     nitrogen oxides
         boundary Air Pollution
                                             OECD    Organisation for Economic
CO2      carbon dioxide                              Co-operation and Development

COPD     chronic obstructive pulmonary       PM2.5   fine particulate matter with an
         disease                                     aerodynamic diameter of less than
                                                     2.5 microns
DIMAQ    Data Integration Model for Air
         Quality                             PM10    fine particulate matter with an
                                                     aerodynamic diameter of less than
DPFs     diesel particulate filters                  10 microns
EECCA    Eastern Europe, the Caucasus and    PPP     purchasing power parity
         Central Asia
                                             SLCP    short-lived climate pollutant
ESMAP    Energy Sector Management
         Assistance Program (of the World    SO2     sulphur dioxide
         Bank Group)
                                             WB      World Bank
GBD      the Global Burden of Disease
         project                             WHO     World Health Organization

GDP      gross domestic product              UNEA    United Nations Environment
                                                     Assembly
GHG      greenhouse gas
                                             UNEP    United Nations Environment
                                                     Programme
ACTIONS ON AIR QUALITY
                                                                                                                5

Executive summary

Context                                                  In its aforementioned 2016 report, UNEP found
                                                         that countries had adopted a substantial number
In 2019, 92 per cent of the world’s population           of policies, standards and regulations to reduce air
experienced PM2.5 concentrations in excess of the        pollution. However, the report also revealed cross-
World Health Organization (WHO) guideline of 10          cutting challenges to addressing air pollution. These
µg/m³ (chapter 1A). Without policy interventions,        included: ineffective implementation and enforcement
exposure to PM2.5 would increase by 50 per cent by       of existing policies and regulations; limited
2030 (chapter 1A), severely compromising quality of      cooperation between national and city administration;
life and risking lives worldwide.                        the universal need for monitoring and assessment;
                                                         and the importance of behavioural change and
This report reviews countries’ policy actions with       public participation through awareness-raising and
regards to the mandate provided by United Nations        stakeholder involvement.
Environment Assembly (UNEA) resolution 3/8 on
Preventing and reducing air pollution to improve air     Status and trends
quality globally (chapter 1C). It builds on the United
Nations Environment Programme (UNEP) 2016                This 2021 report assesses actions in key sectors
report titled Actions on Air Quality (chapter 1C),       that contribute to air pollution, focusing on industrial
which provided an overview of actions undertaken         emissions, transportation, solid waste management,
by countries around the world, focusing on a set of      household air pollution and agriculture emissions.
measures that – if adopted – would significantly         It also provides an overview of non-sectoral air
improve air quality.                                     quality management actions, including air quality
                                                         frameworks, strategies, standards and monitoring.
This new report is based on data collected in 2020
through a detailed survey shared with countries,         Overall, there is progress towards adoption of
which was supplemented with relevant literature          key actions that can significantly improve air
documenting key actions being undertaken by              quality
governments around the world to improve air quality.
The report is complemented by regional reports           Figure ES.1 shows the progress towards adoption of
documenting more in-depth actions in key sectors, as     key actions that can significantly improve air quality.
well as regional trends and priorities.
6                                                                                                   ACTIONS ON AIR QUALITY

Figure ES.1 Progress towards adoption of key actions that can significantly improve
            air quality1

Where is the world in taking action to improve air quality?

                INDUSTRY                       Clean production
                                                                                    108                              76            11          104
                                                      incentives

                TRANSPORT                      Vehicle emission               71               29                    80           15
                                                      standards
                SOLID WASTE                      Waste burning          38               56                    75               26
                MANAGEMENT

                HOUSEHOLD                    Household energy                      95                           78              22
                AIR POLLUTION

                AGRICULTURE             Sustainable agriculture              58           24                     113
                                                                                                                                           2
                                           Monitoring networks               57          18    14                104
                AIR QUALITY
                MANAGEMENT
                                                  Air quality                54           38                     103
                                       management strategies

                AIR QUALITY                         Ambient air                         124                               69               2
                STANDARDS                     quality standards
                                                                   0                                                                 195

                                                                                          Number of countries
Source: UNEP survey data

Sectoral Measures

More countries have incentives or policies
promoting cleaner production, energy
efficiency and pollution abatement for
industries

In the industrial sector, the 2021 report indicates
growing uptake of policy incentives for cleaner
production and energy efficiency relative to the
baseline reference analysis of 2016. While some of
this progress may reflect a reduction in data gaps
relative to the baseline data, increases are noted in
some regions (Figure ES.2).                                              View to cityscape and Industrial Zone with Oil Refineries in
                                                                         Haifa, Israel. Photo credit: © Shutterstock/Max Zalevsky

1
    From the analysis of UNEP data, a set of key policy actions were identified that, if adopted, would significantly improve air quality. The
    figure indicates how many countries have adopted these policies (green), are on their way to adopting them (orange/yellow) or have yet
    to adopt or implement them (red). Grey indicates that no data were available.
ACTIONS ON AIR QUALITY
                                                                                                                             7

Figure ES.2 Countries with incentives or policies promoting cleaner production, energy
            efficiency and pollution abatement for industries

 Baseline                          87                                             83                    25
reference

    2020                                108                                               76                 11

            0                                                                                                     195

                Country has incentives/policies        Country does not have incentives/policies   No data

Source: UNEP survey data

More countries are meeting the Euro 4/IV                                More countries regulate open burning of solid
vehicle emission standard                                               waste, but it is still a widespread practice

Policies to reduce emissions from the on-road                           The number of countries that regulate open waste
transportation sector remain critical in countries                      burning has increased significantly since 2016,
(especially their urban areas) around the world.                        although 75 countries still do not have regulations in
The past five years have shown progress, with 18                        place. Ninety-four countries (43 more than in 2016)
additional countries adopting emission standards                        now regulate burning, but only 38 of these countries
equivalent to Euro 4/IV or higher, bringing the total                   have strict regulations in place. Despite the progress
to 71 countries. Twenty-nine countries have vehicle                     in this area since 2016, open burning is still practised
standards in place, but they are not yet up to the Euro                 in many countries, even those where regulations
4/IV standard (Figure ES.3).                                            exist (Figure ES.4). Survey data indicate that the
                                                                        governments of the 94 countries that regulate burning
UNEP tracks progress on tailpipe standards as well                      have taken actions ranging from urban or national
as fuel quality, which is a key aspect of successful                    waste management plans to waste management
implementation of vehicle emission standards.                           regulations and more advanced strategies, such
However, as the report highlights, there is still                       as landfill gas capture and improved collection,
significant progress to be made with regards to fuel                    separation and environmentally sound waste disposal
quality.                                                                methods.

Figure ES.3 Countries meeting Euro 4/IV vehicle emission standard

 Baseline
                          53                      30                              93                     19
reference

    2020                       71                          29                          80                    15

            0                                                                                                     195

                Euro 4 or Higher        Less than Euro 4        No standards        No data

Source: UNEP survey data
8                                                                                                      ACTIONS ON AIR QUALITY

Figure ES.4 Countries with solid waste burning regulations

 Baseline
                12           39                                        104                                    40
reference

    2020               38                        56                                      75                        26

            0                                                                                                            195

                 Burning of solid waste          Burning of solid            Burning of solid waste      No data
                 is strictly regulated           waste is regulated          is not regulated and is
                                                 but still practised         commonly practised
Source: UNEP survey data

More countries are adopting clean energy                                      There is limited evidence of incentives to
programmes for residential heating and cooking                                promote sustainable agricultural practices

In terms of household air pollution, the world has                            Fifty-eight countries reported having incentives in
seen increased availability of cleaner fuels and an                           place to promote sustainable agricultural practices
estimated global reduction in the burden of disease                           (Figure ES.6). Measures include alternatives to open
associated with residential heating and cooking                               burning of agricultural residues, improved livestock
sources since 2016. An additional 13 countries now                            manure management, and composting to reduce
have national programmes to promote clean energy in                           food waste. The survey found that among those
residential heating and cooking (Figure ES.5).                                countries with incentives for sustainable agricultural
                                                                              practices, nearly one quarter of respondents provide
Survey data show that governments are                                         alternatives to open burning of agricultural waste
implementing various measures in this sector, with                            and nearly one quarter support closed storage
the highest level of uptake for increased energy                              and improved livestock manure management.
efficiency in residential appliances and lighting,                            Approximately 20 per cent of respondents indicate
followed by improved access to green technologies                             using methane capture for energy use, while 18 per
for residential heating, the adoption of low-emission                         cent have measures to reduce food waste.
cooking stoves and fuels, and increased use of
liquefied petroleum gas (LPG).

Figure ES.5 Countries with national clean residential energy programmes

 Baseline
                                  82                                                77                         36
reference

    2020                                  95                                                78                      22

            0                                                                                                            195

                 Yes        No         No data

Source: UNEP survey data
ACTIONS ON AIR QUALITY
9
Figure ES.6 Countries with incentives to promote sustainable agriculture practices (such as
livestock manure management and use of organic fertilizers)
2020 58 24 113
0 195
Yes No No data
Source: UNEP survey data
Non-sectoral air quality management More than a quarter of countries have a national
actions air quality management strategy
Whereas action across the key sectors listed The survey responses to this question do not provide
above is likely to significantly reduce air pollution, a comprehensive picture of how many countries
sectoral measures need to be supported by have a dedicated national air quality management
enabling policy frameworks (including air quality strategy. The responses received indicate that three
standards) and air quality management capacities. key approaches are being used to implement air
The 2016 assessment found gaps in terms of the quality management strategies: most commonly
accompanying laws and regulations that would a national air quality action plan, followed by
facilitate the implementation and enforcement of sectoral plans, clean air acts and other approaches,
air pollution standards and strategies. In order to sometimes combined (Figure ES.7).
address these gaps and assess progress going
forward, the 2021 report introduces two key air quality A significant majority of countries have legal
management aspects into its analysis: (i) air quality instruments containing ambient air quality
management strategies, and (ii) air quality monitoring. standards
Further, the UNEP Regulating Air Quality report (2021)
provides information on the uptake of air quality In 2020, 124 countries (about two thirds) were found
standards in national legislation, which allows for a to have ambient air quality standards, compared
comparison with the UNEP 2016 report. with 107 countries in the 2016 report. More than one
fifth of countries are in the process of reviewing or
For the two new elements, i.e. air quality management updating those standards and nearly another fifth
strategies and air quality monitoring, it is not possible have plans to introduce standards in legislation in the
to measure progress made over the past five years. near future (Figure ES.8).
Figure ES.7 Countries with a national air quality management strategy/framework/plan of
action in place
2020 54 38 103
0 195
Yes No No data
Source: UNEP survey data10 ACTIONS ON AIR QUALITY
Figure ES.8 Countries with ambient air quality standards embedded within a legal
instrument
Baseline 107 79 9
reference
2020 124 69 2
0 195
Yes No No data
Source: UNEP survey data
Air quality monitoring is expanding through a The analysis quantifies the extent of uptake of
variety of approaches, but many countries still key measures by countries, but it does not take
lack reliable routine networks into account implementation or lack thereof.
This edition of the Actions on Air Quality report
Countries are increasingly establishing air quality nevertheless acknowledges the barriers in day-to-
monitoring networks, with most using a combination day implementation of air quality management
of mobile and stationary reference monitors, though programmes, including staff retention, capacity gaps,
some are reliant on low-cost sensors and others use and affordability and maintenance challenges of air
a hybrid of mobile and stationary reference monitors. quality monitoring equipment. Countries are also
The 34 countries without “continuous monitoring” facing larger, systemic challenges such as financing
and the 104 with no data represent existing data and gaps that can result in an inability to invest in data
capacity gaps which hinder global action on air quality analysis, and a lack of enforcement capacity when
(Figure ES.9). policies and actions are adopted.
Conclusions UNEP will continue to track efforts to improve air
quality. This report seeks to set benchmarks in
The findings of this report indicate that while assessing current and future progress in policy
progress can be observed across the sectors in action towards cleaner air. As such, it is subject to
adopting key policies and actions that are known continuous improvements in underlying data and
to reduce air pollution, significant gaps remain. methodology.
Figure ES.9 Countries with national ambient air quality monitoring networks
2
2020 57 18 14 104
0 195
Yes, continuous Yes, monitoring Yes, a monitoring No monitoring No data
monitoring at done periodically network exists but
multiple sites at a few sites is not operational
Source: UNEP survey dataACTIONS ON AIR QUALITY
11
Continuous tracking of progress in taking action to Agenda for Sustainable Development, international
improve air quality is important, as it helps inform and agreements, and other relevant frameworks for action,
promote accelerated action. It can be used to catalyse including the International Day of Clean Air for blue
support to address the identified capacity gaps at the skies and as part of global efforts and coalitions to
national, regional and global levels, including efforts promote integrated policies on air quality and climate.
undertaken in response to UNEA resolutions, the 2030
A waste picker is collecting reusable or rec
Photo credit: © Shutterstock/ MOHAMED ABDULRAHEEM12 ACTIONS ON AIR QUALITY
Photo credit: © Shutterstock/nmediaACTIONS ON AIR QUALITY
13
1. AIR QUALITY POLICY ACTIONS WORLDWIDE
A. Introduction home as a result of residential biomass burning
and kerosene use for cooking, heating and lighting.
The single greatest environmental risk factor for Women and children may be disproportionately
premature death globally is air pollution, which is also affected.
the fourth-highest risk factor for premature death
after high blood pressure, tobacco and diet. In 2019, The combined effects of ambient and household air
more than 92 per cent of the world’s population lived pollution leads to an estimated 7 million deaths each
in areas that exceeded the WHO guideline for healthy year (7.0 million, WHO 2018d; 6.7 million, HEI and
air (Health Effects Institute and Institute for Health IHME 2020), including half a million infants in their
Metrics and Evaluation 2020). In 2016, 94 per cent first month of life (HEI and IHME 2020).
of air pollution-related premature deaths occurred
in low- and middle-income countries (World Health These burden of disease calculations include stroke,
Organization [WHO] 2018d). heart attack, chronic obstructive pulmonary disease
(COPD), lung cancers, acute lower respiratory
Estimates of the scale of the impact vary due to infections (ALRI), type 2 diabetes mellitus, and the
the complexity in extrapolating health data across recently added associations with low birth weight
the globe, especially in regions where air quality and short gestation (Global Burden of Disease 2019
monitoring is inconsistent or non-existent (Ostro et Risk Factor Collaborators 2019). Left out of these
al. 2018). Current estimates are based on the World statistics are the serious health consequences that
Health Organization’s Data Integration Model for Air have been associated with air pollution in the scientific
Quality (DIMAQ) (WHO 2018a) and the Global Burden literature, but for which data and/or methods do not
of Disease (GBD) project, led by the Institute for Health yet exist in order to estimate attributable disease
Metrics and Evaluation (IHME).2 These data sources burdens on a global scale, or for which more research
estimate that more than 4 million premature deaths is needed to establish causal attribution in a rigorous
(approximately 4.2 million according to WHO 2018b and statistically robust way. For example, studies
or 4.1 million according to the Health Effects Institute have identified associations between air pollution
and Institute for Health Metrics and Evaluation [HEI and asthma (Khreis et al. 2017, Anenberg et al. 2018,
and IHME] 2020) are caused every year by ambient Achakulwisut et al. 2019), cognitive decline (Power
(outdoor) air pollution.3 et al. 2016, Peters 2018) and dementia in later life
(Carey et al. 2018), pregnancy loss (Ha et al. 2018,
In addition to this risk – as highlighted in chapter 6 of Kioumourtzoglou et al. 2019) and infant mortality
this report – an estimated 2 to 4 million premature (Heft-Neal et al. 2018). As the research continues
deaths (3.8 million according to WHO 2018c or to develop, and more of these health outcomes are
2.3 million according to HEI and IHME 2020) are incorporated into the GBD estimates, the air pollution-
attributable to household air pollution in or near the related disease burden is likely to change over time.
2
The current report will rely on both GBD and WHO data, noting that the relatively small differences arise due to methodological choices
of pollutant concentrations, baseline disease rates, and relative risk estimates. The fact that these two estimates are so similar is an
indication of confidence in the large magnitude of the burden.
3
The burden listed is due to ambient concentrations of fine particulate matter with a diameter of 2.5 micrometres or smaller (i.e. fine
particle pollution). This represents the vast majority (approximately 92 per cent) of the burden currently estimated for all air pollution.
Ground-level ozone contributes a significantly smaller burden (around 8 per cent). Other air pollutants contribute to the burden of
disease but are not assessed in global statistics that are readily available.14 ACTIONS ON AIR QUALITY
Figure 1. Annual global health cost of mortality and morbidity caused by exposure to
PM2.5 air pollution in 2016, represented as a percentage of GDP, by region for
2016
8.0%
7.0% 1.9%
6.0%
% equivalent of GDP
0.7%
5.0%
0.4%
0.5% 0.6%
4.0% 0.4%
0.2%
3.0%
5.4% 5.0%
2.0% 4.0%
3.2% 2.7%
2.6% 2.2%
1.0%
0.0%
SA EAP ECA MNA SSA LAC NA
Mortality Morbidity
Note: EAP = East Asia and Pacific; ECA = Europe and Central Asia; LAC = Latin America and the Caribbean; MNA = Middle East and North Africa;
NA = North America; SA = South Asia; SSA = Sub-Saharan Africa.
Source: Reproduced from World Bank 2020a
Note: EAP = East Asia and Pacific; ECA = Europe and Central Asia; LAC = Latin America and the Caribbean; MNA = Middle East and North Africa;
NA = North America; SA = South Asia; SSA = Sub-Saharan Africa.
In addition to its serious consequences for public Air pollution has large welfare costs to
health, air pollution has negative effects on welfare governments around the world
costs and economic activity. The annual global
welfare (non-market) costs of premature deaths Using an alternate methodology – not accounting
from outdoor air pollution, calculated using estimates for the welfare value that the public places on living
of the individual willingness-to-pay to reduce the healthy lives – and focusing only on the direct impact
risk of premature death, have been estimated at to financial flows associated with losses in worker
between USD 3 trillion (Organisation for Economic productivity and earned income as a result of air
Co-operation and Development [OECD] 2016) and pollution, the World Bank has developed an adjusted
USD 5.7 trillion (World Bank 2020a)4 in 2016. They are net savings metric (Lange, Wodon and Carey 2018)
projected to rise to between USD 18 trillion and 25 that measures the loss of actual GDP due to fine
trillion in 2060 (OECD 2016). particle air pollution (PM2.5) and shows serious
economic harm in the regions that can least afford it
The World Bank figure of USD 5.7 trillion is equivalent (Figure 2).
to 4.8 per cent of global gross domestic product
(GDP).5 By region, the cost in 2016 ranged from an
equivalent of 2.3 per cent of GDP in Latin America
and the Caribbean to 5.7 per cent in East Asia and the
Pacific and 7.3 per cent in South Asia (Figure 1).
4
The OECD methodology includes market and non-market effects of fine particles and ozone on health (mortality and morbidity) and
agriculture (reduced crop yield) based on 2013 baseline data in 2010 purchasing-power-parity (PPP)-adjusted USD (“international
dollars”, see next footnote). In contrast, the World Bank approach includes mortality and morbidity due to fine particle pollution
only. However, the World Bank methods are based on updated 2016 exposure-response functions from the GBD 2016, which show
quantitatively larger risk of health damage (mortality of 4.1 million) relative to 2013 (mortality of 2.9 million), and are expressed in 2011
PPP-adjusted USD. Both reports use a similar value of a statistical life (USD 3 million versus USD 3.8 million based on OECD member
states), with slightly different benefits transfer approaches.
5
Global health cost and GDP are stated in PPP-adjusted USD. GDP in PPP-adjusted USD allows for a comparison of the purchasing
power of GDP of different countries. Here, the welfare-related global health cost is expressed as a percentage of GDP only to provide a
convenient sense of relative scale.ACTIONS ON AIR QUALITY
15
Figure 2. Annual labour income losses due to air pollution, represented as a percentage
of GDP, by region for 2015
1.4
1.2
1.0
0.8
0.6
0.4
0.2
0.0
East Asia Europe and Latin America Middle East North America South Asia Sub-Saharan
and Pacific Central Asia and the and North Africa Africa
Caribbean
Total air pollution Ambient PM2.5 Household air pollution Ambient ozone
Note: GDP = gross domestic product; PM2.5 = = particulate matter with a diameter of less than 2.5 microns.
Source: Reprinted from Lange, Wodon and Carey 2018, Figure 9.7
Source: Data from IHME 2016.
Air pollution also
Note: GDP = gross has
domestic large
product; PM2.5direct
= particulatecosts toa diameter of lessofthanprogress
matter with 2.5 microns. being made by countries to adopt
governments around the world and implement key actions that can significantly
improve air quality, in time for UNEA-5 and thereafter,
Against these costs of inaction, the costs of action synchronized with the Global Environment Outlook
should be considered, which have been shown cycle.”
to be far less. Regional and global analyses have
shown action on air quality to be extremely cost- UNEP’s Actions on Air Quality report (UNEP 2016)
effective (United Nations Environment Programme provided an overview of actions undertaken by
[UNEP] 2018; Markandya et al. 2018), with benefits countries around the world, focusing on a set of
sometimes exceeding costs by a factor of 30 (United measures that, if adopted, would significantly
States Environmental Protection Agency [US EPA] improve air quality. Building on that report, UNEP has
2011). since developed this updated global assessment of
policy action using a detailed survey questionnaire
These statistics make the imperative for action clear. of countries. This is supplemented by a set of six
Recognizing the growing global threat of air pollution, regional reports (Africa, Asia and the Pacific, Europe,
the United Nations Environment Assembly (UNEA) Latin America and the Caribbean, North America and
adopted resolution 1/7 on Strengthening the role West Asia) documenting, in greater detail, the status
of the United Nations Environment Programme in of key actions being undertaken by governments in
promoting air quality in June 2014. The third session these regions to improve air quality. Annex A to this
of UNEA built on this commitment through resolution report provides methodological details of the survey
3/8 on Preventing and reducing air pollution to improve development and administration as well as the
air quality globally, which requested, in its paragraph approach taken to develop this global report and the
7(j) inter alia, that UNEP “undertake an assessment regional reports.16 ACTIONS ON AIR QUALITY
B. Trends in sectoral and non-
Box 1: Fiscal policy reform and pollution:
sectoral air quality management A focus on subsidies
actions
A recent focus of policy interest has been
This report provides an assessment of actions in the evaluation of government fiscal policies
key sectors that contribute to air pollution in most that may have been well-intended when
countries,6 including industrial emissions (chapter 3), implemented, but which nevertheless have
transportation (chapter 4), solid waste management a role in encouraging pollution, spanning all
(chapter 5), household air pollution (chapter 6) sectors. Motivated by Sustainable Development
and agriculture (chapter 7). Each of these chapters Goal (SDG) indicators that examine fossil fuel
begins with a box identifying the trends in policies and subsidies, many institutions – including UNEP
programmes that address each sector. (2019b), UNEP, OECD and the International
Institute for Sustainable Development (IISD)
Whereas action across the key sectors listed (2019) and the OECD (Elgouacem 2020) – have
above is likely to significantly reduce air pollution, looked at ways that fiscal policies can reduce
sectoral measures need to be supported by pollution and accelerate progress toward
enabling policy frameworks (including air quality cleaner technologies, including in the context
standards) and air quality management capacities. of fiscal recovery from the effects of COVID-19
The 2016 assessment found gaps in terms of the (International Monetary Fund [IMF] 2020).
accompanying laws and regulations that would
facilitate the implementation and enforcement of Often, these policies are complementary to
air pollution standards and strategies. In order to other sector-specific regulations or policies
address these gaps and assess progress going and can synergistically encourage behavior
forward, the 2021 report introduces two key air quality change and technology shift depending on the
management aspects in its analysis: (i) air quality elasticity of demand, availability of alternatives
management strategies, and (ii) air quality monitoring. and a given policy framework (UNEP 2019b).
Further, the UNEP Regulating Air Quality report (2021) While the most obvious examples include
provides information on the uptake of air quality reducing fossil fuel subsidies, each sector has
standards in national legislation, which allows for a an opportunity to examine fiscal policies that
comparison with the UNEP 2016 report. could incentivize energy-efficient industries,
electrify vehicle fleets, finance sanitary waste
For the two new elements (air quality management collection and disposal, or reduce fertilizer
strategies and air quality monitoring), it is not possible use. Aligning fiscal policy to support action to
to measure progress made over the past five years. improve air quality across all sectors can shift
consumer and business behavior towards
The survey responses to this question do not provide greater sustainability and cleaner air.
a comprehensive picture of how many countries have
a dedicated national air quality management strategy.
The responses received are examined in chapter 2. most commonly a national air quality action plan,
They indicate that three key approaches are being followed by sectoral plans, clean air acts and other
used to implement air quality management strategies: approaches, sometimes combined.
6
Wildfires are also a significant transient, intermittent source of air pollution in specific regions (such as California, Australia and Russia),
whereas forest fires and peatland fires are a more routine contribution to air pollution in the Asia and the Pacific region. This aspect is
explored in greater detail in the regional report.ACTIONS ON AIR QUALITY
17
In 2020, 124 countries (about two thirds) were found This report does not present a baseline assessment
to have ambient air quality standards, compared of air pollution conditions, emissions trends nor
with 107 countries in the 2016 report. More than one modelling of air pollution concentrations and impacts.
fifth of countries are in the process of reviewing or The reader is directed to UNEP’s comprehensive
updating those standards and nearly another fifth report Global Environment Outlook – GEO-6: Healthy
have plans to introduce standards in legislation in the Planet, Healthy People to find this information (UNEP
near future. 2019a).7
Countries are increasingly establishing air quality A survey that was shared with countries in 2020
monitoring networks, with most using a combination forms the basis for this report. To complement the
of mobile and stationary reference monitors, though survey data, which are somewhat limited by country
some are reliant on low-cost sensors and others use response, additional context is presented for each
a hybrid of mobile and stationary reference monitors. sector. This relies on a variety of global metrics and
The 34 countries without “continuous monitoring” sources that reinforce the findings of the survey data,
and the 104 with “no data” represent existing data providing additional insights and paving the way to
and capacity gaps which hinder global action on air build on the survey data in subsequent updates.
quality.
C. Objective and approach of the
present report
The objectives of this report are to provide an update
on trends in policy actions that countries have taken
since 2016 and to highlight some of the barriers and
challenges that states are facing in implementing
these measures. UNEP intends to update this report
at regular intervals, consistent with the mandate
under resolution 3/8. The next update is planned for
2024. UNEP is considering whether more frequent
reporting is useful and feasible. If resources are
available, it will undertake more regular tracking and
use an online data platform to help identify gaps and The pollution detector station of the Chief Inspector of
Environmental Protection, Warsaw, Poland, November 17, 2018 r.
needs for accelerated action towards cleaner air. Poland has some of the most polluted air in the European Union.
Photo credit: © Shutterstock/HAL-9000
7
The GEO-6 report goes beyond air quality (chapter 5), outlining the current state of the environment, illustrating possible future
environmental trends, analysing the effectiveness of policies, and identifying remaining knowledge and data gaps.18 ACTIONS ON AIR QUALITY
Photo credit: © Shutterstock/Nina UnruhACTIONS ON AIR QUALITY
19
2. GLOBAL AND REGIONAL STATUS OF AIR QUALITY POLICY
A. Status of ambient standards voluntarily reduce emissions (e.g. the 2019 United
Nations Clean Air Initiative, the UNEP International
Countries – along with their relevant stakeholder Declaration on Cleaner Production, the Global
organizations – have taken a wide variety of Methane Initiative, the Climate & Clean Air
governance approaches and employed various Coalition, BreatheLife)
policy instruments to help mitigate the impacts of air
pollution (UNEP 2019a). These include: While there are successful examples of each of these
approaches, the traditional approach to emissions
planning regimes, such as binding action plans control through technology standards (the command
and agreements to achieve standards or emission and control standards listed above) has been highly
ceilings through environmental assessments effective where regulatory authority and enforcement
(e.g. U.S. State Implementation Plans and capacity exist (UNEP 2019) and continues to serve
multi-state regional planning organizations, the as a primary policy tool. Especially in the area of
European Union’s Clean Air Policy Package, the household air pollution (chapter 6), public information
Convention on Long-range Transboundary Air campaigns have a larger role to play, given the need
Pollution (CLRTAP, see text box), the Association for greater awareness of the disproportional impact
of Southeast Asian Nations (ASEAN) Agreement on women and girls (see text box in chapter 6).
on Transboundary Haze Pollution)
“command and control” performance standards Since the last assessment, 17 more countries have
that require accountability frameworks for adopted legal instruments containing ambient air
tracking progress (e.g. the United States quality standards, thereby increasing the portion of
Environmental Protection Agency (US EPA) New the globe with this basic protection in place. Much
Source Performance Standards, the European of this progress was in Africa and Latin America, but
Union’s Industrial Emissions Directive 2010, the some Eastern European countries have also added a
Korean Emission Limit Values for point sources) standard for at least one pollutant (see Figure 3).
market interventions including taxes, fees, subsidy
reform or market-based permit allocations (e.g. UNEP recently completed a comprehensive
the European Emissions Trading System, the assessment of the legal status of all countries
US EPA Acid Rain Program, China’s new national ambient air quality standards (UNEP 2021), which
emissions trading scheme) found that approximately 64 per cent of the 194
public information, including product labelling, states (and the European Union) reviewed8 include
national monitoring programmes and air quality their ambient standards within a legal instrument.
forecasting, and citizen science initiatives (e.g. the The review also notes that more than one fifth of
US EPA ENERGY STAR labelling programme, the countries are in the process of reviewing or updating
World’s Air Pollution: Real-time Air Quality Index, those standards, while nearly another fifth have plans
OpenAQ), and to introduce standards in legislation in the near future
cooperative frameworks and partnerships (UNEP 2021).
between countries and across sectors to
8
That review included all United Nations Member States, plus the observer states of the Holy See and State of Palestine.20 ACTIONS ON AIR QUALITY Case study 1: Convention on Long-range Transboundary Air Pollution (CLRTAP) This 1979 convention was the first multilateral agreement to address transboundary air pollution. It created a regional framework to address environmental problems in the United Nations Economic Commission for Europe (UNECE) region related to transboundary air pollution and to better understand air pollution science. With 51 parties across the northern hemisphere at present, CLRTAP has contributed to a dramatic decline in air pollution emissions (particularly sulphur emissions) in the region, and economic growth and air pollution trends have been progressively decoupled. More than 40 years after it was introduced, the convention continues to adapt successfully. This includes through amendments that have strengthened many of the protocols that parties to the convention continue to ratify and implement. The convention’s solid scientific underpinning was important in terms of air pollution abatement. It was established by developing a common knowledge base, including scientific infrastructure aimed at joint monitoring and modelling programmes, which includes an extensive international network of scientists from various disciplines. By providing a platform for scientists and policymakers to exchange information, the convention has led to innovative approaches and created mutual trust and learning. A new coordinating group of the countries in the Eastern Europe, the Caucasus and Central Asia (EECCA region) has enhanced these countries’ joint efforts to ratify CLRTAP protocols. A capacity-building programme has resulted in notable progress in the EECCA countries’ involvement in the convention’s work, building on the long history of progress under CLRTAP. (Source: US Department of State, UNECE’s European Regional Report) Figure 3. Countries with national ambient air quality standards in 2020 Source: Reproduced from UNEP 2021
ACTIONS ON AIR QUALITY
                                                                                                                                21

Figure 4.       Legal incorporation of 2005 WHO air quality guidelines (AQGs) into national
                ambient air quality standards
100

 90

 80

 70

 60

 50

 40

 30

 20

 10

  0
          PM10              PM10               Ozone                No2                  No2           SO2              SO2
        20 µg/m3         50 µg/m3           100 µg/m3            40 µg/m3            200 µg/m3      20 µg/m3         20 µg/m3
       Annual mean      24 hour mean        8-hour mean         Annual mean          1 hour mean   24-hour mean    10-hour mean

       Yes       Legal standard is weaker        No legal standard          Data not available
                 than WHO guideline
Source: Reproduced from UNEP 2021

More than 95 per cent of countries with ambient                        be adopted in law than that guidelines for ozone –
air quality standards are regulating PM10, ozone,                      despite ozone’s devastating impact on both health
nitrogen oxides (NOx) and sulphur dioxide (SO2) and                    and ecosystems.
90 per cent are regulating PM2.5, which is the largest
contributor to the long-term public health burden from                 The results for PM2.5 are set out separately in
ambient air pollution. However, relatively few of these                Figure 5, since the incorporation of WHO guidelines
standards are as stringent as the WHO air quality                      for PM2.5 has been noted as being an issue of
guidelines (see Figure 4, reproduced from UNEP                         particular concern in air quality policy globally. Around
2021). Adoption of WHO guidelines varies by pollutant,                 9 per cent of countries have ambient air quality
with WHO guidelines for NO2 being more likely to                       standards for PM2.5 that meet WHO guidelines.

Figure 5.       Legal incorporation of WHO air quality guidelines (AQGs) for PM2.5 into national
                ambient air quality standards

                                                                     Legal standards meets
                                                                     or exceeds WHO AQGs
                                                                                             9%
                                    35%       No legal
                                              standards

                                                                                                          53%     Less stringent than
Yes    62%                                                                                                        WHO AQGs 53%

                                    3%

                                            Data notavailable

Source: Reproduced from UNEP 2021
22 ACTIONS ON AIR QUALITY
Many countries may benefit from setting standards development, source attribution and modelling, health
consistent with WHO interim targets and moving impact assessment, and decision-support analysis
progressively towards full compliance with WHO (e.g. cost-benefit or cost-effectiveness analysis)
guidelines over time. that examines the multiple benefits of emission
reductions. While a complete discussion of each
While progress towards establishing ambient air aspect of air quality management planning is beyond
pollution standards is encouraging, UNEP survey data the scope of this report, the recent survey undertaken
indicate that more than 20 per cent of respondents from by UNEP did include questions about air quality
Latin America and the Caribbean, Africa, and Asia and monitoring and air quality management, which are key
the Pacific do not yet have these standards in place. to understanding the magnitude of the challenge that
many countries face.
B. Finance for comprehensive air
quality management planning C. Air quality monitoring and
management: implementation
Even when standards are in place, there are practical approach
limitations on their enforcement, often as a result of
inadequate public funding for air quality management
planning efforts in municipal, state and national As noted in chapter 1, many countries have established
governments. According to Eurostat data, European air quality monitoring networks, with most using
countries – where enforcement programmes a combination of mobile and stationary reference
are relatively successful at curbing exceedances monitors, though some are reliant on low-cost sensors
of national standards – on average invest about and others use a hybrid of mobile and stationary
0.25–1.0 per cent of GDP in environmental reference monitors. Survey data suggest that increased
protection, including waste management and use of low-cost sensors and greater awareness of air
enforcement capacity (Figure 6). The lack of this pollution resulting from access to these sensors and
level of investment by some countries reflects the other data are also playing a role in increasing public
competing development priorities that they face. demand for enhanced global action on air quality.
Reframing air quality management efforts to consider Satellite observations are also increasingly used to
the multiple development benefits associated with provide information on air pollution levels in countries
emission reductions and cleaner air could motivate worldwide, though they still need to be validated using
further investment (World Bank and ClimateWorks ground-level monitoring (Alvarado et al. 2019).
Foundation 2014).
As Figure 7 shows, a number of countries
Governments in Europe spend between 0.25 (predominantly in Africa, Latin America and the
per cent and 1 per cent on environmental Caribbean, and Asia and the Pacific) either have
protection, enabling enforcement no monitoring in place or are limited to periodic
monitoring at only a few sites. Some countries that
Adequate funding and resources is only one of the have continuous monitoring at multiple sites still do
requirements for effective air quality management not have enough monitors to adequately characterize
planning, which also requires effective policy design exposure for the size of the population. In fact, 60 per
that includes public processes with stakeholder cent of countries, accounting for 1.3 billion people
engagement and that considers implementation (18 per cent of the global population), have no routine,
issues such as financing of measures, the appropriate annual ground-based monitoring of PM2.5 at all.
level of authority to implement measures (i.e. Monitor density is particularly low in Africa, averaging
national or municipal) and enforcement capacity. just 0.03 per million inhabitants – far too low for
Comprehensive air quality management planning air quality management for these 1.2 billion people
includes air quality monitoring, emission inventory (Martin et al. 2019).ACTIONS ON AIR QUALITY
23
Figure 6. Total general government expenditure on environmental protection in the
European Union, 2018 (as a percentage of GDP)
1.60
1.42
1.24
1.06
0.88
0.70
0.52
0.34
0.16
-0.02
Malta
Portugal
Finland
Iceland
Estonia
Ireland
Latvia
Slovakia
Bulgaria
Switzerland
Czechia
Luxembourg
Slovenia
European Union - 27 countries (from 2020)
Germany
Euro area - 19 countries (from 2015)
Croatia
Austria
Romania
United Kingdom
Spain
European Union - 28 countries (2013-2020)
Belgium
Sweden
Netherlands
Cyprus
Poland
Greece
France
Denmark
Norway
Italy
Hungary
-0.20
Lithuania
Waste Waste water Pollution Protection of R&D Environmental
management management abatement biodiversity and protection
landscape
Time frequency Annual
Unit of measure Percentage of gross domestic product (GDP)
Sector General government
Classification of the functions of government (COFOG 1999) Environmental protection
National accounts indicator (ESA 2010) Total general government expenditure
Source: European Union 2018
Figure 7. Countries with national ambient air quality monitoring networks
2
2020 57 18 14 104
0 195
Yes, continuous Yes, monitoring Yes, a monitoring No monitoring No data
monitoring at done periodically network exists but
multiple sites at a few sites is not operational
Source: UNEP survey data24 ACTIONS ON AIR QUALITY
With respect to more general air quality management needed across the range of air quality management
implementation, the survey responses to this question components mentioned above (e.g. inventory,
do not provide a comprehensive picture of how modelling, regulatory design). This guidance must be
many countries have a dedicated national air quality differentiated by capacity level, so that those countries
management strategy. The responses received that are just beginning air quality management
indicate that three key approaches are being used planning can find the level of instruction and support
to implement air quality management strategies: 40 that is appropriate to their existing level of engagement.
per cent of responding countries implement their
programmes through a national action plan, while As disparities in exposure are also correlated
the remaining 60 per cent is roughly split between a with disparities in socioeconomic development
clean air act (legislation), sectoral plans or some other status, environmental justice is also a key issue for
means, often at the subnational level (see Figure 8 inclusion in such guidance. On a global level, the
and text box on subnational action). resource constraints that LMICs face – as well as
other capacity challenges – are evidenced in the
D. Non-financial barriers or disparities in monitoring discussed above. Emission
obstacles to air quality action inventory development is far less expensive than
air quality monitoring, yet a lack of guidance and a
While public awareness is growing and many lack of government transparency may be barriers to
governments around the world have directed energy developing this relatively simple means of tracking
and resources towards monitoring air pollution, there and addressing pollution. Guidance can be developed
remain serious barriers that prevent many countries to overcome these challenges and ensure adequate
from achieving greater progress on air quality action. air quality knowledge in ministries where institutional
Significant capacity gaps remain for many low- and memory is short due to rapid turnover of key staff.
middle-income countries (LMICs) and guidance is
Figure 8. Countries with a national air quality management strategy/framework/plan of
action in place
2020 54 38 103
0 195
Yes No No data
Source: UNEP survey dataACTIONS ON AIR QUALITY
25
Case study 2: Subnational action on air quality
While many countries are establishing comprehensive air quality management planning programmes,
many states, cities and businesses are taking action on their own. This has resulted in a wide array of
air quality plans, citizen-science air quality initiatives, and integrated planning efforts that are sometimes
breaking new ground for national governments to follow as “laboratories for innovation”. For example:
• The C40 Cities network established “Deadline 2020”, a routemap for their network members to set
climate action plans, many of which include an Air Quality Annex that quantifies health co-benefits.
• The EuroCities network of 139 cities in 39 countries across Europe supports cities in their efforts
to improve the environment and work towards achieving sustainable development by sharing
knowledge and expertise. The network has piloted innovative approaches to cleaner air, including
low emission zones, socio-spatial pollution mapping, non-motorized transport and climate-neutral
transportation zones.
• Twelve north-eastern US states launched the Transportation and Climate Initiative, a market-based
cap and trade approach to reduce transportation emissions. This complements the ten eastern US
states that have had a regional cap and trade programme on power generation since 2009.
• An ever-increasing number of global businesses are seeing the opportunity in the zero-carbon
economy and are making various low-carbon commitments through coalitions and partnerships
such as: the We Mean Business Coalition, Ceres (Coalition for Environmental Responsible
Economies), The Ambition Loop, the World Business Council for Sustainable Development, and the
Carbon Pricing Leadership Coalition.
Girl child traveler alone sitting relaxing on rock in calm green rain forest far from the city away from pollution, Kerala, India. Taking deep
breath with open hands in yoga pose inhale fresh air .Photo credit: © Shutterstock/Santhosh Varghese26 ACTIONS ON AIR QUALITY
Photo credit: © Shutterstock/Bildagentur Zoonar GmbHACTIONS ON AIR QUALITY
27
3. INDUSTRIAL EMISSIONS
Chapter findingsIn the industrial sector, the report indicates growing uptake of policy incentives for
In the industrial sector, the report indicates growing uptake of policy incentives for cleaner production
and energy efficiency relative to the baseline reference analysis of 2016. While some of this progress may
reflect a reduction in data gaps relative to the baseline data, increases are noted in some regions.
The most common approach to addressing industrial of fuel combustion that is consumed for electricity
point source emissions (including thermal power generation at present.
generation stations) are emission performance
standards. These standards are typically established Figure 9. Percentage of responding
at the national or state level with the issuance of an countries with national
operating permit that establishes individual emission
emission performance
rates at the unit level and enables enforcement
standards in place for the
through continuous or intermittent stack emission
industrial sector
monitoring. On top of these standards, a variety
of other measures are used to reduce industrial
No standards
emissions, including: (i) investment in renewable 15%
energy or energy efficiency, (ii) policies on efficient
resource use, (iii) policies and legal structures to
promote cleaner production (e.g. subsidy reform),
and (iv) use of environmental impact assessments
to regulate industries. The use of these instruments
, which will vary by the fuel structure (e.g. gas versus
coal) and industrial sectors (e.g. brick kilns versus
chemicals) of individual countries, is explored in
greater detail in the regional reports. 85%
Survey data indicate that a high proportion of National emission
countries have national emission performance performance standards in place
standards in place for the industrial sector Source: UNEP survey data
(Figure 9).9 However, there is room for further
progress in some regions (Asia, Africa, and some
European nations). Future surveys may also establish While performance-based emission standards are
an independent focus on the power generation sector critical to reducing emissions, a mandatory energy
that is independent from policies that are specific efficiency standard is an important complement
to manufacturing industries, given the large share to achieve further progress. In this regard, the
9
Note that as the survey questionnaire did not specify between power generation and other industrial sectors, the more generic term
“industrial sources” was used. Future versions of the survey may distinguish between these sources.28 ACTIONS ON AIR QUALITY
Figure 10. Coverage of mandatory industrial energy efficiency policies as a
percentage in 2018
!
Ambient Air Quality Standards (AAQS)
Mandatory industrial energy efficiency policy coverage 2018
51-100%
26-50%
11-25%
0-10%
No Data
This map is without prejudice to the status of or sovereignty over any territory, to the delimitation of international frontiers and boundaries and to
the name of any territory, city or area.
Source: IEA 2020
International Energy Agency has found that far fewer Relatively few countries push industrial
regions have mandatory policies in place, as shown sources beyond standards through mandatory
in Figure 10. In 2018, mandatory policy-driven energy efficiency goals
efficiency targets and standards covered less than 50
per cent of total industrial energy use in most regions, While mandatory efficiency standards would help
with no major increases in coverage relative to the further reduce criteria pollutant emissions, and may
previous year (International Energy Agency [IEA] 2020). be necessary to achieve carbon neutrality goals,
the trend has been towards supporting voluntary
efforts in the past four years. New UNEP survey data
show growing uptake of policy incentives for cleaner
production and energy efficiency relative to the
baseline reference analysis of 2016 (see Figure 11),
which relied on survey responses and a desk review.
Figure 11. Countries with incentives or policies promoting cleaner production, energy
efficiency and pollution abatement for industries
Baseline 87 83 25
reference
2020 108 76 11
0 195
Country has incentives/policies Country does not have incentives/policies No data
Source: UNEP survey dataYou can also read