Redbridge's Air Quality Action Plan 2020-2025 - Redbridge Council
←
→
Page content transcription
If your browser does not render page correctly, please read the page content below
Redbridge’s
Air Quality Action Plan
2020-2025
Foreword Cabinet Member for Civic Pride Tackling poor air quality is not something any one person or organisation can do alone – it requires commitment and effort at local, regional, and national levels – but it is vital that we all play our part. We have been working to improve air quality for some time. In 2003 we declared Redbridge an Air Quality Management Area, and delivered some successful projects which we are proud of, but we recognise that we can go further. That’s why we have produced this action plan which includes a range of new, bolder measures to improve air quality in the Borough. The risks of failing to act are clear, both short and long-term exposure to air pollutants can affect people’s health, with poor air quality being a contributory factor in respiratory illness, cardiovascular disease, and even some cancers as well as shortening the life expectancy of those who live and work in cities. My ambition, shared with the Council’s administration, is to give the highest priority to this issue. This plan gives further support to the use of sustainable transport such as walking and cycling as an alternative to reliance on travel by car which is the biggest cause of air pollution in Redbridge. We plan to adopt powers to penalise vehicle idling and also reduce emissions from the increasing number of construction sites in the Borough. This plan is a commitment from the Council to do what we can to tackle these issues and has been developed in close consultation with residents and reflects a clearer set of priorities to manage the impact of future growth in the borough; support healthier lifestyles for residents; reduce the impact of traffic on air quality and congestion; and reduce our own impact on air quality. Our proposed actions to improve air quality also contribute to a reduction in carbon emissions. With the impacts of unpredictable changing weather being clear to see, we have pledged to implement specific actions which also reduce carbon emissions in our efforts to contribute towards minimising the impacts of climate change. We also need your help improving air quality. Each of us can make simple changes to our lives to contribute, be that through travel, such as car sharing and cycling, increased walking, and switching the car engine to reduce unnecessary engine idling. With your continued support we can improve our air quality and help make this borough a cleaner, safer and healthier place to live, work and visit. Cllr John Howard Cabinet Member for Civic Pride
London Borough of Redbridge Updated Air Quality Action Plan (AQAP) 2020-2025

Redbridge Updated Air Quality Action Plan 2020-2025

SUMMARY
This Air Quality Action Plan (AQAP) has been produced as part of our duty to London Local Air Quality
Management. It outlines the action we will take to improve air quality in the London Borough of
Redbridge from 2020-2025.

This action plan replaces the previous action plan, which ran from 2006. Highlights of successful projects
delivered through the past action plan include:

•    The council adopted a Green Fleet Policy in 2000. Under this policy, all procured fleet vehicle
     specifications complied with the latest Euro emission standard progressively giving rise to lower
     emissions when new fleet vehicles are purchased or leased.

•    Holding the sustainable travel awareness campaigns ‘In Town Without My Car” and “Walk to School
     Week” to reduce car use around Ilford Town centre and local schools whilst promoting sustainable
     travel alternatives such as walking and the use of public transport.

     Delivery of Local Improvement Plan (LIP) funded transport projects implementing sustainable
     transport initiatives that are consistent with the Mayor of London’s Transport Strategy. Many of these
     initiatives are currently on going. Achievements that have had a positive impact on air quality are:
          -    Improvements of bus interchange arrangements at rail stations within the Borough and the
               bus and walking connections.
          -    Improvements of links between stations, local amenities, employment sites and open
               spaces.

     This has improved public transport and walking accessibility for people to travel sustainably around
     the borough.

•    Facilitating an increase in walking and cycling around key borough corridors, roads and areas.

•    Incentivising electric vehicle uptake by offering free parking in Council car parks.

Air pollution is associated with a number of adverse health impacts; it is recognised as a contributing
factor in the onset of heart disease and cancer. Additionally, air pollution particularly affects the most
vulnerable in society: children and older people, and those with heart and lung conditions. There is also
often a strong correlation with equalities issues, because areas with poor air quality are also often the
less affluent areas1,2.

The annual health cost to society of the impacts of air pollution in the UK is estimated to be roughly £15
billion3. Redbridge Council is committed to reducing the exposure of people in the London Borough of
Redbridge to poor air quality to improve health.

1 Environmental    equity, air quality, socioeconomic status and respiratory health, 2010.
2
  Air quality and social deprivation in the UK: an environmental inequalities analysis, 2006.
3 Defra. Air Pollution: Action in a Changing Climate, March 2010

                                                             Page 3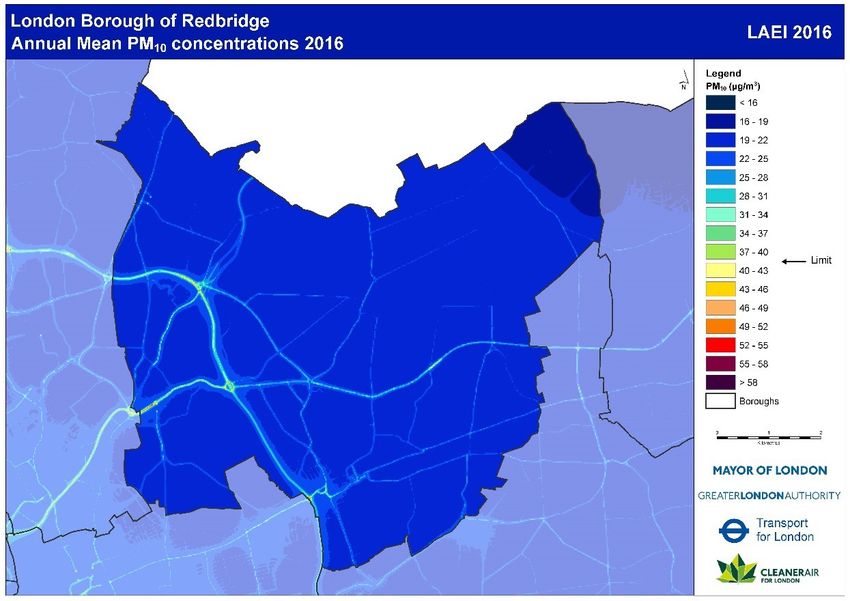
London Borough of Redbridge Updated Air Quality Action Plan (AQAP) 2020-2025

We have considered the priority actions that the Council can take to improve air quality within the
borough. We have developed actions that can be considered under seven broad themes:

    •   Monitoring Air Quality in Redbridge: monitoring and assessing air quality within Redbridge is
        important to identify pollution levels and areas of exposure. Redbridge is an Air Quality
        Management Area (AQMA). We have a legal duty to monitor and implement measures to
        reduce emissions and ambient concentrations of air pollutants which harm human health and
        contribute to other environmental problems.
    •   Emissions from developments and buildings: emissions from buildings account for about
        15% of the NOX emissions across London so are important in affecting NO2 concentrations;
    •   Public health and awareness raising: increasing awareness can drive behavioural change to
        lower emissions as well as to reduce exposure to air pollution;
    •   Delivery servicing and freight: vehicles delivering goods and services are usually light and
        heavy duty diesel-fueled vehicles with high primary NO2 emissions;
    •   Borough fleet actions: our fleet includes light and heavy duty diesel-fueled vehicles such as
        minibuses and refuse collection vehicles with high primary NO2 emissions. Tackling our own
        fleet means we will be leading by example;
    •   Localised solutions: these seek to improve the environment of neighbourhoods through a
        combination of measures; and
    •   Cleaner transport: road transport is the main source of air pollution in Redbridge. We will
        continue to incentivise a change to walking, cycling and the use of ultra-low emission vehicles
        (such as electric) as far as possible.

You will see in this report that we have worked hard to engage with stakeholders and communities,
which can make a difference to air quality in the borough. We would like to thank all those who have
worked with us in the past and we look forward to working with you again as well with new partners as
we deliver this new action plan over the coming years.

In this AQAP we outline how we plan to effectively use local levers to tackle air quality issues within our
control.

However, we recognise that there are many air quality policy areas that are outside of our influence (such
as Euro standards, national vehicle taxation policy, taxis and buses), and so we will continue to work with
and lobby regional and central government on policies and issues beyond Redbridge Council’s
influence.

                                                 Page 4
London Borough of Redbridge Updated Air Quality Action Plan (AQAP) 2020-2025

RESPONSIBILITIES AND COMMITMENT

This AQAP was prepared by the Environmental Health Service at Redbridge Council with the support
and agreement of the following officers and departments:

•   Luke Drysdale (Air Quality Lead Officer, Environmental Health Service)

•   Themis Skouros (Group Manager, Environmental Health)

•   Rogan Keown (Group Manager Transportation Strategy)
This AQAP has been approved by:

•   Simon Parker (Interim Corporate Director of Place)

•   Jas Lally (Head of Licencing and Consumer Protection)

•   Gladys Xavier (Interim Director of Public Health)

•   Steve Grayer (Head of Highways and Transportation Strategy)

This AQAP will be subject to an annual review, and an appraisal of progress. Progress each year will
be reported in the Annual Status Reports produced by Redbridge Council, as part of our statutory
London Local Air Quality Management duties.

                                               Page 5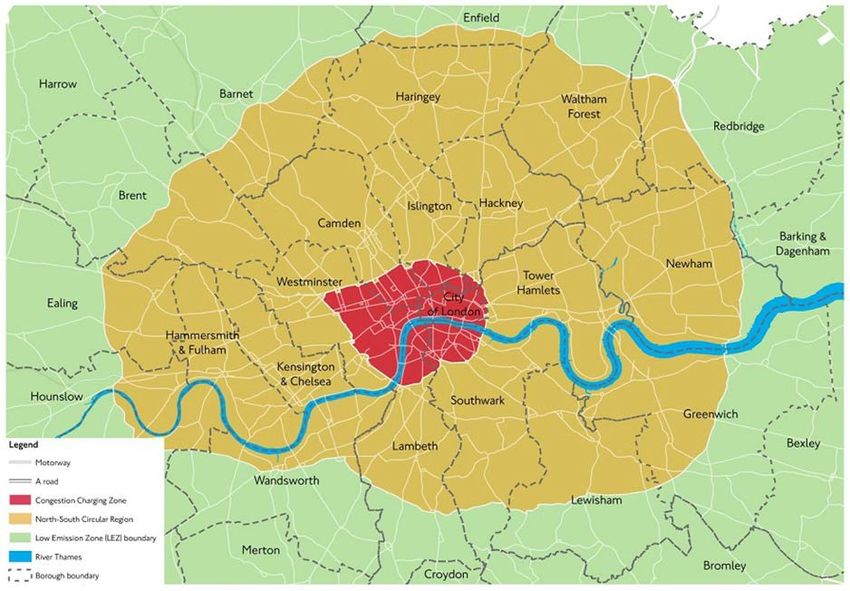
London Borough of Redbridge Updated Air Quality Action Plan (AQAP) 2020-2025

CONTENTS
Abbreviations and Glossary                                                                8

Forward

Introduction                                                                              8

    1       Summary of current air quality in Redbridge                                   8
            1.1 AQMAs and Focus areas                                                     13
            1.2 Sources of Pollution                                                      15
    2       Redbridge Air Quality Priorities and Air Quality in Context                   18
    3       Developments and Implementation of Redbridge AQAP with Local Actions          30
            3.1 Steering Group                                                            45
    4       AQAP Progress                                                                 46
            4.1 Air Quality Action Plan Matrix                                            46

Figures
Figure 1 Modelled map of annual mean NO2 concentrations 2016 (from the LAEI 2016)         10
Figure 2 Modelled map of annual mean NOx concentrations 2016 (from the LAEI 2016)         10
Figure 3 Modelled map of annual mean PM10 (from the LAEI 2016)                            11
Figure 4 Modelled map of annual mean PM2.5 (from the LAEI 2016)                           12
Figure 5 Redbridge Air Quality Management Area AQAM                                       13
Figure 6 Focus Areas                                                                      14
Figure 7 NOx Emission by source and vehicle type (from the LAEI 2016)                     16
Figure 8 PM10 Emission by source and vehicle type (from the LAEI 2016)                    16
Figure 9 PM2.5 Emission by source and vehicle type (from the LAEI 2016)                   17
Figure 10 The proposed Inner London ULEZ extended to the North and South Circular Roads   26

                                                 Page 6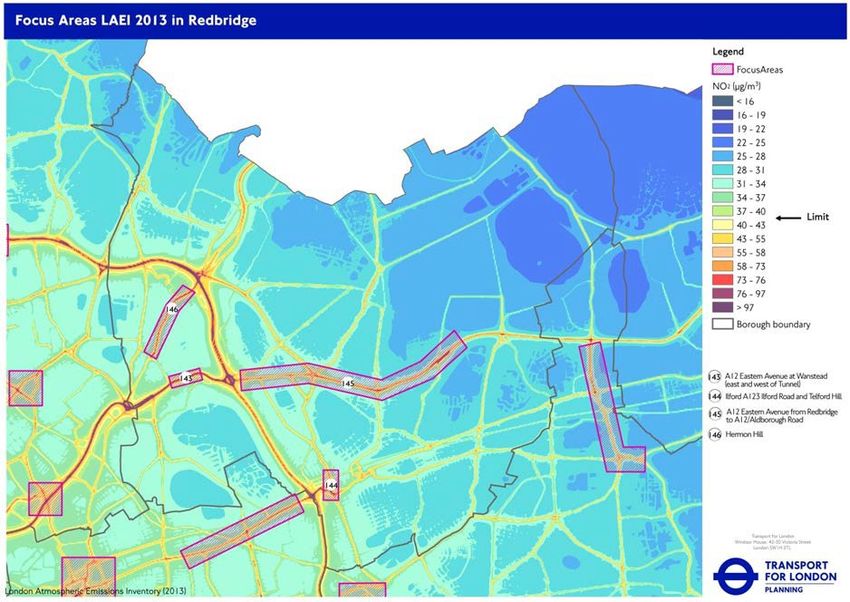
London Borough of Redbridge Updated Air Quality Action Plan (AQAP) 2020-2025

Abbreviations and Glossary

 AQAP          Air Quality Action Plan
 AQMA          Air Quality Management Area
 AQO           Air Quality Objective
 BEB           Buildings Emission Benchmark
 CAB           Cleaner Air Borough
 CAZ           Central Activity Zone
 EV            Electric Vehicle
 ULEZ          Ultra-Low Emission Zone
 LAEI          London Atmospheric Emissions Inventory
 LAQM          Local Air Quality Management
 LIP           Local Implementation Plan
 SCAZ          School Clean Air Zones
 ULEZ          Ultra-Low Emission Zone
 LLAQM         London Local Air Quality Management
 NRMM          Non-Road Mobile Machinery
 PM10          Particulate matter less than 10 micron in diameter
 PM2.5         Particulate matter less than 2.5 micron in diameter
 TEB           Transport Emissions Benchmark
 TfL           Transport for London
 GLA           Greater London Authority

                                               Page 7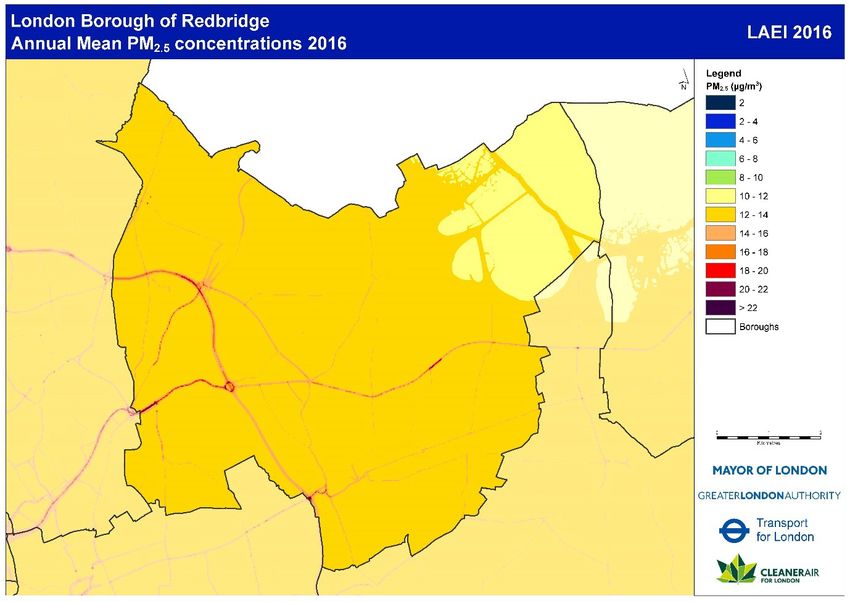
London Borough of Redbridge Updated Air Quality Action Plan (AQAP) 2020-2025

Introduction
This report outlines the actions that Redbridge Council will deliver between 2020-2025 to reduce
concentrations of pollution, and exposure to pollution; thereby positively impacting on the health and
quality of life of residents and visitors to the borough.

It has been developed in recognition of the legal requirement on the local authority to work towards air
quality objectives under Part IV of the Environment Act 1995 and relevant regulations made under that
part and to meet the requirements of the London Local Air Quality Management statutory process4.

1.       Summary of current air quality in Redbridge

The UK Air Quality Strategy (AQS), released in July 2007 and updated in 2019, provides the overarching
strategic framework for air quality management in the UK and contains national air quality standards
and objectives established by the Government to protect human health.

These national objectives are the concentrations for each pollutant over a given time period that are
considered to be acceptable in terms of what is known about the health effects of each pollutant and
its effect on the environment. The key pollutants being considered in relation to the national objectives
are NO2 and PM10

     •   NO2 is the toxic gas Nitrogen Dioxide
     •   PM is particulate matter. This is a mixture of various microscopic solid and liquid particles, some
         of which are hazardous, suspended in the air.
     •   PM10 is particulate matter smaller than 10 micrometres (μm) in diameter,
     •   PM2.5 is particulate matter that is smaller than 2.5 μm in diameter.

There are a number of objectives for NO2 and PM10 relating to both short term and long term exposure
to the pollutants. These are:

     •   Long term objective: an annual mean concentration of 40 micrograms per cubic metre should
         not be exceeded for both NO2 and PM10.

     •   Short term objective: a 24 hour mean concentration of 50 micrograms of PM10 per cubic metre
         should not be exceeded more than 35 times in one year. An hourly average of 200 micrograms
         of NO2 per cubic metre should not be exceeded more than 18 times in one year.

These national objectives take into account EU Directives that set limit values which member states are
legally required to achieve by their target dates.

Nitrogen dioxide (NO2), and particulates (PM) are the air pollutants causing most concern. NO2 in part
comes from the gas compound NOx. NOx is comprised of Nitrogen monoxide (NO), and nitrogen
dioxide (NO2). All combustion processes produce NOx. As NOx easily converts to NO2 in air, in order to
reduce NO2 concentrations it is essential to control emissions of NOx; therefore, the actions in this plan
also focus on reducing emissions of NOx and NO2.

The data from our monitoring stations shows that we are still failing to meet the national annual average
limit for the gas Nitrogen Dioxide (NO2) and modelling indicates it is being breached at a number of
other locations across the borough, most typically areas with heavy traffic.
Levels for Particulate Matter (PM10 and PM2.5) are lower, but there are still some exceedances, most

4
 LLAQM Policy and Technical Guidance. https://www.london.gov.uk/what-we-do/environment/pollution-and-
air-quality/working-boroughs

                                                  Page 8
London Borough of Redbridge Updated Air Quality Action Plan (AQAP) 2020-2025
notably in the south west of the borough, around the Wanstead area and busy main roads in the
borough. As particulate matter can be damaging to health at any level, this remains a pollutant of
concern that is subject to a number actions in this plan to continuously reduce concentrations.
The Mayor of London is committed to tackling particulate matter in London and is determined to
significantly reduce the levels of these dangerous toxic particles, aiming to get PM2.5 to within WHO
guidelines by 2030 and a range of our actions will contribute to this aim. These are amongst a range of
air quality measures within this action plan to control both pollutants across the borough
Redbridge has monitoring stations in Ley Street (north-central Ilford) and Gardner Close (Wanstead). In
addition to our monitoring stations, we have numerous diffusion tube monitors deployed around the
borough. To find out the locations of and to see data from these monitors, please visit:
http://www.londonair.org.uk/LondonAir/Default.aspx
To see the AQ monitoring reports detailing the levels of pollutants over the years within the borough,
please visit:
https://www.redbridge.gov.uk/business/environmental-health/pollution/
London’s air quality monitoring network enables air pollution maps to be created for the capital showing
areas of better and poorer air quality. The following maps explain the levels of NO2, PM10 and PM2.5 in
Redbridge in more detail.
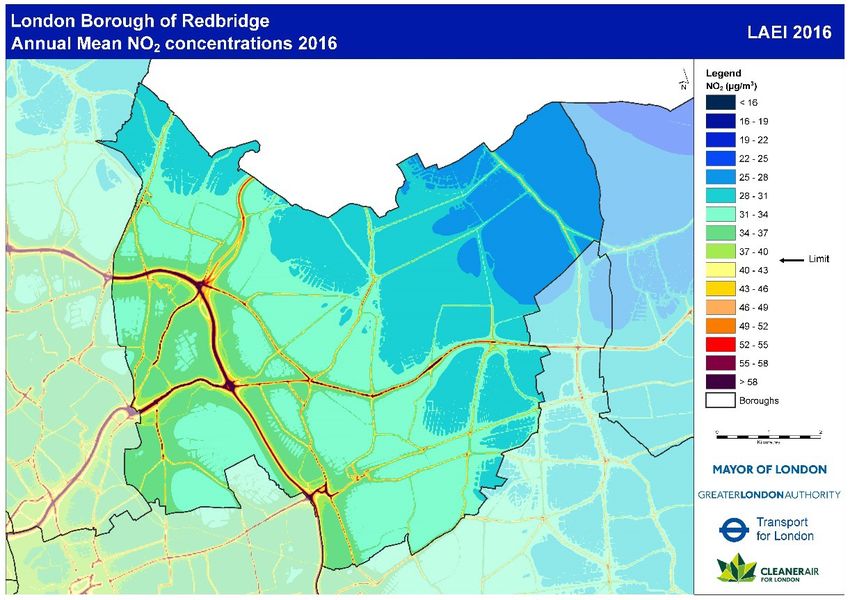
Current air quality monitoring and modelling for Redbridge identifies that nitrogen dioxide is
exceeding these National Objectives:
• Annual mean air quality objective across the borough (40μg/m3)
• One hourly mean air quality objective in parts of the south and east of the borough (not to
exceed 200μg/m3 on more than 18 occasions during each year)*
*For diffusion tube monitoring, it can be considered that exceedances of the one-hourly mean objective
may occur at roadside and kerbside sites if the annual mean is above 60μg/m3
The GLA manages the London Atmospheric Emissions Inventory5 which documents air pollution
emissions from various sources. The GLA uses data is used to undertake air quality modelling to predict
levels of nitrogen dioxide and particulates across the London Borough of Redbridge in the year 2016.
As can be seen from Figure 1; pollution levels are highest in the most densely built-up areas, and along
the borough’s busiest main roads.
The close proximity of built up areas to busy main roads can lead to increased pollution exposure and
the likelihood of possible effects on people, especially the vulnerable. Away from busy main roads, air
quality objectives tend to be met.
Whilst residential and commercial boilers contribute to overall nitrogen dioxide emissions in the
borough; the mapping shows it is typically pollution emitted from vehicles on the roads that is the
predominant source of nitrogen dioxide contributing to the National Air Quality Objectives being
exceeded. NOx emissions significantly contribute to sources of nitrogen dioxide (NO2) in the borough.
5
LAEI data is available on the GLA website https://data.london.gov.uk/dataset/london-atmospheric-emissions-
inventory--laei--2016
Page 9
London Borough of Redbridge Updated Air Quality Action Plan (AQAP) 2020-2025
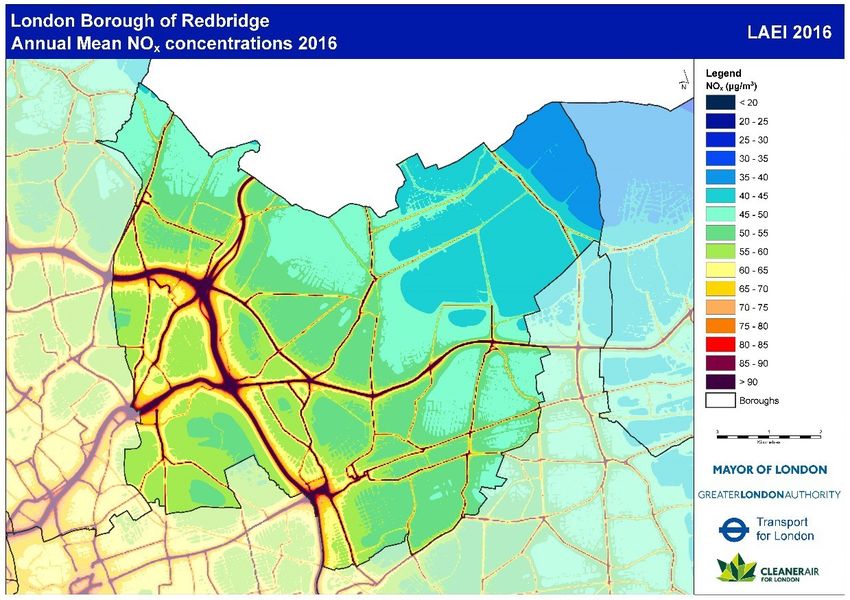
Figure 1 Modelled map of annual mean NO2 concentrations 2016 (from the LAEI 2016)
Figure 2 The Annual Mean of NOx Concentrations Within Redbridge in 2016.
The map shows that NOx concentrations are predominantly the highest on and around the borough’s
busy main roads as a consequence of traffic emissions. Progressively tighter euro standard specifications
and emission testing are designed to control motor vehicle NOx emission levels. However recent
Page 10London Borough of Redbridge Updated Air Quality Action Plan (AQAP) 2020-2025
emission tests have shown that diesel and some petrol vehicles, once on the road in the ‘real world’, are
far exceeding the euro standard NOx emission limits previously met in the laboratory. Because of these
higher ‘real world’ NOx emissions in conjunction with greater numbers of diesel vehicles on the roads,
the annual mean NOx emission concentrations are higher which leads to increased NO2 formation.
In addition to this, over large parts of the borough, there are non-road sources, such as boiler emissions,
that significantly contribute to emissions of NOx and NO2. Other sources of air pollution
such as development sites and larger gas engines, which have not been accounted for in the modelling,
will also be far more significant locally and can potentially result in local failures to meet National Air
Quality Objectives.
The government has predicted that NOx and NO2 emissions are expected to decline from 2020 onwards
due to a greater number Euro VI and low emission vehicles in fleets. This predicted decline is also due to
the implemented Government policies and fiscal measures that are expected to incentivise an increase
in the number people using less polluting vehicles and more sustainable forms of transport.
Figure 3 Modelled Map of Annual Mean PM10 (from the LAEI 2016)
Figure 3 is a modelling map of particulate matter PM10 pollution across the London Borough of
Redbridge. The map indicates that National Air Quality Objectives for PM10 pollution are being met across
most of Redbridge however there are exceedances along busy main roads. The map also shows that a
significant portion of PM10 pollution is generated outside of the borough. This indicates the council
cannot reduce particle matter alone and it requires a collective joint effort from other local authorities,
and regional and central government.
Page 11London Borough of Redbridge Updated Air Quality Action Plan (AQAP) 2020-2025
Figure 4 Modelled Map of Annual Mean PM2.5 (from the LAEI 2016)
Figure 4 is a modelling map of ultrafine PM2.5 particulate matter PM2.5 pollution across the London
Borough of Redbridge. The map indicates that this is concentrated along main roads. The main sources
are the exhaust fumes of diesel engines, construction equipment, and direct-injection petrol engines.
PM2.5 can contain a number of carcinogenic air pollutants and exposure to low concentrations can
contribute to adverse health effects including cancer. Therefore, it is important that Redbridge Council
reduce the concentration of this pollutant as low as possible within the borough and lobby Government
to implement measures that will reduce emissions of PM2.5. Collective PM2.5 reduction measures
implemented by local authorities and the Government will help support the Mayor’s target of London
meeting the World Health Organization guideline limit for PM2.5 by 2030. It is evident from the map that
PM2.5 also comes into the borough from sources outside the borough boundary so it is important that
local authorities and the Government also work together to reduce emissions of PM2.5
Page 12London Borough of Redbridge Updated Air Quality Action Plan (AQAP) 2020-2025
1.1 AQMAs and Focus areas
In 2003 LB Redbridge designated the whole of the borough as an Air Quality Management Area (AQMA)
due to exceedances in NO2 and particulate matter (PM10)
Figure 5 Redbridge Borough AQMA
Page 13London Borough of Redbridge Updated Air Quality Action Plan (AQAP) 2020-2025
The AQMA has been declared for the following pollutants:
Nitrogen Dioxide (NO2) because concentrations in Redbridge are exceeding the EU annual average
limit for this pollutant at some of our measurement monitoring stations/points and modelling indicates
it is being breached at a number of other locations across the borough.
Particulate Matter (PM10) In 2003, exceedances of the EU annual average limit for this pollutant were
measured at some of our monitoring stations. At the time of writing, although we are meeting EU Limits,
we are exceeding World Health Organisation air quality guidelines for this pollutant, and we have a
formal responsibility to work towards reductions of PM2.5, which is a fraction of PM10.
Emission concentrations of PM2.5 are increasing in Redbridge due to the increase of road transport
particularly diesel vehicles. Regional natural and man-made particle sources from outside the borough
also contribute to concentrations within the borough increasing.
It is recognised that exposure to particulate matter (PM) can give rise to significant health effects and to
date there is no evidence of a safe level of exposure. Therefore PM2.5, the finer size fraction of PM, remains
a priority issue for the Government and local authorities to reduce the pollutant as low as possible.
An air quality Focus Area is a location that has been identified as having high levels of pollution and
human exposure. There are four focus areas in the borough (Figure 6).
Figure 6 Air Quality Focus Areas 2013 Onwards
The focus areas remain the same since 2013 and include:
• A12 Eastern Avenue at Wanstead (east and west of Tunnel)
• Ilford A123 and Ilford Hill
Page 14London Borough of Redbridge Updated Air Quality Action Plan (AQAP) 2020-2025
• A12 Eastern Avenue from Redbridge to A12/Aldborough Road
• Hermon Hill
The A12 routes are managed by TfL. Ilford Hill and Hermon Hill are managed by Redbridge Council.
We will prioritise these areas when developing and implementing actions listed in this plan wherever
relevant and work with TfL in delivering measures to improve air quality.
1.2 Sources of Pollution in Redbridge
Pollution in Redbridge comes from a variety of sources. This includes pollution from sources outside of
the borough, and, in the case of particulate matter, a significant proportion of this comes from outside
of London and even the UK.
The greatest amount of air pollutants within the borough arises from road transport emissions,
particularly from the heavily trafficked roads. Many of these roads (including the A406, A12, A1400 and
M11) come under the jurisdiction of the Transport for London Road Networks (TRLN) and the Highways
England (HE). As the Council does not have direct responsibility for roads such as these, any plans to
control pollution needs to be in partnership with Transport for London (TfL) and the HE. The Council
can however introduce measures on roads within their control and lobby for improvements on others.
There are relatively few industrial sources in the Borough and no large Part A installations (which are
facilities which carry out industrial processes like refineries, food and drink factories and intensive farming
activities).
The other major sources of emissions in Redbridge include those from residential and commercial
premises, which mainly relate to gas boilers used for space and water heating; and construction sites,
including dust and Non-Road Mobile Machinery (NRMM) emissions. NRMM are transportable, mobile
machinery used in the construction process. They are fitted with a petrol or diesel engine and emission
standards vary with the type of NRMM plant used. In recent years, there has been a significant increase
in construction activities in the borough, making reducing emissions from construction one of the main
Redbridge air quality priorities.
The London Atmospheric Emissions Inventory (LAEI) contains information on emissions from sources of
air pollutants in the Greater London area and aims to provide an up to date picture of emissions, taking
into account any relevant changes to air emissions behaviour. The latest LAEI baseline data for Redbridge
is from 2016 and projected forward with data estimates to 2030. These are shown in the charts below:
In figure 7 for NOx, it can be seen that road traffic emissions are the most significant source within
Redbridge. In addition to this, gas combustion emissions (which come principally from domestic and
commercial boilers) are a very significant source of NOx in Redbridge. Industrial emissions from Part B
processes (which are processes regulated by the local authority that have the potential to cause only air
pollution) and non-road mobile machinery (NRMM) contribute to a smaller extent within the borough.
It is estimated that there will be a fall in NOx in 2020 from road transport attributed to the introduction
of the Ultra-Low Emission Zone (ULEZ). Redbridge will be bisected by the current proposed ULEZ
boundary and the council disputes that the NOx reduction will be as significant as predicted since the
ULEZ only encompasses part of the south-western area of the borough. We continue to lobby the
Government to widen the ULEZ to cover all of London including the whole borough of Redbridge, which
will deliver greater NOx reductions and air quality benefits. (See page 27 for more information on the
ULEZ).
Page 15London Borough of Redbridge Updated Air Quality Action Plan (AQAP) 2020-2025
Figure 7 NOx Emissions by Source Type (from the LAEI 2016)
Figure 8 PM10 Emissions by Source Type (from the LAEI 2016)
Figure 8 shows that for PM10 pollution, road traffic remains the main source of emissions from within
Page 16London Borough of Redbridge Updated Air Quality Action Plan (AQAP) 2020-2025
Redbridge. Particulate matter from road traffic also comes from sources other than exhaust emissions,
such as tyre wear, brake-wear and vehicle-induced resuspension of road dust. Contributions also come
from wind-induced resuspension of particulate matter. Re-suspended particulate matter is the second
largest source of particulate matter. The term resuspension is used both for freshly formed particles from
abrasion and older deposited road dust lifted into the air. Non-road mobile machinery, domestic and
commercial gas and other fuels also contribute to emissions of PM10 pollution within Redbridge.
Figure 9 PM2.5 Emissions by Source Type (from the LAEI 2016)
Figure 9 shows that for PM2.5 pollution comes from similar sources as PM10.
Page 17London Borough of Redbridge Updated Air Quality Action Plan (AQAP) 2020-2025
2. Redbridge Air Quality Priorities and Air Quality in Context
Redbridge’s air quality priorities in this action plan focus on reducing NO2 and particulate matter
emissions from the key emission sources in the borough – road transport, gas boilers and new
developments. It also aims to increase awareness of air quality, and help everyone in Redbridge
understand how they can help reduce air pollution and how they can minimise their exposure when air
quality is particularly poor. We are committed to reducing concentrations of PM10 and PM2.5, and to meet
the EU Objective for NO2.
Our key priorities are to:
• Reducing pollution in and around schools
• Installing Ultra Low Emission Vehicle charging infrastructure
• Lead by example and reduce NO2 and PM10 emissions associated with the Council’s own
transport fleet services.
• Promote Car Free Days and temporary road closures that will promote transport mode shifts to
more walking, cycling and use of public transport.
• Promoting and delivering energy efficiency retrofitting projects in workplaces and homes .
• Promote and enforce smoke control zones
• Support the pollution alert services Airtext and promote the Mayor’s air pollution forecasts
• Enforce the Non-Road Mobile Machinery (NRMM) Low Emission Zone for controlling
construction emissions
• Improve walking and cycling infrastructure
• Reduce pollution from sources we can control in Redbridge through our planning and transport
policies.
• Raise awareness of what Redbridge residents and business can do to reduce their own emissions
and how to avoid exposing themselves to existing pollution
• Work with the GLA and TfL to make the improvements needed to reduce pollution in the
borough and across London.
The contextual key drivers for the council prioritising the above actions to improve air quality are:
Air Quality and Health
The adverse impact of air pollution on human health is the key driver for our action to improve air quality
in Redbridge.
Air quality has direct implications for human health, with both short-term and long-term exposure to
outdoor air pollution known to adversely affect health, leading to acute and chronic health effects or the
exacerbation of existing medical conditions.
Studies show that the greatest burden of air pollution usually falls on the most vulnerable in the
population, in particular the young and elderly.
The Committee on the Medical Effects of Air Pollutants (COMEAP) is an advisory committee of
independent experts that provides advice to government departments and agencies, via the
Department of Health's Chief Medical Officer, on all matters concerning the effects of air pollutants on
health. COMEAP advises that health impacts associated with long and short term exposure to air
pollution can include:
Page 18London Borough of Redbridge Updated Air Quality Action Plan (AQAP) 2020-2025
• Shortening of lifespan
• Worsening of respiratory diseases (such as asthma, Chronic obstructive pulmonary disease (COPD)
and bronchitis),
• Acute symptoms (such as wheezing, coughing and respiratory infections),
• Increased risk of cancers
The health effects of air pollution experienced vary between individuals and various groups of the
population due to differing susceptibility. Additionally, various health effects experienced are also
determined by the type of exposure (e.g. short or long term exposure).
Short term exposure to elevated levels of air pollution can cause a range of acute health problems,
including the exacerbation of asthma, effects on lung function, increases in hospital emissions and
increased morbidity.
Long term exposure to air pollution is associated with a significant health burden on the population and
is a contributory factor in the initiation, progression and exacerbation of diseases. Epidemiological
studies have shown that long-term exposure to air pollution lowers the resistance of our immune
system, and reduces life expectancy, mainly due to increased risks from cardiovascular and respiratory
causes and from lung cancer.
In 2015, Kings College, the GLA and TFL published the report "Understanding the Health Impacts of Air
Pollution in London". This report estimated how many people have died from long term exposure to
man-made PM2.5 and Nitrogen Dioxide NO2 concentrations in 2010. These numbers of deaths were
calculated for London and at Borough level also.
The report indicated that the number of deaths in Redbridge from long term exposure to NO2
concentrations was 273 and there were 5,879 deaths in total across London.
It was also indicated that the number of the deaths from long term exposure to PM2.5 across London was
3,537 deaths and 123 deaths in Redbridge.
From this data, the estimated annual health burden on London was 9416 deaths and in Redbridge 396
deaths were attributable to air pollution in 2010.
Air Quality is one of a total of 68 Public Health Outcomes Framework indicators compiled by the
Department of Health to measure how each local authority is addressing health determinants. The
Framework includes a benchmark tool that enables the comparison of the fraction (%) of mortality
attributable to long term exposure to PM2.5 in each local authority. The Framework details that in 2014,
6.4% of mortality in Redbridge was attributable to long term exposure to PM2.5 which was 1.5% higher
when compared to the UK average of 5.1%.
The available data shows that the impact of air pollution exposure in Redbridge, across London and
across the UK is very profound. Increasingly more epidemiological studies are showing air pollution is a
major cause of death and illness in the UK. In 2010 the Department of Health Committee on the Medical
Effects of Air Pollution concluded that:
“Removing all anthropogenic (human made) particulate air pollution (measured as PM2.5) could save the
UK population approximately 36.5 million life years over the next 100 years and would be associated
with an increase in UK life expectancy from birth”.
In 2016 the Royal College of Physicians concluded in the report “Every breath we take: the lifelong impact
of air pollution” that each year in the UK, around 40,000 deaths are attributable to exposure to outdoor
air pollution. The report made a number of proposals that included the following:
Page 19London Borough of Redbridge Updated Air Quality Action Plan (AQAP) 2020-2025
Put the onus on polluters. Polluters must be required to take responsibility for harming our health.
Political leaders at a local, national and EU level must introduce tougher regulations, including reliable
emissions testing for cars.
Local authorities need to act to protect public health when air pollution levels are high. When
these limits are exceeded, local authorities must have the power to close or divert roads to reduce the
volume of traffic, especially near schools.
The impact on air quality on public health underlines the importance of taking measures to reduce air
pollution. Therefore, Redbridge council has placed emphasis on the actions in this AQAP for reducing
exposure to air pollution and reducing emissions across the borough.
Other drivers for Redbridge Council pursuing the actions within this plan lie within the following various
supportive plans and strategies:
The Council’s Strategy and Borough Plans
In 2018, the Council and its partners published a new borough partnership plan called ‘Growing a New
Redbridge’. This sets out Redbridge Council and its partners’ priority areas for the next five years. In
addition, the Council published its strategic delivery plan, ‘A Great Place To Live’, which details how the
Council will deliver on the commitment in the borough plan.
The five priorities across the borough plan and strategic delivery plan are:
Regenerate the borough to benefit our residents and integrate new communities
Keep the borough clean and safe
Be a great place to live as a family
Tackle the root causes of social challenges
Build a brilliant Council
Our work to tackle air quality feeds into a number of these priorities. Having clean air that is safe for our
children to breathe is an important part of keeping the borough itself safe and clean. Additionally,
improving air quality is an important factor in tackling some health issues amongst residents. In order
to regenerate the borough for the benefit of all residents, we must ensure that the benefits of
regeneration are not cancelled out by construction- and traffic-related pollution.
Regional Supportive Plans and Strategies:
The Mayor of London produces a number of regional and strategic documents that all London Boroughs
are required to have regard to when undertaking their air quality work.
The following regional plans and strategies support the Air Quality Action Plan:
The New Draft London Plan:
The New Draft London Plan is the overall spatial strategic plan for London, and it sets out a fully
integrated economic, environmental, transport and social framework for the development of the capital
to 2041. It forms part of the development plan for Greater London. London boroughs’ local plans need
to be in general conformity with the London Plan, and its policies guide decisions on planning
applications by councils and the Mayor.
The London Plan documents the Mayor of London’s recognition of the importance of tackling air
pollution and improving air quality to London’s development and the health and well-being of its
Page 20London Borough of Redbridge Updated Air Quality Action Plan (AQAP) 2020-2025
people. It documents how the Mayor will work with strategic partners to ensure that the spatial, climate
change, transport and design policies of this plan support implementation of his Air Quality and
Transport strategies to achieve reductions in pollutant emissions and minimize public exposure to
pollution.
The Draft New London Plan states planning decisions should:
a) minimise increased exposure to existing poor air quality and make provision to address local
problems of air quality (particularly within Air Quality Management Areas (AQMAs) and where
development is likely to be used by large numbers of those particularly vulnerable to poor air
quality, such as children or older people) such as by design solutions, buffer zones or steps to
promote greater use of sustainable transport modes through travel plans
b) promote sustainable design and construction to reduce emissions from the demolition and
construction of buildings following the best practice guidance in the GLA and London Councils’
‘The control of dust and emissions from construction and demolition’
c) be at least ‘air quality neutral’ and not lead to further deterioration of existing poor air quality
(such as areas designated as Air Quality Management Areas (AQMAs). The development of large-
scale redevelopment areas, such as Opportunity Areas and those subject to an Environmental
Impact Assessment should propose methods of achieving an Air Quality Positive approach
through the new development
d) ensure that development proposals demonstrate how they plan to comply with the Non-Road
Mobile Machinery Low Emission Zone and reduce emissions from the demolition and
construction of buildings following best practice guidance
e) ensure that where provision needs to be made to reduce emissions from a development, this is
usually made on-site. Where it can be demonstrated that on-site provision is impractical or
inappropriate, and that it is possible to put in place measures having clearly demonstrated
equivalent air quality benefits, planning obligations or planning conditions should be used as
appropriate to ensure this, whether on a scheme by scheme basis or through joint area-based
approaches
f) where the development requires a detailed air quality assessment and biomass boilers are
included, the assessment should forecast pollutant concentrations. Permission should only be
granted if no adverse air quality impacts from the biomass boiler are identified
The London Plan states that London Boroughs Local Plans should have policies that embody
the above measures and that:
a) seek reductions in levels of pollutants referred to in the Government’s National Air Quality
Strategy having regard to the Mayor’s Air Quality Strategy
b) take account of the findings of their Air Quality Review and Assessments and Action Plans, in
particular where Air Quality Management Areas have been designated.
Page 21London Borough of Redbridge Updated Air Quality Action Plan (AQAP) 2020-2025
Council Position Statement:
Redbridge Council will continue to implement all measures required of London Boroughs in the Draft
London Plan.
The Mayor’s London Environment Strategy (LES) 2018
This strategy details the integration of every aspect of the environment. It sets out a range of actions
being taken by the Mayor to improve the environment and provide a better future for London.
The strategy integrates the following areas:
Air Quality
Green infrastructure
Climate change mitigation and energy
Waste
Adapting to climate change
Ambient noise
Low carbon circular economy
The air quality chapter of the LES set out policies and proposals that will meet the Mayor's ambitions for
air quality in London and zero emission transport by 2050
The Mayor will do the following:
Work with boroughs to safeguard the existing air quality monitoring network and enhance it by
exploiting new technologies and approaches such as personal and localised monitoring
• Reducing emissions from London’s road transport network by phasing out fossil fuelled vehicles,
prioritising action on diesel, and enabling Londoners to switch to more sustainable forms of
transport
Promote and prioritise more sustainable travel in London including walking, cycling and public
transport, as part of the Healthy Streets Approach
Through TfL, will clean up the bus fleet by phasing out fossil fuels, prioritising action on diesel,
and switching to zero emission technologies
Through TfL, will reduce emissions in the taxi and private hire fleet by phasing out fossil fuels,
prioritising action on diesel, and switching to zero emission technologies
Aim to reduce emissions from private and commercial vehicles by phasing out and restricting
the use of fossil fuels, prioritising action on diesel
Aim to reduce emissions from freight through encouraging a switch to lower emission vehicles,
adopting smarter practices and reducing freight movements through better use of
consolidated trips
Through TfL and the boroughs, and working with government, will implement local zero
emission zones in town centres and aim to deliver a central London zero emission zone from
2025, as well as broader congestion reduction measures, to pave the way to larger zero emission
zones in inner London by 2040 and then London-wide by 2050
Reduce emissions from non-road transport sources, including by phasing out fossil fuels
Work with the government, the London boroughs and other partners to accelerate the
achievement of legal limits in Greater London and improve air quality
Page 22London Borough of Redbridge Updated Air Quality Action Plan (AQAP) 2020-2025
Use the London Local Air Quality Management (LLAQM) framework to assist and require
boroughs to exercise their statutory duties to improve air quality and will exercise statutory
powers as required
Work with the government to achieve full legal compliance with UK and EU limits as soon as
possible
Redbridge Council supports and will continue to implement all measures required of London
Boroughs in the Mayor’s London Environment Strategy 2018.
The Mayor’s Transport Strategy 2018:
The Mayor's new Transport Strategy sets out his transport vision for London and details how Transport
for London and partners will deliver the plan over a 20-year period. London’s population has grown
significantly and is set to grow more over the next 20 years; this growth is contributing to a number of
problems. Increased vehicle ownership and use has led to traffic dominance and increased air pollution.
Too few people are walking and cycling. Public transport is overcrowded. Too many people still use
private cars because the alternatives are unappealing or do not meet their needs. The new strategy takes
the following approach to solving these problems
There are three key themes are at the heart of the strategy.
Healthy Streets and Healthy People: creating streets and street networks that encourage
walking, cycling and public transport use will reduce car dependency and the health problems
it creates.
• A good public transport experience: public transport is the most efficient way for people to
travel over distances that are too long to walk or cycle, and a shift from private car to public
transport could dramatically reduce the number of vehicles on London’s streets.
New homes and jobs: more people than ever want to live and work in London. Planning the
city around walking, cycling and public transport use will unlock growth in new areas and ensure
that London grows in a way that benefits everyone.
With the Healthy Streets approach, the Mayor will:
design streets that people will enjoy using, encourage less car use and get more people walking
or cycling
make public transport better with stops or stations that link to foot paths or cycling paths, so
that it is easier and quicker to make these trips than taking the car.
make sure that new homes and jobs are close to public transport stops and stations and where
people walk or cycle
So as London grows the number of cars will not increase, air quality and health consequently will
improve. Local Authorities are required to take the lead on reducing traffic in their local areas.
Page 23London Borough of Redbridge Updated Air Quality Action Plan (AQAP) 2020-2025
Council Position Statement:
Redbridge Council will implement the Mayor’s Transport Strategy at a local level through the Local
Implementation Plan and future Local Implementation Plans.
Low Emission Zone:
In 2008, the Mayor of London introduced a traffic pollution charge scheme called the Low Emission Zone
(LEZ), to improve London's air quality. The zone covers most of Greater London including the borough
of Redbridge with the aim of reducing the tailpipe emissions of diesel-powered commercial vehicles in
London. The objectives of the proposed LEZ are to move London closer to achieving compliance with
national and EU air quality objectives and to improve the health and quality of life of people who live
and work in London, through improving air quality. Redbridge Council supported the introduction of
the LEZ during the consultation phase. Between 2008 to 2012, the LEZ has undergone a series of
progressive phased tightening of standards. The LEZ was set up to reduce PM10 emissions from vehicles
entering Greater London by requiring specific vehicle emission standards (Euro standards). The Council
continues to be supportive of the LEZ as London’s most significant measure for reducing PM10
concentrations. However, the scheme will not solve all of London’s air quality problems.
The LEZ has proved insufficient to achieve compliance with the NO2 air quality objectives across London.
Therefore, the Mayor has proposed the introduction of an additional charge scheme called the Ultra-
Low Emission Zone.
Ultra-Low Emission Zone:
Following consultation, the Mayor of London has implemented an Ultra-Low Emission Zone (ULEZ), a
traffic pollution charge scheme that aims to cut harmful emissions from the most polluting lorries,
coaches, buses and private motor cars.
The ULEZ will cover the congestion charging zone area for all vehicles (Central London ULEZ) from the
8th April 2019 and will be extended up to the North and South Circular roads for all vehicles (Inner
London ULEZ) from 25 October 2021. Strict emission standards will also apply to buses, coaches and
lorries across the whole of London from 26 October 2020.
The new ULEZ will cover an area 18 times larger than the Central London Ultra Low Emission Zone and
will affect large numbers of polluting vehicles that don’t comply with strict emission standards. It is
estimated that 100,000 cars, 35,000 vans and 3,000 lorries might be affected by the expanded zone and
tighter standards every day
These bold measures will deliver a major improvement to Londoners health by reducing the toxic air
quality that is currently responsible for thousands of premature deaths and other serious conditions.
Research demonstrates these effects disproportionately impact the poorest Londoners.
Recent studies by the University of Oxford have shown the health damage from cars and vans costs £6
billion annually to the NHS and society, with the bill from London vehicles totaling £650 million a year.
Expanding the ULEZ beyond central London and strict standards for heavy vehicles across London will
result in more than 100,000 Londoners no longer living in areas exceeding legal air quality limits in 2021,
a reduction of nearly 80 per cent compared to without expansion. All areas of London are expected to
Page 24London Borough of Redbridge Updated Air Quality Action Plan (AQAP) 2020-2025
see reductions in pollution, including on the North and South Circular Roads and only 4 per cent of roads
in Outer London are expected to exceed legal limits in 2021.
The expanded zone will be managed in the same way as the central London ULEZ, and will operate on
top of the congestion charge, 24 hours a day, seven days a week, 365 days a year.
The minimum vehicle emission standards required to be exempt from the charge are Euro 4 petrol and
Euro 6 Diesel.
The ULEZ charge is based on Euro standards that set top limits for polluting nitrogen oxides and
particulate matter from car engines.
There are six stages of Euro standards have been published since 1992 – with the most recent Euro 6
framework released in 2014.
According to ULEZ standards, vehicles must meet the following Euro frameworks to be exempt from the
charge:
Euro 3 for Motorbikes – engines must not produce more than 2.3g/km of carbon monoxide and
0.15g/km of nitrogen oxide
Euro 4 for petrol cars, minibuses, vans – engines must not produce more than 1g/km of carbon
monoxide or 0.08g/km of nitrogen oxide.
Euro 6 for diesel cars, minibuses, vans – engines must not produce more than 0.5g/km of carbon
monoxide, 0.08g/km of nitrogen oxide or 0.005g/km of particulate matter
The charges that non-compliant vehicles will be subject to in various parts of the ULEZ are as follows:
• The daily charge for a car that does not meet new emissions standards is £12.50, in addition to
the congestion charge. ULEZ charges are in effect 24/7, 365 days a year. Most vehicles are
subject to the £12.50 rate, including vans, minibuses and motorcycles. If you fail to pay the ULEZ
charge, you will face a penalty of £160 (reduced to £80 if you pay within 14 days).
• Lorries, buses, coaches and larger vehicle will face a much higher daily ULEZ charge at £100. If
this charge is not paid, lorry drivers face a penalty of £1000 (reduced to £500 if paid within 14
days).and the ULEZ standards:
The expanded Inner London ULEZ will affect the London Borough of Redbridge because through being
extended to the North Circular road it bisects the borough around the Wanstead and South Woodford
area. This means residents, businesses that own and use non-compliant vehicles within the ULEZ areas
will be subject to ULEZ controls and charges. The Inner London ULEZ can be seen in figure (10)
As a number of Redbridge residents and businesses may be affected by the current ULEZ proposals, the
council advises that concerned parties read the following Mayoral pages:
Further information on the ULEZ and the Mayor of London’s air quality proposals can be found at:
https://tfl.gov.uk/modes/driving/ultra-low-emission-zone
Page 25London Borough of Redbridge Updated Air Quality Action Plan (AQAP) 2020-2025
https://tfl.gov.uk/corporate/about-tfl/improving-air-quality
If you are unsure about whether your car will be exempt from the charges, you can enter your vehicle
registration number on the Transport for London website to find out if you need to pay the ULEZ charge.
This can be done here:
https://tfl.gov.uk/modes/driving/ultra-low-emission-zone/vrm-checker-ulez
More information on vehicle discounts and exemptions from ULEZ charges can be found here:
https://tfl.gov.uk/modes/driving/ultra-low-emission-zone/discounts-and-exemptions
Figure (10) The proposed Inner London ULEZ extended to the North and South Circular Roads
The Mayor of London’s Air Quality Proposals:
The Mayor of London has outlined a range of bold proposals to combat air pollution. These include:
Implementing an Emissions Surcharge (called the T-charge) on older polluting vehicles entering
central London in Congestion Charging hours from October 2017
Bringing forward the introduction of the ULEZ in central London from 2020 to 2019
Extending the ULEZ beyond central London in 2021: for motorcycles, cars and vans, to the North
and South Circular roads; for lorries, buses and coaches, London-wide in 2020.
Lowering emissions from buses by procuring low emission fleet and a wider expansion of the
ULEZ retrofit programme to 5000 buses so that they meet a lower emission standard (Euro VI).
Page 26London Borough of Redbridge Updated Air Quality Action Plan (AQAP) 2020-2025
Calling for Government to implement a National Diesel Scrappage Scheme
Roll out of rapid electric vehicle charging point facilities across London
• £10 million of funding to London Boroughs for local air quality projects such as delivery of Low
Emission Neighbourhoods and Mayors Air Quality Fund objectives.
The Mayor of London has also taken a number of measures to lower the emissions of buses, taxis and
private hire vehicles (PHVs) across London that will improve air quality in Redbridge and across London.
These include:
Measures to introduce hybrid and hydrogen buses to fleets whilst phasing out diesel buses.
Diesel buses that remain operational will meet the ULEZ emission standards
Introducing 12 Low Emission Bus Zones across London, (of which one will cover a short section
of the A12 Eastern Avenue in Redbridge).
Establishment of Bus Priority Schemes to reduce engine idling.
From 1 January 2018, new diesel taxis will no longer be licensed in London and newly registered
taxis from 2018 need to be zero emission capable.
From 1 January 2018, all vehicles licensed for the first time as PHVs must be Euro 6, unless petrol
hybrid when the minimum standard is Euro 4
From 1 January 2020, new vehicles (those up to 18 months old) licensed for the first time as a
PHV must meet the approved zero emission capable requirements. Used vehicles (those over
18 months old) licensed for the first time as a PHV must be Euro 6
From 1 January 2023, all vehicles licensed for the first time as PHVs must be zero emission
capable
In October 2019 Mayor published a report on the Central London ULEZ which shows significant
reductions of roadside nitrogen dioxide (NO2) concentrations in its first six months of operation.
More information on the impact of the ULEZ can be found here:
https://www.london.gov.uk/WHAT-WE-DO/environment/environment-publications/central-
london-ulez-six-month-report
Redbridge Council support the Mayor in his actions to bring about improvements to the bus, taxi and
PHV fleets that will benefit local air quality.
Council Position Statement:
Redbridge Council supports the new mayoral proposals including the ULEZ and its future planned
phases. We welcome continued funding support for the delivery of local level projects in
Redbridge to improve air quality and reduce exposure. The Council supports the Mayor in his
actions to bring about improvements to the bus, taxi and PHV fleets that will benefit local air
quality.
Local Supportive Plans and Strategies:
The following Redbridge Council local plans and strategies integrate with and support the Air Quality
Action Plan:
The Redbridge Environmental Action Plan 2010-2018 (REAct) sets out the Councils policies and
measures to create a cleaner, greener Borough, whilst reducing atmospheric pollutants, CO2 emissions,
waste and other environmental impacts.
The Local Development Framework and Redbridge Local Plan 2015-2030 details the spatial
development strategy for managing growth and development within Redbridge. This conjunction with
Page 27London Borough of Redbridge Updated Air Quality Action Plan (AQAP) 2020-2025
the London Plan, sets the framework for determining planning applications in Redbridge.
Redbridge’s Parking Strategy 2015 to 2020 sets out policies designed to reduce car journeys within the
borough and to encourage the use of more sustainable transport.
Redbridge’s Third Local Implementation Plan 2019-2041 – A Strategy for Great Neighbourhoods details
how the Council will deliver the borough’s transport policies in line with the Mayor’s Transport Strategy
for London, reducing pollutant emissions from transport by promoting sustainable travel.
Health and Wellbeing Strategy
The Redbridge Health and Wellbeing Strategy sets out a long-term vision for the health and wellbeing
of our borough’s communities. This vision reflects our responsibility to both our resident communities
and the wider visitor and commuter populations. It also sets out where Redbridge will target efforts and
resources for a three-year period based on chosen priorities which reflect the most critical needs set out
in the Redbridge Joint Strategic Needs Assessment (JSNA). Through the Health and Social Act (2012)
reform, there are opportunities for the Health and Wellbeing Strategy to provide further integration
between the wider determinants of health such as transportation, air quality, housing and education.
Climate Change and Air Quality
The observed rise in global temperatures over the last century has been associated with increases of
man-made emissions of greenhouse gases, in particular carbon dioxide CO2. If the current trend
continues this could result in important changes in global weather patterns leading to more frequent
extreme weather events, hotter and drier summers, increased flooding and rising sea levels. This in turn
would have detrimental social, economic and environmental effects globally.
Climate change will have an impact on both local air quality and human health. Warmer temperatures
and more frequent hot sunny days will result in an increase in ground level ozone concentrations. Ozone
is an irritant and can exacerbate the effects of existing respiratory and cardiovascular health conditions.
Air quality and climate change are intrinsically linked. Air quality is dependent on weather factors such
as wind speed and direction, which influences how pollutants are dispersed, and temperature and
humidity. Greenhouse gases and air pollution share common sources, notably the combustion of fossil
fuels, and therefore measures to tackle climate change are often likely to be beneficial to air quality and
vice versa. However, this is not always the case, as in the use of diesel fuel and the firing of boilers with
biomass. Diesel vehicles are more fuel efficient than petrol and produce less CO2, however they emit
more particles and NO2. Similar considerations apply to biomass; in certain situations, using biomass as
a fuel for boiler furnaces may be more sustainable, but its emissions will contain more particles and
polycyclic aromatic hydrocarbons. There are also practical difficulties in using biomass efficiently as a
fuel.
These types of possible conflicts and issues must be carefully considered when setting policies and
measures to address climate change and air quality.
Climate change is one of the four overarching priorities in the Redbridge
Sustainable Community Strategy and the council have developed a
climate change strategy as part of the Redbridge Environmental Action
Plan. Redbridge council is reducing its carbon footprint, focusing on
council buildings, fleet vehicles, and lighting. In 2019, the Council signed
up to Climate Change Declaration and is committed towards putting
together a plan with specific actions that will contribute towards
achieving carbon neutrality by 2030.
Page 28You can also read