BICYCLE SAFETY ACTION PLAN - NEW JERSEY - NJ.gov
←
→
Page content transcription
If your browser does not render page correctly, please read the page content below
NEW JERSEY

                  BICYCLE SAFETY
                  ACTION PLAN

October 2016                       New Jersey Department Of Transportation
                                                     http://www.state.nj.us/transportation/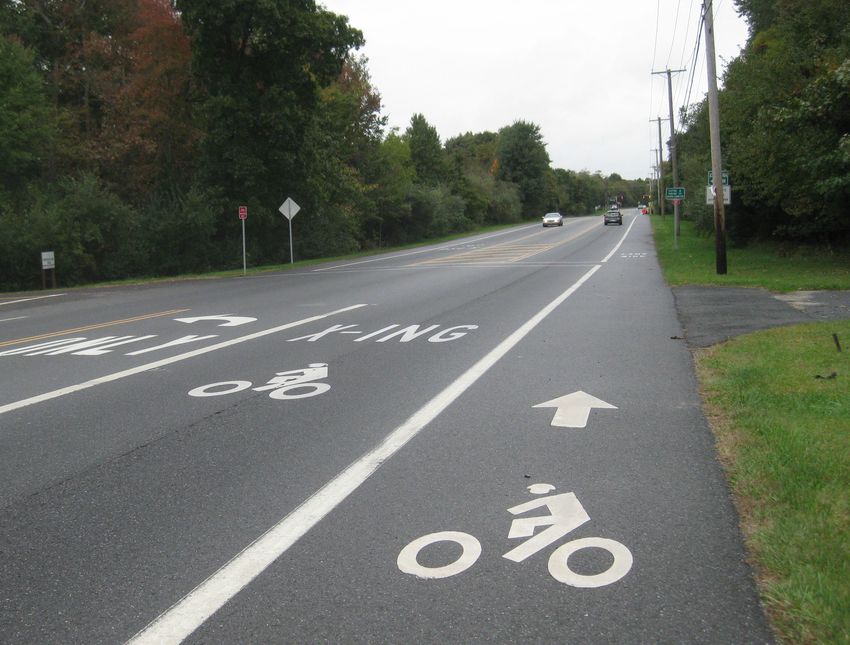
Executive Summary I i
NEW JERSEY BICYCLE SAFETY
      ACTION PLAN
                 Prepared for:

 The New Jersey Department of Transportation

                  Preparedby:

                     with:

             Susan G. Blickstein
                October 2016

                                               Executive Summary I   i
ACKNOWLEDGEMENTS
STEERING COMMITTEE                                                                   PROJECT TEAM
                                                    Joseph Milanese
Alan Huff                                           Michael Baker International      New Jersey Department of Transportation
South Jersey Transportation Planning Organization                                    Debbie Kingsland
                                                    Kerri Maltin                     Elise Bremer-Nei, AICP, PP
Arnold Anderson                                     Second Life Bikes
Essex County Community Police Academy
                                                    Leigh Ann Von Hagen              The RBA Group
Betsy Harvey                                        Voorhees Transportation Center   William Feldman, AICP, PP
Voorhees Transportation Center                                                       Elizabeth Ward, AICP, PP
                                                    Lex Powers
Bruce McCracken                                                                      Rachana Sheth
                                                    Michael Baker International
Middlesex County Planning
                                                    Linda Rapacki                    Susan G. Blickstein
Charles Brown                                       RideWise TMA                     Susan G. Blickstein, AICP, PP, PhD
Voorhees Transportation Center
                                                    Lisa Lee
Cyndi Steiner                                       RideWise TMA
New Jersey Bike Walk Coalition                                                       SPECIAL THANKS
                                                    Mike Viscardi                    New Jersey Bicycle and Pedestrian Advisory Council (NJ BPAC)
Erika Rush                                          NJ TRANSIT
Urban Engineers                                                                      Safety Subcommittee, NJ BPAC
                                                    Reed Sibley                      Education and Outreach Subcommittee, NJ BPAC
Gary Poedubicky                                     Parsons Brinckerhoff
Division of Highway Traffic Safety, NJDOT
                                                    Sean Meehan
James Sinclair                                      Voorhees Transportation Center
Voorhees Transportation Center
                                                    Trish Sanchez
Janna Chernetz                                      Voorhees Transportation Center
Tri-State Transportation Campaign
                                                    Valeria Galarza
Jennifer Buison                                     Cooper’s Ferry Partnership
NJ TRANSIT

                                                                                                                                Executive Summary I   i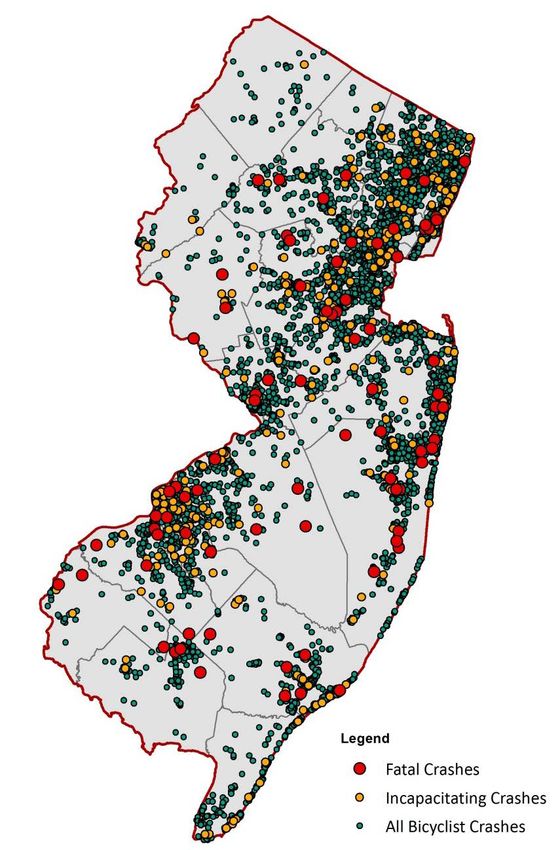
TABLE OF CONTENTS
EXECUTIVE SUMMARY ............................................................................................................................. i

CHAPTER 1 INTRODUCTION ................................................................................................................. 1

CHAPTER 2 SETTING THE STAGE: BICYCLING IN NEW JERSEY ................................................. 5

CHAPTER 3 RECENT BICYCLIST SAFETY INITIATIVES AND PROGRAMS ................................. 23

CHAPTER 4 VISION STATEMENT & GOALS ....................................................................................... 37

CHAPTER 5 ACTION PLAN ...................................................................................................................... 39

CHAPTER 6 MONITORING OUTCOMES ............................................................................................. 43

LIST OF ACRONYMS ................................................................................................................................... 47

BIBLIOGRAPHY ............................................................................................................................................. 49

BICYCLE SAFETY ACTION PLAN TOOLBOX                                        (Separate document)

                                                                                                                                                          Executive Summary I   i
Executive Summary I i
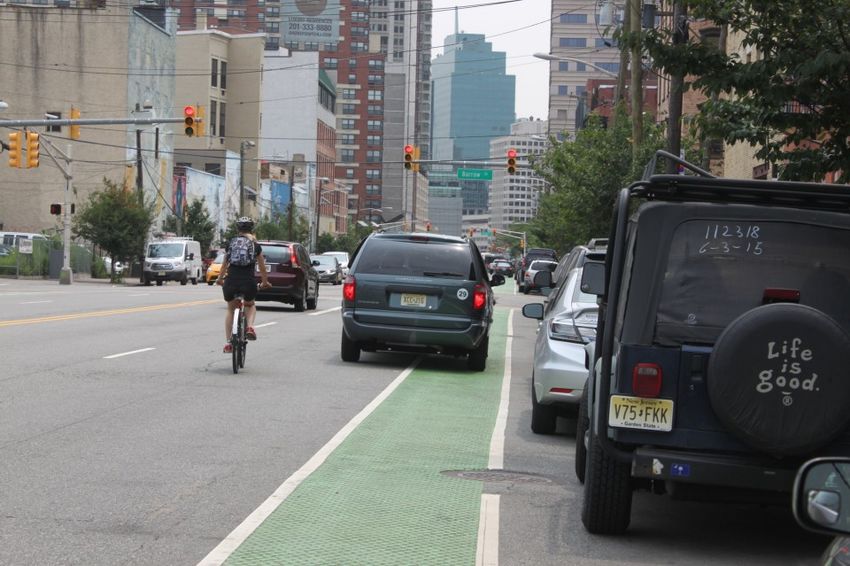
TABLE OF FIGURES
Figure 1: Bicycle Friendly State Ranking .......................................................................................................           5
Figure 2: Bicycle Commuters in New Jersey (2008-2013) ............................................................................                         6
Figure 3: Bicyclist Crashes by Severity in NJ (2008-2013) ............................................................................                     9
Figure 4: Bicyclist Crashes by Year & Severity in NJ (2008-2013) ................................................................                          9
Figure 5: Bicyclist Crash Fatalities in the US and New Jersey (2008-2013) ..................................................                               9
Figure 7: Bicyclist Crash Data for High Crash Counties (2008–2013) ...........................................................                             10
Figure 6: Bicycle Crash Locations in NJ (2008–2013) ....................................................................................                   10
Figure 8: Top 10 High Crash Municipalities, Corridors and Intersections in New Jersey (2008–2013) .......                                                  11
Figure 9: Fatal & All Bicyclist Crashes by Posted Speed in NJ (2008-2013) ...................................................                              12
Figure 10: Bicycle Crashes by Roadway Jurisdiction in NJ (2008-2013) ........................................................                              12
Figure 12: Bicyclist Crashes by Lighting Conditions & Severity in NJ (2008 - 2013) ......................................                                  13
Figure 11: Bicyclist Crashes by Number of Lanes in NJ (2008-2013) ............................................................                             13
Figure 13: Bicyclist Crashes by Severity and Time of Day in NJ (2008-2013) ................................................                                14
Figure 14: Bicyclist Crashes by Age in NJ (2008-2013) ..................................................................................                   14
Figure 17: Bicyclist Crashes by Gender in NJ (2008-2013) ............................................................................                      15
Figure 18: Fatal Bicyclist Crashes by Gender in U.S. (2013) ..........................................................................                     15
Figure 19: Fatal Bicyclist Crashes by Gender in NJ (2008-2013 ....................................................................                         15
Figure 20: Bicyclist Crashes by Driver Age and Gender in NJ (2008-2013) ...................................................                                15
Figure 21: Bicyclist & Motorist Pre-Crash Action in NJ (2008–2013) ............................................................                            16
Figure 22: Bicyclist & Motorist Contributing Circumstances in NJ ................................................................                          16
Figure 23: New Jersey Highways with Restricted Bicyclist Access ................................................................                           22
Figure 24: Goal 1 Actions ..............................................................................................................................   40
Figure 25: Goal 2 Actions ..............................................................................................................................   41
Figure 24: Goal 3 Actions ..............................................................................................................................   42

                                                                                                                                                                Executive Summary I   i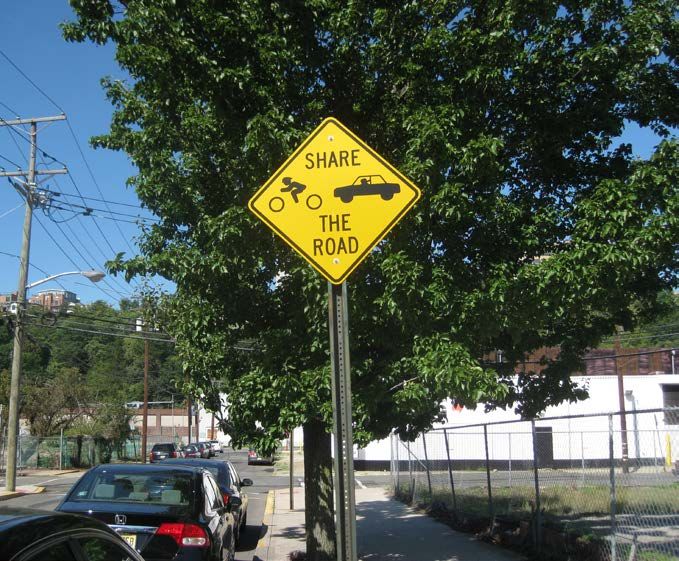
Executive Summary I i
EXECUTIVE SUMMARY
 EXECUTIVE SUMMARY
BACKGROUND                                                                  VISION
In 2005, the New Jersey Department of Transportation issued its first       The vision adopted for the New Jersey BSAP is:
Pedestrian Safety Action Plan (PSAP). In March 2014 the Department
updated the 2005 plan. Both the original plan and the update were             New Jersey is working toward a future with zero bicyclist
responses to New Jersey being identified by the Federal Highway
                                                                              deaths and serious injuries through safety initiatives that
Administration (FHWA) as one of a group of states with above average
                                                                                 prioritize the needs of vulnerable populations and
pedestrian fatality rates, i.e., a Pedestrian Focus State. In 2014, the
Federal Highway Administration (FHWA) Office of Safety updated their             promote mutual respect among all roadway users.
safety focus areas. As part of that effort, the pedestrian focus area was
expanded to include bicycle fatalities and renamed the
                                                                            The Plan supports this Vision by means of a data-driven analysis of
pedestrian/bicycle focus area. One outcome of this is that New Jersey
                                                                            bicycle crashes and crash trends including frequency, severity location,
has been designated as a Pedestrian/Bicycle Focus State under the
                                                                            demographics and behavioral factor, providing an understanding of
new focus category.
                                                                            the problem: who is being hit, by whom, where and under what
This Bicycle Safety Action Plan (BSAP) is intended to:                      circumstances, providing a basis for the recommended goals and
                                                                            actions.
    •   document the current status of bicycle safety in New Jersey
        identifying the agencies involved and efforts that are being
        undertaken, and gauge the extent to which they are
        complementary and coordinated;

    •   identify state of the practice programs, resources and activities
        effective in improving bicycle safety; and

    •   propose recommendations for a vision, goals, actions and
        performance measures and implementing agencies to address
        and improve bicycle safety in New Jersey and shed its focus
        state status.

                                                                                                                                  Executive Summary I   i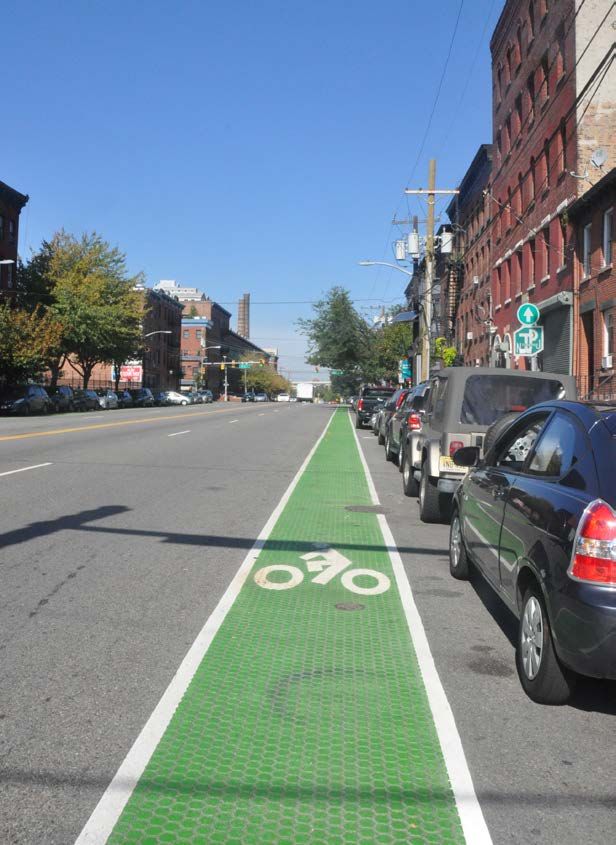
Action Plan
In order to realize the vision of this Action Plan, three core goals, a    number of performance measures is to simplify and streamline the
series of recommended actions and performance measures were                evaluation process, to enable the agencies involved to focus their
developed. The goals are based on input from the steering committee        energy and resources on implementing the recommended actions and
and stakeholders, an assessment of Plan4Safety crash data pertaining       achieving the goals in pursuit of the vision. Recommended
to bicycle-motor vehicle crashes and a review of the state of the          performance measures are tracked in terms of activities undertaken
practice resources. They are similar to the core goals adopted in the      (efforts) or achievements (results). It is further recommended that the
Pedestrian Action Plan (PSAP). They are:                                   evaluation process be managed by the NJDOT with input from the NJ
                                                                           BPAC and with the assistance of VTC.
          GOAL 1 : Establish a governance and management structure
         to facilitate improved data collection, to coordinate             In conjunction with the development of the plan, a separate
         implementation of bicycle safety initiatives statewide, and to    document containing a toolbox of information was prepared to
         measure the success of this plan.                                 encourage local governments, to take actions that are consistent with
                                                                           the Plan’s vision and recommended goals and actions.
          GOAL 2 : Foster behavioral change among users of public
         rights-of-way to promote mutual respect, courtesy and
         acceptance.

         GOAL 3 : Improve and expand transportation infrastructure
         and the built environment for bicyclists in accordance with
         best practice standards and guidelines.

For each core goal, a series of recommended actions are proposed that
relate back to data, trends and analysis discussed elsewhere in the
plan. Fulfillment of each goal is related to the implementation of those
action Items. These actions are the central focus of plan
implementation.

A series of performance measures for each of the plan’s core goals are
identified. There is not a performance measure proposed for each
recommended action; rather there is a limited set of suggested
performance measures for each goal. The purpose of limiting the

ii I Executive Summary
GOAL 1 ACTIONS GOVERNANCE & DATA MANAGEMENT STRUCTURES GOAL 2 ACTIONS FOSTER BEHAVIORAL CHANGE
• Utilize the New Jersey Bicycle and Pedestrian Advisory • Promote education on sharing the road with bicyclists
Committee (NJ BPAC) to monitor and track progress of bicycle throughout the driver education, training, and licensing
and pedestrian related plans and initiatives proposed in this processes.
plan and progress towards achieving the Plan’s Vision.
• Expand pedestrian safety campaigns, such as Street Smart, to
• Continue to partner with the health community to educate the include more on bicycle safety and implement them in more
public on the benefits of and safe practices for bicycling and communities; pair safety campaigns with enforcement efforts.
walking. Make use of social media to promote “Put the Brakes on
Fatalities Day” and “Vision Zero” movements.
• Collaborate with NJDHTS and metropolitan planning
organizations (MPOs) to develop bicycle-pedestrian safety • Create a pilot program, including a bilingual video, to
performance measures as part of new FHWA rules to implement encourage use of bike lights, reflectors, bells, and helmets
MAP-21 and FAST Act requirements and update the Strategic focused on disadvantaged, high risk populations, including
Highway Safety Plan (SHSP). those who use the bicycle as a primary form of transportation.
• Collaborate with municipalities and school boards on • Collaborate with law enforcement agencies to undertake
implementing transportation and land use (school siting) relevant research and to develop training to ensure
decisions that support bicycling and walking. enforcement of both motorists and bicyclist behaviors.
• Conduct a comprehensive review and evaluation of the NJ • Continue to promote and encourage schools to support and
Statutes as they pertain to bicycling and bicycle safety such as a implement SRTS programs, including bicycle/pedestrian
safe passing distance law, a “dooring” law and operating education programs, encouragement programs and policies,
requirements for E-bikes. and School Travel Plans.
• Continue to update and improve the quality of crash analysis • Continue to improve police reporting for fatal and serious injury
tools such as Plan4Safety and non-motor vehicle related crash bicycle (and pedestrian) crashes.
data collection. Identify high risk locations; and develop bicycle
• Promote high visibility targeted enforcement in areas where
and pedestrian trip purpose, e.g. bike-to-transit counts and
pedestrian and bicyclist crashes are overrepresented.
bicycle and pedestrian exposure data for New Jersey.
• Encourage Complete Streets policies, plans,
• Establish an interactive tool such as a smartphone app where
educational/training efforts. Move beyond policy to
pedestrians and bicyclists can report bicycle-friendly roads /
implementation.
routes and problem locations along roadways (near misses) to
help identify high risk locations. • Develop a campaign to replace the word “accident” with “crash”
in all of NJDOT’s published and disseminated materials,
including variable message signs, and encourage the press to
participate.
Executive Summary I iiiGOAL 3 ACTIONS IMPROVE & EXPAND BICYCLING & PEDESTRIAN • Evaluate the Residential Site Improvement Standards (RSIS) in
terms of their relationship / consistency with Complete Streets
INFRASTRUCTURE Design and their impact on bicycle and pedestrian safety.
• Establish infrastructure investment priorities, specifically
targeting high-frequency crash locations (systematic approach)
as well as a system-based (systemic) approach; also considering
concentrations of vulnerable populations using best available
crash and demographic data.
• Align the highway access permit application checklist and
methodology with NJDOT Complete Street polices and
principles.
• Revise capital programming policies and procedures to address
both vulnerable users and communities with greatest need
based on data driven methodologies.
• Identify and encourage implementation of best practices as well
as emerging and innovative bicycle and pedestrian design
approaches, facilities and treatments.
• Continue to fully staff the Office of Bicycle and Pedestrian
Programs OBPP at NJDOT and promote/prioritize the Local
Bicycle and Pedestrian Planning Assistance Program.
• Require context sensitive bicycle, pedestrian, and Americans
with Disabilities (ADA) improvements for all projects consistent
with federal guidance and NJDOT’s Complete Streets policy.
• Continue to conduct safe pedestrian and bicycle planning and
design/Complete Streets workshops, webinars, and conferences
for state agencies and local governments.
• Increase/create funding incentives for municipalities/counties
and school districts that have adopted and implemented
supportive policies and plans for example Complete Streets
Policies and Implementation Plans and School Travel Plans.
iv I Executive SummaryCONCLUSIONS AND NEXT STEPS
Some may argue that the current level of fatalities and serious injuries of these non-motor vehicle-involved bicycle crashes should also be
due to bicycle-motor vehicle crashes in New Jersey is relatively minor, lessened by the implementation of actions and countermeasures
especially in comparison with the incidence and rate of pedestrian recommended in this plan.
fatalities and serious injuries. Nonetheless, these crashes can and must
be addressed: first and foremost for their direct benefit in terms of The achievement of this outcome is dependent on assertive and
reducing death and suffering; but also because addressing and sustained effort pro-actively taken by those interested in or
achieving the goals of this plan will foster greater use of the bicycle, responsible for an improved, safer bicycling environment in New
and, mirroring the experience of others, increase bicycle ridership Jersey. It should be led and facilitated by efforts and programs of those
thereby leading to increased safety (in numbers). state agencies with principal involvement in bicycling safety programs
and projects, primarily NJDOT and DHTS, supported by their federal
It should be kept in mind that an unknown but possibly substantial and regional partner agencies. But, to have a meaningful impact on
number of bicycle crashes do not involve a motor vehicle but are due the incidence of bicycle fatalities and serious injuries, others involved
to bicycle/bicycle crashes, bicycle/pedestrian crashes or a single need to become leaders within their own organizations and their own
bicyclist crash resulting from loss of control due to roadway communities.
impediments, motorists passing too closely, or bicyclist
inattentiveness, etc. The incidence and results (fatalities and injuries)
Executive Summary I v6 I Chapter 1: Introduction
CHAPTER 1 INTRODUCTION
                                                                          Since 2014, the FHWA Office of Safety has updated the methods used
                                                                          to determine/identify each of their safety focus areas. As part of that
                                                                          effort, the pedestrian focus area was expanded to include bicycle
                                                                          fatalities and renamed the pedestrian/bicycle focus area. This focus
BACKGROUND                                                                category now includes cases in which at least one person involved in a
In 2005, the New Jersey Department of Transportation issued its first     fatal motor vehicle crash was coded as either a “pedestrian”, a
Pedestrian Safety Action Plan (PSAP). In March 2014 the Department        “bicyclist”, an ”other cyclist”, or a “person on personal conveyance”,
updated the 2005 plan. Both the original plan and the update were         e.g., a wheelchair. New Jersey has been designated as a focus area
responses to New Jersey being identified by the Federal Highway           under the newly renamed focus category: the pedestrian/bicycle
Administration (FHWA) as one of a group of states with above average      focus area. (See text box: New Jersey Now a Pedestrian / Bicycle
pedestrian fatality rates, i.e., a Pedestrian Focus State. The purpose    Focus State).
of the 2014 update was to:

   •   identify actions undertaken and successes achieved since the
       2005 plan as well as needs that remained to be addressed
   •   review the issues associated with and factors affecting
       pedestrian safety
   •   identify and assess the programs that addressed pedestrian
       safety issues
   •   examine the factors related leading to pedestrian crashes
   •   propose a mission that set out a target reduction in pedestrian
       fatalities and serious injuries
   •   establish goals, and actions to reduce pedestrian fatalities and
       injuries and performance measures to gauge the success of
       those actions

An anticipated ancillary result would be that New Jersey would no
longer be a “Pedestrian Focus State” status, a long-term goal that has
yet to be attained.
                                                                                          New Jersey Pedestrian Safety Action Plan, June 2014

                                                                                                                                       Chapter 1: Introduction I   1
NEW JERSEY NOW A PEDESTRIAN / BICYCLE FOCUS STATE
The Focused Approach to Safety is a program, developed by the Federal Highway Administration
(FHWA), and “rolled out” in 2004-05. Its purpose was (and is) to reduce highway fatalities and serious
injuries by focusing on the crash types responsible for the highest percentage of highway fatalities and
serious injuries, and concentrating efforts on high priority (focus) states where the problems were most
acute. One of the original focus categories was pedestrian crashes. In July 2014, the FHWA Office of
Safety updated the methods used to make annual calculations of the status of each of the safety focus
areas. The decision was made to expand the pedestrian focus category to include bicyclists and other
related road users, such as those in wheelchairs.
Being identified as a focus state is determined by whether or not a state has at least one focus city. A
pedestrian/bicycle focus city is defined as one in which the average annual number of bike/pedestrian
roadway crash fatalities from 2011 to 2013 was greater than the average for the 50 largest cities OR the
Source: Eligible Focus States,
average annual number of bike/pedestrian-motor vehicle fatalities (per 100,000 population) is greater
http://safety.fhwa.dot.gov/fas/
than the average annual number of fatalities (per 100,000 population) for the 50 largest cities. Since
Newark’s average annual number of bike/pedestrian-roadway fatalities (per 100,000 population) from
2011 to 2013 is 3.48, and the average annual number of fatalities (per 100,000 population) for the 50
largest cities for the same period is 2.99. Newark is considered a focus city for the pedestrian/bicycle
focus area and New Jersey is, therefore, designated a pedestrian/bicycle focus state.
PURPOSE • propose recommendations for a vision, goals, actions and
performance measures and implementing agencies to address
The Bicycle Safety Action Plan (BSAP) is intended to:
and improve bicycle safety in New Jersey.
• document the current status of bicycle safety in New Jersey
In order to accomplish this purpose and to shed New Jersey’s focus
identifying the agencies involved and efforts that are being
state status, bicycle safety concerns are being addressed in a manner
undertaken, and gauge the extent to which they are
similar to the way pedestrian safety concerns were addressed by the
complementary and coordinated;
PSAP. It should be mentioned that major federally-supported
• identify state of the practice programs, resources and activities
initiatives and practices in New Jersey, including Safe Routes to School
that are considered to be effective in improving bicycle safety;
(SRTS) and Complete Streets policies, and practices have flourished in
recent years. Their continued success may be enhanced by the success
of efforts to improve bicycle safety.
2 I Chapter 1: IntroductionVISION INFORMATION GATHERING
The vision adopted for the New Jersey Bicycle Safety Action Plan is: The planning process commenced with the gathering of relevant
Information, including:
New Jersey is working toward a future with • Literature on the state-of-the-practice regarding bicycle safety
planning
zero bicyclist deaths and serious injuries
• Research studies pertaining bicycle safety
through safety initiatives that prioritize the
• Crash statistics, nationally and in New Jersey for the latest six
needs of vulnerable populations and promote years available (2008-3013)
mutual respect among all roadway users. • Information on bicycle safety related activities in New Jersey
by a wide variety of agencies
• Research on the efforts of other states or jurisdictions who
have confronted bicycle safety through the development of
PLAN METHODOLOGY specific bicycle safety planning efforts
This study followed a methodology generally similar to that used for
the Pedestrian Safety Action Plan. It included information gathering,
OUTREACH/STEERING COMMITTEE
outreach, crash data analysis, evaluation and the development of Primary outreach efforts involved convening a Steering Committee
recommendations for a Vision, Goals, Actions and Performance comprised of experts and stakeholders representing a wide range of
Measures. organizations involved in activities directly related to bicycle use and
bicycle safety. In this case, the Steering Committee was comprised of
The draft plan was reviewed by the NJDOT and the Steering
the Safety and Education & Outreach Committees of the Bicycle
Committee which consisted of the New Jersey Bicycle Pedestrian
Pedestrian Advisory Council (NJ BPAC). Outreach also included
Advisory Council’s (NJ BPAC) Safety and Education & Outreach
presentation to the NJ BPAC Executive Council and to general NJ BPAC
Committees. It was subsequently posted on the web for stakeholder
attendees, as well as a workshop/webinar that was held in conjunction
and public review and comment. The Draft document was then
with a companion planning effort, the updating of the New Jersey
revised to address comments and finalized. The Plan also included the
Bicycle and Pedestrian Master Plan.
development of a “Toolbox”, a series of information briefs on bicycle
safety issues designed mainly for the use of local and regional
governments.
Chapter 1: Introduction I 3Three meetings of the Steering Committee were held, each requiring BICYCLE SAFETY ACTION PLAN TOOLBOX
the participation of committee members in identifying New Jersey’s
In conjunction with the development of the plan, a toolbox of
bicycle safety issues and needs, existing bicycle safety programs and
information briefs was prepared to encourage local governments, to
stakeholders, and in developing the Plan’s vision, goals, actions and
take actions that are consistent with the Plan’s vision and
performance measures.
recommended goals and actions. Toolbox elements included:
1. Municipal Planning & Bicycle Safety
2. Encouraging Bicycling
3. Complete Streets
4. Funding Bicycle Projects
5. Data & Evaluation Tools
6. Bicycle Facilities & Treatments
7. Bicycle Laws & Regulations In New Jersey
8. Bicycle Education
9. Enforcement
10. Bicycle Parking
Steering Committee Meeting – NJ BPAC
Image: The RBA Group
Steering Committee Meeting – NJ BPAC
Image: The RBA Group
4 I Chapter 1: IntroductionFigure 1: Bicycle Friendly State Ranking
CHAPTER 2 SETTING THE
STAGE: BICYCLING IN NEW JERSEY
INTEREST IN BICYCLING IN NEW JERSEY
Bicycling in New Jersey has been growing in popularity over the years.
Communities such as Jersey City, Hoboken, Ocean City and Princeton
have initiated successful bike sharing programs and installed bicycle
infrastructure such as bicycle lanes, shared use paths and bicycle
parking. The State has developed over 950 miles of trails 1. Overall,
there has been an interest in bicycling across the board from
Image: The League of American Bicyclists, www.bikeleague.org
individuals to local organizations to government agencies at all levels.
Over 90 local governments have completed planning studies
In 2015, New Jersey was ranked as the 11th most Bicycle Friendly state pertaining to improving bicycle and pedestrian access and safety. In
by the League of American Bicyclists (League). In addition, the League addition, encouraged by the adoption and implementation of NJDOT’s
has designated six Bicycle Friendly Communities (Hoboken, West award-winning Complete Streets (CS) Policy, 7 New Jersey Counties
Windsor, Ocean City, Lambertville, Montclair and Princeton), four and 130 New Jersey Municipalities have passed Complete Streets
Bicycle Friendly Businesses and one Bicycle Friendly University Policies of their own. This is discussed further in Chapter 3: Recent
(Princeton University) in the State (Figure 1). The League ranks all 50 Bicyclist Safety Initiatives and Programs.
States based on five categories – Legislative & Enforcement, Policies &
Programs, Infrastructure & Funding, Education & Encouragement, and Bicycle commuting data from the 2000 Census and the 2010-2014
Evaluation & Planning. Of these five categories, New Jersey received American Community Survey (ACS) shows that there is a significant
the least points in the Legislative and Enforcement category. As increase in bicycling commuters in New Jersey. From 2000 - 2014, the
discussed below in the section on Bicycles and the Law in New Jersey, number of bicycle commuters in New Jersey has increased by 81%
there are a number of proposed additions or revisions to existing laws from 9,142 to 16,579. This is a higher percentage increase than the
designed to protect on-road bicyclists and to perhaps encourage nation as a whole where the number of bicycle commuters increased
others to bicycle more often. by 74%. During the same time, New Jersey’s bicycle commuter mode
1
share doubled from 0.2% in 2000 to 0.4% in 2014 (Figure 2). However,
Source: Bicycling and Walking in the United States: 2016 Benchmarking this number is probably low given that residents who bicycle to transit
Report http://www.bikewalkalliance.org/resources/benchmarking
Chapter 2: Setting the Stage I 5are not counted as bicycle commuters per the ACS 2 and recreational / BICYCLE CRASHES IN NEW JERSEY
utilitarian bicycling trips are completely unaccounted for.
Figure 2: Bicycle Commuters in New Jersey (2008-2013) INTRODUCTION
18,000 Bicycle Commuters Trend Line Bicyclist crash data in New Jersey was examined for the six-year period
16,000
from 2008–2013 3. Six years of data are used in order to provide a
14,000
12,000
robust picture of the underlying patterns and trends and create an
10,000 understanding of the dimensions of the problem: who is being hit, by
8,000 whom, and under what circumstances. Bicyclist crashes were divided
6,000
into four categories – fatal crashes, incapacitating crashes, moderate
4,000
2,000
injury/complaint of pain crashes and property damage only crashes 4.
- While fatal crashes are critical events and often used as a primary
2000 2005 2006 2007 2008 2009 2010 2011 2012 2013 2014 safety metric, severe crashes may have similar contributing factors.
Analysis of both fatal and incapacitating crashes may allow a better
Source: Census 2000 and American Community Surveys identification of circumstances that addresses both fatalities and
severe injuries in tandem.
As the interest in bicycling continues to grow, New Jersey must
increase its efforts to make the bicycling environment safer and more
accessible to all bicyclists.
3
The six year (2008-2013) reporting period was selected for the Bicycle Safety
Action Plan as 2013 data is the most recent complete dataset on bicycle
crashes and this would be comparable to the 6 year reporting period (2006-
2011) used for the Pedestrian Safety Action Plan.
4
Incapacitating crashes are crashes where the bicyclist has a non-fatal injury
2
The ACS does not fully capture bicycling commuters due to the survey and cannot walk, drive or normally continue the activities that they could
methodology. Survey respondents are required to identify which transport perform before the motor vehicle crash. Moderate injury crashes are where an
mode they used the most within the previous week. Commuters that bicycle to evident injury, other than fatal and incapacitating occurred and the injury is
a train station and travel by transit to work would only be identified as a transit visible such as a lump on head, abrasion, bleeding or lacerations. Complaint
commuter. A 2013 VTC Study (Bicycling to Rail Stations in New Jersey: 2013 of pain crashes are where the bicyclist claims injury that is not fatal,
Benchmarking Report) counted bicyclists to and from 30 train stations in New incapacitating or moderate and is not visible to the investigating officer.
Jersey. The study also concluded that the ACS may not be capturing all bicycle Property damage only crashes are crashes where the bicyclist has no injury
commuters in New Jersey. and only damage to property occurred as a result of the crash.
6 I Chapter 2: Setting the StageSIGNIFICANT FINDINGS
CRASH DATA LIMITATIONS
Data limitations have an effect on one’s ability to draw conclusions There are a number of concerns regarding the quality of available
and make certain judgments regarding the safety of bicycle travel or data used in this report that limit one’s ability to draw conclusions
the actual impact of specific crash related variables. However, the and make certain judgments regarding the safety of bicycle travel.
following is a synopsis of inferences and conclusions that can be Some of these limitations are as follows:
drawn:
• Bicycle crashes including those resulting in fatalities or injuries
Overview of Crash Statistics can occur when there is no motor vehicle involved. Data on
• While not of the same magnitude as the pedestrian crash problem, these types of crashes is unavailable and as a result there is
a substantial number of bicyclists are injured or killed each year in likely an undercount of fatal and injury producing bicycle
motor vehicle crashes in New Jersey. crashes.
• On average, 2,400 bicyclists were struck by motor vehicles each • Incomplete or missing data in the motor vehicle crash records,
year from 2008–2013. During the same time, an average 16 especially in fatal and incapacitating injuries where the
bicyclists were killed each year and 62 bicyclists had incapacitating bicyclist involved was unable to provide input. For example:
injuries. o 14% of records were missing the gender of the motor
• The number of bicyclists involved in, killed or injured in non-motor vehicle driver
vehicle crashes is unknown. o 15% of records were missing the age of the motor vehicle
• Bicycle crash fatalities by population and as a percent of all crash driver
fatalities seems to be trending downward at the state level. o 18% of records were missing bicyclist pre-crash action
o 20% of records were missing age of bicyclists
• There is a need for better and more complete bicyclist crash data.
o 21% of records were missing information on traffic
Where do bicycle crashes occur? control
o 39% of records were missing contributing circumstances
• Bicycle crashes tend to occur more frequently in urban and shore
o 70% of records were missing information on safety
communities.
equipment use (helmets)
• Six counties (Bergen, Ocean, Hudson, Monmouth, Middlesex, and o 88% of records were missing information on whether or
Essex) accounted for more than 50% of all crashes. Bergen County
not the crashes were hit-and-runs
had the highest number of crashes.
• The lack of a reliable source of exposure data is also a major
• Cape May County had the highest average bicyclist crash rate (9 deficiency in contextualizing bicycle crash data.
bicycle crashes per 10,000 persons), followed by Atlantic (4.5) and
Ocean Counties (4.1). Conclusions and findings about the relative safety of bicycling or
• Jersey City had the highest number of bicycle crashes (575), the extent to which safety is influenced by changes in a given
followed by Newark (388) and Lakewood (311). variable must be considered in light of these data limitations.
Chapter 2: Setting the Stage I 7Roadway Characteristics Why do bicycle crashes occur?
• A majority of bike crashes and fatal bike crashes in New Jersey takes • Alcohol seems to play a relatively minor factor in bicycle crashes in
place at intersections. This is contrary to the experience of the New Jersey. This is contrary to the experience of the Unites States as
Unites States as a whole. a whole.
• More bike crashes take place on municipal roads; more fatalities • Inattention and failure to yield the right of way were the most
occur in crashes on state roadways. common contributing circumstances for both motorists and
• Most bike crashes occur on roadways with posted speeds of 25 bicyclists.
mph or lower; most fatal (bike) crashes occur on roadways with
posted speed limits above 40 mph and virtually no bicycle crashes What were the bicyclists and motorists doing?
occur on roads with posted speeds of 60 mph or above. • Most bicyclists (58%) were going straight ahead prior to crashing.
• On balance, it appears that darkness or low roadway lighting • While almost half of motorists were also going straight ahead, a
conditions is a factor in bike crashes, particularly fatal bike crashes. significant number of motorists (32 %) were making turns.
When do bicycle crashes occur?
• More bike crashes, regardless of severity, take place during late
afternoon and early evening than at other times of the day.
• A peak in bicycle crashes occurs during the summer months (June,
July, and August).
• Day of the week seems not to be a factor as crashes were generally
evenly distributed throughout the week.
Bicyclist and Motorist Characteristics
• A significant majority of bicyclists involved in all bike crashes (80%)
and fatal crashes (85%) in New Jersey are male.
• The annual bicyclist crash rate is highest among the 15-17 age
group followed by the 10-14 age group. Bicyclists 15-17 years old
also had the highest fatality and injury rates.
• Male drivers were involved in more bicyclist crashes than female
drivers and this was the case across all age groups. There was no
significant overrepresentation of crashes based on motor vehicle
driver age. On-road bicyclists, Morristown
Image: The RBA Group
8 I Chapter 2: Setting the StageOVERVIEW OF CRASH STATISTICS BICYCLIST FATALITIES IN NEW JERSEY
From 2008–2013, a total of 14,598 bicyclist crashes were reported in New Jersey exhibits a lower bicyclist fatality rate per capita than the
New Jersey. Figure 3 below shows those bicycle crashes by severity. national average (Figure 5). In addition, the bicyclist fatality rate in
New Jersey has been declining from 2008-2013.New Jersey's
Figure 3: Bicyclist Crashes by Severity in NJ (2008-2013)
percentage of bicyclist fatalities as a percentage of all traffic fatalities
has consistently been higher than the United States. However, there is
a downward trend in bicyclist fatalities as a percentage of traffic
fatalities in New Jersey and an upward trend in the United States.
Within New Jersey, bicyclist fatalities account for 2-3% of all traffic
fatalities in a typical year. This is slightly higher than the national
percentage, where approximately 2% of roadway fatalities are
On average, 2,400 bicyclists were struck by motor vehicles each year
bicyclists. This statistic is heavily influenced by overall trends in vehicle
from 2008–2013. During the same time, on average 16 bicyclists were
occupant fatalities. Since New Jersey has among the lowest rates of
killed each year and 62 bicyclists sustained incapacitating injuries.
vehicle occupant fatalities, this tends to inflate the ratio of bicyclists to
Analysis of the three-year moving average indicates a downward trend
all fatal crash victims.
in bicyclist crashes and incapacitating injury crashes from 2008–2013,
while the number of fatal crashes has been fairly consistent (Figure 4). Figure 5: Bicyclist Crash Fatalities in the US and New Jersey (2008-2013)
Figure 4: Bicyclist Crashes by Year & Severity in NJ (2008-2013)
90
80 Fatal
70
60
Incapacitating
50
40
3 yr Mov. Avg.
30 (Fatal)
20
3 yr Mov. Avg.
10 (Incapacitating)
-
2008 2009 2010 2011 2012 2013
Source: Plan4Safety Data, 2008–2013
Source: Plan4Safety Crash Data (2008–2013), Census 2010, American Community Survey
Chapter 2: Setting the Stage I 9Figure 6: Bicycle Crash Locations in NJ (2008–2013)
WHERE DO BICYCLE CRASHES OCCUR?
In New Jersey, bicyclist crashes are the highest in dense urban counties
and in shore communities (Figure 6). Fatal crashes tend to occur in all
parts of the State. Bicyclist crash data was further analyzed by county
and the top ten high crash municipalities, corridors and intersections.
Crashes by County
From 2008–2013, there were more than 1,000 reported bicyclist
crashes each in Bergen, Ocean, Hudson, Monmouth, Middlesex, and
Essex counties (Figure 7). These six counties account for more than
50% of all bicyclist crashes in New Jersey, more than 35% of fatal
crashes, and more than 30% of incapacitating crashes. Cape May,
Atlantic, Hudson and Ocean counties have the highest 2013 bicyclist
crash rates per 10,000 people.
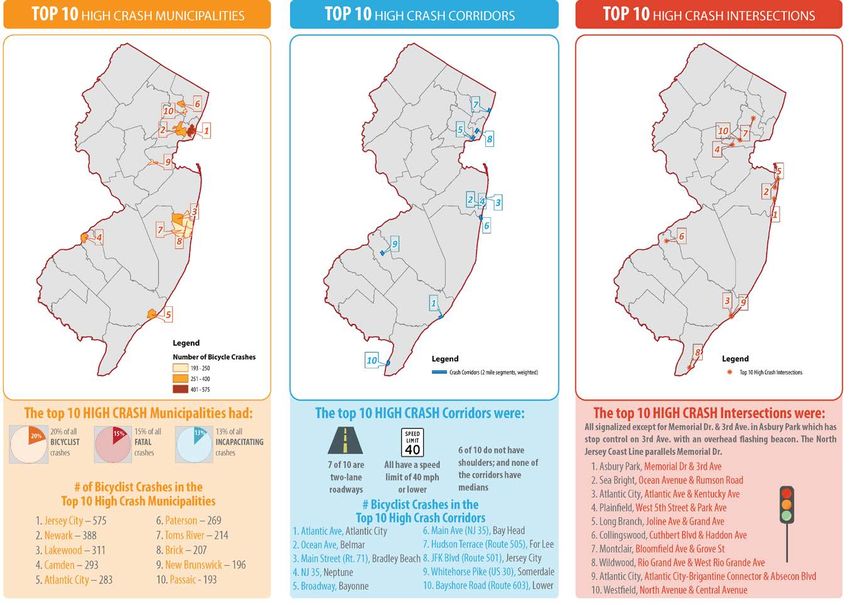
Figure 8 shows the top ten high crash municipalities, corridors (2 mile)
and intersections. As expected, most of the high crash corridors and
intersections are in dense urban or shore communities. Figure 8 also
highlights the key characteristics of the high crash corridors and
intersections.
Figure 7: Bicyclist Crash Data for High Crash Counties (2008–2013)
Total Bicyclist Crashes Average Annual Bicyclist Crash Rate
(2008–2013) (per 10,000 population) (2008 - 2013)
1,560 Bergen 9.0 Cape May
1,397 Ocean 4.5 Atlantic
1,349 Hudson 4.1 Ocean
1,218 Monmouth 3.6 Hudson
1,113 Middlesex 3.2 Monmouth
1,103 Essex 2.8 NEW JERSEY
14,598 NEW JERSEY
Source: Plan4Safety Crash Data (2008–2013), Census 2010, American Community Survey
10 I Chapter 2: Setting the StageFigure 8: Top 10 High Crash Municipalities, Corridors and Intersections in New Jersey (2008–2013)
Chapter 2: Setting the Stage I 11ROADWAY CHARACTERISTICS Roadway Jurisdiction
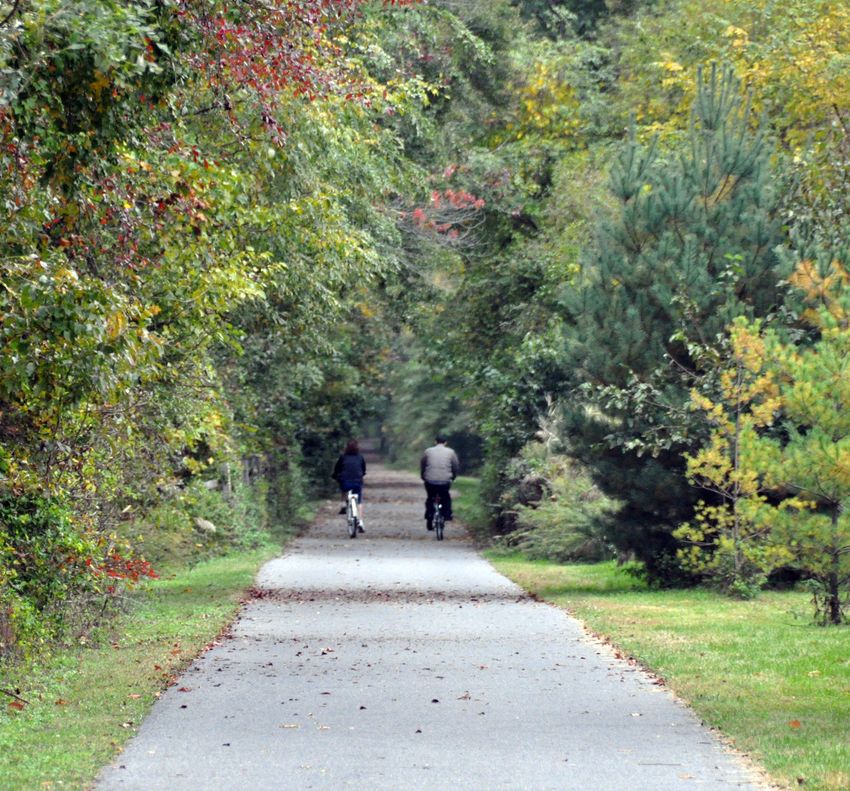
Almost half of all reported bicyclist crashes in New Jersey occurred on
Intersection Proximity municipal roadways, another third on county roadways, 15% on state
In New Jersey from 2008–2013, 45% of all reported bicyclist crashes roadways and the remaining 6% on private property (Figure 10).
occurred away from intersections and 55% occurred at intersections. However, for fatalities the pattern is different with 43% of the fatal
Fatal, incapacitating, moderate injury/pain and PDO bicyclist crashes bicyclist crashes occurring on state roadways, 30% on county
followed the same pattern. This differs from the national trends, where roadways and 27% on municipal roadways.
almost a third of the bicyclist fatalities occur at intersections, 60%
occur away from intersections and the remaining occur at other
Figure 10: Bicycle Crashes by Roadway Jurisdiction in NJ (2008-2013)
locations. 50% 45%
40% 34%
Posted Speed 43%
In New Jersey, more than half of all reported bicyclist crashes (55%) 30%
occurred on roadways with 25 mph or slower speed limits. Fatal 30%
20% 27% 15%
crashes occurred on high and low speed limit roadways. However, the
10%
proportion of fatal crashes to all crashes was greatest for the 50-55 Fatal Crashes Injury & PDO Crashes
mph range and was lowest for the 25 mph or under range (Figure 9). 0%
Municipal County State
Figure 9: Fatal & All Bicyclist Crashes by Posted Speed in NJ (2008-2013) * This chart does not include all jurisdiction categories. The categories that were
not included are interstate, government property and unknown.
60% 55%
50% Source: Plan4Safety Crash Data (2008–2013)
Fatal All crashes
40%
30% 27%
19%
20% 27% 28%
10% 16% 5%
12% 1%
0% 0%
25 mph or under 30 - 35 mph 40 - 45 mph 50 - 55 mph 60 mph or higher
Source: Plan4Safety Crash Data (2008–2013)
High Crash Intersection: Bloomfield Avenue, Montclair
Image: www.maps.google.com
12 I Chapter 2: Setting the StageLighting Conditions Number of Lanes
From 2008–2013, almost 75% of all reported bicyclist crashes occurred Most bicycle crashes, regardless of severity, appear to occur on two-
during daylight in New Jersey (Figure 12). This seems to make intuitive lane roadways (Figure 11).
sense, since more bike riding takes place during the day, than in the
Figure 11: Bicyclist Crashes by Number of Lanes in NJ (2008-2013)
night. In contrast, almost half of the fatal crashes occurred during
70.0%
daylight, and another 42% occurred during the dark and this is
comparable to the national pattern. However, a third of the New 60.0%
Killed Incapacitated Moderate Injury/Pain
Jersey’s fatal bicyclist crashes and almost 20% of all bicyclist crashes 50.0%
occurred in the dark with street lights on (continuous or spot),
40.0%
suggesting that streetlights may not adequately light up the roadway.
30.0%
Figure 12: Bicyclist Crashes by Lighting Conditions & Severity in NJ 20.0%
(2008-2013)
10.0%
100%
90% 0.0%
80% Daylight 1 Lane 2 lanes 3 lanes 4 lanes 5 lanes 6 lanes Unknown
70%
60% Source: Plan4Safety Crash Data (2008–2013)
50% Dawn or
40% Dusk
30%
20% Dark
10%
0%
Fatal Incapacitated Moderate Injury… PDO
Source: Plan4Safety Crash Data (2008–2013)
Ambient Conditions
Almost 90% (or 12,944) of the reported bicyclist crashes occurred
under clear conditions in New Jersey. Another 1,000 (7%) crashes
occurred when it was raining, and 564 (4%) occurred during overcast
skies. The same pattern is seen for fatal crashes, incapacitating crashes, High Crash Roadway: Hudson Terrace, Fort Lee
moderate injury/pain crashes and property-damage-only crashes. Image: www.maps.google.com
Chapter 2: Setting the Stage I 13WHEN DO BICYCLE CRASHES OCCUR? BICYCLIST AND MOTORIST CHARACTERISTICS
As expected, most reported bicycle crashes (42%) occurred during the Age of Victims
summer, with the highest number of crashes occurring in July. This Children and teens up to age 17 were involved in 3,555 (25%) crashes. 5
makes intuitive sense, since it is reasonable to assume that people More than 20% of the crashes involved bicyclists 25-44 years old and
bicycle more during the summer months. About half of the bicyclist another 18% of crashes involved bicyclists in the 45-64 age cohort.
crashes occurred in the fall (26%) and spring (22%) months, while only
10% occurred during winter months. In comparison, while bicyclist Figure 14: Bicyclist Crashes by Age in NJ (2008-2013)
fatalities are also highest in the summer months (40%), the remaining 4,000
60% are more evenly spread out during the winter (21%), fall (16%)
3,000 All Crashes
and spring (22%) months.
2,000
The highest number of crashes takes place during the afternoon and
early evening (Figure 13) hours. More than a third of all bicycle crashes 1,000
occurred between 4 p.m. and 8 p.m. and another 27% occurred
-
between noon and 4 p.m.
Under 5 5 to 9 10 to 14 15 to 17 18 to 24 25 to 44 45 to 64 65 to 84 > 84
Figure 13: Bicyclist Crashes by Severity and Time of Day in NJ (2008-2013
Source: Plan4Safety Crash Data (2008–2013)
40%
35%
The annual bicyclist crash rate 6 per 100,000 people is the highest
30%
among the 15 to 17 age group (10 crashes per 100,000 people) and the
25%
10 to 14 age group (8.5 crashes per 100,000 people). New Jersey’s
20%
overall annual bicyclist crash rate is 4.6 per 100,000 people (Figure 14).
15%
10%
Bicyclists 15 to 17 years old also had the highest fatality (0.54 per
5%
100,000 people) and injury rates (85 per 100,000 people).
0%
Midnight - 4 a.m. - 7:59 8 a.m. - 11:59 Noon - 3:59 4 p.m. - 7:59 8 p.m. - 11:59
3:59 a.m. a.m. a.m. p.m. p.m. p.m. 5
Please note that bicyclist age data was missing from almost 20% or 2,886 bicyclist
Fatal Incapacitated All Crashes crash records.
6
The annual crash rate was calculated by dividing the total crash rate for 2008-2913 by
6 (for the six years of the study period). The total crash rate was calculated by dividing
Source: Plan4Safety Crash Data (2008–2013) all bicyclist crashes (2008-2013) by sum of the population from 2008-2013 in that age
group.
14 I Chapter 2: Setting the StageGender of Victims Age and Gender of Motor Vehicle Drivers
The majority of bicyclists (80%) involved in crashes in New Jersey were Overall, male drivers were involved in 49% of the reported crashes and
males 7 and 15% were females (Figure 17). Nationally in 2013, the female drivers were involved in 37%. Gender split was similar across all
majority of bicyclists killed (87%) (Figure 18) were also males. During age groups. There was no significant overrepresentation of crashes
the same time in New Jersey, 85% of bicyclist crashes with fatalities based on driver age. The four 10 year age groups from 16-55 were
involved male bicyclists (Figure 19). each involved in approximately 15-17% of bicyclist crashes. The
number and percentage of older drivers involved in bicyclists crashes
Figure 17: Bicyclist Crashes by Gender in NJ (2008-2013) trended downward after age 55 (Figure 20).
4%
Figure 20: Bicyclist Crashes by Driver Age and Gender in NJ (2008-2013)
Male
15% 2500
Male Female Unknown
Female
2000
Unknown
1500
81% 1000
Figure 18: Fatal Bicyclist Crashes by Figure 19: Fatal Bicyclist Crashes by 500
Gender in U.S. (2013) Gender in NJ (2008-2013
13% Male 2% Male 0
13% 16 to 25 26 to 35 36 to 45 46 to 55 56 to 65 66 to 75 > 75 Unknown
Female Female
Unknown Source: Plan4Safety Crash Data (2008–2013)
Alcohol Involvement
Alcohol seems to be a somewhat minor factor in bicyclist crashes in
New Jersey as 96% of the bicyclists tested had no alcohol involvement,
87% 85% and only 4% did. For fatal crashes, a somewhat higher percentage
(14%) had alcohol involvement. Of motor vehicle drivers tested, 20%
Source: Plan4Safety Crash Data (2008–2013) had a BAC of 0.01 g/dL or higher. This differs from national trends
where alcohol was a factor – either bicyclist or motor vehicle drivers --
7
in more than a third of the fatal crashes.
Please note that gender data was missing for almost 4% or 586 bicyclist crash records.
Chapter 2: Setting the Stage I 15WHY DO BICYCLE CRASHES OCCUR? Contributing Circumstances
Data on contributing circumstances describes the cause or causes of
Pre-Crash Action the crashes wherever possible (Figure 22). Up to two contributing
The top 5 pre-crash actions of bicyclists and motorists involved in all circumstances can be entered on each crash record. Contributing
reported bicyclist crashes in New Jersey from 2008–2013 are circumstances include motorist and bicyclist actions, roadway
summarized below in Figure 21. A large majority of bicyclists (8,428) conditions, and vehicle factors.
were simply going straight ahead prior to the crashes. Around 700
were making left or right turns (not turn on red) and another 500 Figure 22: Bicyclist & Motorist Contributing Circumstances in NJ
bicyclists were either merging or entering the traffic lane. Some (2008–2013)
bicyclists (164) were riding on the shoulder prior to the crashes.
Figure 21: Bicyclist & Motorist Pre-Crash Action in NJ (2008–2013)
Source: Plan4Safety Crash Data (2008–2013) Source: Plan4Safety Crash Data (2008–2013)
16 I Chapter 2: Setting the StageFor bicyclists and motorists, driver inattention was the leading cause BICYCLES AND THE LAW IN NEW JERSEY
for reported crashes followed by failure to yield to right of way to
In New Jersey, bicycles are not considered vehicles though bicyclists
vehicle / pedestrian. Wrong way bicycle riding was involved in almost
have the same rights and responsibilities as drivers of motor vehicles
a thousand crashes (946 or 5.5%) and failure to obey traffic control
device cause was deemed to contribute to another 816 crashes or (New Jersey Statutes Annotated – NJSA, Title 39:4-14.1). Having the
almost 5%. Fatal, injury and property damage crashes follow the same same rights and responsibilities as a motorist means bicyclists are
pattern. required to obey the “rules of the road”. This includes keeping to the
right and obeying all traffic control devices. What is often overlooked
HELMET USE is that bicyclists are in fact vulnerable users. They do not have the
protective benefits that motorists do, such as the sheer mass of the
Of the bicyclists involved in all crashes only 9% were wearing helmets.
vehicle compared to a person on a bicycle, being enclosed and
Crashes with incapacitating injuries and moderate injuries or pain
protected in a steel “cocoon” designed to absorb and dissipate the
follow the same pattern as all crashes. Analysis of helmet use by age of
effects of a crash, and other safety devices like air bags and seatbelts.
bicyclist indicates that 900 children bicyclists (17 years and younger)
involved in crashes do not wear any safety equipment, which is
required by law. Only 323 bicyclists 17 years and younger were
wearing helmets. By comparison, helmet use is relatively high (514) for
bicyclists 45 years and older.
Motor vehicle blocking bicycle lane, Jersey City.
Bicyclist riding without a helmet. Image: The RBA Group
Image: The RBA Group
Chapter 2: Setting the Stage I 17WHAT THE NEW JERSEY STATUTES SAY that will reflect an approaching vehicle’s lights from 50 to 300
feet away, (Title 39:4-10)
This section provides an overview of the bicycling laws and regulations
• A bicycle must have a bell or other audible signal that can be
in New Jersey. This review provides insight on the efficacy of current
heard from at least 100 feet away. Sirens or whistles are not
laws pertaining to bicycling in New Jersey and highlights areas where
permitted, (Section 39:4011)
additional laws and policies could improve bicycle safety in New
• A bicycle must have brakes to stop safely (Section 39:4-11.1)
Jersey. NJSA Title 39 presents the New Jersey Motor Vehicle and Traffic
• A bicycle must have a seat and a bicyclist is required to use the
Regulations. It includes both motor vehicles laws as well as the state
seat, place the feet on the pedals and the hands on the
bicycling laws. Section 39:4-14.5 provides the definition of a bicycle as
handlebar at all times, (Section 39:4-12)
“any two wheeled vehicle having a rear drive which is solely human
• A bicyclist is not permitted to hitch rides with another vehicle,
powered and having a seat height of 25 inches or greater when the
(Section 39:4-14)
seat is in the lowest adjustable position”. The following laws and
• A bicyclist is required to ride as near to the right roadside as
regulations cover operating requirements and required equipment
practicable, exercising due care when passing a standing
related to operating a bicycle in New Jersey.
vehicle or one proceeding in the same direction, (Section 39:4-
• Anyone under 17 years of age that rides a bicycle or is a 14.2)
passenger on a bicycle, or is towed as a passenger by a bicycle A bicyclist may move left under any of the following
must wear a safety helmet. Exemptions from the helmet conditions:
requirement are persons who operate or ride a bicycle (as a o To make a left turn from a left-turn lane or pocket;
driver or a passenger) on a roadway closed to motor traffic; on o To avoid debris, drains or other hazardous conditions
a trail, route, course, boardwalk, path or area set aside only for that make it impracticable to ride at the right side of
the use of bicycles. These exemptions do not apply if the areas the roadway;
of operation are adjacent to a roadway and not separated from o To pass a slower moving vehicle;
motor vehicle traffic by a barrier that prevents the bicycle from o To occupy any available lane when traveling at the
entering the roadway. Bicyclists or passengers operating in an same speed as other traffic; or
area where helmets are not required who need to cross a road o To travel no more than two abreast when traffic is not
or highway should walk with the bicycle. (Section 39:4-10.1) impeded, but otherwise ride in single file. Every person
• A bicycle must be equipped with a front white light and a rear riding a bicycle is required to ride in the same direction
red light that are easily visible from a distance of at least 500 as vehicular traffic.
feet. Additionally, a red reflector may be mounted to the rear • Bicycle salespersons and rental agents must display a sign at
least 15 inches long and 8 inches wide at the point where the
transaction is completed when they sell or rent a bicycle. This
18 I Chapter 2: Setting the Stagesign should read: “STATE LAW REQUIRES A BICYCLE RIDER is. New Jersey is one of only 13 states without a law regarding
UNDER 17 YEARS OF AGE TO WEAR A HELMET.” In the case of motorists passing bicyclists.
bicycle rentals, the salesperson/rental agent must provide a
helmet, if necessary, for a fee. (Section 39:4-10.3)
In case of violation of the helmet law, the parents of children involved
could be fined $25 for a first offense and a second offense could result
in a $100 penalty. Violation of the other laws as per the NJ Statewide
Violations Bureau Schedules could be a fine of up to $54 and typically
depends on local police policy.
WHAT’S MISSING
While the New Jersey statutes cover aspects of the law that relate to
bicycling safety the statutes are silent on a number of issues that are
addressed in the statutes of some other states. Passage of statutory
language that revises or adds to the statutes as they pertain to bicycle
travel has the potential to contribute greatly to the safety of bicycling
in the state. These include the following:
Safe Passing Distance Law
Safe passing distance laws provide protection for bicyclists by making
it clear to drivers that passing a bicyclist safely means leaving a certain
Map of States with Statutes Regarding Motorists Passing Bicyclists
(defined in the law) amount of space between the bicyclist and Image: National Conference of State Legislatures
motorist. In most instances, safe passing laws say that three feet
between the bicyclist and motor vehicle is required. However, some Vulnerable Road User Laws
states define other specific distances or define what a safe distance is Vulnerable Road User laws provide legal protection to people who are
through context – such as the space needed to avoid a bicyclist if he or not protected as drivers or passengers in motor vehicles are. When
she fell. N.J.S.A. Section 39:4-85 states that a vehicle shall pass another evaluating vulnerable road user laws, the League of American
vehicle at a “safe distance”. Technically this does not address a Bicyclists looks for states that have: 1) a definition of “vulnerable (road)
motorist passing a bicyclist and does not specify what a “safe distance” user” and 2) distinct penalties for the serious injury or death of a
vulnerable road user when a motorist hits them while doing actions
Chapter 2: Setting the Stage I 19You can also read