Unicef's Water Game Plan: Universal safe and sustainable water services for all by 2030 - March 2020
←
→
Page content transcription
If your browser does not render page correctly, please read the page content below
Unicef’s Water Game Plan:
Universal safe and sustainable
water services for all by 2030

                                 March 2020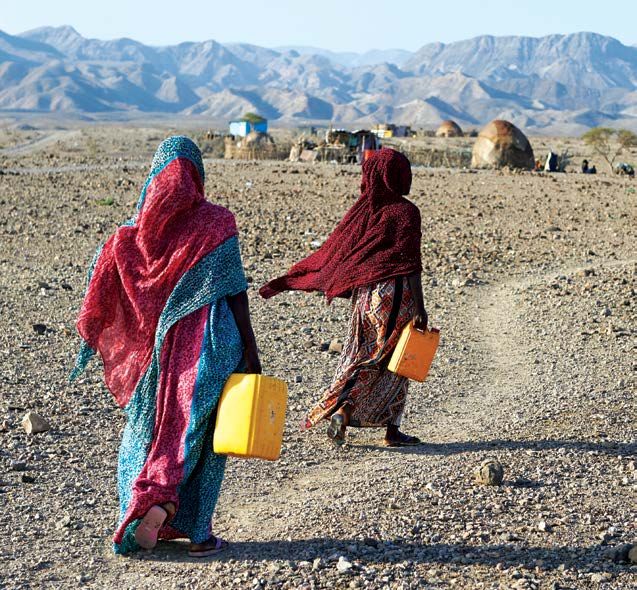
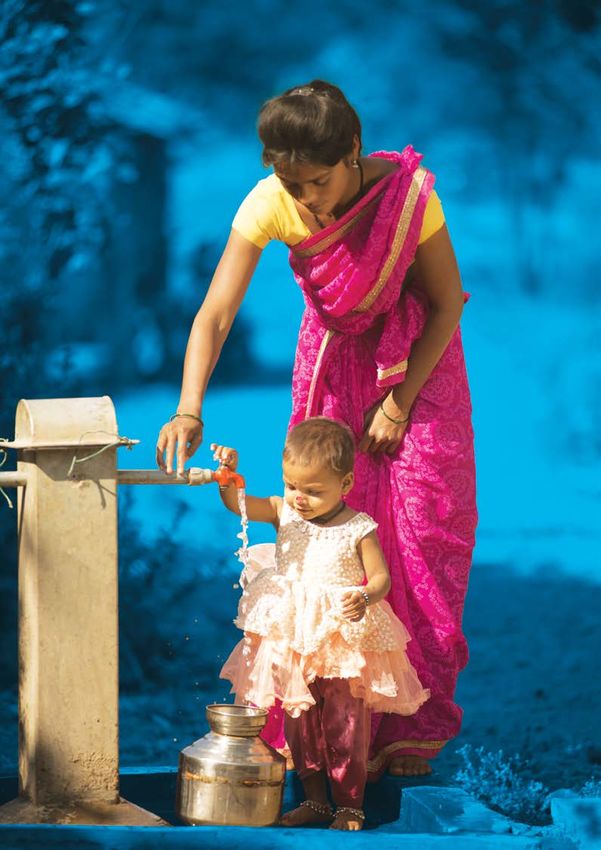
A technical working group was formed comprised of headquarters,
regional office and country office staff during the development of this
water game plan and drafts were reviewed in global and regional
network meetings.
The designations employed in this publication and the presentation of
the material do not imply on the part of UNICEF the expression of an
opinion concerning the legal status of any country or territory, or of its
authorities or the delimitations of its frontiers. While this publication
outlines UNICEF’s approach to programming, statements in this
document do not imply or constitute official opinions or policy positions
of either the United Nations or UNICEF.

Cover photo credit: © UNICEF/UN0310612/Harikrishna Katragadda
Photo description:
Pooja Namdev fetches drinking water supplied by the 900W solar panel
which fills up a 5000L tank for 27 families in Kalajahi Thakar Vasti in
Kanesar village, Khed, Pune, India.

For more information on this publication and UNICEF’s water
programmes, please contact Silvia Gaya (sgaya@unicef.org), Jorge
Alvarez-Sala (jalvarezsala@unicef.org), Fiona Ward (fward@unicef.org)
or Irene Amongin (iamongin@unicef.org).
Contents
1.   Vision                                                                   4

2.   Background                                                               5

3.   The Water Game Plan’s rationale and objectives                           7

     UNICEF´s ambition: Universal safe and sustainable water services for     9
     all by 2030

4.   A geographical focus: The 33 Water Game Plan countries                  12
        Regional analysis                                                    13
        Country prioritisation                                               16

5.   Implementing the Water Game Plan                                        20
        Water safety and water quality                                       21
        Sustainability of water services                                     23
        Shifting to climate-resilient WASH programming                       24
     The Water Game Plan’s programmatic pathways                             25
     Zero with No Access package (MDG unfinished business towards Basic+2)   27
         Pathway 1: From Surface/Unimproved service to Basic+2               27
     SDG Acceleration package                                                28
         Pathway 2: From Limited to Basic +2 (or Safely Managed)             28
         Pathway 3: From Basic to Basic +2 (or Safely Managed)               29
         Pathway 4: From Basic+2 to Safely Managed water supply              31
     SDGs in Emergencies and Protracted Crisis package                       32
         Pathway 5: In Emergency contexts to Basic+2 / Safely Managed        32
     All pathways: Key approaches and new ways of working                    33
         Enabling environment and systems strengthening                      33
         Addressing rapid urbanisation                                       35
         Water in institutions, as part of water services delivery models    36
         Considerations on equity, gender and youth engagement               36
         Disabilities                                                        38

6.   Water Game Plan milestones                                              39

7.   Monitoring                                                              41

Annex 1: Additional resources available                                      42
Annex 2: Climate risk assessments for Water Game Plan countries              48
The Water Game Plan countries assessed against climate major climate risks   50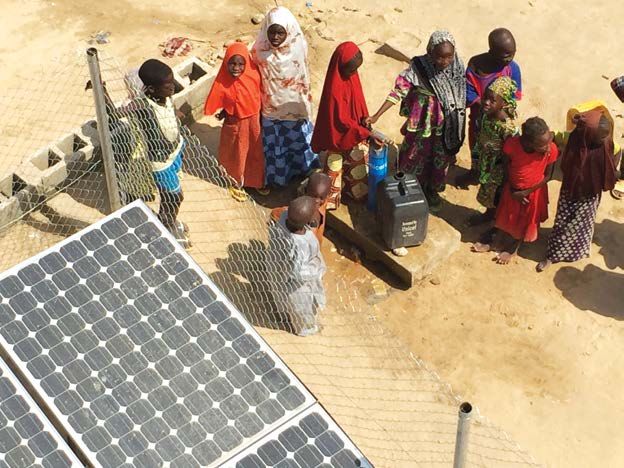
unicef’s WATER GAME PLAN:
    Universal safe and sustainable
    water services for all by 2030

    Vision

    Access to clean water is a fundamental human                                         Only 1 in 5
    right, and a prerequisite for the realisation of many
    other human rights.1 UNICEF works towards its
                                                                                         countries below
    progressive realisation with a focus on priority                                     95% coverage
    interventions for children, vulnerable families                                      is on track to
    and communities, in both humanitarian and
    development contexts.                                                                achieve universal
    Achieving universal access to water sources
                                                                                         basic water
    that are improved, with a round trip for water                                       services by 2030
    collection not exceeding 30 minutes, safe from
    contamination, and available when needed is
    at the heart of the Sustainable Development                                       safely managed drinking water. The Water Game
    Goal (SDG) target 6.1, with the ultimate aim of                                   Plan helps operationalise the SDGs’ call to ‘leave
    having drinking water accessible on premises                                      no one behind’ – and focuses on reaching those
    (e.g. at home). However, in 2017 the population                                   furthest behind first.
    lacking basic water services (meeting improved
    and collection time criteria only) was 785 million                                The Water Game Plan outlines UNICEF’s
    globally, including a worrying number collecting                                  programmatic focus and approaches in water
    water directly from surface water sources –                                       provision over the life of the UNICEF current
    estimated at 144 million people. If current trends                                Strategic Plan to 2021, and beyond. It will help
    on water provision continue, global coverage                                      ensure that accelerating access to water services
    will be around 96 per cent in 2030, falling short                                 receives the deliberate and sustained attention it
    of universal access to even a basic service level                                 will require to succeed. Without a consistent focus
    and falling even shorter from the SDG target of                                   on the issue, there is no doubt that both the SDG
    universal safely managed water supply. Indeed,                                    objectives and UNICEF’s own objectives for water
    only one in five countries below 95 per cent                                      (as per Goal Area 4 in the Strategic Plan 2018-
    coverage is on track to achieve universal basic                                   2021, and consecutive Strategic Plans beyond
    water services by 2030.2 UNICEF’s strategy is                                     2021) will be jeopardised. The Water Game Plan
    to intensify the organisation’s interventions in                                  will ensure that there is a strong emphasis on
    those countries that are off track and/or have the                                both equity and the sustainability of results, with
    potential to be game changers, by accelerating                                    a strong focus on climate resilience, in line with
    action towards universal access.                                                  UNICEF’s Global WASH Strategy 2016-2030, and
                                                                                      UNICEF´s overall shift to climate-resilient WASH
    UNICEF’s commitment and ambition to support                                       programming.
    water services for the most disadvantaged are
    steadfast and stronger than ever. This document                                   Ultimately, the Water Game Plan sets out how
    presents UNICEF’s ‘game plan’ to contribute to                                    UNICEF can and will continue to do its part in
    achieve universal safe and sustainable water                                      ensuring the most children possible can grow up in
    services for all by 2030, and accelerate access to                                a safe and clean environment.

    1
        United Nations General Assembly resolution 64/292. The human right to water and sanitation. (2010). Available here.
    2
        UNICEF and WHO (2019). Progress on Household Drinking Water, Sanitation and Hygiene (2000-2017). JMP. Available here.

4       unicef’s water game plan: Universal safe and sustainable water services for all by 2030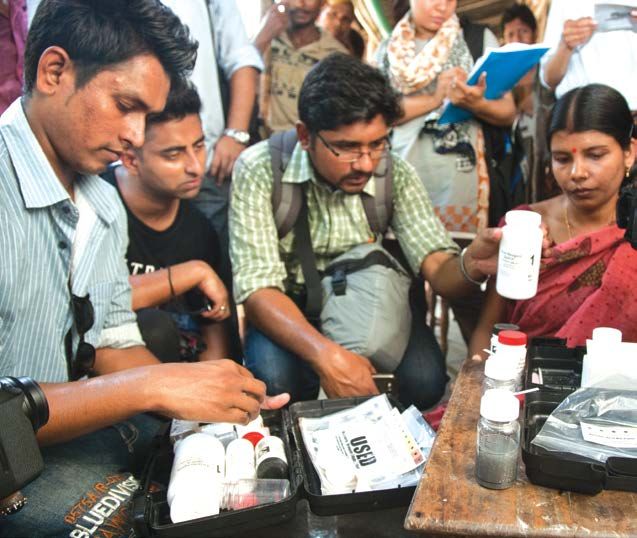
Background

Sufficient and consistent access to affordable,
safe and sustainable water is critical for the
development and wellbeing of children and
mothers. Insufficient access to water at home
impairs the physical and mental development of
children, directly and indirectly. Insufficient access
in schools lowers the enrolment, attendance
and participation of children, particularly girls;
and insufficient access in healthcare facilities
reduces the scale and impact of healthcare
                                                                                          Estimates for attaining
service delivery.3 Investing in drinking water has                                        universal access show a
an economic impact, with both health and socio-                                           global economic return
economic benefits. Indeed, estimates for attaining
universal access show a global economic return                                            on water spending of
on water spending of US$3.30 to US$4.40 per                                               US$ 3.30-4.40 per one dollar
dollar. The ratio is even higher in rural areas,
where the return on investment is estimated to be
US$6.80 for every dollar.4

As with human rights, many SDG Goals are inter-
                                                                                      people gaining access, to include a greater focus
linked, and the fundamental human necessity
                                                                                      on equity and improving the quality of services.5
for water makes achieving SDG 6 essential for
                                                                                      It has also meant increased consideration is now
progress on most other SDGs. The sustainable
                                                                                      given to the provision of water not just at home
management of water underpins efforts to end
                                                                                      but in early education facilities, schools and health
poverty, advance sustainable development,
                                                                                      care facilities, as well as other institutional and
and sustain peace and stability; it illustrates the
                                                                                      public settings.
cross-sectoral cooperation that will be essential
in achieving the SDGs. However, population                                            The shift to the SDGs has also made the case for
growth, the climate crisis, increasing inequity, and                                  a wider approach to managing water sustainably,
increasing demand for limited water resources                                         going beyond simply providing a safe water supply
are all unprecedented challenges to reaching                                          service. It is now recognised that providing such
these goals. Ensuring a balance is struck between                                     services requires addressing elements such as
access to water for the most vulnerable and                                           water quality, wastewater management, water
meeting the need for economic development                                             scarcity, service efficiency, water resources
requires collaboration across several sectors – as                                    management, and the protection and restoration
well as strong advocacy, innovation (including                                        of water-related ecosystems. UNICEF’s Strategy
innovative financing), and improved monitoring                                        for WASH (2016-2030)6 is aligned with this shift,
within the water sector itself. It is also critical that                              acknowledging that unless all aspects of SDG
those without safely managed water services                                           6 are addressed – beyond targets 6.1 (drinking
benefit from clear strategies to improve access to                                    water) and 6.2 (sanitation)– achieving universal
water supply and increase the levels of service.                                      access to safely managed drinking water will
Indeed, the transition from the Millennium                                            always be at risk.
Development Goals (MDGs) to the Sustainable
Development Goals has led to a change of focus,                                       The wider SDG global targets and indicators
away from simply considering the numbers of                                           related to water are set out below.

3
    Latest evidence desk review can be found here.
4
  Hutton G (2018). ‘Benefits and Costs of the Water Sanitation and Hygiene Targets for the Post-2015 Development Agenda’, in Prioritizing Development
(Chapter 23), Bjorn Lomborg [Ed], Cambridge University Press.
5
    In terms of time to collect water, water quality and availability.
6
    UNICEF (2016). Strategy for WASH (2016-2030). Available here.

                                                                     unicef’s water game plan: Universal safe and sustainable water services for all by 2030   5
Figure 1: SDG global targets and indicators related to water
SDG global targets SDG global indicators
6.1 By 2030, achieve universal and 6.1.1 Proportion of population using safely
equitable access to safe and affordable managed drinking water services
drinking water for all
1.4.1 Proportion of population living in
1.4 By 2030, ensure all men and women,
households with access to basic
in particular the poor and vulnerable,
services (including access to basic
have equal rights to economic resources
drinking water, basic sanitation and
as well as access to basic services
basic handwashing facilities)
4.a Build and upgrade education facilities that 4.a.1 Proportion of schools with access to...
are child, disability and gender sensitive (e) basic drinking water, (f) single-sex
and provide safe, inclusive and effective basic sanitation facilities, and (g) basic
learning environments for all handwashing facilities
3.8 Achieve universal health coverage
(UHC), including financial risk
protection, access to quality essential [Proportion of health care facilities with basic
health care services, and access to WASH services]
safe, effective, quality and affordable
essential medicines and vaccines for all
Source: Adapted from JMP’s 2019 report Progress on Household Drinking Water, Sanitation and Hygiene, 2000-2017.
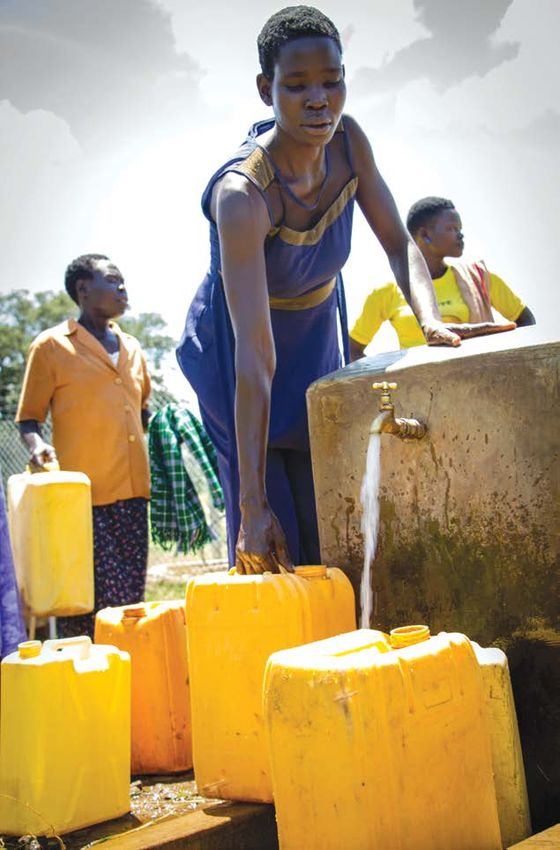
© UNICEF/Sierra Leone/2017/ Sam Phelps
6 unicef’s water game plan: Universal safe and sustainable water services for all by 2030
The water game plan’s rationale and objectives

The Water Game Plan outlines key principles
and approaches that support targeting those
that have been left behind first, as well as
promoting the acceleration of results towards
safe and sustainable water services.

Programmatic guidance is necessary given
context variations within and between regions,
and to consider the complexity of shifting water                                Key principles of the WASH
programmes, helping to move towards higher
levels of services that are not only safe and                                   Strategy:
sustainable, but also resilient to different shocks
and stresses. This needs to happen while                                            • To set the ambition
UNICEF water programming is broadening                                                towards 2030
its agenda to embrace work across SDG 6
targets, and beyond 6.1. The Water Game Plan                                        • To identify a set of priority
considers how to incorporate strategic learning                                       countries and expected
and recommendations from UNICEF´s Rural
Water Supply Evaluation (2006-2016)7 into                                             regional contributions
programming. In line with UNICEF’s overarching
global priorities, particular attention is given                                    • To define and prioritise
to equity, gender, adolescents, children with                                         the most appropriate
special needs and youth.
                                                                                      programmatic pathways
The Water Game Plan has been developed
incorporating the key principles of the UNICEF’s                                    • To provide UNICEF
Global WASH Strategy 2016-2030, and the                                               country offices with a
SDG agenda. Its objectives are:
                                                                                      compilation of further
     1. To set the level of ambition for water                                        guidance and resources.
        services towards 2030, aligned with
        UNICEF´s WASH strategy 2016-2030.
                                                                                    4. To provide UNICEF country offices with
     2. To identify a set of priority countries and
                                                                                       a set of up-to-date, evidence-based
        expected regional contributions towards
                                                                                       guidance and resources available to
        the key objectives of UNICEF’s Strategic
                                                                                       support them in the implementation of the
        Plan8 2018-2021 (at the level defined
                                                                                       Water Game Plan.
        by this Water Game Plan), increasing
        financial support to the most off-track                                 The target audience of the Water Game Plan is
        countries with the highest funding gaps.                                all UNICEF WASH staff working in design, plan,
                                                                                delivery and monitoring of water programmes.
     3. To define and prioritise the most                                       UNICEF Representatives and Deputy
        appropriate programmatic pathways,                                      Representatives might find this document useful
        based on context, that country offices                                  for the design and preparation of new Country
        can choose to follow, to progressively                                  Programmes, and for resource mobilisation
        increase water service levels.                                          purposes.

7
    Global evaluation of UNICEF’S drinking water programming in rural areas and small town (2006-2016) report can be found here.
8
    UNICEF Strategic Plan 2018-2021 can be found here.

                                                              unicef’s water game plan: Universal safe and sustainable water services for all by 2030   7
Figure 2: Combined 2016-2030 UNICEF’s Global WASH Strategy
       WASH                                     and Water Game Plan strategic frameworks
       Vision

                                         Realization of the human rights to water and sanitation

                                             WASH STRATEGY                                            WATER GAME PLAN
           Objectives

                                 By 2030, achieve universal and equitable                   •   Set level of ambition for water services
                                 access to safe and affordable drinking                     •   Agree on a set of priority countries
                                 water for all                                              •   Define programmatic pathways
                                                                                            •   Provide further guidance to country offices
       Programming

                                 •   Reduce inequality                                      • Contribute across SDGs
        Principles

                                 •   Sustain access to services at scale                    • Integrate humanitarian and development
                                 •   Promote resilient development                            programming
                                 •   Strengthen accountability at all levels                • Strengthen national systems
       Programming
        Approaches

                                                        Utilize          Leverage
                                  Strengthen                                                   Build                            Deliver
                                                      evidence          sustainable                           Empower
                                   enabling                                                 sustainable                      services and
                                                     to promote           financial                          communities
                                 environments                                                markets                           supplies
                                                     child rights        resources
       Programmatic “Pathways”

                                       ‘ZERO WITH NO                    ‘SDG ACCELERATION’                   ‘SDGs IN EMERGENCIES’
                                      ACCESS’ PACKAGE                         PACKAGE                               PACKAGE
           Water Game Plan

                                         (Pathway 1)                       (Pathways 2,3,4)                        (Pathway 5)

                                 •   Water safety and water quality                   •   Rapid urbanization
                                 •   Sustainability of water services                 •   Water in institutions
                                 •   Climate Resillience                              •   Equity, Gender and Youth engagement
                                 •   Enabling Environment                             •   Disabilities
           M&E

                                                          Evidence-based programming and monitoring

    The Water Game Plan is designed to help UNICEF country offices understand and align with the latest
    corporate commitments, and to provide further support on adapting UNICEF’s WASH strategy to their
    specific context.

8   unicef’s water game plan: Universal safe and sustainable water services for all by 2030
UNICEF´s ambition: Universal safe and
sustainable water services for all by 2030

UNICEF’s Strategy for WASH (2016-2030)
outlines the organisation’s vision for the
attainment of SDG 6.1. The UNICEF Strategic
Plan (2018-2021) is aligned with the WASH
strategy and includes measuring the “Number of
additional people with access to safe drinking
water services through UNICEF-supported
programmes”.

Meeting the SDG criteria for safely managed                                       The UNICEF Strategic Plan
drinking water services means that households                                     (2018-2021) is aligned
must be using a basic service that meets the
three criteria:
                                                                                  with the WASH strategy
                                                                                  and includes measuring
   ĥĥ Free from contamination: compliant                                          the “Number of additional
      with standards for faecal contamination
      (E. coli) and priority chemical
                                                                                  people with access to safe
      contamination (arsenic and fluoride).                                       drinking water services
   ĥĥ Available when needed: sufficient water                                     through UNICEF-supported
      available or at least 12 hours per day.                                     programmes”
   ĥĥ Accessible on premises: located within
      the dwelling, yard or plot.
                                                                              premises’), the capital investments required
While the Water Game Plan does support                                        to achieve the SDG target on safely managed
acceleration towards safely managed services                                  water services amount to about three times
(and therefore services that are ‘accessible on                               current investment levels.9

                                          Figure 3: A safely managed water service

                                                                  FREE FROM
                                           BASIC                CONTAMINATION
                                          SERVICE

                                                                     SAFELY
                                                                    MANAGED
                                                                    SERVICE
                                           AVAILABLE                                        ACCESSIBLE
                                             WHEN                                               ON
                                            NEEDED                                           PREMISES

9
  Hutton G, et al. (2016). The Costs of Meeting the 2030 Sustainable Development Goal Targets on Drinking Water, Sanitation, and Hygiene.
World Bank Group. Available here.

                                                            unicef’s water game plan: Universal safe and sustainable water services for all by 2030   9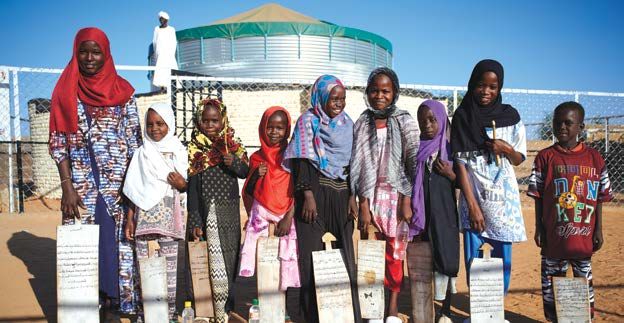
Figure 4: UNICEF´s Basic+2 service level

                                                  FREE FROM                 BASIC+2                AVAILABLE
                                                CONTAMINATION                                     WHEN NEEDED

                                                                               BASIC
                                                                              SERVICE

     Continuing on current trajectories, globally,                                       2. Also has +2 of the three components of a
     basic water service will reach only 96 per cent                                        safely managed service:
     by 2030, leaving 340 million people without
                                                                                               • Free from fecal and priority chemical
     even a basic water service level; approximately
                                                                                                  contamination
     21 per cent of the world’s population, or 1.8
     billion people, will not have a safely managed                                            • Available when needed.
     water supply as defined by the SDG targets.10
     Indeed, only one in five countries below 95 per                                  The ‘Basic+2’ service level in the Water Game
     cent coverage in 2019 is on track to achieve                                     Plan should be seen as a stepping stone on
     universal basic water services by 2030.                                          the path to universal coverage by 2030, while
                                                                                      ensuring UNICEF’s commitments on equity
     UNICEF’s Water Game Plan aims to sharpen                                         remain at the heart of everything we do,
     the focus of the organisation on the path to                                     ensuring that no one is left behind.
     2030, by identifying an intermediate service
     level between ‘basic’ and ‘safely managed’                                       The ambitions of UNICEF’s Water Game Plan
     service level ambition of the SDG. This                                          are aligned with its WASH strategy (2016-2030)
     intermediate service level is ‘Basic+2’; and is                                  and its strategic plan (2018-2021):
     defined as a service that:
                                                                                         ĥĥ An initial target that by 2021, more than
          1. Meets the JMP basic service levels of:                                         60 million people are directly supported by
              • An improved water source11                                                  UNICEF to gain access to at least Basic+2
                                                                                            water services, from 2018 to 2021;
              • Collection time not exceeding
                                                                                         ĥĥ By 2030, UNICEF has contributed to close
                 30 minutes (round trip including                                              the gap by ensuring at least universal safe
                 collection).                                                                  and sustainable water services (Basic+2)
                                                                                               for all.

     10
       Preliminary estimates are based on JMP’s 2019 report Progress on Household Drinking Water, Sanitation and Hygiene 2000-2017, assuming
     population growth and current progress trends.
     11
        Improved drinking water sources are those that have the potential to deliver safe water by nature of their design and construction, and include: piped
     water, boreholes or tubewells, protected dug wells, protected springs, rainwater, and packaged or delivered water. Source JMP WHO/UNICEF.

10    unicef’s water game plan: Universal safe and sustainable water services for all by 2030
Figure 5: Where Basic +2 service level fits in on the path to safely managed services12
Service
level
Safely
managed
5.3 billion
Universal access to safe and sustainable people
water services for all by 2030
Basic+2
Basic
1.4 billion
people
Limited
206 million
people
Unimproved
435 million
people
Surface Water
144 million
people [Number of people using respective service level in 2017]
Note: Total population in 2017 was 7.6 billion
Health & socio-economic benefits
Source: UNICEF & WHO, JMP data for 2017
The following table explains the different levels of water service as defined by the JMP, and includes
UNICEF´s Water Game Plan definition of Basic+2.
Table 1: Characteristics of water service levels
Safely
Indicator Surface Water Unimproved Limited Basic Basic+213
managed
Directly from From an
a river, dam, unprotected
Source lake, pond, dug well or Improved14
stream, canal or unprotected
irrigation canal spring
Collection time
exceeds 30 Accessed within a
Accessibility minutes for round trip of 30 minutes, On premises
a round trip, including waiting
including queuing
Free from contamination
Quality (bacteriological and priority
chemical contamination)
The service is available
when needed (i.e. sufficient
Availability water in the last week or
available for at least 12
hours per day)
12
It should also be noted that in 2017, a further 579 million people were estimated not to have direct access even to surface water sources.
13
Basic+2 is not a category in JMP but an intermediate step between basic and safely managed that UNICEF sets in its Water Game Plan 2020.
14
Improved sources are systems that have the potential to deliver safe water by nature of their design and construction: piped supplies such as households
with tap water or public stand-posts; and non-piped supplies such as boreholes, protected wells and springs, rainwater and packed or delivered water
unicef’s water game plan: Universal safe and sustainable water services for all by 2030 11A geographical focus:
The 33 Water Game Plan countries
During the Millennium Development Goal
(MDG) period, significant progress was made
towards the target on drinking-water supply,
with the MDG target for water being achieved
in many countries. However, MDG efforts
sometimes meant that too much of a focus went
on helping those that were the easiest to reach
– those that would improve the numbers quickly 8 out of 10 people who
– and not necessarily on the most vulnerable. lack even basic water
The JMP provided an updated snapshot of services live in rural areas.
where the world’s population stood on the
drinking water service ladder as of 2017, which Nearly half live in least
painted a mixed picture:15 developed countries
ĥĥ 5.3 billion people used safely managed
services. An additional 1.4 billion used at
least basic services. 206 million people ĥĥ 80 countries had more than 99 per cent
used limited services, 435 million used basic water coverage. But only one in
unimproved sources, and 144 million still three countries with less than 99 per cent
relied on surface water. coverage were on track to achieve near
universal coverage by 2030.
ĥĥ Eight out of ten people who lacked even
basic water services lived in rural areas. It is important to highlight that many countries
Nearly half lived in least developed fell into instability over the last decade,
countries. especially in the Middle East and North Africa
ĥĥ In 24 out of 90 countries with region, and there has been an accompanying
disaggregated data, basic water coverage regression in attained service levels. The
among the richest wealth quintile was at situation in most countries that have seen such
least twice as high as coverage among instabilities remains unclear, due to ongoing
the poorest quintile. conflict.
© UNICEF/Sudan/2018/Shehzad Noorani
15
UNICEF and WHO (2019). Progress on Household Drinking Water, Sanitation and Hygiene (2000-2017). JMP. Available here.
12 unicef’s water game plan: Universal safe and sustainable water services for all by 2030Figure 6: Inequalities in basic drinking water (example for Angola)
100
using basisc drinking water services (%)
World
Richest
Luanda
Proportion of the population 80
Urban
60
Sub-Saharan Angola
40 Africa
20
Rural Uige
Poorest
Source: JMP Progress on Drinking Water, Sanitation and Hygiene 2000-2017, and SDG baselines 2017
The figure below shows how inequalities exist water abundance due to a range of drivers
not just between regions but also between and stresses. For example, all countries within
countries – and even within the same country, the Zambezi river basin could have to contend
between urban and rural, poorest and richest, with increasing water shortages from both
and different district populations. climate and non-climate drivers (e.g. population
and economic growth, expansion of irrigated
agriculture, and water transfers). In eastern
Africa, potential climate change impacts on
Regional analysis the Nile basin are of particular concern, given
the basin’s geopolitical and socioeconomic
Below is a brief situation analysis of progress importance.
from 2000 to 2017, and some potential future
threats and challenges, by region.16 Climate change impacts on groundwater will
vary across climatic zones. The most affected
East and Southern Africa & West and Central areas will be those receiving mid-range rainfall
Africa: There was progress made in the region, rates (i.e. between 200 and 500 mm) per year,
with access to basic drinking water rising from including the Sahel, the Horn of Africa, and
46 per cent to 61 per cent between 2000 and southern Africa. There, a decline in groundwater
2017. However, use of surface and unimproved recharge is expected; prolonged drought and
drinking water in rural areas was 13 per cent other precipitation anomalies are also likely to
and 25 per cent respectively in 2017 – the become more frequent, particularly in shallow
highest figures for any region in the world. aquifers which respond more quickly than
Urban water coverage rose slightly in the period, deep aquifers to seasonal and yearly changes
suggesting that coverage is barely keeping pace in rainfall. Coastal aquifers are additionally
with population growth – perhaps not surprising vulnerable to climate change; as well as
as population growth in sub-Saharan Africa increased saltwater ingression from sea-level
was the highest rate of any region for the same rise, high rates of groundwater extraction near
period. the coasts can also lead to saltwater intrusion
into freshwater aquifers, contaminating water
The risks posed by climate change (particularly supplies.
a warming and drying climate) gives rise to
enormous challenges in this region to improving If climate change does drive increased drought
access to drinking water services that are conditions in Africa, stresses on groundwater
resilient to climate and other shocks. Indeed, delivery infrastructures will increase. Future
several studies point to a future decrease in development of groundwater resources
16
Data considered by SDG regions (as per JMP reporting) has been adjusted/brought together for the UNICEF regions.
unicef’s water game plan: Universal safe and sustainable water services for all by 2030 13must address potential direct and indirect water service level, creeping up from 52 per
impacts of climate change, population growth, cent in 2000 to 55 per cent in 2017. Reliance
industrialisation, and expansion of irrigated on surface water has actually increased from 26
agriculture – which will require much more per cent to 38 per cent during the period. With
knowledge of groundwater resources and many countries severely affected by climate
aquifer recharge potentials than currently exists change, sea-level rise and saltwater intrusion,
for the continent.17 an increased focus on climate resilience and
risk analysis will be critical to progress in the
South Asia: The region increased basic and region. Freshwater resources are particularly
safely managed access to water services from important to the region because of the massive
81 per cent to 92 per cent between 2000 and and growing population and a heavy economic
2017. Nevertheless, the region has a total dependence on agriculture. Water availability
population of over nearly 2 billion people, is highly uneven and requires assessment on a
meaning that over 126 million people still use sub-regional scale because of the wide range of
surface water or an unimproved water source. climates. In northern China, it is widely believed
The majority of those people (102 million) are that water scarcity has been affected by three
located in rural areas. main factors; decreasing precipitation, doubling
The impacts of climate change are likely population, and increased water withdrawal.
to result in huge economic, social, and Glaciers are important stores of water; any
environmental damage to South Asian changes have the potential to influence
countries, compromising their growth potential downstream water supply in the long term. It
and poverty reduction efforts. Countries in has been calculated that glaciers on the Tibetan
the greater Himalayas region – including Plateau and the surrounding areas, and on
Bangladesh, Bhutan, northern India, Pakistan, Puncak Jaya, Papua, Indonesia lost between
Nepal and Sri Lanka – are facing increased 9 per cent and to 80 per cent of their total
frequency and magnitude of extreme weather area during 1895 to 2010, due to increased
events, resulting in flooding, landslides, damage temperatures. Projected impacts of climate
to water and sanitation infrastructure, and change on future water availability in Asia differ
negative impacts on human health. At the other significantly between river basins and seasons.
end of extreme weather events is a predicted
increase in duration and intensity of droughts, In the Pacific, sea-level rise causes accelerated
particularly in the arid and semi-arid areas of coastal erosion, saline water aquifer intrusion
Bangladesh and India. The coastal areas of and increased flooding from the sea, with effects
Bangladesh, India, the Maldives, and Sri Lanka on human settlements. Freshwater resources
are at high risk from projected sea-level rise, for the region are also predicted to be seriously
which are likely to cause saltwater intrusion and compromised as a result of a potential 10 per
the displacement of human settlements. cent reduction in average rainfall by 2050.
East Asia and Pacific: The East Asia region Latin America and Caribbean: The JMP
reduced unimproved access between 2000 assessment showed continued good progress
and 2017 from 14 per cent to 5 per cent of on drinking water in Latin American and the
the population. Rural unimproved access is Caribbean, with 97 per cent of the region’s
the largest lagging factor in the region, and population using at least a basic water source.
despite improving still stood at 11 per cent in Rural versus urban drinking water access
2017. Urban access to improved water remains represents the largest disparity, with rural
high. However, in addition to complex water access to at least basic service estimated at
quality challenges, there is already evidence 88 per cent. However, the overall assessment
of frequent water shortages in the region. of high levels of access in the region hides the
As this region has one of the fastest-growing fact that some countries have comparatively
rates of mega-cities and secondary cities, this very low access (such as Haiti), and also
represents a high threat to future drinking water masks disparities in access to water services
access. The Pacific sub-region is showing the for indigenous people and populations in the
slowest progress in reaching at least a basic Amazon basin.
17
Climate analysis adapted from the IPCC 5th Assessment Report. Available here.
14 unicef’s water game plan: Universal safe and sustainable water services for all by 2030© UNICEF Afganistan/2020/FrankDejongh
Climate change-associated impacts in the the greatest concentration in the world of
region include altered precipitation patterns, humanitarian needs related to increasing water
an increase in heat extremes, a higher risk of scarcity and water quality challenges, access to
drought, and increasing aridity. Moreover, the water is becoming an additional, major threat to
intensity and frequency of tropical cyclones security and peace in the region.19
is projected to increase, while sea levels are
expected to rise by 0.2 to 1.1 mm per year, According to the latest assessments, the climate
depending on actual warming levels. Tropical in the region is predicted to become even
glacier volume is also predicted to decrease hotter and drier in most of the region. Higher
substantially, with almost complete deglaciation temperatures and reduced precipitation will
under high warming levels (though the much increase the occurrence of droughts, an effect
larger glaciers in the southern Andes are less that is already being seen in the Maghreb. It is
sensitive to warming and shrink on slower further estimated that an additional 80 to 100
timescales). Runoff is projected to be reduced million people will be exposed to water stress
in Central America, the southern Amazon basin by 2025. This is likely to result in increased
and southernmost South America, while river pressure on groundwater resources, which are
discharge may increase in the western Amazon currently being extracted beyond the aquifers’
basin and in the Andes in the wet season. recharge potential in most areas. In addition,
However, there is a marked uncertainty about agriculture yields, especially in rain-fed areas,
the potential changes and threat levels in Latin are expected to fluctuate more widely, ultimately
America and the Caribbean overall, due to falling to a significantly lower long-term average.
uncertainties in precipitation projections and In urban areas in north Africa, a temperature
differences in hydrological models.18 increase of 1 to 3 degrees could expose 6 to 25
million people to coastal flooding. In addition,
Middle East and North Africa: As with Latin heatwaves, an increased ‘heat island effect,’
America and the Caribbean, the Middle East water scarcity, and decreasing water quality,
and North Africa also showed progress between are likely to affect public health, and more
2000 and 2017, with 92 per cent using at least generally lead to challenging living conditions.
a basic water service. With the region having Global models predict sea levels rising between
18
Reyer C, et al. (2015). ‘Climate Change Impacts in Latin America and the Caribbean and their Implications for Development’. In Regional
Environmental Change, 17: 1601-21.
19
UNICEF (2019). Water Under Fire: For Every Child, Water and Sanitation in Complex Emergencies. UNICEF. Available here.
unicef’s water game plan: Universal safe and sustainable water services for all by 2030 15around 10cm to 30cm meters by the year 2050, other criteria have been factored in for inclusion
and around 10cm to 90cm by 2100. The social, in the priority countries: poor water quality
economic, and ecological impacts of sea-level based on geogenic water contamination (high
rise are expected to be relatively high for the levels of arsenic and fluoride), and the level of
Middle East and north Africa. Indeed, low-lying fragility/protracted emergency. Climate hazards
coastal areas in Tunisia, Qatar, Libya, UAE, have been assessed for all the priority countries,
Kuwait, and particularly Egypt are at particular though such hazards have not been used as
risk.20 criteria to add additional countries to the list.21
It is estimated that the 33 Water Game Plan
Country prioritisation countries will require stronger support on
technical aspects and resources, especially
UNICEF is currently implementing WASH those countries that are most fragile and
programmes in over 100 countries. While operating in more challenging and volatile
UNICEF will continue to support all countries environments. The list of countries will be used
based on regional country contexts and country to prioritise advocacy initiatives, technical
offices’ respective priorities, the Water Game support and resource mobilisation efforts, on the
Plan identifies 33 countries that have been basis that those countries will make the greatest
prioritised for particular focus and support. contributions to achieving universal access
to safe water by 2030, and the acceleration
The main criteria used for identifying the
of access to safely managed drinking water
33 Water Game Plan countries is access to
services.
water supply, using figures for ‘surface’ and
‘unimproved’ levels of service, as estimated by Based on JMP data, 82 per cent of the 579
the JMP. Thresholds for inclusion are consistent million people estimated with ‘no access’ to
across regions (covering over 8 million people water in 2017 live in the 33 Water Game Plan
with no water service and/or 24 per cent or more countries. The 33 countries also contribute to 80
relying on surface water or unimproved sources per cent of UNICEF results in water globally.22
for water supply). Besides access figures, two
© UNICEF/UNI7859/Shehzad Noorani
20
Climate analysis adapted from the IPCC 5th Assessment Report. Available here.
21
The climate assessment has been done using global ranking of countries affected by different climate hazards and is available at Annex 2.
22
According to UNICEF results data for water in development contexts and durable solutions in humanitarian response as reported in the SMQs in 2019.
16 unicef’s water game plan: Universal safe and sustainable water services for all by 2030Table 2: Access figures to different service levels, globally and in Water Game Plan countries
Population using respective service in 2017
Globally UNICEF’s Water Game Plan countries
(million people) (million people and % of global total)
Limited 206 156 76%
Unimproved 435 359 82%
Surface Water 144 116 81%
Surface + Unimproved 579 475 82%
The figure below shows that of the 33 Water ĥĥ Current progress is too slow in 25 countries
Game Plan countries: ĥĥ In three countries, the access levels to
basic water services are decreasing
ĥĥ Only five are on track to achieve universal
access to basic water services;
Figure 7: Progress of Water Game Plan countries to achieve at least
basic water services by 2030.23
8
pt)pt)
2000-2017 (%(%
6
change 2000-2017
4
Somalia
ofofchange
Mozambique
Uganda
2 Tanzania Afghanistan Myanmar
Niger
Ethiopia Togo Sudan Nigeria
Congo Madagascar
rate
Kenya Sierra Leone Yemen Indonesia
rate
Papua New Guinea Haiti India China
Angola Guinea-Bissau
Annual
0 Chad Guinea Zimbabwe Pakistan
Annual
Zambia Syrian Arab Republic
Bangladesh
-2
0 20 40 60 80 100
Population with basic drinking water services (%), 2017
Source: JMP UNICEF and WHO (2019)
The prioritisation of the 33 Water Game Plan intervention approach towards a more strategic
countries does not mean that other countries advisory role. In all cases, UNICEF will
with relevant water programmes will not be continue to provide key leadership to the sector
supported, or that the water programmes will and remain a key WASH actor responding
not continue. to emergencies and other developmental
challenges.
It should also be noted that in some
geographical locations, UNICEF is in the The list of the Water Game Plan priority
process of transitioning from a service delivery countries is presented in Table 3.
23
Note that out of the 33 Water Game Plan countries, only 30 have estimates to assess progress for both 2000 and 2017. Central African Republic and
Eritrea did not have sufficiently recent data to estimates basic services in 2017 and South Sudan did not exist in 2000. These three countries have been
plotted in the figure using a) Central African Republic: 58% basic in 2016 (up from 46% in 2000); b) Eritrea: 52% basic in 2016 (down from 47% in 2000);
c) South Sudan: 41% basic in 2017 (no change since 2011).
unicef’s water game plan: Universal safe and sustainable water services for all by 2030 17Table 3: Water Game Plan priority countries (water services access figures are estimates
for 2017, by the JMP)
Priority country because of fragile context/
Water Game Plan country, area or territory
Proportion of population
Water scarcity/high climate risks Remarks
with unimproved or surface water access)
(over 24 % of Pop or over 8 million people
Population without access (using surface
Priority because of poor access to water
NATIONAL using
Priority country because of water
improved water supplies
Population (thousands)
protracted emergency
(no added countries)
Limited (more than 30 mins)
or unimproved)
quality issues
Free from contamination
Accessible on premises
Available when needed
Surface + unimproved
% urban
Safely managed
Surface water
At least basic
Unimproved
Non-piped
Piped
Afghanistan 35,530 25 67 3 19 11 30 10,574 - 38 - - 22 49 x x x
Angola 29,784 65 56 10 19 15 34 10,181 - 37 31 - 41 25 x x
Bangladesh 164,670 36 97 2Nigeria 190,886 50 71 7 15 7 22 42,101 20 24 69 23 11 67 X X X Pakistan 197,016 36 91
Implementing the Water Game Plan

     UNICEF must use its convening power to
     help develop the strong national enabling
     environments that are of critical importance for
     building an effective water sector, to achieve
     the ambition of universal access to safe water
     by 2030, accelerate access towards safely
     managed water services, and ultimately deliver
     results for children. This will only be achieved
     through building strong collaborations and                                    UNICEF’s water programming
     working closely with governments and partners.
     UNICEF will continue to work closely with
                                                                                   must be guided by evidence-
     partners such as the World Bank, UN agencies                                  based and quality national
     such as the United Nations Development                                        and sub-national analyses and
     Program (UNDP), the International Fund for
     Agricultural Development (IFAD), the Food and
                                                                                   based on locally appropriate
     Agriculture Organization (FAO), as well as other                              right solutions.
     valuable and respected partners such as the
     Stockholm International Water Institute (SIWI)
     and the Global Water Partnership (GWP),                                       sized programmes, from multi-country initiatives
     among others.                                                                 and sector-wide programmes to specialist
                                                                                   medium- or small-sized programmes that focus
     UNICEF water programmes are implemented in                                    on designing efficient and sustainable service
     a wide range of contexts, including emergency                                 delivery models for the sector to scale up.
     and fragile settings, low- and middle-income                                  Because of such variety, UNICEF’s approach
     countries, and covering a range of different                                  to water programming must be built on strong
                                                                                   national and sub-national analyses that lead
                                                                                   to the implementation of the right solutions to
                                                                                   the local context. International best practice
                                                                                   can guide processes, but programmatic
                                                                                   approaches must be context-driven and take
                                                                                   into account the underlying causes (economic,
                                                                                   social, political and environmental) that prevent
                                                                                   progress.

                                                                                   UNICEF has made available a set of tools24 that
                                                                                   facilitate such analysis, including the WASH
                                                                                   Risk Assessment tool and the (upcoming)
                                                                                   environmental and social risks screening tool.
                                                                                   The UNICEF WASH Bottleneck Analysis Tool
                                                                                   (WASHBAT) supports the sector to understand
                                                                                   and overcome barriers to progress, enabling the
                                                                                   development of costed and prioritised plans to
                                                                                   remove the bottlenecks that constrain progress.

                                                                                   The UNICEF WASH Strategy 2016-2021
                                                                                   proposes different programmatic approaches
                                                                                   to deliver results depending specifically on
                                                                                   the sector’s capacity context (see Figure 8).
                                                                                   These approaches will need to be considered
                                            © UNICEF/UN0199502/Noorai
                                                                                   as potential paths for implementing the Water
                                                                                   Game Plan.

     24
        These are the UNICEF/GWP ‘Strategic Framework for WASH Climate’ website, available here, the ‘Environment and Social Safeguards Screening
     Tool’ (under process); and the WASHBAT portal, available here.

20    unicef’s water game plan: Universal safe and sustainable water services for all by 2030
Figure 8: WASH programming approaches for different capacity contexts
WASH Capacity Context
PROGRAMMING Dark indicates more intensive use of approach
APPROACHES
Low Medium High
Emergency Fragile
Capacity Capacity Capacity
Strengthen enabling enivroments
Utilize evidence to promote
child rights
Leverage sustainable financial
resources
Build Sustainable markets
Empower communities
Deliver services and supplies
Source: UNICEF (2016). Strategy for WASH (2016-2021)
Water safety and water quality in pipes), storage, and handling. Moreover,
geogenic contamination is present and
persistent in many locations. At least 140
Moving from Basic to Basic+2 can appear million people in 50 countries are drinking
relatively simple. But ensuring that water water containing arsenic at levels above the
meets quality standards is not an easy task. WHO provisional guideline value of 10 μg
Microbiological contamination is frequent at the per litre, and 200 million people drink water
source, and water can also be contaminated with concentrations above the 1.5 mg per litre
during distribution (e.g. through leakages guideline for fluoride.
FREE FROM BASIC+2 AVAILABLE
CONTAMINATION WHEN NEEDED
BASIC
SERVICE
unicef’s water game plan: Universal safe and sustainable water services for all by 2030 21Figure 9: Maps of probability of arsenic and fluoride in groundwater
exceeding WHO guidelines
Source: Amini et al. (2008) EAWAG25
25
Amini, M.; Mueller, K.; Abbaspour, K. C.; Rosenberg, T.; Afyuni, M.; Møller, K. N.; Sarr, M.; Johnson, C. A. (2008) Statistical modeling of global
geogenic fluoride contamination in groundwaters, Environmental Science and Technology, 42(10), 3662-3668. Available here.
22 unicef’s water game plan: Universal safe and sustainable water services for all by 2030© UNICEF/UN0153307/Malawi
Approaches to addressing quality standard In some contexts, UNICEF will need to support
issues include investments in water treatment the development of master plans in large urban
technologies, innovation, supply chain contexts, for example, by providing technical
strengthening, household water treatment and assistance to optimise water and wastewater
safe storage, or chemical removal (including treatment plants, strengthening supply
use of reverse osmosis when technically and chains for treatment products (e.g. chlorine
financially feasible). Beyond that, the more distribution), or by supporting local markets.
professionalised and closer the water service
is to the user, the lower the risk of pollution will
be. Therefore, an effective way to address water
quality concerns, is by ensuring higher levels
Sustainability of water services
of service. Those will likely be associated to
a service model that provides treatment on a Both research and practice have shown it
continuous basis. is clear that achieving sustained universal
coverage will require more than building
Water safety plans (WSPs) will continue to play a water infrastructure and increasing access
key role in identifying and addressing barriers to to services. Understanding how services
water quality, following guidelines that WHO have are maintained over time needs to be at the
developed for both urban and rural contexts.26 heart of all water sector systems, at all levels;
Further guidance is also available on how to from local community interventions to wider
develop climate resilient WSPs, by reinforcing the national service delivery, including improving
assessment of climate hazards in the WSP risk the enabling environment for water services.
assessment methodology. While governments ultimately bear the duty of
guaranteeing the right to an adequate water
UNICEF water programmes will continue
supply for all, all stakeholders at all levels of
supporting JMP in the collection of water quality
the WASH service chain have a responsibility
data. This must include strengthening national
to address possible barriers to sustainability.
water quality monitoring systems; as of 2017,
This will include identifying, challenging and
only 117 countries even had estimates for safely
tackling barriers that may be deeply rooted in
managed water services, because of a lack of
the national governance system.
national water quality data.
26
WHO resources on water safety planning are available here.
unicef’s water game plan: Universal safe and sustainable water services for all by 2030 23FREE FROM BASIC+2 AVAILABLE
CONTAMINATION WHEN NEEDED
BASIC
SERVICE
UNICEF´s sustainability framework27 sets out delivery. Monitoring sustainability also plays
example experiences, tools and programming a key role in both planning and upholding
options at community, service and sector levels accountability mechanisms; robust and validated
that may be helpful, including: sustainability indicator frameworks are a core
component of monitoring. However, effective
ĥĥ Professionalisation of the sector as a way collection of information and the use of that data
to both achieve and maintain gains in the requires adequate capacity and coordination by
water services provided. all institutions involved for it to be useful. Such
ĥĥ Establishment of more sustainable water information must be gathered, analysed, and the
management models beyond community- presented in different ways for different audiences,
based management. For instance, using to ensure it can be used in the most effective way
clustering systems to benefit from for decision-making. UNICEF should continue
economies of scale, professionalising the to push for effective sustainability checks to be
management through the establishment conducted, and for the results to be used to adapt
of delegated entities operating as a small water programming strategies.
utility, or linking the rural water supply
management to larger urban utilities that
can provide technical and managerial
Shifting to climate-resilient
support. WASH programming
ĥĥ Development of innovative service delivery With a growing body of evidence showing that the
models, including scaling up successful most vulnerable will be the hardest hit by climate
models that prove to be appropriate to change, and that investments may get lost if no
the local contexts, and adjusting some action is taken, the international community is
aspects of existing models to make them paying increased attention to approaches that
more sustainable, over time. mitigate greenhouses emissions and adapt to
climate change impacts.
Systematically monitoring sustainability of the
water sector, at national and sub-national levels, In 2017, UNICEF and partners developed
helps to identify and address barriers and the Strategic Framework for WASH Climate
increase the accountability of service providers. Resilience Development and supporting guidance.
UNICEF´s support to the development of On the basis of the framework, UNICEF WASH
sustainability frameworks, including the is now committed to shift its programming to
introduction of regular sector-wide sustainability becoming a global climate-resilient WASH
checks, compacts, and sustainability strategies programme by 2021, contributing to the reduction
(or similar) helps to solidify agreement on of emissions wherever possible, and ensuring a
commitments to sustainability in water service green expenditure of around US$1 billion per year,
27
UNICEF/SIWI 2018 Programming for sustainable WASH services -A framework. Available here.
24 unicef’s water game plan: Universal safe and sustainable water services for all by 2030through programming activities in more than This shift needs to happen while focusing on
100 countries. equity across WASH programmes, so that equity
is systematically addressed by governments and
The objective of the shift to climate-resilient WASH sector partners as part of their climate
WASH programming is threefold: action planning. The guidance that accompanies
the strategic framework, as well as further specific
1. Ensuring that WASH infrastructure, services
technical guidance, are available to help UNICEF
and behaviours are sustainable, safe and
regional and country offices consider how to
resilient to climate related risks. This
goes hand in hand with the sustainable use, make and complete the shift to climate-resilient
protection and management of surface and WASH programming.
groundwater resources, and resilient waste
management.
2. Ensuring that resilient WASH programmes The Water Game Plan’s
contribute to building community programmatic pathways
resilience to adapt to the impacts of
climate change. To achieve this, inequalities
in service provision that disproportionately Programmatic pathways for implementing the
expose vulnerable groups to climate Water Game Plan will vary in each country,
threats or restrict their capacity to respond depending on the capacity context and on current
effectively, need to be addressed first. service levels. Countries with high rates of access
Further WASH contributions to community from unimproved sources will seek to make
resilience can be achieved through capacity
development and by fostering income
progress by moving sizeable proportions of the
generation, food, energy and ecosystem population from ‘surface’ and ‘unimproved’ access
resilience. towards Basic+2 services. Countries with higher
water service levels will want to move towards
3. Working towards a low-carbon WASH near-universal Basic+2 access, and a proportion
sector by improving water and energy of safely managed services, by addressing the
efficiency and ensuring, where possible,
main challenges and bottlenecks that prevent
the use of renewable energy for water and
sanitation operations to lower Green House progress into those levels. The Water Game Plan
Gases (GHGs) emissions, and energy identifies five potential programmatic pathways,
generation from waste.28 and these are set out below:
Figure 10: UNICEF Water Game Plan packages and respective pathways
“ZERO WITH NO ACCESS” PACKAGE
Service
level
Safely
managed
(Pathway 1)
1
Basic+2
Basic
Limited
Unimproved
Surface Water
Health & socio-economic benefits
28
Carbon neutrality, or having a net zero carbon footprint, refers to achieving net zero carbon dioxide emissions by balancing carbon emissions with
carbon removal or simply eliminating carbon emissions altogether.
unicef’s water game plan: Universal safe and sustainable water services for all by 2030 25“SDG ACCELERATION” PACKAGE
Service
level Safely
(Pathway 4)
managed
(Pathway 2)
Basic+2 (Pathway 3)
Basic
Limited
Unimproved
Surface Water
Health & socio-economic benefits
“SDGs IN EMERGENCIES” PACKAGE (Pathway 5)
Service
level
Safely
managed
(Pathway 5)
Basic+2
Basic
Limited
Emergency
Health & socio-economic benefits
Regardless of which pathway a country does not exclude the implementation of
programme prioritises, water safety, other pathways (e.g. moving towards safely
sustainability, and climate resilience (risk-based managed). That will depend on the context and
approaches) must be addressed, working the role UNICEF plays in each country.
through system strengthening and enabling
environment. It should also be noted that the The Water Game Plan assembles the five
prioritisation of one particular pathway (e.g. programmatic pathways into three packages,
moving from ‘surface water’ towards ‘Basic+2’) which are described below.
26 unicef’s water game plan: Universal safe and sustainable water services for all by 2030Zero with No Access package (MDG unfinished business towards Basic+2)
Pathway 1: From Surface/Unimproved service to Basic+2
Country programmes which are moving from a low service-level (unimproved sources, or no service at all) to
improved, resilient, sources within 30 minutes round trip, free from contamination and available when needed.
Contexts in which this pathway is implemented Pathway 1 will also need to work on Pathway 2
are low-income countries, which might also and Pathway 3 if they are to achieve universal
be fragile states or countries under sanctions. Basic+2 water services by 2030. It would also
They are likely to have large populations without be desirable indeed if Pathway 1 to achieve
access to WASH services, low government Zero with no access29 materialises before 2030,
investment and poor governance frameworks while progress continues towards the SDG
supporting work towards the SDG targets. target of universal access to safely managed
Countries with large populations and dispersed water supply.
rural villages should give priority to this pathway.
The immediate priority in such contexts will The impacts of climate change need to be
be to ensure first that those with no service assessed from the outset of implementation of
(i.e. using surface water directly), or using Pathway 1, to make sure that any new, repaired
unimproved sources have access to at least a or upgraded water services are adapted for
Basic+2 level of service, as those are the most climate resilience and to foster community
vulnerable. Countries predominantly following climate knowledge and preparedness.
Surface water Unimproved Basic+2 Intervention modalities
Directly from Develop improved water sources,
From an
a river, dam, aiming to achieve the highest possible
unprotected
Source
lake, pond, level of service that will ensure
dug well or Improved30
stream, canal sustained access, and which is resilient
unprotected
or irrigation to the impacts of climate change or
spring
canal other shocks and stresses.
Accessibility
Accessed within Ensure the water points are as close
a round trip of 30 as possible to the users and meet the
minutes, including criteria of 30 min (round trip including
waiting queueing).
Through a service delivery model that
ensures treatment for water points
Free from (e.g. chlorination in the water tank, or
contamination removal of geogenic contamination), to
Quality
(bacteriological and ensure water quality standards are met.
priority chemical Implement water safety plans, including
contamination) barriers to prevent contamination of
water at the source, at point of fetching,
and during transportation and storage.
The service is Scale up sustainable service delivery
available when models, and strengthen service
Availability
needed (i.e. management (e.g. by supporting
sufficient water in professionalisation of the operation and
the last week or maintenance of the service).
available for at least
12 hours per day) Shift to climate-resilient water services.
29
‘Zero with No Access’ means zero people are deemed to have no service at all, and no one depends on water directly from surface or unimproved
water sources.
30
Improved sources are systems that have the potential to deliver safe water by nature of their design and construction. This means piped supplies
such as households with tap water or public stand-posts, and non-piped supplies such as boreholes. While protected wells, protected springs, rainwater,
packed and delivered water are also part of the ‘improved’ JMP category, UNICEF only recommends these as options for improvement in exceptional
cases, and consider instead upgraded levels of service that will ensure consistent water quality, sustainability and resilience.
unicef’s water game plan: Universal safe and sustainable water services for all by 2030 27You can also read