WAITING FOR THE GREEN LIGHT: TRANSPORT SOLUTIONS TO CLIMATE CHANGE - CLIMATECOUNCIL.ORG.AU
←
→
Page content transcription
If your browser does not render page correctly, please read the page content below
WAITING FOR
THE GREEN LIGHT:
TRANSPORT SOLUTIONS
TO CLIMATE CHANGE

CLIMATECOUNCIL.ORG.AU
Thank you for
supporting the
Climate Council.
The Climate Council is an independent, crowd-funded organisation
providing quality information on climate change to the Australian public.

    Published by the Climate Council of Australia Limited
    ISBN:    978-1-925573-69-5 (print)
             978-1-925573-68-8 (digital)
    © Climate Council of Australia Ltd 2018
    This work is copyright the Climate Council of Australia Ltd. All material
    contained in this work is copyright the Climate Council of Australia Ltd
    except where a third party source is indicated.
    Climate Council of Australia Ltd copyright material is licensed under the
    Creative Commons Attribution 3.0 Australia License. To view a copy of this
    license visit http://creativecommons.org.au.
    You are free to copy, communicate and adapt the Climate Council of
    Australia Ltd copyright material so long as you attribute the Climate Council
    of Australia Ltd and the authors in the following manner:
    Waiting for the Green Light: Transport Solutions to Climate Change.
    Authors: Petra Stock, Professor Will Steffen, Greg Bourne and Louis Brailsford.

    —
    Cover image: Photo by chuttersnap on Unsplash.
    This report is printed on 100% recycled paper.

         facebook.com/climatecouncil                 info@climatecouncil.org.au

         twitter.com/climatecouncil                  climatecouncil.org.au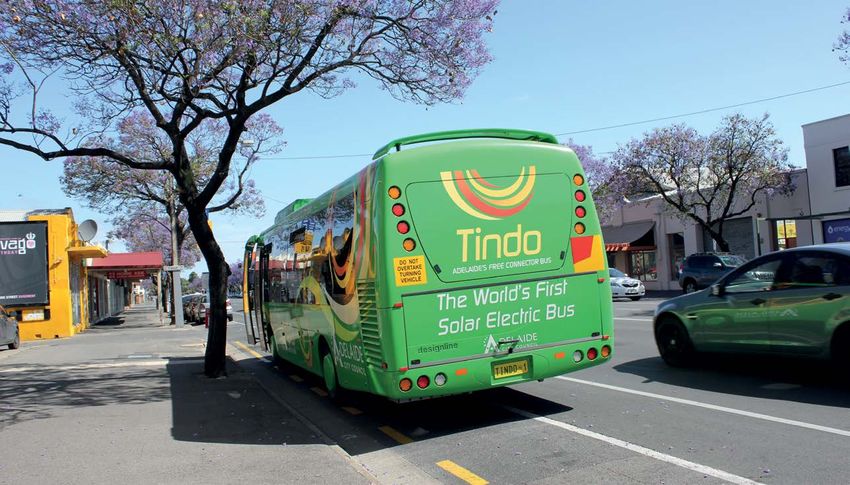
Preface
This report marks the beginning of a new flagship project for the Climate Council
aimed at cutting greenhouse gas pollution levels from the transport sector -
Australia’s second largest source of greenhouse gas pollution.

Australia’s greenhouse gas emissions are rising and are projected to continue increasing in
the absence of credible and comprehensive climate and energy policy tackling all key sectors:
electricity, transport, stationary energy, agriculture, fugitive emissions, industrial processes,
waste and land use.

There has been considerable public discussion in Australia surrounding the need to transition
the electricity sector away from polluting, ageing and inefficient coal and gas generation to
clean, affordable and reliable renewable power and storage. There are now many policies and
programs at the federal, state and local levels designed to drive greater uptake of renewable
energy. While more still needs to be done to continue cutting greenhouse gas pollution levels
in the electricity sector, there is an urgent need to start addressing pollution from other sectors,
particularly transport, the nation’s next largest polluter.

Australia’s transport emissions or transport greenhouse gas pollution levels have been steadily
rising and are projected to continue going up. Factors such as population growth have led to
a higher number of cars on the road, while increased demand for freight is also driving up
truck emissions. Domestic air travel continues to increase, leading to an increase in aviation
emissions (Australian Government 2017).

Solutions are readily available to cut rising greenhouse gas pollution levels from the transport
sector. These include introducing vehicle emissions standards, planning for and investing in
infrastructure to enable more people to walk, cycle and use public transport, powering cars,
buses and rail with renewable energy, along with increasing the uptake of electric vehicles.
However, Australia needs federal, state and local policies and investment to set us on the right
path to do so.

We would like to thank Dr John Stone, Prof Peter Newman, Dr Graham Sinden (EY), Marion
Terrill (Grattan Institute) and Tony Morton (President of the Public Transport Users Association)
for kindly reviewing the report.

Authors

Petra Stock                  Professor Will Steffen        Greg Bourne                   Louis Brailsford
Senior Energy and            Climate Councillor            Climate Councillor            Researcher
Climate Solutions Analyst
ii    WAITING FOR THE GREEN LIGHT:
      TRANSPORT SOLUTIONS TO CLIMATE CHANGE

     Key Findings
     1       2
     Transport is Australia’s second       Global transport pollution
                                                                                  3
                                                                                  Congestion is a $16 billion
     largest source of greenhouse          levels are rising by around            dollar handbrake on the
     gas pollution (after electricity).    2.5% each year. Without                productivity of Australian
                                           action they are expected to            cities.
     ›› Australia’s transport related      double by 2050.
        greenhouse gas pollution levels                                           ›› Congestion in Australia costs
        increased 3.4% in the year to      ›› The transport sector contributes       the economy more than $16
        December 2017.                        14% of total global greenhouse         billion per year - measured in
                                              gas pollution annually.                lost private and business time,
     ›› Road based transport accounts                                                vehicle costs and air pollution.
        for an even greater share of       ›› Road related transport -               This figure is expected to rise.
        transport pollution in Australia      motorcycles, cars, trucks and
        than the global average, at           buses - make up about three         ›› Demand and congestion on
        around 85%.                           quarters of global transport           Australian roads will continue
                                              greenhouse gas pollution levels.       to soar as city populations
     ›› Cars and light commercial                                                    rise. Investing in better public
        vehicles alone make up over        ›› An international scorecard for         transport infrastructure is a
        60% of Australia’s transport          transport energy efficiency            proven means of alleviating
        pollution levels.                     ranked Australia third highest         congestion.
                                              for car distance travelled per
     ›› Greenhouse gas pollution levels       capita on an annual basis           ›› Population growth in Australian
        from transport are projected          (8,853 kilometres per person),         cities is driving increased
        to continue rising to 2030 and        after the United States (highest,      demand for public transport.
        beyond, reaching 112 MtCO2e           14,724 kilometres per person)          Infrastructure Australia
        in 2030, a further 12% above          and Canada (second highest,            forecasts an 89% increase in
        current levels.                       8,864 kilometres per person).          demand for public transport
                                              Australia lags behind Russia,          between 2011 and 2031.
                                              Mexico and Indonesia on
                                              transport efficiency.               ›› Federal and state governments
                                                                                     can play a major role in
                                                                                     encouraging more people to use
                                                                                     public transport through both
                                                                                     investing in infrastructure as
                                                                                     well as running more frequent
                                                                                     public transport services on
                                                                                     existing routes.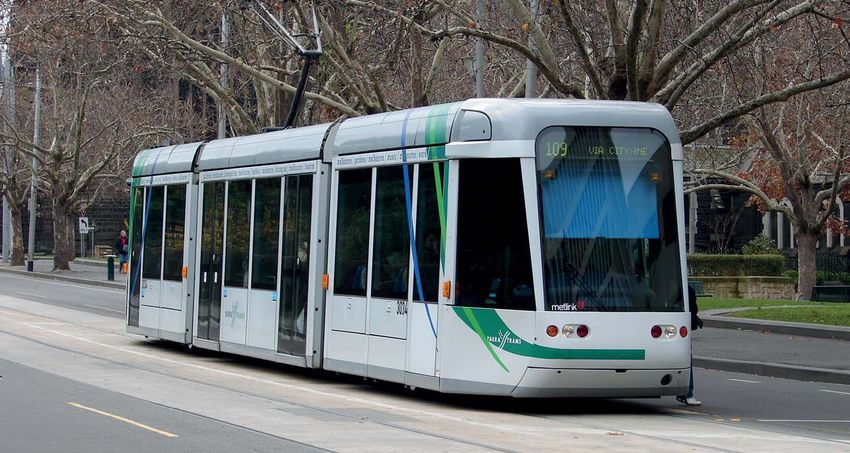
KEY FINDINGS    iii

4
Nearly 8 out of 10 Australians
                                     5
                                     Australia is one of just a               ›› In Australia, the adoption of
travel to work, school or            handful of Organisation                     electric vehicles is being held
university by car.                   for Economic Co-operation                   back by the lack of policy
                                     and Development (OECD)                      support or incentives, higher
›› On average, one in three          countries without greenhouse                upfront cost, lack of choice
   cars on the road during the       gas emissions standards for                 of available electric vehicles
   morning peak are people           vehicles, and lacks credible                for sale in Australia, and the
   making their way to work.         national policy to tackle                   availability of public vehicle
                                     transport emissions.                        charging infrastructure.
›› The majority (79%) of
   Australian commuters travel       ›› Mandatory vehicle emissions
   to work by car with a much           standards need to be
   smaller proportion taking            introduced soon to enable
   public transport (14%), walking      Australia to prevent emissions
   (4%) and riding a bicycle (1%).      of up to 65 MtCO 2 by 2030
                                        (significantly more greenhouse
›› The average Australian               gas pollution than what New
   household spends seven times         South Wales’ entire coal fleet
   more on transport (over $11,000      produces in a year).
   per year) than electricity
   (around $1,500 per year).         ›› To tackle climate change,
                                        Australia needs to rapidly roll out
›› A study of Sydney transport          a fleet of sustainable transport
   costs to the taxpayer found          solutions like high quality
   cars to be the most expensive        public transport, cycling and
   mode of travel costing society       walking infrastructure as well
   86c for every passenger              as renewable powered vehicles
   kilometre, compared with rail        in the form of electric bicycles,
   (the cheapest) at 47c and buses      cars, trains, trams and buses.
   at 57c.
                                     ›› By 2025, an electric car is
                                        anticipated to be similar in
                                        terms of upfront cost compared
                                        to a conventional (petrol or
                                        diesel) vehicle.

                                                                                       climatecouncil.org.au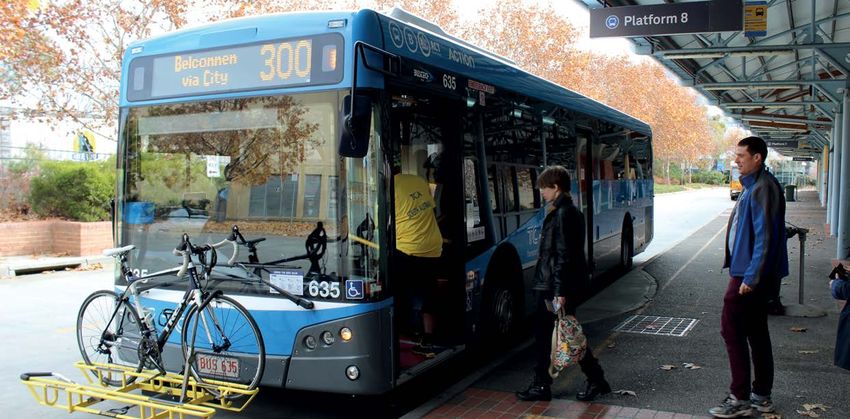
iv    WAITING FOR THE GREEN LIGHT:
      TRANSPORT SOLUTIONS TO CLIMATE CHANGE

     Recommendations
     for policy makers
     1                                                    4
     Federal, State and Territory governments to          Ensure that at least 50% of all Federal, State and
     set targets for zero emissions, fossil fuel free     Territory Government transport infrastructure
     transport well before 2050. Develop a climate        spending is directed to public and active (e.g.
     and transport policy and implementation plan         walking and cycling) transport.
     to achieve these targets.

     2                                                    5
                                                          Federal, State and Territory governments to introduce
     Ensure cost benefit analyses for all transport       targets to drive uptake of electric buses, trucks, cars
     project business cases account for the additional    and bicycles powered by renewables. Electric vehicle
     greenhouse gas pollution that projects will lock     targets can be established for specific sectors and
     in over their lifetime, or pollution avoided (e.g.   government operations, including:
     from public transport improvements).
                                                          ›› State and territory public transport systems.

     3
     Establish mode shift targets for public transport,
                                                          ›› Federal, state and territory government vehicle
                                                             fleet purchases.

     cycling and walking.
RECOMMENDATIONS FOR POLICY MAKERS           v

6                                                   8
State and Territory Governments to contract         Federal, State and Territory governments to
additional 100% renewable energy to power public    encourage the rollout of 100% renewable powered
transport systems (trains, light rail and buses).   electric vehicle charging, particularly in regional
                                                    areas and interstate routes.

7
Federal Government to introduce strong vehicle
                                                    9
greenhouse gas emissions standards. State and       Put a price on pollution. Consider policies or
Territory Governments to advocate for vehicle       pricing which better reflects the cost of greenhouse
emissions standards through the Council             gas pollution, so that road or public transport users
of Australian Government’s Transport and            bear the cost, or reap economic benefits based
Infrastructure Council.                             on emissions associated with their chosen travel
                                                    mode. End government subsidies, incentives and
                                                    support for fossil fuel use in the transport sector.

                                                                                 climatecouncil.org.au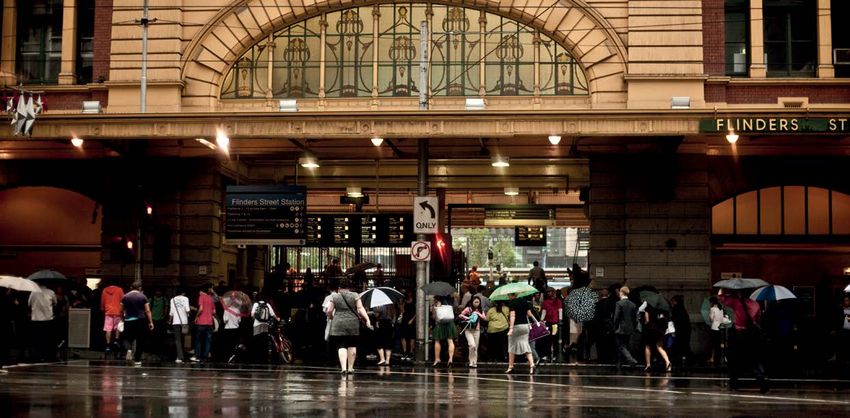
vi     WAITING FOR THE GREEN LIGHT:
       TRANSPORT SOLUTIONS TO CLIMATE CHANGE

     Contents
     Preface................................................................................................................................................................................................. i

     Key Findings..................................................................................................................................................................................... ii

     Recommendations for policy makers...................................................................................................................................... iv

     1.     Introduction...............................................................................................................................................................................1

     2.     Transport and climate change............................................................................................................................................ 3

     3.     Transport emissions: How does Australia compare?................................................................................................... 8
            3.1         Australian cars pollute more                                                                                                                                                      10
            3.2         Australians depend heavily on cars to get around                                                                                                                                   12
            3.3         Low use and limited access to public transport in Australian cities                                                                                                                13

     4.     Pressures on and impacts from transport in Australian cities ................................................................................14
            4.1         Population growth placing pressure on transport systems                                                                                                                            15
            4.2         Congested roads                                                                                                                                                                    16
            4.3         Increasing demand for public transport systems                                                                                                                                     18
            4.4         Health and wellbeing impacts from transport choices                                                                                                                               23
            4.5         Urban air pollution and noise                                                                                                                                                     25
            4.6         The cost of transport                                                                                                                                                             26

     5.     Transport climate solutions............................................................................................................................................... 27
            5.1         Increasing public transport use to move more people with less pollution                                                                                                           30
            5.2         Walkable, cyclable cities                                                                                                                                                         36
            5.3         Renewable powered electric vehicles                                                                                                                                               37
            5.4        Policies, standards and targets                                                                                                                                                    42

     6.     Case studies............................................................................................................................................................................ 43
            6.1         Australia                                                                                                                                                                         43
            6.2         International                                                                                                                                                                     48

     7.     Conclusion.............................................................................................................................................................................. 57

     References....................................................................................................................................................................................... 58

     Image Credits................................................................................................................................................................................. 63
CHAPTER 01     1
                                                                               INTRODUCTION

1.    Introduction
      Road and public transport systems in      Crucially, our transport systems are failing
      Australia are under increasing strain     when it comes to tackling climate change.
      due to growing populations, the           Transport is now Australia’s second largest
      layout of our cities and suburbs, our     source of greenhouse gas pollution (after
      heavy reliance on cars to get around,     electricity) and the sector has seen the
      and in many cases the lack of             largest percentage growth (62.9%) since
      suitable public transport alternatives.   1990 (Department of Environment and
      As the transport systems in our           Energy 2018a). Without action, transport
      major cities come under pressure,         emissions will continue rising (Department
      some commuters and communities            of Environment and Energy 2017).
      are experiencing negative effects
      such as high transport costs              Australia can do much more to reduce
      and travel times, congestion,             greenhouse gas pollution from the
      overcrowding, noise, air pollution,       transport sector. Compared with other
      and reduced physical activity.            countries, Australia consistently ranks at the
                                                back of the pack when it comes to tackling
                                                its transport emissions (ACEEE 2018). In
                                                fact, Australia’s cars are more polluting;
                                                our relative investment in and use of
                                                public and active transport options is lower
                                                than comparable countries; and we lack
                                                credible targets, policies, or plans to reduce
                                                greenhouse gas pollution from transport.

                                                Action on climate change is urgent. The
                                                world experienced its hottest five-year
                                                period on record between 2013 and 2017,
                                                continuing a strong, long-term upswing
                                                in global temperatures (Climate Council
                                                2018; NOAA 2018). Increasing global heat,

Australia is failing                            driven primarily by the burning of fossil
                                                fuels like coal, oil and gas, is exacerbating

to tackle greenhouse                            extreme weather events around the globe
                                                and in Australia.

gas pollution from
transport; our second
highest emitter.
2   WAITING FOR THE GREEN LIGHT:
    TRANSPORT SOLUTIONS TO CLIMATE CHANGE

    Greenhouse gas pollution from air
    travel is also significant and rising.

                Transport systems are vulnerable to                 Transport policies need to consider the many
                disruptions and damage from more frequent           factors that influence people’s transport
                and intense extreme weather events such             choices - family, work and household
                as heatwaves, storms and bushfires. For             circumstances, housing choices, comparative
                example, on 7 January 2018, the Sydney              costs, how long it takes to get from A to B and
                suburb of Penrith was recorded as the               whether the route is direct or meandering.
                hottest place on earth over a 24-hour period        Fortunately, there are many transport
                (with temperatures reaching 47.3°C). This           solutions available that can both drive down
                extreme heat led to cancellations and delays        greenhouse gas pollution levels, while also
                across the city’s public transport system           bringing significant environmental, health
                (News.com.au 2018; SMH 2018a).                      and economic benefits.

                Transport plans, policies and investments           This report focuses on climate solutions to
                made today have long-term implications              road-based transport, as cars, commercial
                decades into the future. These impacts              vehicles, trucks and buses make up the vast
                include concerns over how efficiently we will       majority (85%) of Australia’s transport-related
                be able to move around our major cities, how        greenhouse gas emissions. It is important
                rapidly we can cut greenhouse gas pollution,        to note emissions from domestic and
                and how well our transport systems are able         international air travel are also significant and
                to withstand the impacts of extreme weather.        rising, with domestic air travel alone making
                                                                    up 9% of Australia’s transport emissions.
                To tackle climate change, Australia must
                rapidly roll out a fleet of sustainable transport   Section two of this report provides
                solutions. These include improving the              an overview of the transport sector’s
                quality, efficiency and accessibility of public     contribution to greenhouse gas pollution
                transport, cycling and walking alternatives         globally and in Australia. Section three
                as well as shifting to renewable powered            considers how Australia’s transport sector
                vehicles in the form of electric bicycles,          emissions measure up compared with other
                cars, trains, trams and buses. Australian           nations. Section four provides background to
                governments need to develop coherent                some of the pressures facing Australian cities
                transport and climate change policies               and their transport systems. Section five
                with the aim of lowering greenhouse gas             describes key climate solutions to drive down
                pollution across the sector.                        transport emissions in Australia. Section six
                                                                    highlights a range of local and international
                                                                    case studies of transport climate solutions.
CHAPTER 02 3
TRANSPORT AND CLIMATE CHANGE
2. Transport and
climate change
Greenhouse gas pollution from Globally, the transport sector contributes
transport represents a significant nearly a quarter of energy-related carbon
share of emissions both globally and dioxide pollution. The transport sector
in Australia, with pollution increasing contributes 14% of total global greenhouse
year on year. gas pollution annually (7.0 GtCO2 in 2010)
(IPCC 2014). Road related transport -
motorcycles, cars, trucks and buses - make
up about three quarters of global transport
emissions (The ICCT 2017).
Transport emissions are rising (Figure 1).
Worldwide transport-related emissions are
increasing by around 2.5% every year (IEA
2017b; The ICCT 2017). Without action,
transport emissions are expected to double
by 2050 (IPCC 2014; Figure 1).
In Australia, transport (18%, 100 MtCO2e) is
the second largest source of greenhouse
gas pollution after electricity (33%, 184.5
MtCO2e). Australia’s transport related
emissions increased 3.4% in the year
to December 2017 (Department of the
Environment and Energy 2018a).
Road based transport accounts for an even
Australia’s transport greater share of transport emissions in
Australia than the global average, at around
sector adds 100 million 85% (Department of the Environment and
Energy 2017). Cars and light commercial
tonnes of greenhouse vehicles alone make up over 60% of
Australia’s transport emissions. New
gas pollution to the South Wales has the highest total transport
emissions of any state or territory, whereas
Western Australia has the highest transport
atmosphere every year. emissions on a per capita basis.4 WAITING FOR THE GREEN LIGHT:
TRANSPORT SOLUTIONS TO CLIMATE CHANGE
Figure 1: Global transport emissions are rapidly rising.
GLOBAL TRANSPORT EMISSIONS
8
Total Direct and Indirect 7.1
(Total Direct 7.0)
7
+2.11%
6
Total Direct and Indirect 4.9
(Total Direct 4.7)
GHG Emissions [GtCO2eq/yr]
5
Total Direct and Indirect 2.9 +2.83%
(Total Direct 2.8) 72.06%
4
100%
3 71.00%
+2,71%
59.85% 1.60%
2
2.38%
3.34% 2.16%
9.78% 3.45%
2.81% 6.52%
1.12%
1 1.38% 4.10%
5.39%
5.55%
5.71% 5.94%
11.66% 7.66% 9.26%
3.26% 2.09% 1.91%
0
1970 1975 1980 1985 1990 1995 2000 2005 2010
Indirect Emissions from Electricity Generation International Aviation
Road Domestic Aviation
Rail International & Coastal Shipping
Pipeline etc. Domestic Waterborne
HFC & Indirect N20
Source: IPCC 2014.Figure 2: State and territory transport emissions.
AUSTRALIA’S
TRANSPORT EMISSIONS
The transport sector is Australia's second
largest source of greenhouse gas pollution.
WESTERN AUSTRALIA NORTHERN TERRITORY QUEENSLAND
Annual transport Annual transport Annual transport
emissions emissions emissions
14.5 million tonnes 1.3 million tonnes 22.5 million tonnes
Equivalent to the Equivalent to the Equivalent to the
emissions from emissions from emissions from
6 Bluewaters Power 2 Channel Island Power 3.5 Gladstone Power
Stations (coal) Stations (gas) Stations (coal)
Per capita emissions Per capita emissions Per capita emissions
= 5.6 t CO 2/person = 5.3 t CO 2/person = 4.6 t CO 2/person
SOUTH AUSTRALIA NEW SOUTH WALES
Annual transport Annual transport
emissions emissions
6.6 million tonnes 27.4 million tonnes
Equivalent to the Equivalent to the
emissions from emissions from
4 Torrens Islands Power 3 Liddell Power Stations
Stations (gas) (coal)
Per capita emissions Per capita emissions
= 3.8 t CO 2/person = 3.5 t CO 2/person
VICTORIA TASMANIA ACT
Annual transport Annual transport Annual transport
emissions emissions emissions
22.3 million tonnes 1.7 million tonnes 1.2 million tonnes
Equivalent to the Equivalent to the Equivalent to the
emissions from emissions from emissions from
1.5 Yallourn Power 5 Tamar Valley Power 0.1 Liddell Power Stations
Stations (coal) Stations (gas) (coal)
Per capita emissions Per capita emissions Per capita emissions
= 3.6 t CO 2/person = 3.3 t CO 2/person = 3.0 t CO 2/person
Sources: ABS 2017a; Clean Energy Regulator 2018; Department of the Environment and Energy 2018b.6 WAITING FOR THE GREEN LIGHT:
TRANSPORT SOLUTIONS TO CLIMATE CHANGE
Greenhouse gas In Australia, greenhouse gas emissions
from transport have increased dramatically
pollution from cars, since 1990 (62.9%), experiencing higher
growth than any other sector. Pollution
trucks and buses is on levels from transport are projected to
continue rising to 2030 and beyond,
the rise both globally reaching 112 MtCO2e in 2030, a further 12%
above current levels (Department of the
and in Australia. Environment and Energy 2017; Figure 3).
Figure 3: Transport emissions increased the most as a percentage of any sector since 1990.
80%
60%
Per cent change in emissions on 1989-90 (%)
40%
20%
0%
-20%
-40%
-60%
0
1
2
3
4
5
6
7
8
9
00
01
02
03
04
05
06
07
08
09
10
11
12
13
14
15
16
17
199
199
199
199
199
199
199
199
199
199
20
20
20
20
20
20
20
20
20
20
20
20
20
20
20
20
20
20
Electricity Stationary energy excluding electricity
Transport Fugitive emissions
Industrial processes and product use Agriculture
Waste
Source: Department of the Environment and Energy 2018a.CHAPTER 02 7
TRANSPORT AND CLIMATE CHANGE
Emissions from the transport sector must on to public and active transport modes; and
be rapidly reduced in order to tackle climate adopting technological developments such
change (IEA 2017b). as renewable powered electric cars, buses,
light rail and trains - are together capable
Transport solutions - improving city of reducing greenhouse gas pollution levels
planning; investing in public transport; globally by 15 - 40% from business as usual by
encouraging people to shift out of cars and 2050 (IPCC 2014).
BOX 1: THE CLIMATE BENEFITS OF CANBERRA’S LIGHT RAIL PROJECT
Commencing construction in 2016, the By 2020 the ACT has contracted enough wind
Australian Capital Territory’s Capital Metro Light and solar power to ensure the Territory is
Rail (CMLR) system will be a transformative powered by 100% renewable electricity. So the
project for the Canberra-Queanbeyan urban electricity powering the trains will be entirely
area, bringing a wide range of economic, health, free of greenhouse gas emissions.
social and environmental benefits. Climate
benefits are an important component of that list. The other way that the CMLR system will reduce
greenhouse gas pollution is by the land use
The first stage of the CMLR system – a 12 change it will enhance. As people will want to live
kilometre line from the northern town centre and work near the fast, high quality rail service,
of Gungahlin to Canberra’s city centre – will land development will be attracted closer in to the
be fully operational in 2019. It will achieve a city rather than in highly car dependent suburbs
reduction in greenhouse gas emissions along on the urban fringe. Such changes in land use
the transit corridor of up to 30% compared to the not only make the economics of urban rail much
business-as-usual case with no light rail, based more attractive, they also reduce greenhouse gas
on the number of passengers who shift from pollution on the train and on all the travel done
private cars to light rail. by those living closer to the city.
Even more impressive are the reductions on a These very large emission reductions show the
per-passenger basis. For every passenger who potential of quality public transport such as light
switches from a car to the light rail, emissions rail, running on renewable energy, to drastically
will be reduced by 100%, that is, a complete reduce greenhouse gas emissions on a per
decarbonisation of the trip. passenger basis and cut greenhouse gas pollution
for the transport sector. In the longer term, the
The reason for this massive reduction in per- light rail network will become the backbone of
passenger emissions is two-fold. First, moving a transformed transit system – integrated with
from a car to the light rail system reduces bus routes, cycleways, walking corridors and
emissions to only a sixth of what it would electric vehicle charging stations – delivering
have been had the passenger stayed in the car. an efficient, resilient, carbon-free transit system,
Second, the CMLR trains will be powered by powered by renewable energy.
electricity, not by liquid fuels such as petrol that
directly emit CO2 on combustion.
Source: Steffen et al 2015.8 WAITING FOR THE GREEN LIGHT:
TRANSPORT SOLUTIONS TO CLIMATE CHANGE
3. Transport emissions:
How does Australia
compare?
An international scorecard ›› High polluting cars
comparing the energy efficiency of
the world’s top energy consuming ›› Lack of greenhouse gas emissions
countries consistently places standards (or fuel efficiency standards)
Australia at the “back of the pack” on in place
transport energy efficiency due to:
›› High car use
›› The relatively high distances travelled
per person (by car)
›› Low share of trips taken by public
transport
›› Low ratio of capital spending on public
transport compared to roads (ACEEE
2014; 2016; 2018)
Australia lags behind Russia, Mexico
and Indonesia on transport efficiency.Figure 4: 2018 International Energy Efficiency Score Card - Transport.
TRANSPORT EMISSIONS:
HOW DOES
AUSTRALIA COMPARE?
2018 GLOBAL RANKINGS: TRANSPORT ENERGY EFFICIENCY
TOP WHY IS AUSTRALIA SO POOR?
1ST 4TH High polluting cars
FRANCE CHINA Lack of greenhouse gas
emissions standards (or fuel
2ND 5TH efficiency standards) in place
INDIA UK High car use
3RD 6TH The relatively high distances
travelled per person (by car)
ITALY JAPAN
Low share of trips taken by
BOTTOM public transport
Low ratio of spending
20TH 23RD on public transport
compared to roads
AUSTRALIA THAILAND (ACEEE 2014; 2016; 2018)
21ST 24TH BACK OF THE PACK
TURKEY SAUDI ARABIA
Australia is consistently
22ND 25TH at the “back of the
pack” on transport
SOUTH UNITED ARAB
AFRICA EMIRATES energy efficiency.
Sources: ACEEE 2018.10 WAITING FOR THE GREEN LIGHT:
TRANSPORT SOLUTIONS TO CLIMATE CHANGE
3.1 Australian cars pollute more
Australian vehicles emit more greenhouse
gas pollution per kilometre than
comparable countries. The average car
purchased in Australia emits 182g of
carbon dioxide per kilometre (g/km)
(NTC 2017). This is much higher than
comparable countries. For example, the
emissions intensity of Australian vehicles
is 46% higher than vehicles in European
countries (NTC 2017; Figure 5).
Figure 5: Emissions intensity for new passenger vehicles - Australia compared with European countries.
AVERAGE EMISSIONS INTENSITY FOR NEW PASSENGER VEHICLES BY COUNTRY, 2015
180
160
Average emissions intensity (g/km)
140
120
100
80
60
40
20
0
Portugal
Netherlands
Denmark
Greece
France
Croatia
Malta
Ireland
Italy
Spain
Belgium
Europe
Slovenia
Finland
United Kingdom
Austria
Czech Republic
Romania
Sweden
Cyprus
Slovakia
Poland
Bulgaira
Hungary
Luxembourg
Lithuania
Germany
Latvia
Estonia
Australia
Source: NTC 2017.CHAPTER 03 11
TRANSPORT EMISSIONS: HOW DOES AUSTRALIA COMPARE?
Australian cars pollute more per kilometre
than other comparable countries due to a
range of factors, including vehicle size, the
lack of mandatory greenhouse gas emissions
standards for cars, as well as purchasing
decisions made by individuals, business
and government fleet buyers (NTC 2017).
Since 2011, diesel emissions have gone up
significantly as more people choose diesel
vehicles (TAI 2018; Figure 6).
Figure 6: Diesel emissions have risen as more people choose diesel cars.
CHANGES IN EMISSIONS FROM ROAD TRANSPORT FUELS
12
10
8
Emissions (MtCO2-e)
6
4
2
0
-2
-4
June 2011 June 2012 June 2013 June 2014 June 2015 June 2016 June 2017
Petrol Auto LPG Retail diesel Total
Source: TAI 2018.12 WAITING FOR THE GREEN LIGHT:
TRANSPORT SOLUTIONS TO CLIMATE CHANGE
3.2 Australians depend heavily
on cars to get around
Australians rely heavily on their cars to get Sydney, Melbourne and Brisbane are
around, particularly when travelling to work, Australia’s most populous cities and have
school or university. A greater proportion of higher car ownership than other global cities
people drive in Australian cities (rather than (UITP 2015). Global research comparing
using public transport) compared to overseas transport trends in more than 60 cities
(ACOLA 2015). For example, the majority worldwide found Australian cities (Brisbane,
(79%) of Australian commuters travel to Melbourne and Sydney) were amongst the
work by car with a much smaller proportion top third of cities in terms of car ownership
taking public transport (14%), walking (4%) or per capita. Of the cities compared, Brisbane
riding a bicycle (1%) (BITRE 2017). had the fourth highest car ownership per
capita overall after Portland (US), Turin and
An international scorecard for transport Rome (Italy) (UITP 2015).
energy efficiency ranked Australia third
highest for car distance travelled per capita There are some signs of a cultural shift
on an annual basis (8,853 kilometres per away from private car ownership. Younger
person), after the United States (highest, Australians (born after 1982) are less likely
14,724 kilometres per person) and Canada to obtain a drivers license, less likely to own
(second highest, 8,864 kilometres per their own vehicle and more likely to prefer
person) compared with 25 high energy walking and public transport. Technological
consuming nations (ACEEE 2018). developments such as autonomous vehicles,
electric vehicles, car sharing and ride sharing
are expected to change car ownership
patterns, but not necessarily reduce car use
(NRMA 2017).
Nearly 8 out of 10
Australians travel to work,
school or university by car.CHAPTER 03 13
TRANSPORT EMISSIONS: HOW DOES AUSTRALIA COMPARE?
3.3 Low use and limited
access to public transport
in Australian cities
Australia’s most populous cities - Sydney, based on supply of public transport
Melbourne and Brisbane - have lower supply (measured in total public transport vehicle
of and use of public transport compared kilometres per capita) and demand for
with other global cities (UITP 2015). public transport (measured in passenger
kilometres per capita) (UITP 2015).
A study of 39 countries placed Australia However, demand for public transport is
among the lowest for levels of public growing in Australia, linked to inner city
transport use in terms of journeys per population growth and investment in new
capita (UITP 2017). lines and services (UITP 2017).
Research comparing transport trends Solutions to reduce Australia’s greenhouse
in more than 60 cities worldwide found gas pollution from the transport sector are
Australian cities (Brisbane, Melbourne outlined in Section 4.
and Sydney) were among the lowest 25%
Table 1: Public transport use.
Lower use
Higher use Medium use (More than 10% smaller use than
(More than 10% larger than average) (Within 10% of average) average)
Singapore, Czech Republic, Hungary, Italy, Turkey, Belgium, Bulgaria, Denmark, Portugal, Canada, Spain,
Austria, Luxembourg, Japan, Republic Russia, Finland, Brazil, China Malta, Australia, Ireland, Slovenia, US,
of Korea, Estonia, Switzerland, New Zealand
Lithuania, Germany, Sweden, Poland,
Latvia, Romania, Croatia, Ukraine,
France, Slovakia, UK, Norway
Source: UITP 2017.14 WAITING FOR THE GREEN LIGHT:
TRANSPORT SOLUTIONS TO CLIMATE CHANGE
4. Pressures on and
impacts from transport
in Australian cities
Population growth in Australian
cities is placing increased pressure
on both road and public transport
networks, leading to issues such as
overcrowding and congestion. The
approach to transport in our cities
has a number of social, economic
and environmental implications.
Population growth in Australian
cities is putting pressure on
transport networks.CHAPTER 04 15
PRESSURES ON AND IMPACTS FROM TRANSPORT IN AUSTRALIAN CITIES
4.1 Population growth placing
pressure on transport systems
Australia’s major cities Table 2: Population growth in Australian capital cities.
are facing record levels
of demand on road and Population
public transport systems Population change Growth
as urban populations Capital city 2017 2016 - 2017 2016 - 2017
surge (Commonwealth Melbourne 4,850,740 125,424 2.7%
of Australia 2016a).
Melbourne and Sydney Sydney 5,131,326 101,558 2.0%
both added more than Brisbane 2,408,223 47,982 2.0%
100,000 people over the
past year, Brisbane added Canberra 410,301 6,833 1.7%
around 48,000 people and
Hobart 226,884 2,422 1.1%
Perth an additional 21,000
(ABS 2018a; Table 2). Perth 2,043,138 21,094 1.0%
Adelaide 1,333,927 9,648 0.7%
Darwin 146,612 696 0.5%
Source: ABS 2018a.16 WAITING FOR THE GREEN LIGHT:
TRANSPORT SOLUTIONS TO CLIMATE CHANGE
4.2 Congested roads
Many Australian roads are congested at On average, one in three cars on the road
peak times. The average car trip to the during the morning peak are people
city in Sydney or Melbourne takes 50-70% making their way to work. Approximately
longer during the morning peak than it one in five are travelling to school or
would at night (Terrill M 2017). Travel times university (BITRE 2016a). More than 60%
in all four big Australian cities have grown of children are now driven to and from
beyond the 30-minute average travel time, school (ACOLA 2015), with some parents
a period considered to be an acceptable reportedly travelling up to 100 kilometres
journey time from home to work (Newman to drive children to their school of choice
and Kenworthy 2015; Figure 7). (SMH 2018a; The Age 2018a).
Figure 7: Average commuting times for full time workers in Sydney, Melbourne, Brisbane and Perth.
AVERAGE COMMUTING TIMES FOR WORKERS
40
Average commuting time (minutes)
35
30
25
20
2002 2003 2004 2005 2006 2007 2008 2009 2010
Sydney Melbourne Brisbane Perth
Source: BITRE 2016b.CHAPTER 04 17
PRESSURES ON AND IMPACTS FROM TRANSPORT IN AUSTRALIAN CITIES
Congestion represents a cost to the economy
and a handbrake on the productivity of our
Congestion is a
cities. In Australia, the annual economic
cost of congestion - measured in lost private
$16 billion dollar
and business time, vehicle costs and air
pollution - is estimated at over $16 billion handbrake on the
per year and is expected to rise (BITRE
2016b). While congestion represents a cost productivity of
Australian cities.
to the economy, it is important to note that
reducing congestion is not without cost,
often requiring new investment in public
transport or funds for administering road
pricing policies (Terrill 2017). Eliminating
congestion entirely from major city roads Where public transport provides an
is an unrealistic goal, given a certain alternative service to driving that is efficient,
amount of congestion reflects an efficient affordable, and meets people’s travel needs,
use of road space (Whitehead 2015). this can lead to more and more people
using public transport and less tolerance
Reducing congestion requires investing for driving and road congestion, ultimately
in public and active transport alternatives creating a lasting improvement in road
together with congestion charges or traffic conditions. Importantly though,
disincentives discouraging people from this will only happen if planners resist the
driving at peak times (Aftabuzzaman et temptation to undermine the mode shift to
al 2010; Glover 2013; Whitehead 2015). On public transport (and away from private cars)
the other hand, building more roads often by adding more road capacity.
contributes to increased traffic, as more
people decide to drive, in turn increasing For example, Beijing has successfully
road congestion (Glover 2013; Beck and reduced congestion by 50% year-on-year
Bliemer 2015; Whitehead 2015). from 2010 by prioritizing public transport
in planning and investment, expanding
New roads are often sold to the public as the rail network by three new subway lines
“congestion busters”; however, research (totalling 36 kilometres of rail) and limiting
consistently shows that increasing road increases in car ownership. Public transport
capacity can actually increase congestion now accounts for over 40% of all trips, and
by encouraging additional car trips as traffic peak hour travel speeds have improved by
increases to fill the available road space more than 10% (International Transport
(Litman 2015). While counter-intuitive, Forum 2013).
removing roads may over-time result in
improved traffic conditions (Beck and
Bliemer 2015).18 WAITING FOR THE GREEN LIGHT:
TRANSPORT SOLUTIONS TO CLIMATE CHANGE
4.3 Increasing demand for
public transport systems
Most Australian capital cities offer a range The capacity of public transport to move
of public transport services: rail (in the more people in Australian cities and towns
form of trains and light rail), buses and in depends on diverse factors including
some cases ferries. In 2016, public transport infrastructure, technology measures (e.g.
users in Sydney, Melbourne (e.g. Figure signalling), fleet size, staffing, and even the
8), Brisbane, Adelaide and Perth took 680 design of stations and interchanges.
million trips by rail (trains) and 230 million
trips on light rail (BITRE 2017). Light rail and urban trains generally tend
to service inner city suburbs, or extend
Population growth in Australian cities like spokes of a wheel, connecting the
is driving increased demand for public central city to outer suburbs. Trams (street-
transport. Infrastructure Australia based light rail) generally operate up to
forecasts an 89% increase in demand for around 10 kilometres from the central city
public transport between 2011 and 2031 (Victorian Auditor General 2014), whereas
(Infrastructure Australia 2016). light rail can extend further into suburbs
and hinterlands. In recent years most
Australian cities have been building fast
Figure 8: Melbourne’s Flinders Street Station.CHAPTER 04 19
PRESSURES ON AND IMPACTS FROM TRANSPORT IN AUSTRALIAN CITIES
rail into the outer suburbs to ease the travel The trend to build urban rail in recent
times of people living a long way from work decades across the globe has been
and these have been highly successful in documented by Newman and Kenworthy
drawing people out of cars (Glazebrook and (2015) who show that urban or metro rail
Newman 2018). The Western Australian is now faster than traffic in most cities
Government’s MetroNet program has major (including Australia) as traffic has slowed
rail connections into five corridors of Perth from congestion and new fast rail systems
costing over $5 billion. Other significant rail are being built that go over, around or under
investments include Adelaide’s rail extension the traffic. Table 3 shows this trend and the
to Noarlunga, Sydney’s North West and opportunity through rail to enable large
South West rail projects, Melbourne’s new shifts in modal split away from cars.
South West line and Melbourne Metro,
the Canberra and Gold Coast Light Rail Buses have provided the backbone of public
projects and Sunshine Coast rail projects. transport in Australian cities, particularly
Pressure on existing transport systems and for those living in the outer suburbs, for
communities experiencing long travel times the past 50 years. A study of Melbourne
to work and other major services have been public transport found nearly 90% of homes
strong drivers for these rail investments. are located within walking distance (400
The change in priorities from spending on metres) to one or more modes of public
roads and buses to building fast rail services transport - over 80% lived near a local bus,
has happened mostly over this century and around 30% near a train, and 20% near a
is paralleled by changes across the world tram (Victorian Auditor General 2014).
(Newman, Glazebrook and Kenworthy 2012;
Glazebrook and Newman 2018).
Figure 9: Canberra Bus.20 WAITING FOR THE GREEN LIGHT:
TRANSPORT SOLUTIONS TO CLIMATE CHANGE
Table 3: Ratio of overall average transit system and rail speed to general road traffic speed in cities, 1960 to 2005.
Comparative speeds in global ciites 1960 1970 1980 1990 1995 2005
Ratio of overall public transport system
American Cities 0.46 0.48 0.55 0.50 0.55 0.54
Canadian Cities 0.54 0.54 0.52 0.58 0.56 0.55
Australian Cities 0.56 0.56 0.63 0.64 0.75 0.75
European Cities 0.72 0.70 0.82 0.91 0.81 0.90
Asian Cities - 0.77 0.84 0.79 0.86 0.86
Global average for all cities 0.55 0.58 0.66 0.66 0.71 0.70
Ratio of metro/suburban rail speed to road speed
American Cities - 0.93 0.99 0.89 0.96 0.95
Canadian Cities - - 0.73 0.92 0.85 0.89
Australian Cities 0.72 0.68 0.89 0.81 1.06 1.08
European Cities 1.07 0.80 1.22 1.25 1.15 1.28
Asian Cities - 1.40 1.53 1.60 1.54 1.52
Global average for all cities 0.88 1.05 1.07 1.11 1.12 1.13
Source: Newman and Kenworthy (2015).
Accessibility of Accessibility of public transport is critical
to encouraging more people to take the
public transport bus, light rail or train instead of driving.
Hobart and Sydney ranked the highest in
services is critical. terms of the percentage of residents with
high or very high accessibility (of nearby
public transport stops). However, this does
not matter if the speed and quality of the
public transport option is not better than
that provided by cars1. Out of the capital
cities, Brisbane had the largest proportion
of residents having low or limited access
to public transport (Commonwealth of
Australia 2016b; Figure 10).
1 Accessibility is defined geographically and does not take into account the quality or how frequent the service is.CHAPTER 04 21
PRESSURES ON AND IMPACTS FROM TRANSPORT IN AUSTRALIAN CITIES
Figure 10: Accessibility of public transport in Australian cities.
Very high accessibility
High accessibility
Moderate accessibility
Low accessibility
Limited accessibility
Source: Commonwealth of Australia 2016b.22 WAITING FOR THE GREEN LIGHT:
TRANSPORT SOLUTIONS TO CLIMATE CHANGE
Light rail and trains in Australian
cities are bursting at the seams.
Many public transport systems in our Buses can be very slow in the transport
major cities, particularly light rail and train system. In recent decades our streets have
services, are bursting at the seams. Many become more congested and unfortunately
public transport services are already at buses are also stuck in the traffic. This
or beyond capacity during peak periods, drawback for efficient bus systems has
leading to crowding, delays and worsening partly contributed to the preference in
quality of service. Ongoing rapid growth Australian cities for a faster rail connection
and investment in new high quality to the outer suburbs.
public transport systems is needed to
tackle climate change and make our cities In general, the service level of buses and
responsive and resilient. light rail in our major cities (like Sydney
and Melbourne) are poor compared to other
In contrast, many bus services are global cities in terms of provision, frequency,
characterised by low use and low levels of average speeds and unplanned disruptions.
satisfaction. Issues affecting bus services Investment in and increases in public
and levels of use include indirect routes, transport service have not kept pace with
infrequent services, limited hours of population growth (Currie 2016).
operation and poor coordination with
trains and light rail (Victorian Auditor
General 2014).
Rapid growth and investment
in public transport systems is
needed to tackle climate change.CHAPTER 04 23
PRESSURES ON AND IMPACTS FROM TRANSPORT IN AUSTRALIAN CITIES
4.4 Health and wellbeing impacts
from transport choices
People living in Australian cities are The way people travel - by car or public
spending a large proportion of time transport - can have ramifications for their
travelling to and from work, school or health. Public transport use is linked to lower
university. Those living in Sydney (5:42 weight and higher levels of physical activity
hours per week), and Brisbane (5:00 hours) compared to driving. This is due to incidental
are spending a large amount of time each physical activity such as walking to or
week in the car, train, light rail, tram or from the train station or bus stops (Rissel
bus (AMP 2011, e.g. Figure 11). However et al 2012). Compared with driving, public
those living in the Northern Territory are transport users:
spending less than three hours a week
commuting to work. ›› are 3.5 times more likely to meet
recommended levels of physical activity
Time spent commuting impacts on (30 minutes a day)
people’s work and leisure time. Long
commutes also negatively affect people’s ›› walk an extra 8 to 33 additional minutes
wellbeing, stress levels, and their each day
relationships with families, communities
and workplaces (TAI 2005). ›› are less likely to be sedentary or obese
(Rissel et al 2012).
People living in Australia’s major
cities are spending between four
and six hours a week in the car,
train, light rail, tram or bus.24 WAITING FOR THE GREEN LIGHT:
TRANSPORT SOLUTIONS TO CLIMATE CHANGE
Public transport users A study of incidental physical activity
associated with public transport use in
are more likely to Melbourne found car drivers average 10
minutes of daily physical activity, whereas
meet recommended public transport users achieve 35 minutes,
and walkers and cyclists 38 minutes (Beavis
levels of exercise. and Moodie 2014).
One of the healthiest forms of travel is
walking. The rebuilding of cities to make
them more walkable has been the life
work of Danish urban designer Jan Gehl
(Matan and Newman 2016). Gehl’s work in
Melbourne, Sydney, Adelaide and Perth has
been critical to their becoming far more
walkable in their central cities, regenerating
the original walking urban fabric (Newman
et al 2016). This has been the basis of strong
economic performance, higher liveability,
greater health and reduced car use. Such
activities have demonstrated the importance
of co-benefits in achieving reductions in
transport greenhouse gas pollution.
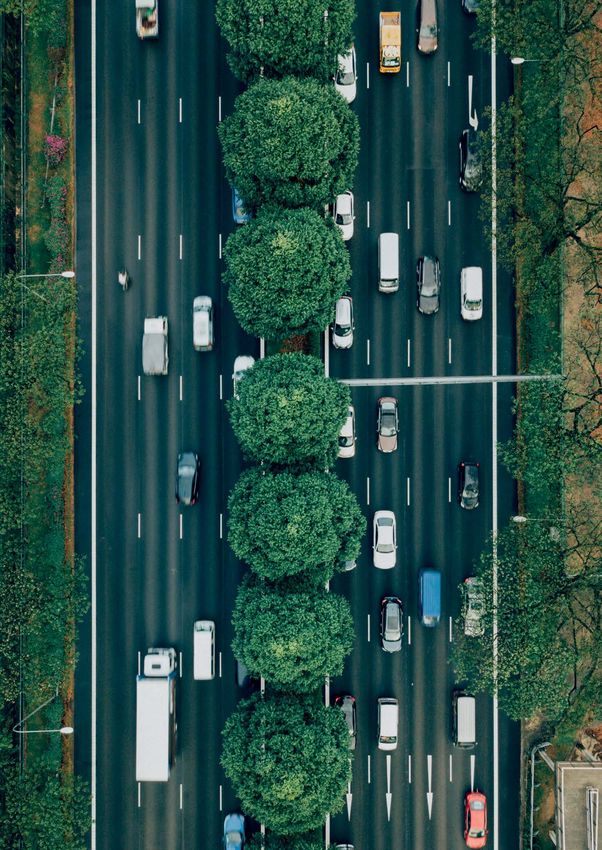
Figure 11: Traffic congestion in Sydney.CHAPTER 04 25
PRESSURES ON AND IMPACTS FROM TRANSPORT IN AUSTRALIAN CITIES
4.5 Urban air pollution and noise
In Australia, an estimated 1,700 deaths The use of diesel is increasing across
occur every year as a result air pollution Australia both for road transport and other
from cars, trucks and buses - larger than activities (agriculture, mining, construction)
the national road toll (Schofield et al 2017; (TAI 2018). Sales of diesel cars are growing in
Department of Infrastructure, Regional Australia, increasing 8.5% between 2015 and
Development and Cities 2018). 2016 (NTC 2017). Bus routes in Australia are
predominantly serviced by diesel buses. Out
Diesel cars, trucks and buses are key of 97,000 buses on Australian roads, four out
sources of urban air pollution. Diesel of every five are diesel (ABS 2017c).
is becoming an increasing source
of air pollution in Australian cities Across the world many cities are banning
(Commonwealth of Australia 2016a). diesel for health reasons and because electric
Diesel-fuelled vehicles emit air pollutants vehicle alternatives of all kinds are now the
such as nitrogen oxides and particulate rapidly growing new market. Electric vehicles
matter, which can cause cancer and can reduce urban air pollution and noise.
respiratory problems (Nieuwenhuis 2017).
Simple measures such as discouraging the
practice of idling (when a vehicle’s engine
is left running unnecessarily) near schools
and childcare centres can reduce children’s
exposure to noxious chemicals as well as
reducing greenhouse gas pollution (Schofield
et al 2017; The Age 2017).
Diesel buses, trucks
and cars are a key
source of air pollution.26 WAITING FOR THE GREEN LIGHT:
TRANSPORT SOLUTIONS TO CLIMATE CHANGE
4.6 The cost of transport
Despite the recent focus on energy bills, the A study of Sydney transport costs to
average Australian household spends seven the taxpayer found cars to be the most
times more on transport (over $11,000 per expensive mode of travel costing society
year) than electricity (around $1,500 per 86c/passenger kilometre, compared with
year) (ABS 2017b; ACCC 2017). rail (the cheapest) at 47c and buses at 57c
(Glazebrook 2009).
Compared to driving, public transport is
cheaper for individuals, households, and The external costs of road-based transport
society, particularly when all external are significant. Globally, around 1.3 million
costs are factored in (for example, public people are killed every year by motor
expenditure, accidents, congestion, air vehicles, and an additional 20-50 million
pollution, and noise costs). people are seriously injured (Sims et al
2014). In Australia, the annual road toll
At a household or individual level, deciding results in around 1,200 lives lost due to car
to take public transport instead of the car accidents (Department of Infrastructure,
can save between $5,500 (if a car is kept at Regional Development and Cities 2018).
home and not used) and $9,400 (if using
public transport avoids the purchase of a
car, or second car) per year (Wang 2013).
Households spend seven
times more on transport
than what they spend
on electricity.CHAPTER 05 27
TRANSPORT CLIMATE SOLUTIONS
5. Transport climate
solutions
While the transport sector is Australia’s Key climate solutions to drive down
second largest source of greenhouse transport emissions involve:
gas pollution, there are significant
opportunities to reduce emissions ›› providing viable alternatives to driving,
through a shift to public and active such as expanding access to reliable,
transport alternatives, and to comfortable public transport, cycling and
renewable-powered electric vehicles walking alternatives.
(ClimateWorks 2014; Hawken 2017).
›› electrifying and powering cars, buses,
trains and light rail with 100% renewable
energy (eg. Canberra’s light rail).
›› adopting policies and incentives to
encourage lower emitting vehicles, such
as mandatory greenhouse gas emissions
standards and electric vehicle targets
(Table 4).28 WAITING FOR THE GREEN LIGHT:
TRANSPORT SOLUTIONS TO CLIMATE CHANGE
Table 4: Transport solutions to reduce greenhouse gas pollution.
Solution Mode shift to public and active Renewable energy powered Policies and incentives for more
transport alternatives electric vehicles fuel efficient vehicles
What is it? Increasing public and active Electrifying bicycles, cars, Mandatory fuel emissions
transport use by providing buses, light rail and trains and standards set targets for new
viable alternatives to driving, powering them with 100% cars to meet lower emissions
such as high quality, efficient renewable energy. (per kilometre travelled) over
and accessible public time. The overall emissions
transport, cycling and walking intensity of the car fleet is
alternatives. reduced over time as new, more
efficient vehicles are purchased
to replace older ones.
Targets and incentives to drive
the uptake of electric bicycles,
cars and buses.
Benefits (in Reduced congestion Reduced urban air pollution Covers a broad range of
addition and noise vehicles, driving down
Safer (reduced car accidents)
to reduced emissions across the entire car
Electric vehicles can be
greenhouse More physical activity fleet
powered by renewable energy
gas pollution)
More inclusive (transport access Lower running costs
Lower running costs
for people without access to a
car or unable to drive)
Improved air quality
Lower transport costs
(compared to driving)
Reduced public space dedicated
to cars
Barriers Car oriented planning, urban Lack of charging infrastructure Government inaction
design and infrastructure
Lack of policy and incentives
budgets
to drive take up (emissions
Lack of investment in standards/ targets)
public and active transport
Upfront cost (offset by lower
infrastructure
running costs)
Requires behaviour change
Perceptions, e.g. concerns
about distance per charge
Sources: ESAA 2013; CCA 2014; Hawken 2017.CHAPTER 05 29
TRANSPORT CLIMATE SOLUTIONS
Globally transport Table 5: Emissions reduction potential from transport solutions.
solutions have the
potential to significantly Global emissions reduction potential
reduce greenhouse Solution to 2050 (gigatonnes CO2e)
gas emissions by 2050
Mode shift
(Table 5).
Mass transit 6.57
Walkable cities 2.92
Bike infrastructure 2.31
Digital communications (as an 1.99
alternative to travel)
High speed rail 1.42
Ride-sharing 0.32
Total 15.53
Renewable powered electric vehicles
Electric vehicles 10.8
Electric trains 0.52
Electric bikes 0.96
Total 12.28
Greenhouse gas standards
Cars 4.0
Trucks 6.18
Total 10.18
Source: Hawken 2017.30 WAITING FOR THE GREEN LIGHT:
TRANSPORT SOLUTIONS TO CLIMATE CHANGE
5.1 Increasing public transport
use to move more people
with less pollution
Mode shift from car travel to public and European cities have led the shift from
active transport is one of the most effective car travel to public transport, with Vienna,
measures available to reduce transport Paris, London, Oslo, Prague and Geneva
energy use and greenhouse gas pollution. increasing the share of journeys by public
Federal and state governments can play a transport by 20% or more by increasing
major role in encouraging mode shift to public transport supply and discouraging
public transport through both infrastructure car travel (for example through parking
provision and efficient day-to-day service restrictions and congestion charging). In
planning (such as coordinated timetables Vienna, Austria - which recently overtook
and running more frequent public transport Melbourne as the “world’s most liveable
services on existing routes). city” - more trips (54%) are now made by
public transport than by private vehicle
(UITP 2015; The Guardian 2018).
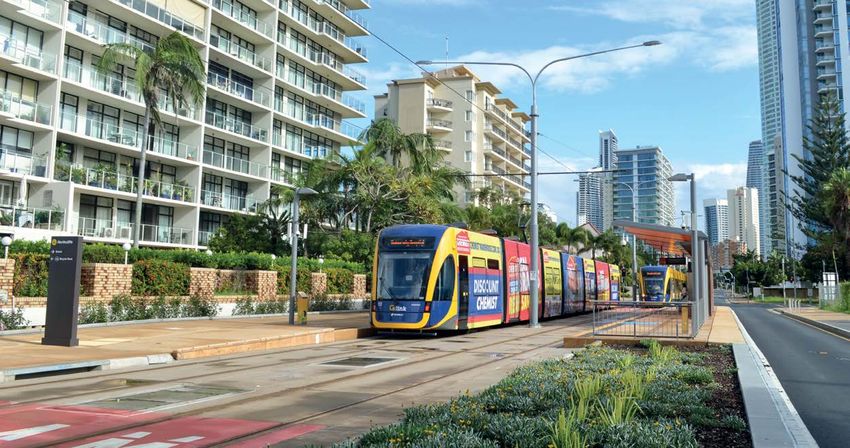
Figure 12: Adelaide Tram. Even cities famous for their car dependent,
sprawling suburban development such
as Houston and Dallas in Texas, United
States have been taking steps - rolling
out new light rail and train systems and
investing in improving bus services - to
increase the use and availability of public
transport (Case Study 9). The number of
light rail systems in American cities has
doubled since 1995. Use of public transport
is growing in the United States, particularly
on light rail and trains (Newman et al 2012).
Almost every capital city in Australia is
now planning, building or extending new
light rail or train services (The Age 2018b,
e.g. Figure 12).You can also read