State of the
NSW Public
Sector Report
2020
←
→
Page content transcription
If your browser does not render page correctly, please read the page content below
State of the NSW Public Sector Report 2020

Publication and contact details

State of the NSW Public Sector Report 2020
© State of New South Wales (Public Service Commission)

The State of New South Wales, acting through the Public Service Commission, supports
and encourages the reuse of its publicly funded information.

This document is licensed under Creative Commons Attribution 3.0 Australia
(CC BY 3.0 AU) (‘CC Licence’). See https://creativecommons.org/licenses/by/3.0/au/
for full CC Licence details.

We request attribution as: ‘State of New South Wales (Public Service Commission)’.

Without limiting the terms of the CC Licence, any person using material from this work is
required to:

   • observe and retain the copyright notices that accompany this work
   • ensure that appropriate attribution to the Public Service Commission is made, and
   • refrain from implying that the Public Service Commission endorses any use of
     this work.

For more information about this report, please contact:

NSW Public Service Commission
Level 4
255 George Street
Sydney NSW 2000
Australia

Telephone +61 2 9272 6000
Email nsw-sopsr@psc.nsw.gov.au

ISSN 2201-182X (print)
ISSN 2202-6746 (online)

This report can be accessed online at:
www.psc.nsw.gov.au/sopsr/2020

The Public Service Commission acknowledges the Traditional Custodians of the lands
where we work and live. We celebrate the diversity of Aboriginal peoples and their
ongoing cultures and connections to the lands and waters of NSW. We pay our respects
to Elders past, present and emerging and acknowledge the Aboriginal and Torres Strait
Islander people who contributed to the development of this report.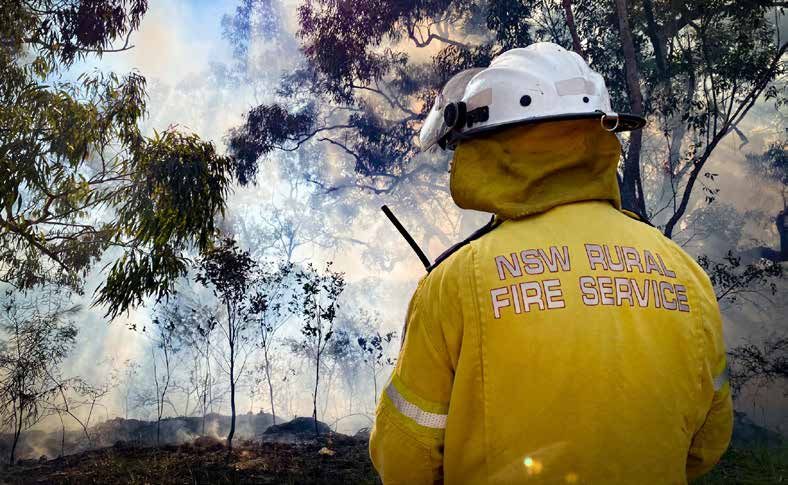
Contents
                     Introduction                                     2
                     About this report                                3
                     How to read the data discussed in this report       3
                     Areas of government this report covers              4
                     Acknowledgements                                    4

                     Chapter 1: NSW public sector at a glance         5
                     Our size and shape                                  6
                     Our people                                       12
                     Our performance                                  15

                     Chapter 2: Response                             18
                     Leadership and change management                22
                     Employee wellbeing                              23
                     Recruitment                                     25
                     Mobility                                        26
                     Collaboration                                   29
                     Employee engagement and productivity            31
                     Customer satisfaction                           33

                     Chapter 3: Resilience                           36
                     Strategic workforce planning                    37
                     Performance management                          40
                     Flexible working                                41
                     Inclusion and diversity                         43
                     Bullying and other negative behaviours          48
                     Digital capability                              50
                     Learning and development                        50

                     Commissioner’s afterword: Reimagining           52
                     References                                      56

State of the NSW Public Sector Report 2020                           1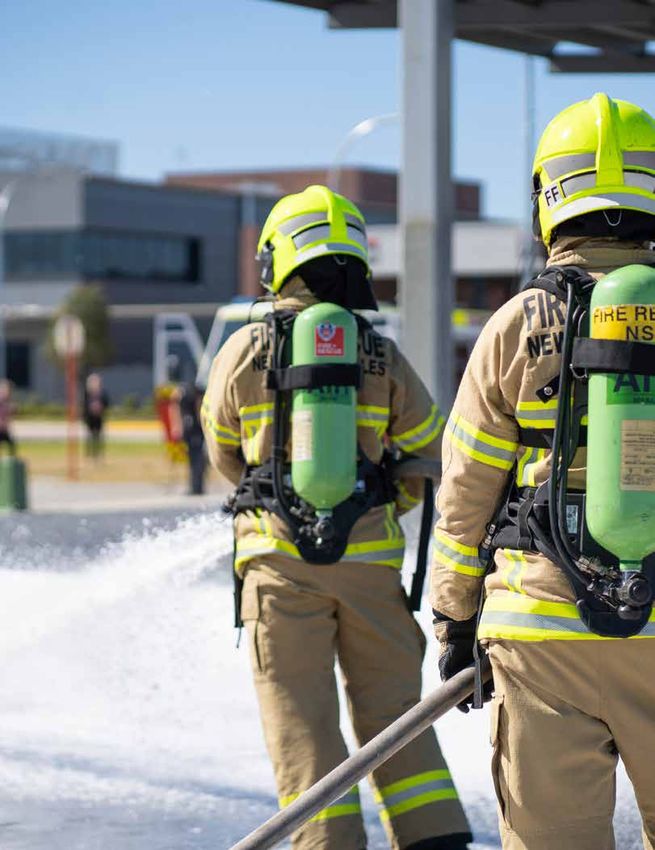
Introduction
    The State of the NSW Public Sector Report 2020 is my frst
    independent assessment of the performance of the NSW public
    sector as NSW Public Service Commissioner.

    What a year 2020 was! Bushfres, foods and the COVID-19 pandemic have changed
    the way we live and work. The sector has played a critical role during this time, ensuring
    that public services and amenities have been improved or maintained. Collaboration and
    commitment to customer needs were the defning qualities of the sector’s workforce
    during this period of unprecedented change.

    Chapter 2 of this report describes the sector’s initial response to the pandemic from a
    workforce perspective. It touches on the State Emergency Operations Centre (SEOC),
    leadership, employee wellbeing, mobility and recruitment, and collaboration. It also looks
    at two important outcome measures: employee engagement and customer satisfaction.

    Chapter 3 discusses aspects of workforce management that contribute to the sector’s
    resilience, including workforce planning, performance management, fexible working,
    diversity and inclusion, and digital capability. It also sheds light on issues, such as
    bullying, that require more attention if we want to continue to build our resilience.

    Finally, in my afterword, I comment on workforce practices that the sector needs to
    develop or further embed over the coming years.

    There was no shortage of excellent work in the sector in 2020. However, we must keep
    our eye on achieving the Premier’s Priority for an ever-evolving, world class public
    service. With our focused and collective eforts, and by drawing on the skills and passion
    of our people, I have no doubt that we will continue to live up to the NSW public sector
    values of integrity, trust, service and accountability.

    Kathrina Lo
    NSW Public Service Commissioner
    February 2021

2                                                                 NSW Public Service Commission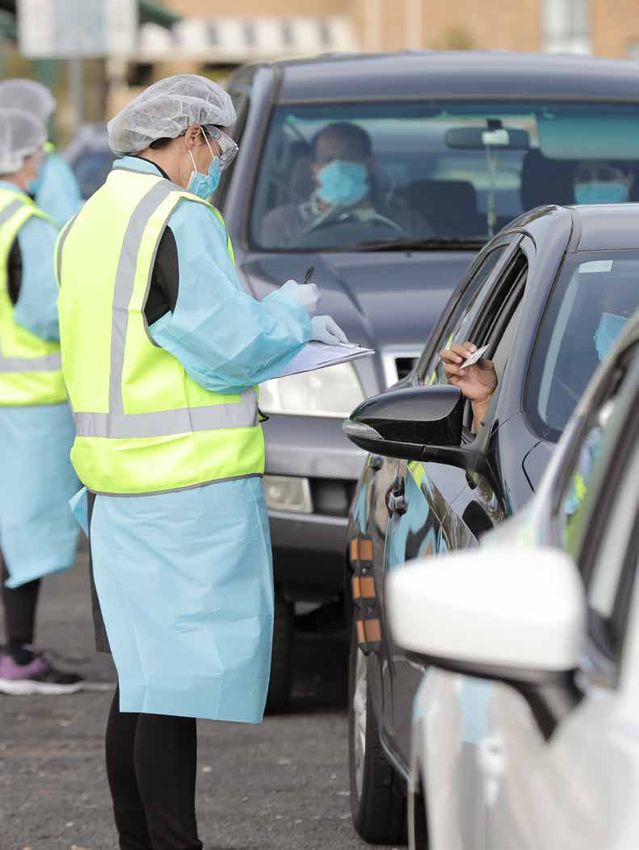
About this report
                     The State of the NSW Public Sector Report is the Public Service
                     Commissioner’s independent assessment of the performance of
                     the NSW public sector. It discusses the sector’s achievements and
                     priorities, plus the challenges it faces in delivering positive and
                     enduring outcomes for the people of NSW.

                     How to read the data discussed in this report
                     This report draws on evidence from a range of sources, including the People Matter
                     Employee Survey, the Customer Satisfaction Measurement Survey, and the Workforce
                     Profile Report. It also uses data from reviews and projects that have assessed the
                     capability and performance of the sector.

                     People Matter Employee Survey
                     The People Matter Employee Survey (People Matter survey) asks NSW public sector
                     employees about their experiences at work, with their teams, managers and leaders,
                     and in their organisations more broadly. The survey is open for four weeks, usually
                     towards the end of the fnancial year. However, due to the COVID-19 pandemic,
                     the 2020 survey was open from 19 October to 13 November.

                     Most of the Health cluster did not participate in the 2020 survey due to the COVID-19
                     pandemic. This meant there were around 80,000 fewer respondents than in 2019,
                     a decrease of 44%.

                     Most of the survey results are presented as ‘per cent positive’ or ‘per cent agreement’,
                     which combines the number of ‘agree’ and ‘strongly agree’ responses to a question
                     or set of questions.

                     Customer Satisfaction Measurement Survey
                     The Customer Satisfaction Measurement Survey (CSMS), conducted by the Customer
                     Experience Unit in the Department of Customer Service, tracks customer satisfaction
                     with government services. The CSMS provides a holistic view of customer experience,
                     benchmarking satisfaction with NSW Government services against those in other
                     jurisdictions (for example, Victoria and South Australia) and industries (for example,
                     airlines and banks). It captures data at a whole-of-sector level across 22 NSW
                     Government services. The CSMS helps to identify areas requiring the most efort to
                     improve customer satisfaction.

State of the NSW Public Sector Report 2020                                                                      3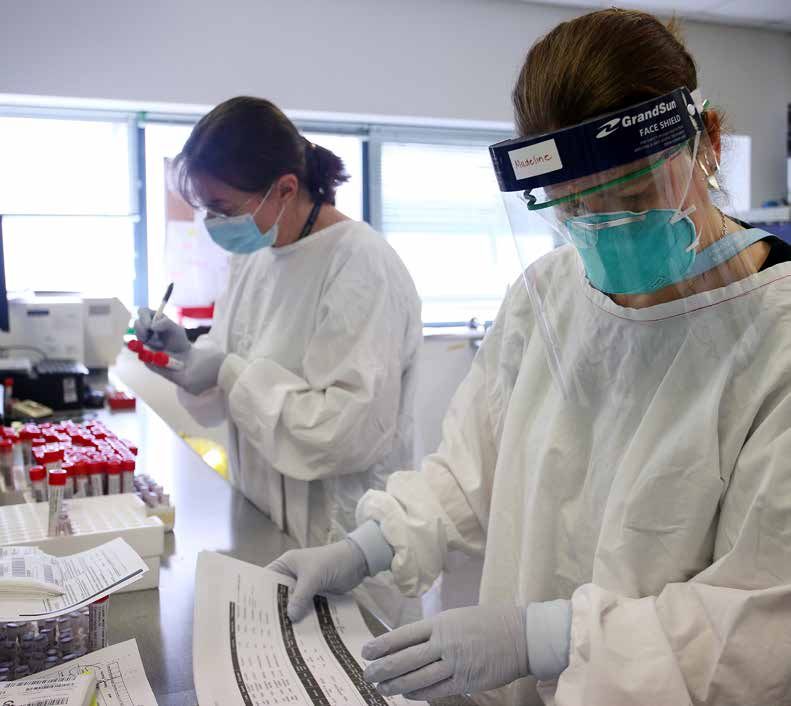
About this report

                    Workforce Profle
                    The Workforce Profile is a comprehensive annual data collection relating to the
                    demographic characteristics and employment arrangements of all public sector
                    employees. The Public Service Commission (PSC) and all public sector agencies jointly
                    complete the collection. The census date is the last payday of the fnancial year, and the
                    census period is the two weeks leading up to and including the census date. The data in
                    this report are for the census date, unless otherwise specifed. For 2020, the census date
                    was 25 June.

                    Areas of government this report covers
                    This report discusses the performance of the Public Service, government sector and
                    public sector, which are defned as the following:

                       • The Public Service includes those employed under Part 4 of the Government
                         Sector Employment Act 2013 (NSW) (GSE Act) in the service of the Crown.
                       • The government sector, as defned by the GSE Act, includes the Public Service,
                         the Teaching Service, the NSW Health Service, the Transport Service of New
                         South Wales, the NSW Police Force and other Crown services such as the TAFE
                         Commission.
                       • The public sector incorporates the government sector and other government
                         agencies, including the Independent Commission Against Corruption, the Audit
                         Ofce of New South Wales, the Parliament of NSW, the Judicial Commission
                         of New South Wales and State owned corporations such as water and energy
                         companies.
                    The data in this report relate to the public sector, unless otherwise specifed.

                    Acknowledgements
                    The Commissioner would like to acknowledge the assistance of:

                       • PSC staf members who developed this report – Chris Lamb, Emilie Priday,
                         Adam Bove, Nicholas Di Michele, Joshua Bird, Andrew Novak and Lisa Stewart
                       • the PSC Advisory Board – Sandra McPhee AM (Chair), Vince Graham AM,
                         Susan Lloyd-Hurwitz, Jordan O’Reilly, Tim Reardon and Michael Pratt AM
                       • the Customer Experience Unit in the Department of Customer Service for its work
                         on the CSMS
                       • NSW public sector agencies for supporting the People Matter survey and
                         Workforce Profle collection, and for sharing their stories
                       • Editor Group and Metro Graphics for their expertise in editing and designing,
                         respectively, this report.
                    The PSC advises that this resource may contain images or names of deceased persons
                    and links to sites that may also use historical content, photographs, flm or audio
                    recordings of Aboriginal and Torres Strait Islander people who have passed away.

 4                                                                                  NSW Public Service Commission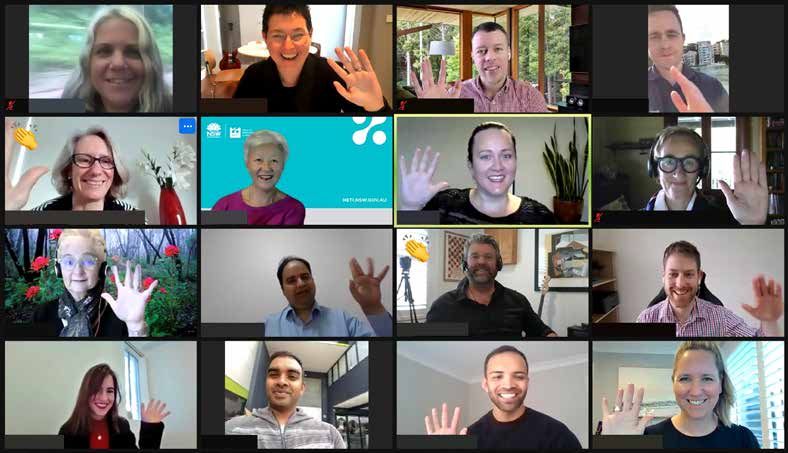
Chapter 1
                                             NSW public sector
                                                   at a glance

State of the NSW Public Sector Report 2020                  5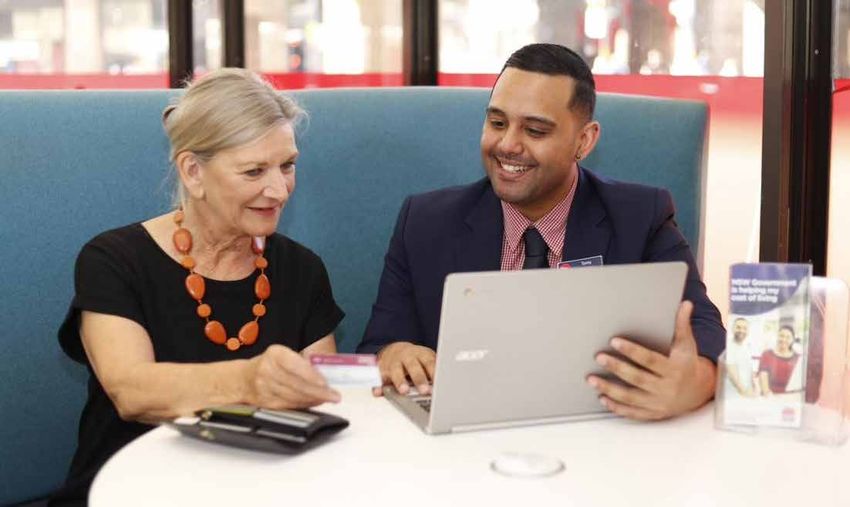
Chapter 1: NSW public sector at a glance

                          Our size and shape
Left:                                                                                                  equating to
Source: Workforce
Profle (2020)

Right:
                                               413,567                                                 348,508
Source: Workforce                              ongoing, temporary                                      full-time equivalent
Profle (2020),                                 and casual employees                                    (FTE) employees
census period

Source: Workforce
Profle (2011–20),         FTE over time, 2011–20
census period
                          The size of the sector increased by 10,721 FTE (or 3.2%) from 2019 to 2020, to support
                          service delivery and address the impacts of bushfres and the COVID-19 pandemic.

                                  350,000

                                  340,000

                                  330,000
                           FTE

                                  320,000

                                   310,000

                                  300,000
                                              2011    2012        2013    2014   2015   2016    2017      2018    2019       2020
                                                                                 Year

Sources: Workforce
Profle (2015–20);         Changes in public sector headcount and total
ABS (2020a)
                          NSW employed persons, 2016–20
                          The sector also grew relative to the number of NSW employed persons,
                          which contracted for the frst time in fve years.

                                  2016

                                  2017
                           Year

                                  2018

                                  2019

                                  2020

                                         -5      -4          -3          -2      -1       0       1           2          3          4
                                                                     Change from previous year (%)
                                                                  Public sector NSW employed persons

      6                                                                                               NSW Public Service Commission
Structure of the NSW public sector
                                                                         The public sector

                                                                     The government sector
                                                            under the Government Sector Employment Act 2013 (NSW)

                                         Teaching Service                     Public Service                            Police Force

                                                                       • Departments
                                      Other Crown services#            • Executive agencies                           Transport Service
                                                                         related to a department
                                                                       • Separate Public Service
                                                                         agencies                                      Health Service

                                    State owned                                         Independent Commission
                                    corporations*             Judicial o‰cers              Against Corruption
                                                                                                                              Audit O‰ce

                                  Staƒ of Members               Staƒ of the
                                   of Parliament**              Parliament               Judicial Commission

                            # Examples of other Crown services include the              ** The PSC does not collect data on these
                            TAFE Commission, School Administrative and                  employees.
                            Support Staf, and Sydney Trains.
                                                                                        Under the GSE Act, NSW universities are part of the
                            * Under the GSE Act, State owned corporations               government sector for certain, specifed purposes.
                            are included in the government sector for certain,          The PSC does not collect data on the employees
                            specifed purposes. In this report, they are                 of NSW universities. They are not considered
                            treated as part of the public sector but not the            part of the public sector or government sector in
                            government sector.                                          this report.

Source: Workforce
Profle (2020),              FTE by cluster
census period
                            The public sector is structured into nine clusters to coordinate related services.
Note: Percentages
indicate the contribution
of the cluster FTE to
total public sector FTE.                                                                      8,210                                    4,428
                                                                                                                                          1.3%
                                                                                                 2.4%                                  Regional NSW
                                                                                            Customer Service

                                          124,086                                                                        52,342
                                                  35.6%                                                                       15.0%
                                                  Health
                                                                                   110,507                                  Stronger
                                                                                                                          Communities
                                                                                           31.7%
                                                                                        Education

                                                                                                                                        2,293
                                   26,454
                                                                                                                                           0.7%
                                                                   16,103                                                                 Treasury

                                        7.6%                            4.6%                             3,835
                                      Transport                                                                1.1%
                                                                 Planning, Industry
                                                                                                            Premier
                                                                 and Environment                          and Cabinet

     State of the NSW Public Sector Report 2020                                                                                                      7
Chapter 1: NSW public sector at a glance

Source: Workforce
Profle (2019, 2020),       FTE for key occupations, 2020 vs 2019
census period

Note: The 2019 FTE for
frefghters was revised
after publication of the
State of the NSW Public
Sector Report 2019.
                           School Teachers      Nurses             Police Ofcers

                           69,330               49,602             16,786
                           66,716 in 2019       48,889 in 2019     16,586 in 2019

                           Clerical and         School Support     Medical
                           Administrative       Staf               Practitioners
                           Workers
                                                24,726             12,847
                           46,227               23,091 in 2019     12,329 in 2019
                           44,936 in 2019

                           Social and Welfare   Cleaners and       Labourers
                           Professionals        Laundry Workers
                                                                   4,352
                           7,722                5,268              4,266 in 2019
                           7,531 in 2019        5,091 in 2019

                           Ambulance Ofcers     Prison Ofcers      Firefghters

                           4,649                4,016              3,987
                           4,218 in 2019        3,848 in 2019      4,015 in 2019

                           Bus Drivers          Food Preparation   Train Drivers

                           2,765                Assistants
                                                                   2,007
                           2,723 in 2019        2,024              1,937 in 2019
                                                2,023 in 2019

       8                                                           NSW Public Service Commission
Sources: Workforce
Profle (2020); Public sector employees and NSW employed
ABS (2020b)
persons by job category
60
50
Percentage of group
40
30
20
10
0
Professionals Community Clerical and Managers Labourers Technicians Machinery Sales workers
and personal administrative and trades operators
service workers workers workers and drivers
Job category
Public sector NSW employed persons
Source: Workforce
Profle (2011–20), FTE by employment type, 2011–20
census period
Note: The ‘Other’ 100
category includes
employees whose 80
employment category
is Contract Executive,
FTE (%)
60
Contract Non-Executive,
Statutory Appointee,
40
Transport Senior
Manager or Other.
20
0
2011 2012 2013 2014 2015 2016 2017 2018 2019 2020
Year
Ongoing Temporary Casual Other
Source: Workforce Profle
(2011, 2016, 2020), census
FTE by grade, 2020 vs 2016 and 2011
period, non-casual only
Note: To provide a whole- 70,000
of-sector perspective,
60,000
remuneration has been
aligned with the non- 50,000
executive grades defned
40,000
FTE
in the Crown Employees
(Administrative and 30,000
Clerical Ofcers –
Salaries) Award 2007. 20,000
The GSE Act provides for 10,000
the Premier to determine
the bands in which senior 0
General Grade 1/2 Grade 3/4 Grade 5/6 Grade 7/8 Grade 9/10 Grade 11/12 Between Executive
executives are employed. Scale Grade 11/12 Bands 1–4
and executive
Currently, there are four Grade
bands. 2011 2016 2020
State of the NSW Public Sector Report 2020 9Chapter 1: NSW public sector at a glance
Source: Workforce
Profle (2010, 2020) Government sector senior executives,
2020 vs 2019
3,333
3,256 in 2019
Source: Workforce
Profle (2014–20) Public Service senior executives, 2014–20
The number of Public Service senior executives decreased by 2.0% between 2019 and
2020, partly counteracting the previous year’s increase.
2,300
2,200
Headcount
2,100
2,000
1,900
1,800
2014 2015 2016 2017 2018 2019 2020
Year
10Sources: Workforce
Profle (2020); Headcount and contribution to overall
ABS (2020a)
employment by NSW region
Most public sector employees live in Sydney. However, the sector
contributes relatively more to overall employment in regional areas of
NSW than it does to employment in the city.
11.6%
Richmond–Tweed
13.1% 16.9%
Co–s Harbour–
Grafton
New England
20.5%
& North West
Far West & Orana
14.5%
Mid-North Coast
8.8%
Hunter Valley
excl. Newcastle
13.2%
Central West
10.0% Sydney
regions
Murray
9.4%
12.7%
Riverina
Capital Region
Sydney regions
Region Contribution to
employment (%)
1 Sydney East 9.0
2 Sydney West 10.2
3 Central Coast 10.7
4 Newcastle & 13.9 Sydney
Lake Macquarie regions
5 Illawarra 10.5
6 Southern Highlands & 10.7
Shoalhaven
Sources: Workforce Profle (2020); ABS (2020a)
State of the NSW Public Sector Report 2020 11Chapter 1: NSW public sector at a glance
Our people
Source: Workforce
Profle (2019, 2020), Median agency tenure, 2020 vs 2019
non-casual only
8.4 years
8.5 years in 2019
Representation Representation of
Median age (years) of women Aboriginal peoples
44 65.5% 3.5%
44 66.4% 3.5%
38 50.4% 2.9%
40 46.8% 2.6%
0 20 40 60 80 100 0 20 40 60 80 100 0 20 40 60 80 100
Years % %
Sources: Workforce Profle (2020), Sources: Workforce Profle (2020); Sources: Workforce Profle (2020),
non-casual only; ABS (2016a, 2019a) ABS (2020c, 2020d) non-casual only; ABS (2015a, 2016b)
Representation of
people with English Representation of Representation of
as a second language people with disability LGBTIQA+ people
18.1% 2.4% 4.4%
18.2% 2.4% 4.5%
23.2% 16.9%
25.4% 7.2%
0 20 40 60 80 100 0 20 40 60 80 100 0 20 40 60 80 100
% % %
Sources: Workforce Profle (2020), Sources: Workforce Profle (2020), Source: People Matter Employee Survey
non-casual only; ABS (2016c, 2016d) non-casual only; ABS (2018a, 2018b) (2020)
Public sector Notes: All diversity statistics are based on self-disclosed information. Throughout this report,
Government sector ‘Aboriginal peoples’ is used to refer to all Aboriginal and Torres Strait Islander peoples.
NSW population The government sector is a subset of the public sector. LGBTIQA+ representation is based on
NSW working population the People Matter survey, which had a response rate of 47.3% in 2020.
12 NSW Public Service CommissionSource: Workforce
Profle (2011–20), Age band profle, 2011–20
non-casual only
30
Representation (%) 25
20
15
10
5
0
2011 2012 2013 2014 2015 2016 2017 2018 2019 2020
Year
15 to 24 25 to 34 35 to 44 45 to 54 55 to 64 65 plus
Source: Workforce
Profle (2016, 2020), Gender representation by grade in the
non-casual only
government sector, 2020 vs 2016
Women are under-represented in higher grades, though this is slowly improving.
80
70
Representation (%)
60
50
40
30
20
General Grade Grade Grade Grade Grade Grade Between Band 1 Band 2 Bands
Scale 1/2 3/4 5/6 7/8 9/10 11/12 Grade 11/12 3&4
& Band 1
Grade
Female, 2016 Male, 2016 Female, 2020 Male, 2020
Source: Workforce
Profle (2020), Aboriginal representation by grade
non-casual only
(non-executive) in the government sector
6
5
4
Representation (%)
3
2
1
0
General Grade 1/2 Grade 3/4 Grade 5/6 Grade 7/8 Grade 9/10 Grade 11/12
Scale
Grade
2020 Target
State of the NSW Public Sector Report 2020 13Chapter 1: NSW public sector at a glance
Source: Workforce
Profle (2014–20), Progress on the Premier’s Priority to drive
non-casual only
diversity in the government sector
Note: Senior leaders are
non-casual government
sector employees with
a salary equal to or
Women in senior leadership
higher than $165,750 in
2020, excluding Health Target
roles of a specialist or 50%
technical nature with no 2025
leadership or managerial
responsibilities, and
41.1%
Justice roles with a
40.3% 3,817
statutory or institutional 3,696
2020
character (such as
38.7%
37.4% 3,394
2019
judges, magistrates and 36.1% 3,114 2018
barristers). 2017
2,795
33.4% 33.8% 2016
2,520 2,522
2014 2015
Aboriginal people in senior leadership
Target
114
105 2025
2020
98
2019
87
2018
71
2017
63
57 55
2016
2014 2015
People with disability
Target
5.6%
2025
3.8%
3.6% 2012
3.5%
2011
2013
3.0% 2.9%
2014
2015
2.8% 2.7%
2016
2017 2.5% 2.5% 2.4%
2018 2019
2020
14 NSW Public Service CommissionOur performance
Source: Customer
Satisfaction Customer satisfaction for consumers and
Measurement Survey
(2019, 2020)
businesses, 2020 vs 2019
for consumers for businesses
82.0% 80.7%
80.6% in 2019 77.6% in 2019
Sources: NSW Treasury
Budget Statement
Government sector employee-related expenses
2019–20 (2019);
NSW Treasury Budget
as a percentage of general NSW Government
Statement 2020–2021
(2020)
expenditure, 2020 vs 2019
Government sector employee-related expenses as a percentage of general NSW
Government expenditure dipped between 2019 and 2020. This was partly due to increased
government spending to speed up recovery in NSW in the face of the COVID-19 pandemic.
45.0%
46.5% in 2019
Left:
Source: NSW Treasury Government sector Median salary,
Budget Statement
2020–21 (2020)
net worth 2020 vs 2019
$90,123
Right:
Source: Workforce Profle
(2019, 2020)
Note: The increase in
$238 billion a $2,197 or
median salary refects the 2.5% increase from 2019
pay increase that came
into efect on 1 July 2019.
Source: Workforce
Profle (2010–20) Changes in median salary, 2011–20
4.0
Change from previous year (%)
3.5
3.0
2.5
2.0
1.5
1.0
0.5
0.0
2011 2012 2013 2014 2015 2016 2017 2018 2019 2020
Year
State of the NSW Public Sector Report 2020 15Chapter 1: NSW public sector at a glance
Left:
Source: Workforce Median salary by Gender pay gap,
Profle (2020)
gender 2020 vs 2019
Right:
Source: Workforce
$90,123
Profle (2019, 2020)
Note: Employee salary
means the full-time for women
$2,053
base renumeration for
the role, regardless of
whether the employee
is working part time or $2,002 in 2019
$92,176
full time.
for men
Left:
Source: People Matter People Matter Employee
Employee Survey
(2019, 2020)
survey response rate, engagement,
Right: 2020 vs 2019 2020 vs 2019
Source: People Matter
Employee Survey
(2019, 2020)
47.3% 67.2
52.8% in 2019 65.7 in 2019
Source: People Matter
Employee Survey Rates of self-reported experienced and
(2019, 2020)
witnessed bullying, 2020 vs 2019
Experienced Witnessed
13.9% 21.7%
17.9% in 2019 32.9 in 2019
16 NSW Public Service CommissionSource: People Matter
Employee Survey Employees with a performance plan, and
(2019, 2020)
who have informal and scheduled feedback
conversations, 2020 vs 2019
Employees with a performance plan
72.3% 71.5% in 2019
Employees who have informal
79.2% feedback conversations
76.3% in 2019
Employees who have scheduled
63.3% feedback conversations
59.5% in 2019
Source: Workforce
Profle (2016–20), Hours of paid unscheduled absence per FTE,
annual reference period
2016–20
67.1
2016
65.2
2018
64.1 64.1
2017 2019 63.5
2020
Source: People Matter
Employee Survey Employees working fexibly and satisfed with
(2019, 2020)
their fexible work arrangements, 2020 vs 2019
Employees Employees
working fexibly satisfed with
78.4% their fexible work
arrangements
62.5% in 2019
65.5%
58.9% in 2019
State of the NSW Public Sector Report 2020 17Chapter 2 Response 18 NSW Public Service Commission
Droughts, foods, bushfres and the COVID-19 pandemic have led to
                     unprecedented changes to the way Australians live and work. These
                     extraordinary events have meant that NSW citizens and businesses
                     have had to adapt, substantially and swiftly. The NSW public sector
                     has, in many ways, led the pace of change, demonstrating how
                     workplaces can continue to deliver great outcomes.

                     More than any other year, 2020 demonstrated the NSW public sector’s strengths in
                     collaborating, adapting and responding. This is exemplifed by the role of the State
                     Emergency Operations Centre (SEOC) after the Black Summer bushfres in coordinating
                     emergency responses across the state.

                     When COVID-19 emerged as a major threat, SEOC pivoted to tackle a new set of
                     challenges. For many months, leaders from across the sector (and even from other
                     jurisdictions) came together at SEOC, either in person or remotely, to champion and
                     manage a whole-of-sector response. Gone were the siloes of old, replaced by helping
                     minds and hands.

                     Many NSW public sector agencies also worked together behind the scenes, sharing real-
                     time data and coordinating decision making, to adapt and respond to challenges from
                     the bushfres and then the pandemic.

                     In April 2020, the NSW Government announced the formation of two new agencies to
                     help the sector respond, rebuild and recover:

                         • Resilience NSW oversees disaster management in NSW. It is responsible for all
                           aspects of disaster recovery and building community resilience against future
                           disasters. SEOC forms part of the agency.
                         • The Department of Regional NSW is the central agency for dealing with regional
                           issues and improving the coordination of support for communities, businesses
                           and farmers who have endured drought, bushfres, foods and the impacts of
                           the pandemic.
                     Across the sector, employees had to abandon or evolve long-established ways of
                     working to continue providing public services from home or with social distancing in
                     place. They worked to keep employees and the public safe while also ensuring that
                     customers continued to receive the services they needed.

State of the NSW Public Sector Report 2020                                                                  19
Chapter 2: Response
Going remote in NSW schools: The transition to
online learning
The COVID-19 pandemic presented a signifcant challenge to the delivery of
education for more than 800,000 school students across 2,200 NSW public
schools. By 30 March 2020, more than 90% of NSW public school students were
staying home. Teaching methods needed to adapt rapidly to accommodate remote
students and those in physically distanced classrooms.
The solution was a digital hub that would be viewed more than 3.74 million times
by 951,000 unique users who downloaded more than 510,000 resources. Although
it was designed for our own public schools, the hub reached educators across
the United States, the United Kingdom and India. NSW Catholic and Independent
schools also accessed the shared resources.
The NSW Department of Education needed to provide an agile, responsive solution
that was reliable, accessible and user-friendly. Teachers needed centralised,
authoritative support and resources, while students needed access to their teachers
and to learning and wellbeing support services. Principals needed technology
that would allow them to address their communities and continue to lead their
teams remotely.
The department formed a taskforce to ensure access to learning, information and
support services during this period. This taskforce included experts in curricula,
online learning, user experience design, IT, video production, wellbeing and
disability, as well as business and system support. It quickly identifed the need for
a centralised and ofcial repository of educational resources, tools and up-to-date
information on the main website, education.nsw.gov.au, to best meet the needs of
students and teachers.
Using the award-winning Education NSW platform, the team was able to quickly
build and scale a responsive user-focused hub.1
A key feature was the introduction of on-demand professional learning for teaching
staf, covering key areas such as curriculum modules, student assessment and
wellbeing, and using digital technology to teach. The taskforce team rapidly
sourced or developed more than 5,000 high-quality resources and made them
available online. The department established 25 virtual stafrooms, enabling
teachers across the state to collaborate and share information and resources.
Thirty thousand teachers from across the state participated in the virtual
stafrooms, and between 16 March and 30 April 2020, Department of Education
corporate staf members delivered 60 state-wide live professional learning
webinars on a variety of topics. Over 19,000 educators participated in these
webinars in the frst 20 days of the COVID-19 lockdown period.
1. Education NSW’s Digital Connect Network won the Most Outstanding Government Platform at the
Digital Transformation Agency’s Australian Government Digital Awards 2020.
20 NSW Public Service CommissionThe successful launch included four weeks of live training and Q&A sessions, which
were recorded and made available on the website. This training contributed to
teacher identifed professional development hours.
Communications for the Learning from Home hub focused on internal channels for
staf and external channels for parents and key stakeholder groups, so there was
consistent messaging and coordinated implementation, alongside customised calls
to action.
The hub enabled school communities across the state to have the same access to
information and resources, improving education opportunities for many. To improve
equity of learning, the department also provided tens of thousands of computers to
those in need. And students were able to access virtual counselling to support their
wellbeing in this challenging time.
While the pandemic has been a signifcant disrupter to the delivery of education,
it has also been the catalyst for improvements in several areas. Virtual counselling for
students – which was not available before COVID-19 – will continue to be ofered.
The one-stop shop of resources and virtual stafrooms provided educators with
the most contemporary knowledge, and access will continue via the hub as it
is continually updated. Teachers from smaller, remote and regional schools will
continue to have a greater sense of connection to their colleagues in other parts of
the state, providing support and sharing the lessons they have learnt.
State of the NSW Public Sector Report 2020 21Chapter 2: Response
Leadership and change management
Our leaders had to step up to the challenge of steering the sector through the year, and
their impact on organisational performance cannot be underestimated. Leadership is
key in setting direction, executing strategy, shaping culture and capability, inspiring
purpose and delivering results.
The sharpening of our leaders’ focus and performance is refected in global improvements
in People Matter survey results for questions about senior managers (see Table 2.1).
Table 2.1 Employee perceptions of the performance of senior
Source: People Matter managers, 2020 vs 2019
Employee Survey
(2019, 2020)
2020 Change from
Note: 'pp' stands for Question
(% positive) 2019 (pp)
percentage points.
Senior managers communicate the importance of
70.3 9.0
customers in our work
Senior managers support the career advancement
64.4 3.3
of women
Senior managers model the values of my organisation 57.9 5.8
Senior managers keep employees informed about
56.5 8.1
what’s going on
Senior managers promote collaboration between my
56.0 3.2
organisation and other organisations we work with
Senior managers provide clear direction for the future
53.1 2.5
of the organisation
Senior managers listen to employees 48.5 4.4
Employees were also satisfed with their agency’s response to and communication
during crises (see Table 2.2). However, perceptions of change management more
generally did not improve, suggesting that agencies reacted well to events but did not
improve their coordination when managing change more generally.
Table 2.2 Employee perceptions of communication and
Source: People Matter change management
Employee Survey
(2020)
2020
Question
(% positive)
My organisation quickly adapts and responds during major events
82.6
that impact our work
My manager communicates efectively with me 74.6
Senior managers keep employees informed about what’s going on 56.5
Senior managers provide clear direction for the future of the organisation 53.1
Change is managed well in my organisation 40.6
22 NSW Public Service CommissionEfective change management will become more important as the sector fgures out a
hybrid work model and pivots in response to opportunities and challenges.
Employee wellbeing
The pandemic also sharpened the focus on employee wellbeing. It afected most
employees in some way, including through social distancing, reduced interactions with
family and friends, cancelled recreation time, and the need to home school children and
work remotely.
Some frontline employees could only deliver services digitally, while others had to
contend with far stricter hygiene protocols to limit the spread of the virus. Many non-
frontline employees had to adapt to working from home in an environment that was not
always as practical as an ofce space.
Agencies have many ways of monitoring and boosting employee wellbeing, whether
through manager check-ins, employee assistance programs or supplying ergonomic
equipment. The People Matter survey, however, provides a consistent method for
measuring wellbeing across the sector.
The 2019 survey marked the frst time respondents were asked about their subjective
wellbeing. The 2020 survey featured the same question. While there was some drop-of
at the highest points of the scale in 2020 compared to 2019, most employees (65.3%)
still scored 7 out of 10 or higher (see Figure 2.1) – a very reassuring outcome.
Figure 2.1 Distribution of wellbeing scores, 2020 vs 2019
Source: People Matter
Employee Survey 25
(2019, 2020)
20
Survey respondents (%)
15
10
5
0
0 1 2 3 4 5 6 7 8 9 10
Wellbeing score
2019 2020
Typically, the People Matter survey is conducted in May–June, but in 2020 it was pushed
back to October–November, due to the pandemic. Many agencies developed short,
sharp surveys to assess and act quickly on employee needs. These surveys seemed to
help agencies maintain engagement with dispersed workforces.
State of the NSW Public Sector Report 2020 23Chapter 2: Response
Assessing employee experience at the Department of
Planning, Industry and Environment during COVID-19
When the Department of Planning, Industry and Environment (DPIE) transitioned
its more than 10,000 employees to remote working in early 2020, it wanted to
make sure they remained connected and engaged.
The department’s Crisis Management team (CMT) provided access to equipment
so employees could create ergonomic workspaces at home. The team also worked
with DPIE leaders to communicate new measures designed to keep employees
safe, engaged and informed. These included virtual channels featuring pre-
recorded videos and live discussions. In addition, CMT provided guidance and
resources to help leaders support employee wellbeing while working remotely.
The department also ran pulse surveys during the pandemic to better understand
how employees were coping. The surveys, which were designed with input from
DPIE staf, were short and engaging, while also giving employees the opportunity
to share and be heard. The surveys included targeted questions about health and
wellbeing, experiences of working from home, and access to fexible working and
leave options.
The frst survey ran in May 2020 and had a participation rate of 59%. Employees
were keen to share their experiences, including their frustrations, what they thought
was working well and how they were feeling. The survey results showed positive
scores for communication and leadership engagement, with respondents saying
they had a strong sense of trust in their leaders. As part of the department’s
communications strategy, leaders regularly presented live, made themselves visible
to staf, and provided updates on DPIE and COVID-19.
The second survey, which ran in August 2020, had a participation rate of 46%.
Respondents were asked to indicate whether they felt like they were ‘thriving’,
‘gliding’, ‘surviving’, ‘fuctuating’, ‘struggling’ or ‘sinking’. They also had the option to
identify specifc concerns and request a call from the Health and Wellbeing team.
Almost 80 people asked for a follow-up call and received additional support.
DPIE employees overwhelmingly felt that remote working had been a success and
said they would welcome the opportunity to continue to work from home for at
least part of their time once it was possible to return to the ofce. The department
used the survey responses on working arrangements to continue its proactive
workplace planning.
The pulse surveys showed that the department listened to its people and
implemented measures to support their health and wellbeing during the pandemic.
This was also refected in the 2020 People Matter Employee Survey, where 86.6%
of DPIE respondents (compared with 82.6% for the sector) agreed with the
statement:
“My organisation adapts and responds to major events
that impact our work.”
24 NSW Public Service CommissionRecruitment
Recruitment was a vital component of the sector’s pandemic response. The PSC worked
with the sector to change the Government Sector Employment (General) Rules 2014
for temporary and term employment. The rule changes allowed agencies to accelerate
recruitment for COVID-19-related roles and extend temporary or term employment
beyond 12 months. These changes helped the sector quickly respond to the varying
demands on our workforce.
Overall, recruitment remains an important, high-volume activity for the sector. In 2020,
around 470,000 completed applications were submitted through the I work for NSW
recruitment system, similar to the previous year.2
Despite the volume, the results of the 2020 People Matter survey show that employee
perceptions of recruitment are still poor and have worsened since 2019. Only 38.2%
of survey respondents said they have confdence in their organisation’s recruitment
decisions.
More positively, time to hire, a measure of the efciency of recruitment processes, has
decreased consistently since 2016 (see Figure 2.2). This is encouraging in the context of
the pandemic because research shows that the longer the time to hire, the more likely
candidate dropout becomes, especially among high-quality applicants.3 Ensuring the
recruitment process is a positive experience for candidates will help the sector attract
the best and brightest people.
Figure 2.2 Average time to hire for roles with single openings,
Source: Recruitment 2016–20
data collection
(2016–20)
80
70
60
Time to hire (days)
50
40
30
20
10
0
2016 2017 2018 2019 2020
Year
2. This underestimates recruitment activity in the sector because not all parts of the sector use the full
I work for NSW platform, most notably the Health cluster. This cluster was responsible for just under
a third of the growth in FTE across the public sector in 2020, suggesting a reasonable amount of
recruitment activity within Health.
3. Rynes, Bretz and Gerhart (1991)
State of the NSW Public Sector Report 2020 25Chapter 2: Response
In 2020, an increased proportion of applicants were external to the sector compared to
2019 (see Figure 2.3). This may refect the broader impacts of the pandemic, with job
losses in other sectors. However, despite the increase in applications from candidates
outside the sector, the hiring ratio favoured internal applicants slightly more in 2020
than in 2019. Clearly, the current recruitment practices still present some challenges.
The sector needs to undertake further work to understand candidates’ views of the
recruitment process and whether current recruitment practices prevent new talent from
entering the sector.
Figure 2.3 Internal and external applicants and hires, 2020 vs 2019
Source: Recruitment data
collection (2019–20) 100
80
Percentage
60
40
20
0
Applicants Hires Applicants Hires
2019 2020
Year
Internal External
Mobility
Embedding mobility and capability-based assessments has been a focus of the PSC’s
work since the introduction of the GSE Act in 2013. The NSW Public Sector Capability
Framework was designed to be applied to all roles in the public service, shifting the basis
for role design from subject matter expertise to 16 core capabilities.
The foundations for mobilising skilled people quickly enabled hundreds to take
up contact tracing roles as the COVID-19 pandemic unfolded. With NSW Health
needing support and the whole sector pivoting to meet the state’s emerging needs,
an expression of interest for contact tracers was circulated and within a month,
the contact tracing unit grew from four people to 400.
26 NSW Public Service CommissionMobilising the workforce for COVID-19 contact tracing
Responding to COVID-19 required cross-sector mobility in key areas of demand,
on a scale never seen before. The NSW public sector’s response has required rapid
mobility of staf across agencies, and a quick intake of people from other sectors.
The NSW Health COVID-19 Contact Tracing team is an example of this collaboration.
Contact tracing was already part of the NSW Public Health system: many
Local Health Districts, though their public health units, had been tracing infectious
diseases for 30 years. But when COVID-19 hit, the system needed a more
centralised capacity to cope with the new challenges.
Although contact tracing now seems to happen instantaneously, it is hard to
believe that the COVID-19 Contact Tracing team began as four employees on
13 March 2020 and expanded to 200 employees by the end of that month. Today,
there are more than 400 contact tracers in the NSW Health central team alone.
NSW Health Contact Tracing Unit Director Carolyn Murray said that after a late-
night phone call from her Director requesting the urgent establishment of a
COVID-19 Contact Tracing team, she gathered three nurses together and the four
of them began calling people who may have been in close contact with COVID-19.
As the workload increased rapidly, NSW Health reached out across the public
sector for staf from other agencies to join the Contact Tracing team. They received
an overwhelming response from all areas of the sector, including those not involved
in healthcare. This spirit of service and willingness to collaborate were critical to the
success of the Contact Tracing team.
Once NSW Health had established a process for moving staf across agencies and
assessing core capabilities, employees from NSW public sector agencies were
able to move across to the Contact Tracing team quickly at a time of critical need.
Many are still temporarily based at the contact tracing headquarters and will remain
there as needed.
As the number of infections grew, so did the number of contact tracers, and
a range of staf joined the team – from the Australian Defence Force, the PSC,
the Cancer Institute, Taronga Zoo and the Australian Commission on Safety and
Quality in Health Care. The NSW Health COVID-19 Contact Tracing team now
includes employees from a variety of other sectors, including airlines.
A big challenge for the team was scaling up training to induct new contract
tracers quickly, as numbers increased and updates changed daily. NSW Health
collaborated with the Health Education and Training Institute to rapidly set up an
online training system and standard operating procedures for staf making those
important contact tracing calls. The Contact Tracing team also worked with Service
NSW to support the design and implementation of the QR code system for venues
to help identify attendees who may have come in close contact with the virus.
State of the NSW Public Sector Report 2020 27Although the contact tracing system was designed to make outbound calls and
advise people of what they needed to do, it evolved to also receive inbound
calls from those requiring additional support or struggling with self-isolation.
The success of the service saw it grow far beyond its initial scope and take on
an even greater role in fghting COVID-19.
“One of the things I’ve learnt during this time is that people respond
to a crisis diferently,” Ms Murray said. “Working to engage staf
around their strengths and contribute to the response is important.
NSW has strong leadership and that fows through to the successes
of our contact tracing.”
Having a mobile workforce makes it easier to redeploy resources to match priorities
and respond efectively to change and to emerging trends. Employee mobility provides
a way of getting the right person into the right job, and infusing innovative ideas and
practices into a workplace. It is also widely regarded as one of the best ways to develop
leadership capability, provide enriching careers, and build and retain capability in an
agency and the sector more broadly.
NSW public sector employees experience mobility in many ways, from formally moving
to a new agency in the sector to being promoted internally or transferred to another role
at the same level. Mobility between agencies does, however, appear to be limited, with
only 1.6% of employees formally moving to a new agency in 2020. As such, mobility is
more common within agencies and more likely to be reactive than proactive.
To support the sector in developing more purposeful mobility pathways, the PSC has
created a new team to work with the sector to design more efective and consistent
mobility, talent management and recruitment solutions.
28 NSW Public Service CommissionCollaboration
Many NSW public sector agencies combined their eforts and knowledge to respond to
the bushfres and the COVID-19 pandemic. These events tested the ability of the sector
to work on common goals, across agencies and with other sectors. In the early days of
public health orders and lockdowns in NSW, the public sector worked with other sectors
to keep the people of NSW safe.
Across the sector, perceptions of teamwork and collaboration within organisations has
improved slightly since 2019. Just under 80% of People Matter survey respondents
in 2020 believed their workgroup collaborates to achieve objectives, similar to 2019.
Furthermore, 54.4% of respondents felt there was good cooperation between teams
across their agency, an increase of 4.9 percentage points since 2019. These results are
especially encouraging considering that many people have been physically separated
due to arrangements such as working from home and staggered rostering.
Employee perceptions of between-organisation collaboration also increased between
2019 and 2020, by 3.2 percentage points. This is a positive sign given that collaboration
will become increasingly important in navigating our complex world and delivering
world class services to the people and businesses of NSW.
Partnering with the community to be COVID-safe
in Toomelah
The challenges of 2020 saw the NSW public sector work in new ways with
communities to protect the health of those most at risk.
Several parts of the sector worked with the small Aboriginal community
of Toomelah, in remote North West NSW, to implement the frst COVID-19
Community Action Plan. This approach has since been replicated in other
Aboriginal communities across NSW, acting as a model for efective community
collaboration.
Toomelah’s overcrowded housing and disproportionally greater health concerns
meant the community would have been particularly vulnerable had a COVID-19
outbreak occurred.
In March 2020, as many were still working to understand the threat posed by
COVID-19, Aboriginal Afairs NSW (part of the Department of Premier and Cabinet)
contacted the Toomelah Local Aboriginal Land Council (LALC) to begin work on a
Community Action Plan.
The community led the development of the plan, taking responsibility for its
design and enforcement. By April, all parties had agreed on the plan – the shortest
time the community had taken to move from inception to implementation of a
government initiative.
State of the NSW Public Sector Report 2020 29Chapter 2: Response
The Community Action Plan outlined agreed actions for the community, the NSW
Government, non-government organisations and the Commonwealth Government
should COVID-19 enter the community. It was structured around three levels of
threat: preparation, containment and elimination.
Crowded housing posed problems for isolation. In response, vacant Teacher
Housing Authority properties were made available and new temporary
accommodation was built. A barrier was put in place in Toomelah to prevent any
non-essential services from entering the town. This barrier successfully protected
Toomelah from acquiring any COVID-19 cases, so the second and third components
of the plan – containment and elimination – did not need to be enacted.
However, with schools across the state shutting down in April and limited home
internet access in Toomelah, the community faced a new challenge: how to deliver
online schooling. The Department of Education, Department of Regional NSW
and Toomelah LALC again worked together to develop a solution. In the end, the
school’s wi-f signal was extended to allow much of the community to access the
school’s wi-f network from home. The agencies involved are now investigating
whether this access can be extended beyond the school system to also allow free
access to the Service NSW website.
Toomelah’s location on the NSW–Queensland border presented additional
challenges as new restrictions required community members to provide
identifcation to cross the border – necessary for Toomelah residents to access
the closest hospital, supermarket and other essential services. Many residents of
Aboriginal communities have no photo identifcation. To resolve this issue, the LALC
invited Service NSW to the community to process legal photo identifcation
applications for willing residents.
Support from the NSW public sector during the pandemic, and the willingness
of all involved to collaborate respectfully and efectively for the beneft of the
community, has built strong bonds of trust. It has also served as a blueprint for
genuine government–community collaboration that will hopefully inform the
sector’s broader work in serving customer needs.
30 NSW Public Service CommissionEmployee engagement and productivity
Around 16% of the public sector workforce responded to the frst People Matter survey,
which was launched in 2012. Promoting the value of the survey to employees and
agencies, and showing employees that their views are taken seriously, has improved the
response rate over time (see Figure 2.4). In 2020, 104,598 out of 221,149 employees had
their say – a response rate of 47.3%.
Figure 2.4 People Matter survey participation, 2016–20
Source: People Matter
Employee Survey 200,000 100
(2016–20)
180,000 90
160,000 80
Number of responses
140,000 70
Response rate (%)
120,000 60
100,000 50
80,000 40
60,000 30
40,000 20
20,000 10
0 0
2016 2017 2018 2019 2020
Year
Number of responses Response rate (%)
State of the NSW Public Sector Report 2020 31Chapter 2: Response
Though most of the Health cluster did not participate in the 2020 survey, the results
are still indicative of the performance of the sector during the peak of the COVID-19
pandemic and the ensuing months.
Employee engagement is an important measure for the sector because it can be
used as a proxy for productivity and, therefore, the overall performance of the sector.
In sum, employee engagement is an individual’s connection and commitment to their
organisation.4 The People Matter survey measures employee engagement using fve
questions that assess feelings of pride, attachment, motivation and inspiration, and an
employee’s willingness to recommend their organisation as a great place to work.
Many factors infuence employee engagement, including leadership, positive work
culture, organisational support, and the ability to work fexibly.5 Engaged employees
are more innovative and higher performing, and they experience better wellbeing.6
Employee engagement has also been linked to higher levels of customer satisfaction
and other organisational variables, including lower rates of employee turnover.7 This is
why it’s so important to track engagement – it shows where we are on our journey to
providing a world class employee experience.
Despite the many challenges of 2020, the sector continued its upward trajectory for
employee engagement (see Figure 2.5). The scores for most other topics measured in
the survey also improved, some by a large amount, which is a tremendous achievement
for the sector.
Figure 2.5 Employee engagement, 2016–20
Source: People Matter
Employee Survey 70
(2016–20)
69
68
Employee engagement
67
66
65
64
63
62
61
60
2016 2017 2018 2019 2020
Year
4. Scottish Executive Social Research (2007)
5. Attridge (2009); Pitt-Catsouphes and Matz-Costa (2008)
6. Alfes, Truss, Soane, Rees and Gatenby (2010)
7. Harter, Schmidt and Hayes (2002)
32 NSW Public Service CommissionCustomer satisfaction
Another measure of the performance of the sector is customer satisfaction. The many
parts of the NSW public sector share a common goal: delivering services that make
NSW a great place to live, work, visit and invest in. When our customers are satisfed,
it means the sector is achieving this goal and performing well – that our services are
easy to use, high quality and accessible to all.
The Customer Experience Unit in the Department of Customer Service developed
the CSMS in 2013. A key survey output is the Customer Satisfaction Index. The index
assesses how satisfed customers are with a government service, how close their
experience is to their expectations of that service, and how close their experience is to
an ideal service. It is scored out of 100. A higher score means that customers are more
satisfed overall. Scores can be averaged across services to produce a score for the
whole sector.
Despite a challenging year, the Customer Satisfaction Index reached an all-time high in
2020 for consumers and businesses (see Figure 2.6). But more can be done to improve
interactions between government and consumers and businesses.
Figure 2.6 Customer Satisfaction Index scores for consumers and
Source: Customer
Satisfaction Measurement
businesses, 2016–20
Survey (2016–20)
85
84
83
82
81
Index score
80
79
78
77
76
75
2016 2017 2018 2019 2020
Year
Consumers Businesses
State of the NSW Public Sector Report 2020 33Chapter 2: Response
The NSW public sector response to the Black Summer
bushfres
As we continue to deal with the COVID-19 pandemic, it can be easy to forget the
impact of the 2019–20 bushfres on the state, the country and even the world.
Over the 2019–20 fre season, 11,774 fres across NSW burnt more than 5.5 million
hectares of land – about 7.0% of the state’s total land area. They destroyed
2,476 houses, three schools, 284 facilities and 5,559 outbuildings, and damaged
800 kilometres of road.8 The Government declared a State of Emergency
three times.
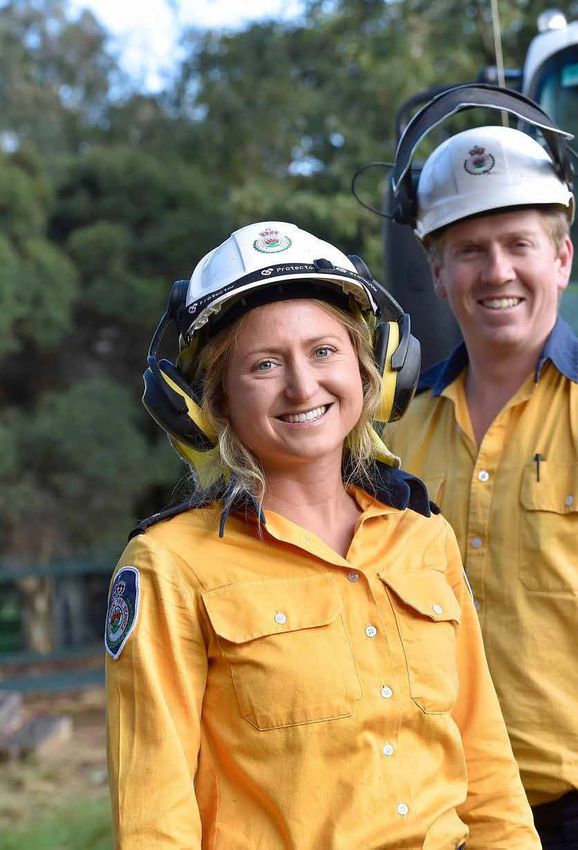
Images of NSW employees from the Rural Fire Service – supported by Fire and
Rescue NSW, the National Parks and Wildlife Service, and the NSW Forestry
Corporation, all working to keep communities safe – were beamed around the world.
Agencies worked together, supporting each other and sharing years of knowledge
to minimise the devastating impacts on the NSW community.
Taken from the NSW Premier’s Award 2020 nominations, the following are just
some of the ways the NSW public sector served customers and the community
during and after the fres.
The Department of Communities and Justice established the Bushfre Housing
Assistance Service and the Bushfre Housing Assistance Response Team to support
people displaced due to the fres. More than 8,000 people received more than
19,000 nights of accommodation.
The Department of Customer Service’s Spatial Services’ Emergency Information
Coordination Unit became a hub for emergency data sharing across NSW
Government. The unit delivered timely spatial data and imagery for emergency
services at the height of the bushfres. It continues to support recovery
eforts and collaborate with Infrastructure NSW on infrastructure and asset
management for better planning, forecasting and responses for future bushfre and
emergency events.
The Department of Education worked to ensure schools were safe and able
to open on day one of Term 1, 2020. This helped provide a sense of normality
and security for young people who had experienced the trauma of the fres.
The department conducted safety checks for over 400 schools in three weeks,
and rebuilt two schools in less than three months.
Local Land Services used existing expertise to establish a triage call centre, taking
pressure of emergency services. The agency provided landholders and animal
owners with veterinary advice, fodder, water and other support for injured and
displaced animals. The agency also assisted the community with the daunting task
of stock destruction and burial.
8. Owens and O’Kane (2020)
34 NSW Public Service CommissionThe NSW Telco Authority provided 24-hour emergency coordination of
telecommunications to support emergency services. The authority maintains
the Public Safety Network (PSN), providing reliable radio communications for
emergency services. The PSN provided more than 99% coverage throughout the
crisis, helping crews and local communities remain safe.
The Department of Planning, Industry and Environment began emergency
air monitoring and quickly deployed nine temporary monitoring stations,
at Batemans Bay, Cofs Harbour, Cooma, Grafton, Lismore, Merimbula,
Port Macquarie, Taree and Ulladulla. These stations provided vital information
on air quality in impacted communities. Five of the monitoring stations are
now permanent.
Public Works Advisory, within the Regional NSW cluster, worked with contractors
to clear debris from fre-damaged properties and make communities safe as
quickly as possible. It cleared close to 3,600 properties and directly injected more
than $150 million into local communities, assisting with economic recovery.
Service NSW extended hours and worked tirelessly to connect those impacted by
the fres to diferent government services.
TAFE NSW ofered fee-free short courses to afected communities, providing the
skills needed to help rebuild devastated communities. More than 1,500 people
enrolled for free training.
Transport for NSW employees worked around the clock – often surrounded
by infrastructure that was still smouldering – to reopen afected road and rail
infrastructure, which at times provided vital connections to regional communities.
The unprecedented speed with which these essential services were repaired,
reopened or reimagined is testament to the unswerving commitment of the
NSW public sector to NSW communities.
Despite the challenges posed by 2020, the NSW public sector didn’t just maintain
productivity – it increased it. Improvements to employee engagement and customer
satisfaction scores is compelling evidence of this.
The sector continued to pursue the Premier’s Priority of achieving a world class
public service by focusing on outcomes. This is refected in NSW Treasury’s move
from program budgeting to outcomes-based budgeting, shifting the emphasis of the
budgeting process from activities and initiatives to putting citizen outcomes at the
centre. The PSC is also working with clusters to help them measure and report on their
major program outcomes, to develop a fuller picture of the sector’s productivity.
Improved sector productivity also took the form of making the most of our people.
Embracing fexible working has meant employees are managed based on outcomes
rather than simply time spent at their desk. Mobilising employees to respond to
bushfres and the pandemic also helped boost productivity by increasing development
opportunities, reinvigorating engagement and ensuring our people were best placed to
meet customer needs.
State of the NSW Public Sector Report 2020 35You can also read