Evidence for the Farmer-Led Arable Climate Change Group
←
→
Page content transcription
If your browser does not render page correctly, please read the page content below
Farming and Food Analysis
RESAS
March 2021
Evidence for the Farmer-Led Arable
Climate Change Group
Briefing
This report highlights evidence on Scotland’s arable sectors for the Arable farmer-
led climate change group, covering the context and structure of the industry,
greenhouse gas emissions, biodiversity, performance and productivity.
@SGRESAS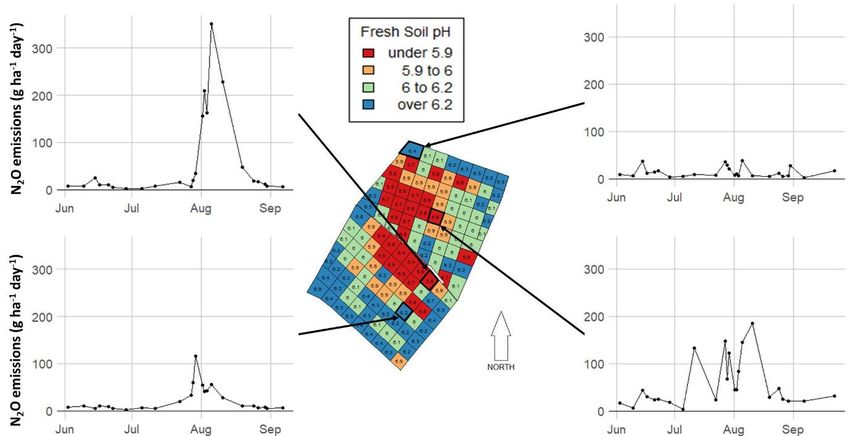
Executive Summary
This report highlights evidence on the Scottish arable sector and its contribution to Green
House Gas (GHG) emissions. For the purposes of this report, the ‘arable sector’ includes
cereals, other crops, horticulture, and vegetables (incl. for human consumption, stock feed
and seeds).
The main findings from this report are:
Context and structure:
In 2019, the combined output of arable produce in Scotland (cereals, cereals, crops,
fruit and vegetables) accounted for a third of agricultural output with a value of £1.1
billion.
Around 550,000 hectares were used to grow cereals, crops, fruit and vegetables,
accounting for around 10% of Scotland’s total agricultural area. This is also
equivalent to 12% of the total arable land in the UK
In 2018-19, the average Scottish farm had a farm business income (incl. support
payments) of around £38,700. On average, General Cropping and Cereal farms
show significantly higher profitability at £132,000 and £64,000 respectively.
When support payments are excluded, over 60% of cereal farms and just under 80%
of General cropping farms remain profitable, compared to 28% of farms across the
agricultural sector as a whole.
Production and destinations of arable produce vary with supply and demand. The
area, yield and quality of crops can vary due to land suitability, environmental
conditions, pests and diseases. Not all arable produce is intended for or fit for human
consumption. Around 35% of cereal production went to animal feed in 2019.
Greenhouse gas emissions and biodiversity:
Large reductions in emissions are required from all sectors of the Scottish economy
to meet Scotland’s legally binding 2045 Net Zero target, and the target of a 75%
reduction from 1990 levels by 2030.
Agriculture represented 18% of Scotland’s emissions, or 7.5 MtCO2e1, in 2018. The
Scottish Government’s Climate Change Plan update requires the equivalent of a 31%
reduction in agricultural emissions by 2032 from 2018 levels, a pace around four
times faster than historic declines.
Emissions from arable farms account for around 1.6 MtCO2e, or 21% of total
agricultural emissions, the majority of which are from farm vehicles and soil
management.
Evidence on technically feasible mitigation specific to arable and tillaging covers
(amongst other things) grain/legume rotations, pH management, and variable rate
nitrogen & lime application.
1
Million tonnes of carbon dioxide equivalent
1 Evidence for the Farmer-Led Arable Climate
Change Group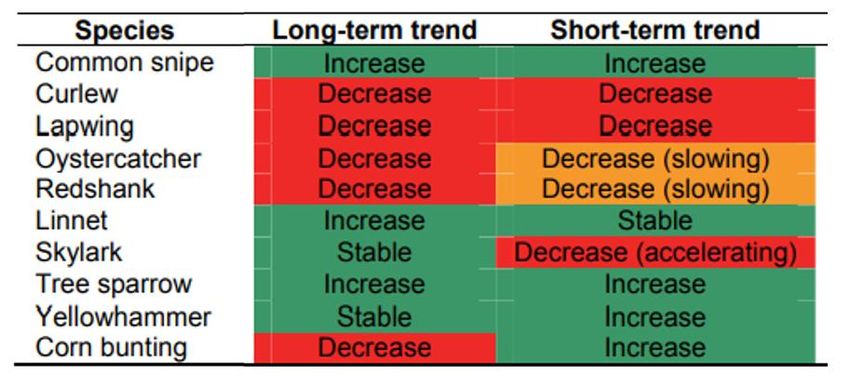
Evidence suggests these measures could deliver reductions around 0.24 to 0.3
MtCO2e, if applied to their maximum technical capacity based on current levels of
arable land. This equates to a 15-19% reduction of arable emissions and, if matched
with equivalent reductions across all agricultural sector, would not be sufficient to
meet agriculture’s envelopes by 2032, falling short by around half.
The Climate Change Committee states changes in farming practices, woodland
planting and reductions in livestock numbers are all required to achieve net zero.
Their advice also highlights three key changes required to reduce agricultural
emissions:
1 - Diet change with their main pathway to net-zero assuming a 20%
reduction in UK consumption of red meat by 2030, rising to 35% by 2050
2 – Low-carbon farming practices, similar to those outlined above
3 – Productivity measures to improve crop yields and reduce stocking rates
The Climate Change Committee have also stressed that not only are the changes
outlined critical for agriculture to reduce its emissions but also critical to free up the
land required for other sectors to achieve the emissions reductions needed.
Scotland has recognised loss of biodiversity as a twin challenge alongside the climate
emergency. Overall, biodiversity benefits from a mix of habitats and is influenced by
land use intensities. Declines in biodiversity can be directly linked to agricultural
intensification and pesticide use. However there are proven ways to improve
biodiversity on arable farms including through management of hedgerows, field
margins, crop rotation, retaining winter stubble and use of green manure.
Performance and productivity:
Evidence suggests that Scotland is mid-table in international comparisons when it
comes to agricultural productivity growth. This report sets out some potential options
for increasing agricultural productivity in Scotland.
As with other farms types in Scotland, the performance of Cereals and General
Cropping farms varies, both between and within farm types.
Cereal farms’ efficiency in particular is volatile, potentially due to their specialisation
and vulnerability to global market prices, weather and supply – more so than many
other farm types in Scotland.
2 Evidence for the Farmer-Led Arable Climate
Change Group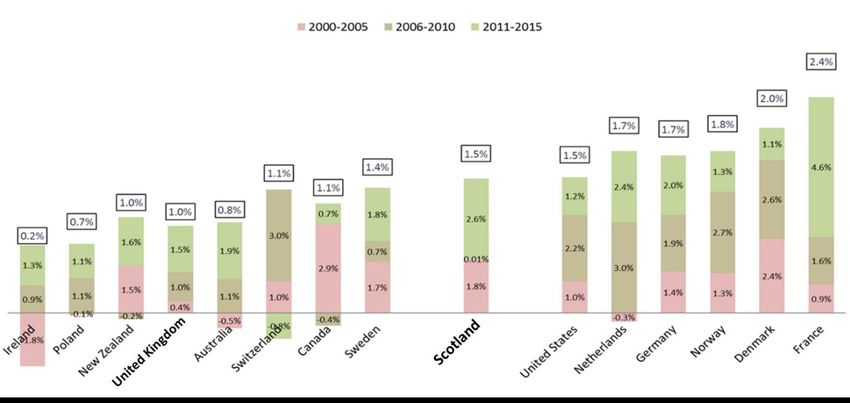
Contents

       Context and Structure ...................................................................................... 4
            Composition of the Arable Sector.................................................................. 4
            Profitability and Turnover .............................................................................. 7
            Future Trends.............................................................................................. 10
       Greenhouse Gas Emissions and Biodiversity .............................................. 13
            Sector Emissions ........................................................................................ 13
            Options for Reducing Emissions ................................................................. 15
            Biodiversity .................................................................................................. 19
       Performance and Productivity ....................................................................... 24
            Key Metrics for Performance and Productivity ............................................ 24
            Options for Improving Performance ............................................................ 26
Annex A – Definitions and Classifications of Farms........................................... 29
Annex B – Tables ................................................................................................... 30
Annex C – GHG Inventory Assumptions .............................................................. 34
Annex D – CXC Measures for the Arable Sector ................................................. 35
    Growing more grain legumes in rotations ............................................................. 35
    Crop varieties with higher nitrogen-use efficiency ................................................ 36
    Intercropping ......................................................................................................... 39
    Nitrification and urease inhibitors .......................................................................... 41
    Soil pH management ............................................................................................ 43
    Slurry injection and bandspreading of slurry ......................................................... 45
    Variable rate nitrogen and lime application ........................................................... 48
Annex E – Productivity Measures – long list ....................................................... 53

3                                                                      Evidence for the Farmer-Led Arable Climate
                                                                                                   Change Group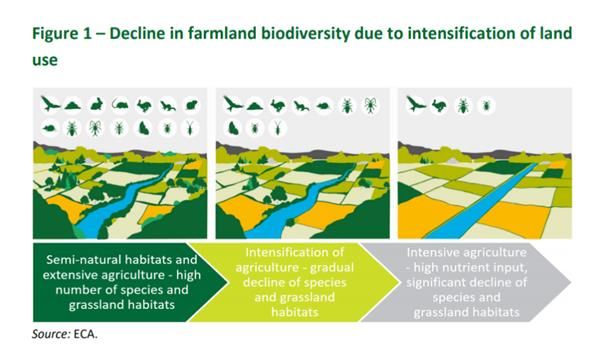
Context and Structure
        Composition of the Arable Sector
          Definition
Data on farms that specialise in cropping, and data on the total arable land in Scotland, are
both important to understanding the overall Scottish arable sector. Arable land is defined
here as land used for crops, fallow and set aside land. Around 10% of Scotland’s total
agricultural area in 2019 was arable land.

Unless otherwise stated, data in this chapter are from the June Agricultural Census, Total
Income from Farming (TIFF), and Farm Business Survey (FBS), further detail in Annex B.

Farms where more than two-thirds of output comes from arable are categorised as
‘specialist cereal’, ‘general cropping’ and ‘horticulture’ farms. Specialist cereal farms make
more than two-thirds of their output from cereals and oilseeds. General cropping farms make
more than two thirds of output from crops. Horticulture farms make more than two-thirds of
their output from fruit, vegetables, flowers, nursery stock and mushrooms. A glossary and
definitions of these categories and other terms can be found in Annex A.
          Composition of the Arable Sector
In 2019, around 550,000 hectares were used to grow cereals, crops, fruit and vegetables2 in
Scotland, accounting for around 12%3 of the total arable land in the UK and around 10% of
Scotland’s total agricultural area. Large areas of Scotland have limited arable growing
conditions. These are usually hilly or rocky lands that are more suitable for livestock. In
2019, 86% of the total agricultural land area in Scotland was designated as Less Favourable
Areas (LFA)4. Most of Scotland’s arable land, 80% in 2019, was on non-LFA land.

Further details on the distribution of arable land use by crop in 2019 in both Scotland and the
UK as a whole, are included in Table B1 in Annex B.

Collectively, Scottish farmers produced around 4.7 million tonnes of arable produce. Barley
varieties accounted for the majority (nearly 2 million tonnes or 41%), with wheat and potato
varieties accounting for much of the rest – 20% and 25% respectively.

In terms of value, the combined output was around £1.1 billion, accounting for a third of
Scotland’s total agricultural output by value. Around £250 million of the output was
attributable to potatoes, and barley accounted for an additional £250 million.

Production and destinations of arable produce vary with demand and supply. The area, yield
and quality of crops can vary due to land suitability, environmental conditions, pests and
diseases. Not all arable produce is intended for or fit for human consumption.

2
  Excluding around 30,000 hectares fallow and set aside land
3
  Agriculture in the UK 2019 (publishing.service.gov.uk)
4
  Including common grazing. Figure based on Scottish Agricultural Census: June 2019 https://www.gov.scot/publications/final-
results-june-2019-agricultural-census/pages/1/ and UK Standard Area Measurements (SAM)

4                                                                      Evidence for the Farmer-Led Arable Climate
                                                                                                   Change Group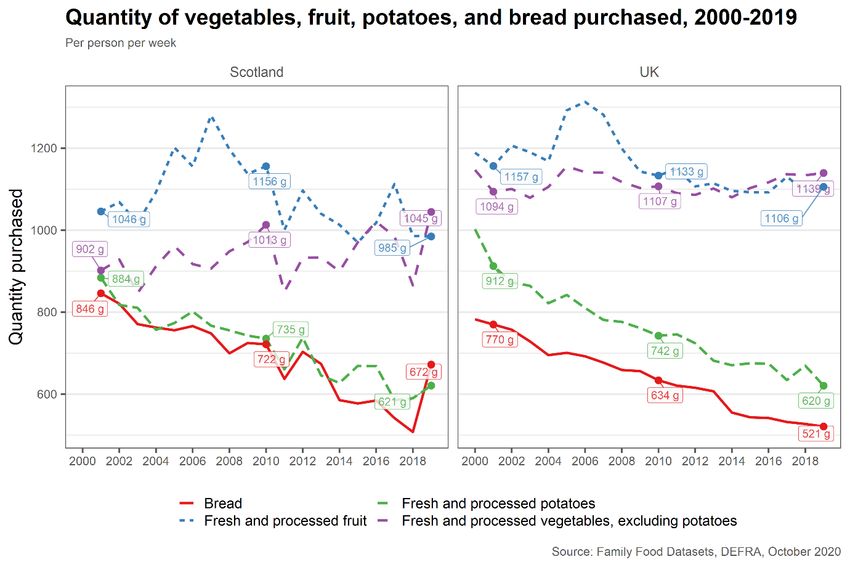
Outputs and Value – Cereals and oilseed rape
In 2019, Scottish farmers produced around 3.2 million tonnes of cereals and oilseed rape, a
22% increase on 2018 and the highest year for cereal production since 2015.
The rise in production was due to an increase in average yields, largely due to improved
weather conditions in 2019, with 2018 being a poor year for both yield and production. The
total area of cereals and oilseed rape sown remain fairly stable, increasing by 2%. Around
462,000 hectares in total were used to grow cereals and oilseeds in 2019.
As shown in Table 1, barley is the main cereal crop grown in Scotland, most of which is
spring barley. Around 291,000 hectares of barley were planted in 2019, making up 63% of
the total area used to grow cereals and oilseeds.
Table 1: Area, yield and production estimates for the 2018 and 2019 Scottish harvest
                      2018                                     2019
                      Area          Yield           Production Area                   Yield           Production
Crop
                      (000 ha)      (t/ha)          (000 t)    000 ha)                (t/ha)          (000 t)
Wheat                 100           6.8             681        107                    8.7             937
Oats                  32            5.5             176        32                     5.9             189
Total Barley          288           5.7             1,656      291                    6.7             1,943
   of which:
      Winter Barley   38            7.1             268               49              8.2             399
      Spring Barley   250           5.5             1,388             242             6.4             1,544
Total Cereals         420           6.0             2,512             430             7.1             3,069
Oilseed Rape          33            3.9             126               32              3.9             124
                            Source: Cereal and oilseed rape harvest: final estimates - 2019 - gov.scot (www.gov.scot)

Cereals have a strong association with the whisky industry. The major markets for Scottish
cereals are malting (44% of all cereals in 2019), animal feed (35%) and milling (8%). Around
53% of barley production in 2019 was sold for use in the malting industry. 33% of Scottish
wheat production was also sold for malting.

In 2019, the combined output of Scottish cereals was around £409 million, the equivalent to
12% of Scottish agriculture’s total output by value. Barley varieties accounted for the lion’s
share (£250 million or 61%) with wheat accounting for a further third (£107 million). The
output from oilseed rape in the same year was around £39 million.

In 2019 the market value of cereals produced for feed and other purposes (including sales to
animal feed manufacturers, feed and seed retained on farm of origin or sold farm-to-farm)
was estimated at £142 million, around 35% of the combined value of output above.
       Outputs and Value – Potatoes and other crops
In 2019, around 28,500 hectares were used to grow potato varieties – both seed (planting)
and ware (eating). This increased 4% on 2018, but was 2% below the ten-year average.
Both seed and ware potatoes increased in area.

In 2019, total output from Scottish potatoes was around £250 million, 22% of arable and 7%
of Scottish agricultural output by value. Seed potatoes accounted for £155 million of this.

Other crops, grown in smaller quantities, include triticale, rye, peas and beans for combining
and crops for stock feeding. They account for a further 26,000 hectares of which around

5                                                              Evidence for the Farmer-Led Arable Climate
                                                                                           Change Group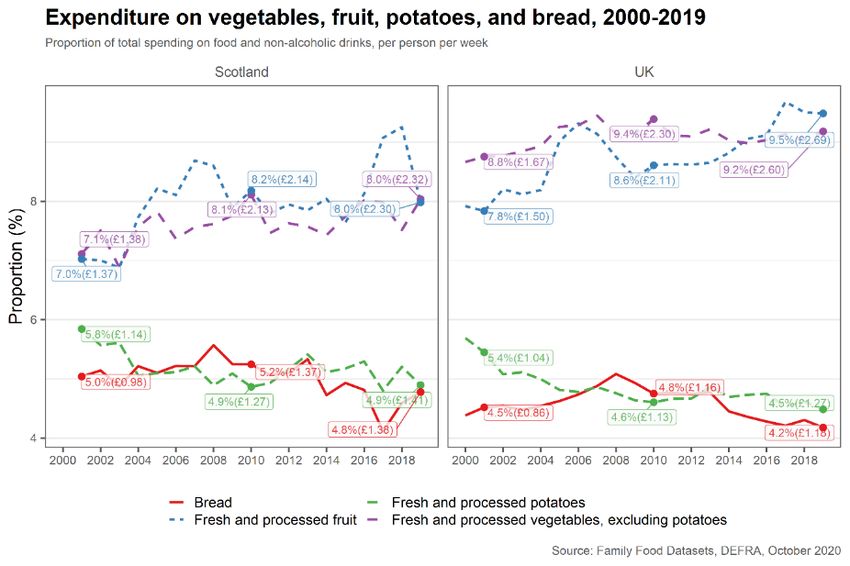
19,000 were to grow vegetables for stock-feeding. These crops, which also include oilseed
rape, contributed around £76 million, 7% of arable or 2% of total Scottish agricultural output.
       Outputs and Value – Horticulture
In 2019, the area used to grow vegetables intended for human consumption (excluding
potatoes) remained fairly steady at around 19,000 hectares, a 1% decrease from the
previous year but remaining above the ten-year average.

From 2018 to 2019, the total soft fruit growing areas decreased by 1% to around 2,000
hectares. However, it remains higher than the average over the past 10 years. Strawberries
are the most popular grown fruit, followed by blackcurrants and raspberries. Most fruit
(around 73%) is grown under cover in either glasshouses or walk-in plastic structures (Poly-
tunnels), allowing for a much longer growing season.

In 2019, the total output from Scottish horticulture was around £346 million, the equivalent to
31% of arable output and 10% of Scottish agriculture’s total output by value. Most of this
came from vegetables (£164 million or 48%) and fruit (£144 million or 42%). Flowers and
nursery stock accounted for a further £37 million (11% of horticulture output).
       Scottish Arable Farms

11,500                            22%                                          550,000
Number of holdings with arable    Percentage of all Scottish holdings          Area of Arable Land
land                              with arable land

Of Scotland’s 51,000 holdings, 22% had arable land in 2019. The majority of arable land is
accounted for by specialist cereal (5% of holdings and 30% of arable land) and general
cropping holdings (3% of holdings and 30% of arable land). Of all holdings, a further 1%
were specialist horticulture (2% of arable land).

Most of the arable land and arable holdings in Scotland are in the South East and North
East. Table 2 below provides the figures for specialist cropping and specialist cereal farms.
Full details are included in Tables B2 & B3 in Annex B.
Table 2. Number of specialist cropping, cereal or arable holdings by region, 2019
                          Specialist General            Specialist Cereal           All Holdings with
                          Cropping Holdings             Holdings                    Arable Land
NUTS2
                                        Arable                        Arable                       Arable
                          Holdings                      Holdings                Holdings
                                        Area (ha)                     Area (ha)                    Area (ha)
North East Scotland       260           24,900          900           55,200        2,720          148,600
Eastern Scotland          910           107,000         790           59,100        2,880          227,300
Southern Scotland         120           17,900          310           32,500        2,220          101,000
Highlands & Islands       350           16,200          340           17,000        3,570          68,700
West Central Scotland 10                400             20            1,200         150            3,300
Scotland                  1,650         166,300         2,360         165,000       11,520         548,900
                                      Source: June Agricultural Census 2020, via RESAS Agricultural Analysis Unit

6                                                           Evidence for the Farmer-Led Arable Climate
                                                                                        Change Group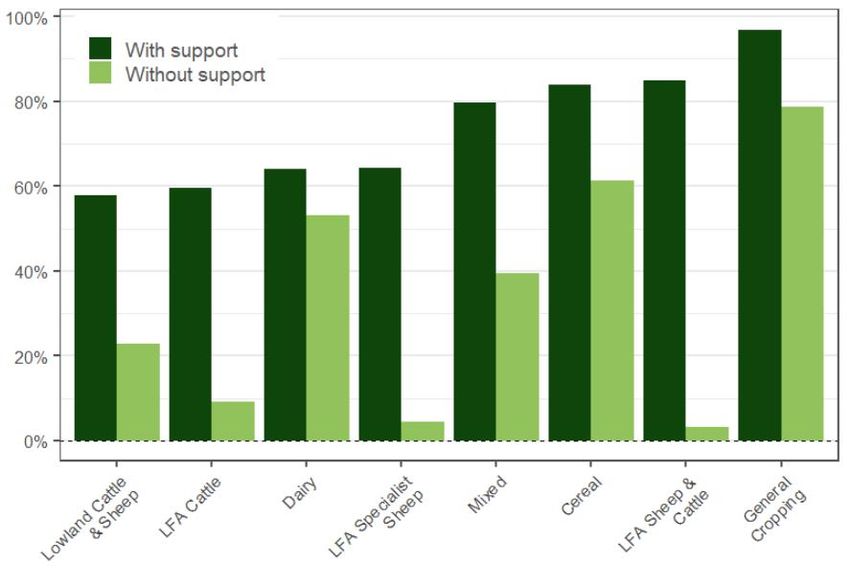
Holding Size
In 2019, 61% of arable farms were between 10 and 200 hectares. Smaller or larger holdings
are less common. Of specialist cereal holdings, 12% were larger than 200 hectares and
covered around 73,000 hectares, or 44% of total cereal area. In general cropping, 23% of
holdings were larger than 200 hectares and covered around 92,000 hectares, or 55% of the
general cropping area. In contrast, the majority of horticulture (78%) farms were under 10
hectares in size. Full details are in Table B4-6 in Annex B.
         Workforce
Different crops have different labour requirements. Specialist cereal holdings rely on a mix of
occupiers and spouses, accounting for 53% of the workforce, and employees, for 39%. On
general cropping holdings 44% of labour is from occupiers and spouses and 45% from hired
employees. Horticulture is more reliant on hired labour, which makes up 21% of the
workforce while 67% are casual or seasonal staff. Full details are in Annex B in Table B7-9.

       Profitability and Turnover
         Estimated Farm Business Incomes and Profit
Farm Business Income (FBI) statistics are estimated from a sample of nearly 500 farms with
a standard output (the average monetary value of the agricultural output at farm-gate price)
over €25,000. The FBS does not collect information on non-supported sectors, which include
farms predominantly engaged in horticulture, pigs, poultry and some fruit production. A large
number of part-time and small Scottish farms with low output are also not included5.
Farms with more than two thirds of output from crops are categorised by the FBS as Cereals
or General Cropping. A glossary and definitions of these and other terms is in Annex A.
Table 3 shows FBI by upper and lower performance bands, with and without support
payments. FBI is used to show the profit a farm makes. FBI figures measure profitability from
agricultural activity and includes income from non-agricultural activities using farm
resources. For example, tourism, renewables or processing and sale of farm products. There
are wide variations in performance across farm types.
In 2018-19, the average FBI in Scotland was around £38,700. Excluding support payments,
this falls to around -£4,700, suggesting support plays an important role for many farms.
On average, General Cropping and Cereal farms show higher profitability. General Cropping
farms are most profitable with average FBI of around £132,100, falling to £91,800 excluding
support. Cereal farms had an average FBI of around £64,100 or £30,900 excluding support.
Table 3. Farm business income by performance band – arable farms
                        Lower 25%                         Average                        Upper 25%
                        Including        Excluding        Including      Excluding       Including      Excluding
                        Support          Support          Support        Support         Support        Support
Cereals                 -£800            -£26,900         £64,100        £30,900         £188,600 £134,800
General Cropping £27,800                 -£3,200          £132,100 £91,800               £294,300 £245,000
All Farms               -£15,500         -£53,800         £38,700        -£4,700         £159,800 £100,800

5
 Farms with Standard Labour Requirements (SLR) more than 0.5. Standard Labour Requirements represent the approximate
average labour requirement for a livestock or crop enterprise. The annual hours of a full-time worker is 1,900 hours.

7                                                                  Evidence for the Farmer-Led Arable Climate
                                                                                               Change Group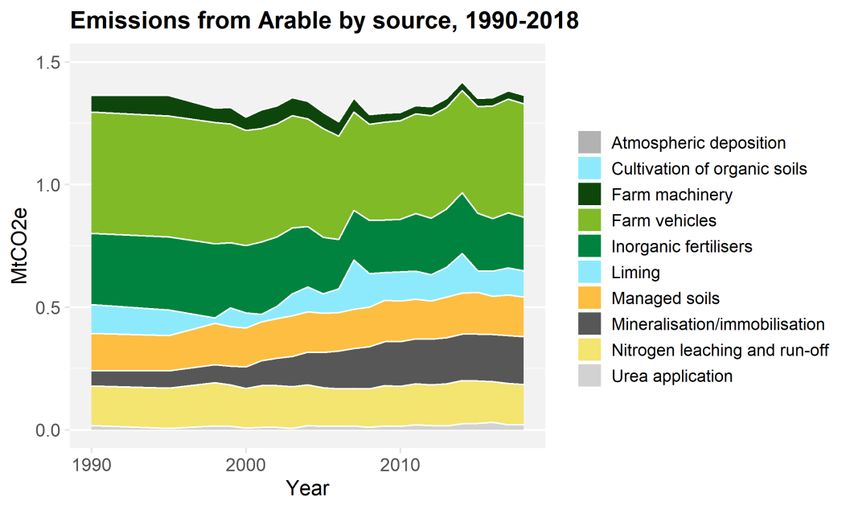
Source: Farm Business Survey 2018/2019

The figure below shows profitability by farm type, represented by the proportion of farms with
income from farming greater than zero (i.e. agricultural output is greater than input). Around
80% or more of Cereal, General Cropping or Mixed farms were profitable with support
payments and in comparison to farming sectors engaged primarily in cattle and sheep this
drops relatively little when support payments are removed.
Proportion of farms with agricultural output greater than input, 2018-19

                                                     NO

Scottish Government analysis shows that across all farm types, 28% of farm businesses turn
a profit without support, and 72% turn a profit when support is included.

Table 4 shows the average total input, amount received from support payments and grants
and output for arable farm types. Economic efficiency is calculated as a ratio of outputs to
inputs. The average General Cropping farm had the highest economic efficiency in 2018-19,
of around 144%. Cereal farms were on average more economically efficient than the
average farm, with efficiency around 136%.
Table 4. Farm output and input – arable farms
                                                          Support
                                                                          Diversification Economic
                    Output          Input                 payments
                                                                          Margin          efficiency*
                                                          and grants
Cereals             £208,600        £188,300              £33,200         £10,700              136%
General Cropping £429,000           £346,200              £40,200         £9,000               144%
All Farms           £190,000        £199,300              £43,400         £4,600               124%
                          * Including support payments and diversification. Source: Farm Business Survey 2018/2019

       Diversification
Data on diversification and investment in renewable energies on arable farms in Scotland is
scarce. The Farm Structure Survey 2016 found that across all farming around 9% of farms

8                                                            Evidence for the Farmer-Led Arable Climate
                                                                                         Change Group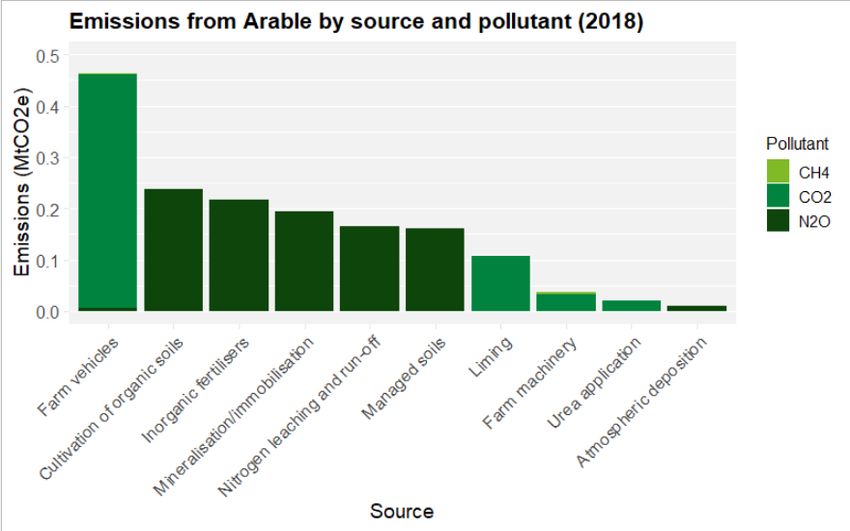
made more than 50% of their turnover from diversified activities and 16% made more than
10%. As shown in Table 5, more cereal (12%) and general cropping (14%) farms were
making 10-50% of their turnover from diversified activities, although fewer were making more
than 50%.
Table 5: Proportion of turnover from other gainful activities, by farm type, 2016
                                 Proportion of turnover from other gainful activities
Farm Type                        0-10%                      >10-50%                       More than 50%
                                 % of holdings              % of holdings                 % of holdings
Cereals                          82%                        12%                           6%
General Cropping                 80%                        14%                           6%
Horticulture                     70%                        11%                           19%
All Farms                        84%                        7%                            9%
                             * Including support payments and diversification. Source: Farm Business Survey 2018/2019

The Farmers’ Intention Survey 2018, summarised by SRUC in their October 2019 briefing,
revealed that over 50% of (Scottish) farmers (from all sectors) plan no changes to the levels
of agri-environmental provision on their holding in the succeeding five years, while between
approximately 14% and 27% of farmers plan to increase provision of “public goods” through
increased agri-environmental, forestry, small-scale woodland and renewable energy
production.
Of those who did signal intentions to increase these activities, identification of a successor,
status as a new entrant, tenure, gender and land type were the most significant
characteristics of those intending to increase public good activities. Lower productivity
of land appears to be a factor which positively influences the decision of farmers to increase
the level of forestry and small-scale woodland on their farm or holding.
The figure below shows the overall intentions of the farmers, crofters and smallholders
surveyed to change the level of activities on their farm or holding that may enhance ‘public
good’ provision in the next five years (2018-2023). Over 50% of respondents planned no
changes to the level of each of the activities and for many the question was not applicable as
they currently don’t engage in that activity. The type of public good provision that most
respondents planned to increase is agri-environmental activity, at 27%.

9                                                            Evidence for the Farmer-Led Arable Climate
                                                                                         Change Group
Future Trends
Impacts of Brexit
In late 2020, the Anderson Centre produced a report for Scottish Government, assessing the
impacts on Scottish agriculture of a UK-EU Free-Trade Agreement (FTA) and a No-Deal
Brexit.
Overall, the modelled impacts of an FTA were projected to result in relatively small changes
in Scottish agricultural output over the longer term. This is becausemost agricultural trade,
with the exception of seed potatoes, can continue effectively tariff-free and quota-free.
Indeed, the modelling suggests that increased demand from the rest of the UK could actually
increase Scottish agricultural output in some cases.
Specifically for wheat and barley (the cereals covered within the model), output by value
were projected to remain unchanged overall but with a larger shared consumed domestically
and less exported overseas. It should be noted that this modelling is not suitable for
capturing the initial disruption being experienced by individual businesses in the early stages
of the deal.
Trade between the UK and EU, however, is no longer frictionless with new non-tariff
measures (NTM) – additional certifications, enhanced border checks, etc. – now in place. As
a result, the costs of such trade are set to increase. For wheat and barley these costs are
projected to be minimal (around 0.1% ad-valorem equivalent (AVE) on average) owing to the
channels used (Bulk shipments rather than Ro-Ro) and the industry being largely
accustomed to trading across non-EU markets already. Where problems could arise are on
shipments of inputs and time delays when disease pressure is at its peak.
Changing Dietary Demands
According to a 2018 report by Food Standards Scotland6, Scottish households generally eat
too many calorie-dense foods, and do not eat enough fruit, vegetables, oil-rich fish, and
fibre. For example, the average intake of fruit and vegetables between 2001 and 2015 was
3.2 portions on average (257g per day) – this should increase to 5 portions a day (402g).
Inequalities exist as well: ‘most deprived’ areas consumed on average 2.5 portions, while
‘least deprived’ consumed 3.9 portions.7
Table 6. Average expenditure on veg, fruit, potatoes, and bread per person per week, 2018-19
Scotland UK
Category
Purchase Expenditure Purchase Expenditure
Bread 672g £1.36 521g £1.18
Potatoes* 621g £1.41 620g £1.27
Fruit and vegetables* 2,030g £4.62 2,245g £5.29
of which:
Vegetables* 1,045g £2.32 1,139g £2.60
Fruit* 985g £2.30 1,106g £2.69
Food and Non-Alcoholic Drinks .. £28.85 .. £28.32
* Fresh and/or processed. Source: Family Food, DEFRA, October 2020
6
Food Standards Scotland, 2018. Available at: https://www.foodstandards.gov.scot/downloads/Situation_report_-
_the_Scottish_diet_-_it_needs_to_change_-_2018_update_FINAL.pdf
7
Using SIMD classifications.
10 Evidence for the Farmer-Led Arable Climate
Change GroupDEFRA’s Family Food datasets, based partly on ONS’ Living Costs and Food Survey, show
UK and Scottish household purchases and expenditure on food and drink. The latest
release, with data up to 2018/2019, shows the average volume of fresh and processed fruit
and vegetables purchased has remained fairly stable, though below UK levels. In 2018/19,
Scottish households purchased 2,030g of fresh/processed fruit and vegetables per person
per week (290g/day) compared to 2,245g for UK households (321g/day).
The proportion of total food and drink expenditure spent on bread and potatoes has seen a
similar broad downward trend since 2001. In 2018/2019, 9.7% of total UK food and drink
expenditure was spent on bread and potatoes, a similar proportion to that seen in since 2001
(8.7% for Scottish households). Fruit and vegetable expenditure as a proportion of total food
and drink expenditure has increased for both UK and Scottish households.
11 Evidence for the Farmer-Led Arable Climate
Change GroupA number of key reports have discussed changes to red meat consumption. The UK Climate
Assembly8 – a citizens’ assembly on climate change – discussed their preferred future for
food, farming and land use on the path to net zero in the UK. This included 20-40% voluntary
and education driven reductions in red meat and dairy consumption.
The Climate Change Committee9 have also formally modelled these reductions in their 6th
Carbon Budget report in order to determine their pathways for the UK, including Scotland, to
reach net-zero by 2050.
Their advice also highlights three key changes required to reduce agricultural emissions:
i. diet change with their main pathway to net-zero assuming a 20% reduction in UK
consumption of red meat by 2030, rising to 35% by 2050;
ii. low-carbon farming practices;
iii. productivity measures to improve crop yields and reduce stocking rates.
The sectoral pathway for Scottish agriculture in the CCC report requires an emissions
reduction of 23% by 2030 and the CCC state changes in farming practices, woodland
planting and reductions in livestock numbers are all required to achieve net zero.
Such changes in Scottish diets may not directly impact cereal production, but could indirectly
affect the arable sector via reduced demand for animal feed: a large proportion of Scottish-
produced feed grains are destined for the Scottish red meat sector, of which the majority of
outputs are destined for the rest of the UK.10
8
https://www.climateassembly.uk/report/read/final-report-exec-summary.pdf
9
Sixth Carbon Budget - Climate Change Committee (theccc.org.uk)
10
Anderson Centre, Dec 2020. Summary Report: Analysis of Brexit Scenario Impacts on Scottish Agricultural Sectors.
12 Evidence for the Farmer-Led Arable Climate
Change GroupGreenhouse Gas Emissions and Biodiversity
Sector Emissions
The Scottish Government has committed to reaching net zero emissions by 2045, including
a reduction of 75% by 2030. Whilst a number of countries have adopted net zero targets by
on or around 2045, Scotland’s 2030 target is particularly ambitious and requires quick action.
Scotland has a legal requirement to meet these goals, and every industry must adjust to
contribute to reducing emissions. The Greenhouse Gas (GHG) inventory measures the
domestic emissions, i.e. those produced in Scotland. It is the key data source against which
Scottish Government measures its progress against its net zero targets. Emissions arising
from goods produced in Scotland and exported overseas for consumption are counted in the
Scottish GHG inventory. Emissions arising from goods produced overseas and imported into
Scotland for consumption are not counted in the Scottish GHG inventory.
In 2018 total Scottish emissions were 41.6 million tonnes of carbon dioxide equivalent
(MtCO2e). The 2019 figures are scheduled to be published in summer 2021.
In 2018 emissions from agriculture were 7.5 MtCO2e, or 18% of Scottish emissions. The
sectoral envelope as set out in the Climate Change Plan update requires agricultural
emissions reduce by 2.4 MtCO2e to 5.3 MtCO2e11 in 2032, the equivalent of a 31%
reduction from 2018 levels. As shown below this requires agriculture to reduce emissions at
a pace nearly four times faster than historic reductions. Progress towards delivering the plan
will be part of statutory annual reporting at a sector-by-sector level to the Scottish Parliament
from May 2021 onwards.
Source: Scottish Greenhouse Gas Emissions 2018 - gov.scot (www.gov.scot), Securing a green recovery on a path to net zero:
climate change plan 2018–2032 - update - gov.scot (www.gov.scot)
Note: there is a small break in the series due to a slight mismatch in the historic data and the forecast envelopes
11
The Climate Change Plan update incorporates some likely methodological changes not yet included in GHG inventory figures
resulting in 7.7 MtCO2e in 2018 rather than 7.5.
13 Evidence for the Farmer-Led Arable Climate
Change GroupEmissions from Arable Farms
The GHG Inventory for agriculture includes emissions from fertilisers, crop residues, and
managed soils. It does not explicitly break down all relevant emissions by sub-sector.
Therefore, we have estimated emissions from arable of 1.61 MtCO2e, 21% of agricultural
emissions. More detail on how we have done this is in Annex C. Unlike other sectors,
emissions from arable are mainly from carbon dioxide and nitrous oxide, with less than 1%
from methane. Between 1990 and 2018, emissions from arable have risen by 1%.
Source: Scottish Greenhouse Gas Emissions 2018 - gov.scot (www.gov.scot)
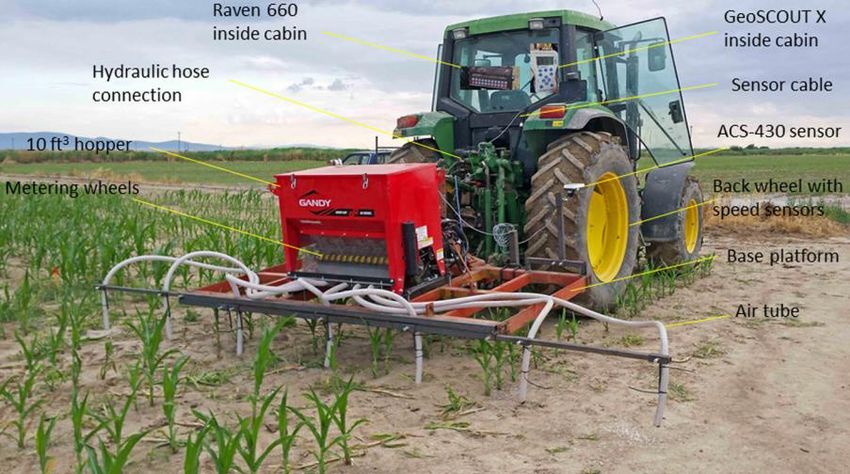
Sources
The chart below shows how the 2018 emissions from arable break down by source and
pollutant.12 Farm vehicles are the largest source, contributing 29% of emissions from arable.
The next largest source is cultivation of organic soils, contributing 15%.
Source: Scottish Greenhouse Gas Emissions 2018 - gov.scot (www.gov.scot),
RESAS classification based on ADAS data
12
It is not possible to split the GHG Inventory data by product type.
14 Evidence for the Farmer-Led Arable Climate
Change GroupOver time, the largest reductions in emissions by source have come from inorganic
fertilisers. However, emissions from mineralisation/immobilisation have more than doubled in
the same period. This increase is larger than the decrease from inorganic fertilisers.
Source: Scottish Greenhouse Gas Emissions 2018 - gov.scot (www.gov.scot),
RESAS classification based on ADAS data
Options for Reducing Emissions
Potential Savings
Research undertaken by CXC and SRUC on behalf of Scottish Government assessed
potential savings from mitigation measures that could be applied in Scotland and the likely
maximum uptake that could be achieved. The maximum uptake figures below are shown as
a percentage of arable and grassland.13 The report did not assess timescales for uptake of
measures, which will be influenced heavily by factors like behaviour change and policies.
Table 7 summarises measures that could be applied in the arable sector. Estimates of
aggregate emissions savings have been added based on the 2019 areas.
Table 7. Sources of climate change mitigation in crops and grassland by 2050
Per ha Aggregate
Area Maximum
Mitigation measure mitigation Mitigation
2019 Uptake 2050
(kg CO2e) (MtCO2e)
Grain legume rotations 5% 553 0.05
Improved crops 24% 13 0.006
Intercropping 6% 89 0.001
Nitrification and urease inhibitors 81% 71 0.11
1,863,000
pH management 33% 112 0.07
ha
Slurry injection 17% 26 0.01
Slurry trailing hose 17% 7 0.002
Variable rate nitrogen & lime application 17% 151 0.05
Additive Total .. 0.3
Source: Marginal abatement cost curve for Scottish agriculture (climatexchange.org.uk)
13
It has not been possible to provide specific figures for only arable in the timeframe
15 Evidence for the Farmer-Led Arable Climate
Change GroupStrictly speaking the ‘additive total’ overstates the savings as some measures may interact
and reduce the impact of other measures. Whilst overall for agriculture in the CXC report,
these interactions were assessed to be relatively low they mainly occur in the measures
relevant to the arable sector and therefore may overestimate the total reduction.
This is because some measures cannot be carried out on the same land in certain
combinations, or may be less effective if they are. For example, soil pH management can be
applied to a maximum of 33% of agricultural land, and variable rate nitrogen and lime
application can be applied to a maximum of 17% of agricultural land – however, they cannot
be applied together, meaning the true maximum for both measures is 33%. As a result,
constraints may slightly overestimate the mitigation potential overall. Mainly this is related to
the combined uptake of slurry measures, pH management, variable liming, nitrification
inhibitors and legumes on the same land. Further explanation is available on page 14 of the
CXC report.
If each of these measures were applied to their maximum potential as identified in the report,
estimated reductions from emissions based on current levels of arable land would be up to
around 0.3 MtCO2e. However, the potential interactions outlined above may reduce this by
around a fifth, to 0.24 MtCO2e.
This would be up to a 15-19% reduction in terms of 2018 emissions from the arable sector or
10-12% of the 2.4 MtCO2e reductions required by agriculture by 2032 with the remaining 88-
90% needed to come from elsewhere in the sector. This would not be sufficient to meet the
equivalent of the arable sector’s share of the necessary reductions. A reduction of 2.4
MtCO2e is equivalent to a 31% reduction from 2018 levels. Therefore, even if all agricultural
sectors were to achieve an equivalent 15-19% reduction in their emissions this would not be
sufficient, by around a half, for the agriculture sector to meet its envelope by 2032.
The Climate Change Committee states changes in farming practices, woodland planting and
reductions in livestock numbers are all required to achieve net zero. Their advice also
highlights three key changes required to reduce agricultural emissions:
1 - Diet change with their main pathway to net-zero assuming a 20% reduction in UK
consumption of red meat by 2030, rising to 35% by 2050
2 – Low-carbon farming practices, similar to those outlined above
3 – Productivity measures to improve crop yields and reduce stocking rates
It is important to note that the figures above are average estimates that were provided for
Scotland as a whole. On an individual farm basis, both the mitigation and the net costs
(below) can be very different and some measures above cover a wide range of possible
actions which would be demanding to assess individually. Therefore the GHG benefits
achieved and costs could vary widely.
Further details on each of these measures, such as costs, underpinning assumptions,
constraints and potential uptake can be found on pages 12-13 of the CXC report and in the
Annexes on pages 43-53. They have also been collated into Annex D for ease.
16 Evidence for the Farmer-Led Arable Climate
Change GroupAs set out within the CXC report, there is scope for all sectors in agriculture to mitigate their
operational GHG emissions through other practices and alternative land use such as those
to encourage carbon sequestration.
Costs
Some of these measures would involve the purchase of capital equipment with upfront costs.
The table below shows the net costs to farmers including capital costs on an average annual
basis. These do not include any wider costs such as those to Government or Research and
Development from developing measures. Negative figures below show a net saving to the
farmer, i.e. if implemented they would provide a financial saving to the farmer as well as a
reduction in emissions. Based on current levels the average potential net cost to the arable
sector is around £9m which is equivalent to 2% of the value of cereal output, where the
majority of emissions are associated.
Table 8. Sources of climate change mitigation in the crop/arable sector by 2050
Per unit
Area Maximum Aggregate
Mitigation measure annualised
2019 Uptake 2050 Cost (£m)
cost (£)
Grain legume rotations 5% 406.00 35
Improved crops 24% -10.17 -5
Intercropping 6% -45.18 -5
Nitrification and urease inhibitors 81% 20.67 31
1,863,000
pH management 33% -45.00 -27
ha
Slurry injection 17% 21.35 7
Slurry trailing hose 17% 8.16 3
Variable rate nitrogen & lime application 17% -93.57 -30
Additive Total .. 9
Source: Marginal abatement cost curve for Scottish agriculture (climatexchange.org.uk)
Current Uptake & Implementation Constraints
This section contains a brief summary of some of the key issues relating to each of the
measures outlined in Tables 7 & 8 above drawing heavily on the CXC report.
2.2.3.1 Grain legume rotations
Legumes source nitrogen directly from the atmosphere, meaning very little (or no) nitrogen
fertilisers are needed. They also provide some of this nitrogen to crops grown alongside and
after them, reducing the need for nitrogen fertilisers.
Frequency of rotation depends on different factors according to the legume. Some legumes
can only be grown once every few years to reduce risk of disease, and others may delay
yields. Different types of soils may also mean legumes are unsuitable for some areas.
In 2016, legumes for human consumption were grown on 1.7% of the arable crop area in
Scotland. It is assumed that this could increase to 5% of the arable area.
2.2.3.2 Improved crops
Nitrogen fertilisation is vital to achieve current yields for most crops, but a significant
proportion (nearly half) is lost to the environment, causing multiple environmental problems.
17 Evidence for the Farmer-Led Arable Climate
Change GroupUsing crops which are more efficient in utilising the nitrogen fertiliser reduces GHG
emissions and pollution, and reduce economic loss due to fertiliser lost to the environment.
Nitrogen-use efficiency varies between individual plants of the same species, and some can
be selected for further breeding. New cultivars such as perennial wheat or disease resistant
varieties can help to retain more carbon in the soil as well as reduce fertiliser, pesticide and
fuel use. Currently, main research streams are being carried out for nitrogen-fixing cereals
which could substantially reduce the need for nitrogen fertilisation in these plans.
There is assumed to be a seed price premium of around 10% for improved crops, but
beyond that there are no further costs and this measure is applicable to all crops. Currently,
uptake is assumed to be zero, but could be implemented widely on arable areas.
2.2.3.3 Intercropping
Growing a legume crop alongside a cereal crop reduces the need for fertiliser, as the legume
crop sources nitrogen directly from the atmosphere and provides some of this to plants
grown in the same area. In the UK, intercropping is typically pea or fava bean grown
alongside spring oats, spring barley, or spring wheat. Currently, intercrops are usually used
as feed for livestock.
Costs may be a constraining factor as pea seed is around 50% more expensive than barley
seed. While there are no reported figures on current uptake, there is growing interest in
intercropping, and it possible that in future grain will be separated and used for human
consumption, increasing incentive to adopt intercropping. Future uptake can be expected to
be high, as intercropping is applicable to 43% of winter and spring oat, and 100% of spring
non-malting barley.
2.2.3.4 Nitrification and urease inhibitors
Chemical inhibitors improve the availability of nitrogen fertilisers for plants and reduce both
GHG emissions and nitrate leaching. Urea in combination with inhibitors can further reduce
emissions. These can be injected into the soil, applied as a coating, mixed into slurry, or
spread after grazing.
There is little data available on current use of nitrification and urease inhibitors in Scotland,
and in the MACC model uptake was assumed to be 0%. However, costs are relatively low
for implementation.
2.2.3.5 pH management
Soil pH plays an important role in crop productivity and regulating and modifying emissions,
including improving fertiliser efficiency. Costs include the purchase of lime, spreading and
soil analysis, and provide a benefit from additional income due to increased yield.
Currently, 64% and 30% of farms carried out pH testing on arable and grazing land
respectively. A survey showed that of the sample, 57% of grassland soils and 34% of arable
soils had low or very low pH values. This suggests that uptake can be expected to be fairly
high, at around 50% on grasslands and 30% on croplands.
18 Evidence for the Farmer-Led Arable Climate
Change Group2.2.3.6 Slurry injection and trailing hose
Livestock slurry can be applied to soil using a range of techniques, with the most common in
Scotland currently being a low trajectory splash plate. Implementation of bandspreading and
injection techniques involve installing pipes and/or machinery to apply slurry directly to the
surface of the soil, and can reduce crop contamination and ammonia emissions.
There is a requirement for capital investment to implement this measure, which may be a
constraining factor for some farm businesses. However, this measure is already being used
in many farms across Scotland, with 28% of slurry bandspread and 3.5% injected in 2016.
The CXC report assumes that this measure can be applicable to around half of all organic
manure applications in Scotland and indicates at a UK level such applications comprise just
over 40% of the total. The main method in Scotland at present is with a low-level splash
plate, so there is room for significant increase in uptake.
2.2.3.7 Variable rate nitrogen & lime application
Where soil pH and other crop-growing conditions are highly variable, tailoring nitrogen and
lime application can save resources and enhance yield, as well as reducing GHG emissions.
Precision farming technologies can tailor the rate of inputs to soils within one square metre.
Current adoption is around 8% across the UK, likely lower in Scotland due to smaller arable
farms. There are capital costs associated with implementing and maintaining this measure.
Biodiversity
What do we know about biodiversity?
The Convention on Biological Diversity defines biodiversity as the variability among living
organisms from all sources including within and between species and of ecosystems. It is
vital to supporting humans by contributing to food production, manufacturing supplies,
recreation, soil quality, and climate stabilisation. In December 2020 the Scottish Government
published a Biodiversity Statement of Intent which includes proposals in relation to land use.
The Dasgupta Review of the Economics of Biodiversity commissioned by HM Treasury
highlights that we are demanding more goods and services than nature can sustainably
supply. This means global stocks of natural assets have been depleted. The review makes
clear that increased biodiversity helps mitigate risks to economic prosperity and climate
change. Acting immediately on biodiversity loss is significantly more cost effective than
delaying action. We can respond by reducing our use of natural resources, increasing the
efficiency with which we use them or increasing them through conservation and rebuilding.
2.3.1.1 What is the relationship between farming and biodiversity?
Agricultural intensification has negatively impacted biodiversity, particularly due to a trend
towards homogeneity leading to fragmentation and loss of habitats. Overall biodiversity
benefits from a mix of land use intensities as well as a mix of habitats14 as shown below.15
Land management practices can contribute to maintaining biodiversity, and have a negative
impact where practices are intensive.
14
James Hutton Institute. Briefing for RESAS.
15
https://www.eca.europa.eu/Lists/ECADocuments/SR20_13/SR_Biodiversity_on_farmland_EN.pdf
19 Evidence for the Farmer-Led Arable Climate
Change GroupThe UKG review states the relationship between farming and biodiversity is complex.
Biodiversity can benefit farmers by improving productivity including soil health, and farming
approaches can be tailored to benefit wildlife and biodiversity16. However, this is not always
true: for example, an area of farmland may have high biomass, but low biodiversity17.
A change of land use can result in various impacts on biodiversity: for example, conversion
from semi-natural grazing to forestry may be detrimental, as the diversity and richness of
wildlife associated with the former can be considerable, whereas conversion from improved
grassland (which can be poor for wildlife) to forestry is likely to make little difference18.
Farmland is particularly able to deliver services such as energy sources, food production and
recreation. However, the Natural Capital Asset Index shows that the natural capital19 asset
value of agricultural and cultivated land has been reducing over recent years. The Index is
made up of quality (38) x quantity indicators (ie area) and the recent agriculture decline
seems to be driven by a reduction in land designated arable land and market gardens20.
Biodiversity varies across regions, land uses and species. A commonly used indicator for
biodiversity is bird populations. Research by Nature.Scot shows that most wader species
have seen significant declines while seed-eaters show stable or increasing long-term trends.
Overall there has been an increase in the species that contribute to the farmland bird
indicator since 1994, however losses have been found for some species including
greenfinch, kestrel, lapwing, oystercatcher grey partridge and corn bunting.
16
The importance of biodiversity and wildlife on farmland | Business Wales (gov.wales)
17
Final Report - The Economics of Biodiversity: The Dasgupta Review - GOV.UK (www.gov.uk)
18
Does plantation forestry restore biodiversity or create green deserts? - Bremer, L., Farley, K.
19
“Natural capital is the part of nature which directly or indirectly underpins value to people including ecosystems, species,
freshwater, soils, minerals, the air and oceans, as well as natural processes and functions. … In combination with other types
of capital, natural capital forms part of our wealth; that is, our ability to produce actual or potential goods and services into the
future to support our wellbeing.” Natural Capital Terminology (publishing.service.gov.uk)
20
Scotland's Natural Capital Asset Index - 2019 Update summary.pdf (nature.scot)
20 Evidence for the Farmer-Led Arable Climate
Change GroupSummary of long and short term trends for bird species on farmland in Scotland.
Long-term changes in Scottish and UK farmland bird populations have been driven by many
factors including intensification, reduced crop type diversity within farms and reduced spring-
sown crops21. Pesticide use removes weed and insect food sources for birds, either directly
or through the food chain and has also contributed to decline.22 Agri-environment schemes
have been in Scotland for around two decades, helping reverse impacts with results varying
between species.
There are also concerns on declining populations of formerly widespread plants like
cornflower and corn marigold and insects like butterflies and bumblebees on arable land.
Pollinators play an essential role in plant reproduction and ecosystem functions, and there
are currently large worrying declines in their populations. The value of insect pollinators for
crops has been estimated at £400 million p.a. in the UK23. The European Court of Auditors
have found that EU measures did not ensure protection of wild pollinators, and key EU
policies, including the CAP, do not include specific requirement to protect wild pollinators.
2.3.1.2 What is the relationship between arable farming and biodiversity?
State of Nature in Scotland 2019 shows changes in farmland management in the past 50
years to have the greatest impact on nature include increased pesticides and fertilizer use,
continuous cropping, changed sowing seasons and non-cropped habitat loss. Changes in
food production patterns can cause invertebrate declines. Conversion to more intensive
agriculture and agrochemical pollutants are key drivers.
Arable farming can support wildlife and agri-environment schemes aim to encourage this.
Birds require winter food and shelter, sites for nesting and food supply through the
summer24. Approaches can be particularly successful when management interventions at a
field level target specific species e.g. corn buntings in Eastern Scotland25.
Some of the options that appear to be most successful in terms of uptake include:
Retention of winter stubbles for wildlife and water quality – which is supporting seed-
eating birds helping maintain a stable trend for these birds26
Stubbles followed by green manure – supporting birds and pollinators
Wader grazed and mown grassland options – supporting waders, and other wildlife.
21
https://www.nature.scot/official-statistics-terrestrial-breeding-birds-1994-2019
22
A review of evidence Is reported in Wilson, J.D., Evans, A.D. & Grice, P.V. (2009) Bird conservation and agriculture.
23
POST (2010) Insect Pollination, London
24
Managing Arable Farmland for Wildlife
25
Adaptive management and targeting of agri‐environment schemes does benefit biodiversity: a case study of the corn bunting
Emberiza calandra - Perkins - 2011 - Journal of Applied Ecology - Wiley Online Library
26
Hancock, M.H. & Wilson, J.D. (2003) ‘Winter habitat associations of seed-eating passerines’, Bird Study, Vol 50, 116-130
21 Evidence for the Farmer-Led Arable Climate
Change GroupArable fields can host thousands of species of insects and spiders. Some will be pests but
others are natural predators of these pests, pollinators or can assist in the breakdown of
organic matter. They are also a food source of some birds, bats, other mammals and
amphibians. The balance between all these arthropods species is out of kilter in lots of our
farmland, with knock on effects higher up the food chain, and for the farm business.
Hedgerows provide habitat for birds, butterflies, insects and small mammals, with 130
priority Biodiversity Action Plan species known to be associated with hedgerows27 28.
Field margins are strips of land, such as a hedge, between the field boundary and the crop.
There is a body of evidence identifying their multiple benefits29. They can provide semi-
natural habitat, areas for wild plants, for feeding, shelter and nesting for wildlife. Flower-rich
field margins can encourage pollinators for crops and predators of pests. Buffers also help
reduce the effects of runoff and soil erosion from farming operations. They can provide
corridors across the landscape, linking other areas of wildlife habitat. Field margins can be
left to naturally regenerate, as crop edges without herbicide or insecticide application, or
cultivated and managed as margins to deliver particular benefits. Mowing or cutting at the
end of the growing season can help maintain diversity of flowers30.
Water Margins are essential to prevent soil erosion and the transfer of pollutants to
watercourses. Direct run-off, leaching and spray drift can lead to pollutants, sediment,
pesticides entering water courses and negatively impact water quality. Vegetation at the
water margin can contribute to water quality and biodiversity31 32.
NatureScot has a project working with clusters of farmers and crofters to test outcome based
innovative approaches to supporting biodiversity for environmental outcomes. Two of the
pilots are in East Lothian (focused on hedgerow restoration) and in Strathspey (waders) 33.
Other good examples can be seen at:
Strategic Cereal Farm Scotland, a research project with Balbirnie Home Farm on
reducing synthetic inputs on-farm and improving soil guided by regenerative
principles - cover crops, min till and livestock integration. It uses soil and plant health
metrics to direct inputs via diverse rotations, including field veg, potatoes and cattle.
Farming and Nature – Whitmuir Estate case study
Sustainable Cropping Systems: Both JHI and SRUC have undertaken significant
research, e.g. JHI is running a project on the use of legumes with cereals34
The Burren (Ireland) was the first to test payments by results. This is an agri-
environmental programme that aims to conserve and support heritage, environment
and its communities. The Burren focusses on management of species rich grassland
and key indicator species/habitats.
Corn Bunting Recovery - collaborative efforts by local farmers and estates in Angus
and Fife using targeted greening and agri-environmental measures has helped the
recovery of a threatened species with record breaking increases and expansion of
27
See for example http://www.hedgelink.org.uk/wildlife-and-hedgerows.htm
28
R. Wolton (2009) UK Biodiversity Action Plan: Priority species linked to hedgerows, A report to Hedgelink
29
Multifunctional Role of Field Margins in Arable Farming (2014) Hackett M, Lawrence A – ADAS UK
30
Field margins – Wildlife and Farming
31
WAT-SG-44 (sepa.org.uk)
32
Cole L et al; (2015) Riparian buffer strips: their role in the conservation of insect pollinators in intensive grassland systems
33
For more information see https://www.nature.scot/piloting-outcomes-based-approach-scotland-pobas-project
34
Agroecology | Ecological Sciences | Research | The James Hutton Institute
22 Evidence for the Farmer-Led Arable Climate
Change Groupthe range. Management practices have included delayed mowing and fallows to
protect nests and use of a corn bunting mix (including clover, legumes and cereal). 35
SEAMs (Sustainability in Education and Agriculture using Mixtures) project is
developing a network of field sites across the main arable food production areas of
Scotland. These sites are trialling crop mixtures, providing information on how to
tailor the use of crop mixtures to different locations in Scotland. They provide a
platform for knowledge exchange and learning. The sites are working farms spread
across Scotland and the project is taking a participatory approach. More info here
Durie Farm – Leven, Fife; an example of a farm’s agroecological transition36.
35
https://www.rspb.org.uk/about-the-rspb/about-us/media-centre/press-releases/prophesies-proven-correct-after-great-year-for-
one-of-scotlands-fastest-declining-birds/
36
Agroecological Transitions - Durie Farms.pdf (nature.scot)
23 Evidence for the Farmer-Led Arable Climate
Change GroupYou can also read