Moving Regeneration Forward in Waimakariri - A Casebook of ...
←
→
Page content transcription
If your browser does not render page correctly, please read the page content below
Moving Regeneration Forward in Waimakariri

   A Casebook of Adaptive Reuse prepared for the Waimakariri District Council
   Waimakariri District Council provided to the Minister Supporting Greater Christchurch Regeneration a
   Draft Waimakariri Residential Red Zone Recovery Plan (Te Mahere Whakarauora mō te Whenua Rāhui o
   Waimakariri) on 1 August 2016. It proposes land uses for the Kaiapoi, Pines Beach and Kairaki
   regeneration areas that aim to provide attractive, enjoyable and vibrant places for community use. This
   casebook provides examples of other adaptive reuse and regeneration projects with an emphasis on
   governance, ownership and tenancy, funding, maintenance and service provision.

                                                                                        August 2016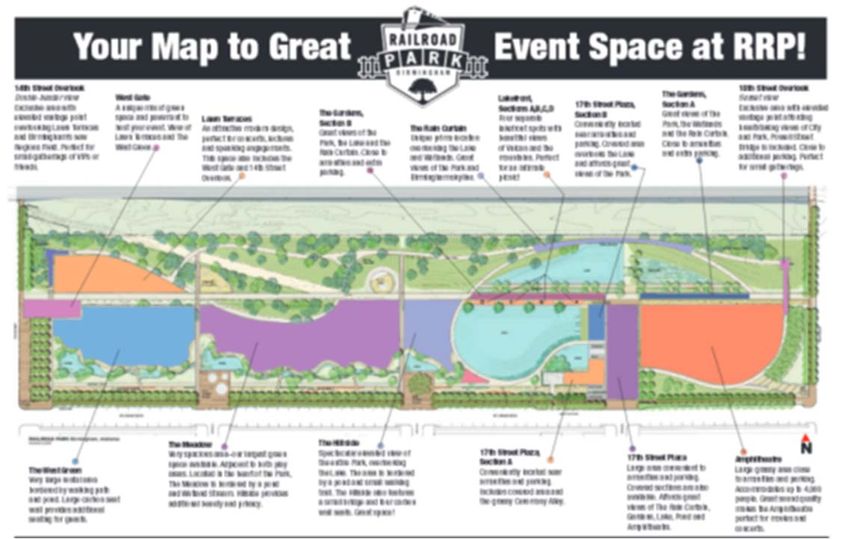
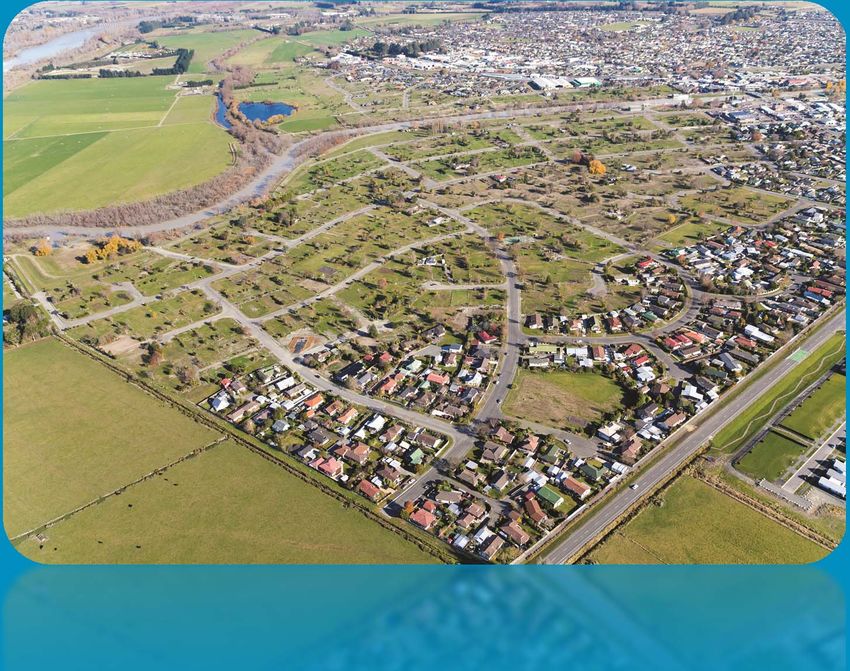
Front cover photo credit:
Aerial view of Kaiapoi by Peter Bell 2015
Courtesy of Simon Markham, Waimakariri District Council

Report prepared by:
Laurie A. Johnson PhD AICP
Principal, Laurie Johnson Consulting | Research
San Rafael, California USA
P: +1 415 491 4523
E: laurie@lauriejohnsonconsulting.com
Adaptive Reuse Casebook | August 2016
Executive Summary
This casebook has been developed as a tool for the Waimakariri District Council and its strategic
partners, including the Crown, Ngāi Tahu, and Environmental Canterbury, to use in considering how
to fund and implement plans for the Kaiapoi, Pines Beach and Kairaki regeneration areas. It provides
a range of examples of regeneration and adaptive reuse in areas of hazard‐prone or under‐utilised
lands.
A framework for potential case types was developed in consultation with the Waimakariri District
Council staff with preference given to: areas in coastal and riverine environments and comparable in
size and proposed land uses for the Waimakariri regeneration areas; projects that involve
public/private partnerships and provide community‐wide benefits; and governance and funding
practices comparable to the local/national context within New Zealand including the important
partnership that the Māori/Ngāi Tahu have with the Crown reflected in the Treaty of Waitangi and
subsequent settlements.
Projects in New Zealand, Australia, China, Japan, the United Kingdom, Canada, the United States,
and Chile were investigated for the study. Availability and access to information on a project also
factored into the case selection. Also, no potential cases involving first nations and/or indigenous
people within a project area or as part of the governance structure for a project were found. As a
further constraint, many of the potential cases that began with a post‐disaster land buyout program,
like the New Zealand residential Crown offer process, did not result in active reuse of the site and
thus were not considered further. A final selection of six cases, all of which are located in the United
States, was made based upon their ability to represent a diversity of governance and funding
arrangements. They are:
Case 1: Greenway, Grand Forks, North Dakota and East Grand Forks, Minnesota – A Multi‐
Government Partnership to revitalise a riverfront area damaged by flooding
Case 2: Brooklyn Bridge Park, New York, New York – A Local Government Non‐Profit
Corporation that oversaw reuse of a former riverfront industrial site
Case 3: Beltline, Atlanta, Georgia – A Local Government Non‐Profit Corporation to convert
abandoned rail lines into a multi‐use pathway network around the city
Case 4: Railroad Park, Birmingham, Alabama – A Local Government and Non‐Profit
Partnership to revitalise an abandoned railroad yard and surrounding neighborhoods
Case 5: Buffalo Bayou, Houston, Texas – A Non‐Profit led effort to improve public access and
use of land adjoining a waterway
Case 6: The Presidio, San Francisco, California – A National Government Non‐Profit
Corporation to revitalise a former military base and historic structures into a mix of open
space, recreational, housing, educational, and commercial uses.
Information on the project context, planning, management, funding, operations and key resources
has been developed for each of these six cases. The study report also contains an appendix with
brief summaries of eight other cases considered in the study.
Insights drawn from the case study analysis are as follows:
Regeneration planning needs to consider pre‐existing and future conditions of more than
just the project site. All the project sites endured some type of on‐going stress or shock—
Page | i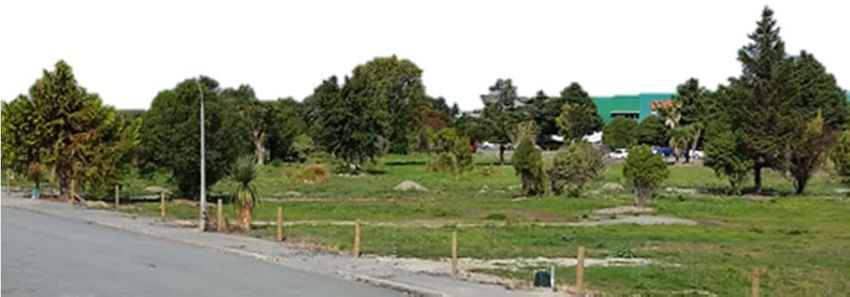
August 2016 | Adaptive Reuse Casebook
either economic or physical—and there have been ripple effects from these shocks and
under‐utilisation of the project sites onto adjoining properties, neighborhoods and
communities. Each of the six regeneration cases has been a catalyst and stimulus for
revitalisation of the surrounding areas as well as the project site. There are also
consequential issues of social equity and displacement resulting from the increased property
values and economic revitalisation following the regeneration of the project sites.
Regeneration project planning and implementation takes many years to complete. Initial
project planning was only a small portion (a few years) of the overall project timelines. It
took several years, even decades, to complete the planning and design, fundraising, and
construction of each of the projects. Time to completion roughly correlates with the
complexity of land uses and the physical size of a particular project.
Regeneration projects benefit from special, collaborative and sustaining governance
arrangements among government agencies as well as citizen and stakeholder groups.
Multiple agencies and groups were involved in special governance schemes established
specifically for the projects. Governance arrangements evolved and changed over time as
the projects progressed through the planning, construction and operational phases.
Separate not‐for‐profit government corporations—governed by independent boards of
directors—are a common governance scheme. These corporations have been funded
through a variety of sources that include government funds, individual and private
corporation donations, and philanthropic grants. There also have been formalised and
important roles for interested citizen and stakeholder groups. Most commonly, these roles
have been formalised as non‐government, not‐for‐profit membership organisations. They
were natural out‐growths of neighborhood and community special interest groups that
initially advocated for the projects. The roles and functions of these citizen and stakeholder
organisations can also help to build social capital and community resilience.
Land ownership and the sources and availability of funding are two key determinants in
the governance schemes adopted for regeneration projects. Governance schemes seem to
reflect the ultimate land ownership of the regeneration areas and not necessarily the land
ownership patterns at the start of the projects. Many governing organisations were
intentionally created at “arms‐length” from government, allowing them to seek and manage
public funds as well as private and non‐profit sector grants and other charitable donations,
and to partner directly with private corporations and philanthropic organisations in
economic development efforts.
By their very nature, regeneration projects require unusual and innovative funding
schemes. Regeneration projects often involve hazard‐prone or under‐utilised land as well as
other risks that are difficult for conventional real estate development and financing
structures to handle. All the case studies involved a significant level of private sector and
philanthropic funding that mostly came in the form of grants and donations. Innovative
funding approaches included tax increment financing; residential and commercial
development on a portion of the site to finance construction of the public‐serving portion of
the site; leasing of rehabilitated structures on the site; and a nominal monthly fee to all city
residents and businesses.
Based upon the insights gained through this casebook analysis, the following points are offered for
consideration by the Waimakariri District Council and its strategic partners as the initial planning
phase for the Kaiapoi, Pines Beach and Kairaki regeneration areas is completed and the next phase
of implementation begins:
ii | Page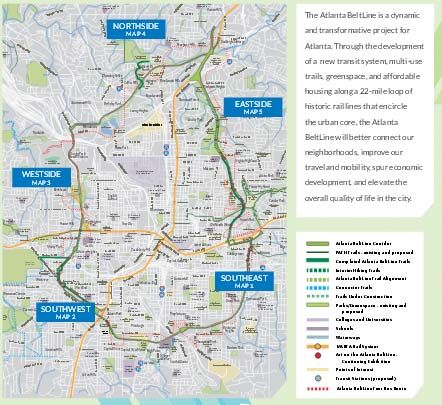
Adaptive Reuse Casebook | August 2016
Have the opportunities and benefits of economic revitalization to properties and
neighborhoods adjoining the regeneration areas been fully explored? Are there potential
partnerships or other ways to leverage and acknowledge those benefits in the governance
arrangements as well as the funding schemes for both the implementation and long‐term
maintenance and operations of the regeneration projects?
Similarly, are there potential social equity and displacement issues that may result from the
increased benefits resulting from the regeneration areas and how might those issues be
monitored and addressed in the implementation phase of the regeneration projects?
Are the current timelines and expectations for implementation appropriate for the scale and
complexity of each of the regeneration projects?
What are some of the potential risks to current timelines and expectations and how might
those be monitored and addressed in the implementation phase for each of the
regeneration projects?
What is the appropriate governance arrangement within the Council to maintain the
sustained focus necessary throughout the implementation phase for each of the
regeneration projects? What departmental collaborations and skills are necessary and how
might they be best accessed and leveraged in governance arrangements for the
implementation phase?
What other agencies and organisations have overlapping and alignable projects and
interests in and around each of the regeneration areas? How might those interests be
leveraged into the governance arrangements for the implementation phase? What are some
of the potential risks and challenges for each and how might those be monitored and
addressed?
Are there neighborhood and special interest groups with alignable interests that might be
engaged and even cultivated to have more formalised roles and functions in the
implementation and operational phases for each of the regeneration areas? What are some
of the key roles and functions that these groups could undertake? What additional skills and
resources might they need and how might the Council support them in their efforts?
Do other agencies, organisations, stakeholder groups with an interest in and around the
regeneration areas have access to resources that could be better leveraged if combined to
achieve a greater good than if managed separately? And finally,
Have all the potential financing options been explored for each of the regeneration areas?
Are there some innovative financing approaches and governmental and non‐governmental
resources that might be accessed, especially considering the economic development and
revitalisation opportunities that will result from each of the projects?
Page | iii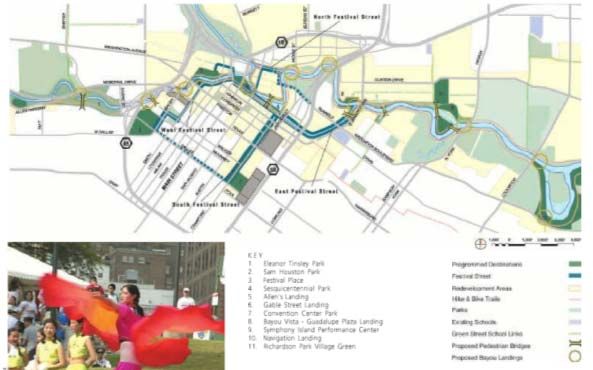
August 2016 | Adaptive Reuse Casebook

iv | Page
Adaptive Reuse Casebook | July 2016

Table of Contents
Executive Summary .................................................................................................................................. i
Introduction ............................................................................................................................................ 1
The Cases ................................................................................................................................................ 1
Case 1: Greenway, Grand Forks, North Dakota and East Grand Forks, Minnesota – A Multi‐
Government Partnership Model ............................................................................................................. 3
Case 2: Brooklyn Bridge Park, New York, New York– A Local Government Non‐Profit Corporation
Model ...................................................................................................................................................... 8
Case 3: Beltline, Atlanta, Georgia – A Local Government Non‐Profit Corporation Model ................... 12
Case 4: Railroad Park, Birmingham, Alabama – A Local Government and Non‐profit Partnership
Model .................................................................................................................................................... 16
Case 5: Buffalo Bayou, Houston, Texas – A Non‐Profit Model ............................................................. 20
Case 6: The Presidio, San Francisco, California – A National Government Non‐profit Corporation
Model .................................................................................................................................................... 24
Insights and Key Points for Consideration ............................................................................................ 29
Appendix A: Brief Summaries of Other Potential Cases ..................................................................... A‐1

                                                                                                                                                       Page | v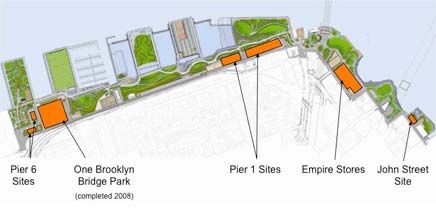
August 2016 | Adaptive Reuse Casebook

vi | Page
Adaptive Reuse Casebook | August 2016
Kaiapoi red zone area (L. Johnson September 2015)
Introduction
The Draft Waimakariri Residential Red Zone Recovery Plan (Te Mahere Whakarauora mō te
Whenua Rāhui o Waimakariri) provided to the Minister Supporting Greater Christchurch
Regeneration proposes land uses for the 99.4 hectares of land that comprises the Kaiapoi, Pines
Beach and Kairaki regeneration areas. The plans call for an array of uses including sports fields,
neighborhood parks, new business areas, recreation and ecological linkages, a cemetery, a BMX
track, a dog park, vehicle and motor caravan parking, provision for heritage and mahinga kai
activities, roads and infrastructure sites and rural activities. The regeneration proposed for each area
aims to provide attractive, enjoyable and vibrant places for community use that work to balance
goals to improve appearance, benefit the whole community, and account for the significant costs of
land purchase.
The Cases
This casebook has been developed as a tool for the Waimakariri District Council and its strategic
partners, including the Crown, Ngai Tahu, and Environmental Canterbury, to use in considering how
to fund and implement plans for the Kaiapoi, Pines Beach and Kairaki regeneration areas. It provides
a range of examples of regeneration and adaptive reuse in areas of hazard‐prone or under‐utilised
lands.
Adaptive reuse is a development approach that has largely been applied to attract investment to
struggling downtowns, abandoned industrial sites, infill locations, and under‐utilised commercial
centers and business parks. Adaptive reuse of hazard‐prone lands is less common but there are
many examples, most emerging in the aftermath of major flood, hurricane, and earthquake
disasters.
A framework for potential case types was developed in consultation with Waimakariri District
Council staff. Case preferences include:
Areas in coastal and riverine environments
Areas comparable in size to the Waimakariri regeneration areas
Land reuses similar to the proposed uses for the Waimakariri regeneration areas, including
parks and open space, recreation and ecological uses, and low‐intensity development
Projects that provide community‐wide benefits
Page | 1August 2016 | Adaptive Reuse Casebook
Governance and funding practices within industrialised economies comparable to New
Zealand and with a national/local governance context similar to the Waimakariri
regeneration areas, including the important partnership that the Māori/Ngāi Tahu have with
the Crown reflected in the Treaty of Waitangi and subsequent settlements
Projects that involve public/private partnerships
Availability and access to information on project governance, ownership and tenancy,
funding, maintenance and service provisions.
An initial set of potential cases were identified by looking at both kinds of adaptive reuse—of
brownfields and hazard‐prone lands—and the potential case preferences. This initial set included
potential cases in New Zealand, Australia, China, Japan, the United Kingdom, Canada, the United
States, and Chile. It was particularly challenging to find ample documentation on many of the cases
due to lack of formal study or formal project management. Also, no potential cases involving first
nations and/or indigenous people within a project area or as part of the governance structure for a
project were found. As a further constraint, many of the potential cases that began with a post‐
disaster land buyout program, like the New Zealand residential Crown offer process, did not result in
active reuse of the site; instead, many sites went fallow or were returned to a natural state and thus
not comparable to the active reuse proposed for the Waimakariri regeneration areas.
Six cases were selected from the list of potential cases based upon their ability to represent a range
of governance and funding arrangements. They are:
Case 1: Greenway, Grand Forks, North Dakota and East Grand Forks, Minnesota – A Multi‐
Government Partnership to revitalise a riverfront area damaged by flooding
Case 2: Brooklyn Bridge Park, New York, New York – A Local Government Non‐Profit
Corporation that oversaw reuse of a former riverfront industrial site
Case 3: Beltline, Atlanta, Georgia – A Local Government Non‐Profit Corporation to convert
abandoned rail lines into a multi‐use pathway network around the city
Case 4: Railroad Park, Birmingham, Alabama – A Local Government and Non‐Profit
Partnership to revitalise an abandoned railroad yard and surrounding neighborhoods
Case 5: Buffalo Bayou, Houston, Texas – A Non‐Profit to improve public access and use of
land adjoining a waterway
Case 6: The Presidio, San Francisco, California – A National Government Non‐Profit
Corporation to revitalise a former military base and historic structures into a mix of
recreational, housing, educational, and commercial uses.
Information on the project context, planning, management, funding, operations and key resources is
has been developed for each of the cases. This is followed by a set of insights and points for
consideration gleaned from the case analysis. Appendix A contains brief summaries of eight other
cases considered in the study.
2 | PageAdaptive Reuse Casebook | August 2016
Case 1: Greenway, Grand Forks, North Dakota and East Grand
Forks, Minnesota – A Multi-Government Partnership Model
Project Size: 890 ha in total—325 ha in
Grand Forks and 565 ha in East Grand
Forks.
General Land Uses: Open space, park
and recreation facilities, and river flood
protection. Park and recreation facilities
include: several parks, campground,
fishing sites and boat ramps, 2 golf
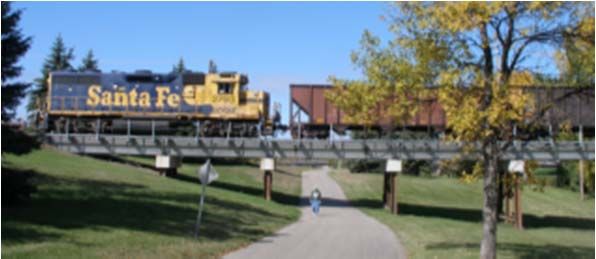
courses and 3 disc golf courses, Railroad bridge over the greenway multi‐purpose trail, City
of Grand Forks (L. Johnson Sept 2010)
clubhouse, and over 32 km of multi‐
purpose trails that link both
communities together.
Timeframe: Planning, land acquisition,
and construction of the flood protection,
greenway, park and recreation facilities,
1997 – 2008.
Benefits: Provides year‐round outdoor
recreation, ecological value, and a
source of economic development, Greenway along the Red River of the North which is at flood
including downtown revitalisation in stage, City of Grand Forks (L. Johnson May 2009)
both cities.
Context
In 1977, unprecedented flooding on the Red River of the North forced the evacuation of more than
56,000 people from two cities that straddle the river—City of Grand Forks, North Dakota (52,500
residents in 1995) and East Grand Forks, Minnesota (9,000 residents in 1995). Total damage and
recovery estimates are as high as US$2 billion (1995 US Dollars). A U.S. federal disaster declaration
opened the door for federal funding for the voluntary purchase of heavily damaged homes.
Concurrently, the U.S. Army Corps of Engineers began designing an enhanced flood control project
for this section of the river and federal funding for the project was approved in 1998. The states of
North Dakota and Minnesota also pledged funds for the project and the cities were required to
contribute a project match. Together, government provided the majority of funds that were used to
purchase the private and public lands that would become the greenway system. Ownership of the
land acquired through the voluntary buyout programs and the flood protection project was
transferred to the cities of Grand Forks, East Grand Forks, and the State of Minnesota. Government
ownership of the land was necessary to implement the construction of the flood protection project
and ensure access during high water events.
Planning
Planning to improve the cities’ flood protection by setting back and widening the river floodway had
begun before the 1997 flood. Concepts for a park system within the river floodway also appeared in
the cities’ land use plans produced before 1997. After the 1997 flood, the cities’ U.S. Congressional
delegation promoted the greenway concept as they worked to secure federal funding.
Page | 3August 2016 | Adaptive Reuse Casebook
More detailed planning for the flood protection system began in 1998 and included landscape
architects to design the trails and other amenities. Concurrently, the cities conducted an extensive
set of studies pertaining to the greenway, including a recreation needs assessment and tree
inventory report and management plan. Community residents participated in workshops as part of
the planning process and crafted the following vision: “The Red and Red Lake Rivers Greenway will
protect residents of Grand Forks and East Grand Forks from flooding, provide opportunities for
economic growth, improve and restore ecological stability of the river corridor, link residents and
tourists to four seasons of recreation and transportation facilities, provide linkage between the cities,
preserve and promote the history and culture of the region through education, and improve the
quality of life for future generations.”
The Greenway Plan, released in 2001, states the vision and goals for the project, the proposed
greenway facilities and facility design guidelines, operational structure and considerations,
estimated costs and funding options, and an implementation action plan. Specifically, the plan calls
for the establishment of a governing structure ahead of the project design and construction and the
formation of partnerships to assist in the construction, use, and operation of a Greenway with a
variety of compatible uses. Both the cities of Grand Forks and East Grand Forks subsequently
adopted portions of the Greenway Plan and incorporated elements of the plan into their local
comprehensive (land use) plans.
Several projects in the original Greenway Plan were eliminated during project construction due to
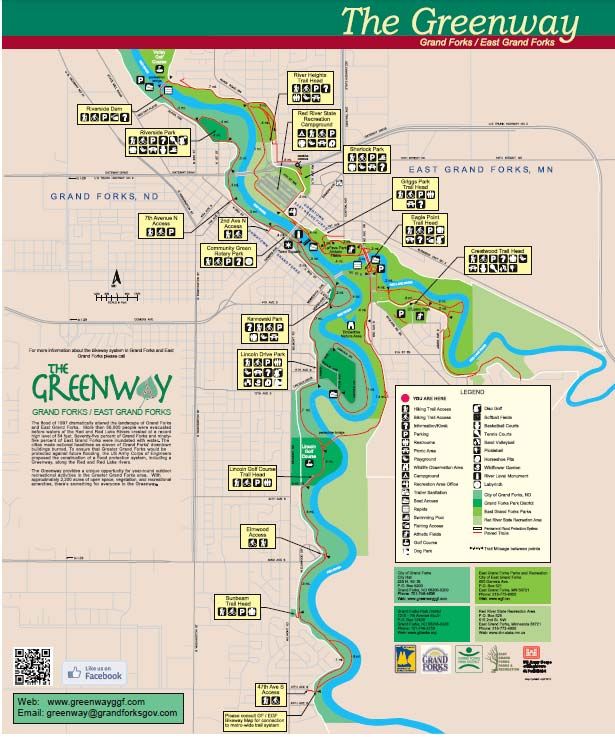
lack of funding, community resistance, and inconsistencies with local land use plans. A map of the
Greenway and its many recreation features is provided in Map 1.
Management Structure
The development and construction of the flood protection system and Greenway required multi‐
agency cooperation. In 1998, the Greenway Alliance was formed to work through the issues
associated with construction and governance of the Greenway. This group oversaw the creation of
the Greenway Plan and accompanying facility design guidelines, and the establishment of the
Greenway governance structure. Alliance membership included representatives from both cities as
well as federal, state, and local agencies with expertise in a variety of recreation management fields.
The Greenway Alliance dissolved in 2001 after the Greenway Plan was completed.
The Greenway Technical Committee was then formed as a technical advisory board to the four
agencies that manage the Greenway:
City of Grand Forks owns all 325 hectares of land within the Greenway on the North Dakota side
of the river.
Grand Forks Park District leases and manages four areas in the Greenway through a lease
agreement with the City of Grand Forks. These areas are the Lincoln Park Golf Course and the
Riverside, Lincoln Drive and Kannowski Parks.
City of East Grand Forks owns the majority of the 565 hectares of land within the Greenway on
the Minnesota side of the river.
Minnesota Department of Natural Resources owns and manages the Red River State Recreation
Areas Campgrounds and the River Heights Trailhead area.
4 | PageAdaptive Reuse Casebook | August 2016
Map 1. Grand Forks/East Grand Forks Greenway and recreational features
Source: The Greenway 2012 Supplement, Grand Forks, North Dakota and East Grand Forks, Minnesota,
http://www.greenwayggf.com/greenway‐plans.html
Page | 5August 2016 | Adaptive Reuse Casebook Committee membership includes representatives of the four managing agencies and other parties interested in the development of the Greenway. Meetings are held bimonthly and are open to the public. Staff from the four managing agencies meets on the alternate months. The Greenway Technical Committee has no governing authority but serves as the primary mechanism for the four managing agencies to discuss issues. In 2003, the Greenway Technical Committee began work on a set of consistent regulations for the governance of the entire Greenway system. These were based on a series of state laws and were adopted by the cities of Grand Forks and East Grands in 2005 and 2006. A Greenway and Trail Users Advisory Group has also been formed and is open to local citizens who share an interest in the development and use of the Greenway and trails in the Greater Grand Forks community. Meetings are held the once a month. Citizens can submit an idea for an addition or improvement to the Greenway through either the Greenway Technical Committee or the Greenway and Trail Users Advisory Group. A completed request form is reviewed by the staff of the Greenway Technical Committee to determine its feasibility. If the request is approved for further evaluation, a member of the committee will guide the request through the proper channels of their organisation. Several features have been added to the Greenway as a result of citizen input and requests. Funding The total cost for the flood protection project has been estimated at US$409 million of which about half came from the U.S. federal government. The states of North Dakota and Minnesota and the cities of Grand Forks and East Grand Forks contributed the remaining funds. The cost for the recreational features has been estimated at US$22 million and was funded on a 50/50 cost share between the federal government and the two cities. This included the trail system, restrooms, playground equipment, signage, and two pedestrian bridges. State agencies helped to fund the Community Green, two boat ramps, tree planting, trail signage, new trails and trail realignments. During the planning for the flood protection project, the Grand Forks community decided that it wanted to incorporate extra features, not included in the original plan, including the Greenway Plan, construction of the Community Green, warming houses, and other recreational features. The City of Grand Forks established a Betterment Fund to provide 100 percent of the financial support for these additions. Money for the Betterment Fund was raised through a special assessment process paid by all property owners in Grand Forks. These special assessments were also used to pay a significant portion of the local share of the flood protection and Greenway project construction costs, including operating and maintenance expenses up to 2005. The Friends of the Greenway Fund was established with the local Community Foundation of Grand Forks, East Grand Forks and the region and is used to construct projects within the Greenway. The local energy company and University of North Dakota have funded vegetation planting. A local dog park advocacy group raised the funds for a dog park within the Greenway. Other private donors funded a community pool, children’s play areas, and other amenities. In December 2005, the Grand Forks City Council passed an ordinance to assess a monthly fee of US$1.15 per unit to residential and commercial properties to finance the operations and maintenance and small capital improvements of the flood protection system and Greenway. 6 | Page
Adaptive Reuse Casebook | August 2016

Greenway expenses include items like administration, mowing, trail maintenance, repairs and
replacement of recreational features, and minor debris cleanup. This nominal fee is included on the
monthly utility bill for residents and businesses. Fees for residential customers are based on the
number of residential units. Fees for nonresidential properties are based on the taxable area of the
property and storm‐water drainage factors.
In 2009, the City of East Grand Forks also began charging a monthly Greenway fee for every utility
account within the city. This fee is dedicated to the Greenway Capital Fund for capital expenditures
on trails and trailheads.
Most facilities in the Greenway are available at no cost, but fees are required for special events and
to reserve picnic shelters and community rooms. These facilities are managed and fees collected by
the Grand Forks Park District and East Grand Forks Park and Recreation Department.

Operations: Programs and Maintenance
Discussion about the ongoing maintenance of the Greenway began early in the construction process
and addressed both the flood protection and recreation components of the system.
In Grand Forks, the storm water division of the Public Works Department is responsible for
maintaining the integrity of the flood protection system (e.g. floodwalls, earthen levees, pump
stations, and a diversion channel). The streets division maintains the recreational features of the
Greenway not already covered through agreements with other agencies or maintenance contracts.
The Grand Forks Park District provides maintenance services for areas under its management.
The City of Grand Forks has one full time staff person within the Public Works Department who
oversees the daily operations, maintenance, contracting for outside services, promotion, and public
relations of the Grand Forks portion of the Greenway. The Grand Forks Greenway Specialist position
was funded as a part of the construction project and then became a permanent position supported
by the monthly assessment fees as well as city funding for maintenance of the flood control system.
Maintenance for the East Grand Forks portion of the Greenway is the responsibility of the city’s
Public Works Department, in partnership with the Minnesota Department of Natural Resources.
Staff is hired seasonally to manage the Red River State Recreation Area, including the campground
reservations, point of sale, rules and regulations, reporting, guidelines, and procedures.
The Greenway Adopt‐a‐Trail program is an all‐volunteer program that allows persons or
organisations interested in adopting a section of trail to submit an application to the managing
agency for consideration. The Adopt‐a‐Trail program requires a minimum commitment of three
years. Both cities also rely on a variety of outside agencies for assistance with forestry, recreation
management, special events, and riparian restoration.

Key Resources
This case study was largely developed from information available at The Greenways website,
http://www.greenwayggf.com/, notably the “The Greenway 2012 Supplement, Grand Forks, North
Dakota and East Grand Forks, Minnesota” and “The Greenway Plan, 2001, Grand Forks, North
Dakota and East Grand Forks, Minnesota”. Information on the 1997 flood and early programs also
came from the City of Grand Forks, 1997, Flood Recovery Action Plan and the author’s work and
research following the 1997 flood.

                                                                                                     Page | 7
August 2016 | Adaptive Reuse Casebook Case 2: Brooklyn Bridge Park, New York, New York– A Local Government Non-Profit Corporation Model Project Size: 34‐ha ribbon park running along 2 km of the East River Shoreline in the borough of Brooklyn, New York City. General Land Uses: Open space, park and recreation facilities that include: lawns, gardens, playgrounds, sports facilities, walking and cycling paths, and waterfront access. Sites for residential and commercial development are Park construction and landscaping underway at the Brooklyn Bridge Park also included. (L. Johnson July 2011) Timeframe: Park decision reached in 2002 and planning initiated in 2004. Construction began in 2010 and largely completed by 2015. Residential and commercial development on the site is still ongoing. Benefits: Provides year‐round outdoor recreation and civic activities. Also provides opportunities for economic development and generation of funds to sustain park maintenance and operations. Context Brooklyn Bridge Park is a 34 hectares park extending along 2 km of the East River shoreline, from just north of the Manhattan Bridge in the borough of Brooklyn in New York City. Much of the site once housed industrial warehouses that sat atop piers extending out into the river and originally built by the Port Authority of New York and New Jersey1 in the 1950s. By the early 2000s, constant tidal action had degraded the timber piles under the piers and the warehouses were largely abandoned. The land was still owned by the Port Authority and much of the site was closed to public access. An agreement to create park on the site was reached in 2002 amidst community concerns that the land should remain in public use and not be sold for private development. Management Structure A 2002 Memorandum of Understanding between the Port Authority, the State of New York and New York City established the terms of land ownership, funding, and planning for the park. It included a directive for 20 percent of the Port Authority land to be dedicated to development and revenue generation in order to pay for the ongoing capital necessary to maintain and operate the park. That figure was later reduced to 10 percent since real estate land values are so high in New York City and this was all that was necessary to meet the ongoing maintenance and operations needs of the park. A new subsidiary of the Empire State Development Corporation (ESDC), called the Brooklyn Bridge Park Development Corporation (BBPDC), was also established in 2002 to lead the initial planning and 1 The Port Authority of New York and New Jersey was created in 1921 by a compact between the states of New York and New Jersey and approved by the U.S. Congress. It is under the joint control of the state governors of New York and New Jersey who each appoint 6‐members to the Board of Commissioners for 6‐year terms. 8 | Page
Adaptive Reuse Casebook | August 2016

construction for the park. The ESDC is a 1995 amalgamation of New York State’s Urban Development
Corporation, the Department of Economic Development and several other state economic
development entities. It has a broad range of statutory powers, including the authority to issue tax‐
exempt and non‐tax exempt bonds, provide flexibility in the application of local codes and arrange
full or partial exemption from real estate taxes. It can also exercise powers of condemnation, act as
an agent in obtaining federal subsidies and grants for projects and invest in real estate at below‐
market interest rates. The EDSC has established many subsidiaries like the BBPDC throughout New
York City and the state including the Lower Manhattan Development Corporation which has led
rebuilding of the former site of the World Trade Center following the September 2001 disaster.
In 2010, the BBPDC transferred its financial and operational responsibility to the newly‐formed
Brooklyn Bridge Park Corporation. The Park Corporation is a non‐profit entity formed and controlled
by the City of New York. It is governed by a 17‐member Board of Directors appointed by the Mayor
of New York City and chosen by the Mayor of New York City, the Governor of New York State and
local elected officials. Its mission is to create a sustainable waterfront park that is a recreational,
environmental and cultural destination enjoyed by the residents of, and visitors to, New York City.
The Corporation is required to be financially self‐sustaining, which includes the commercial
development of certain sites within the project’s footprint. The Brooklyn Bridge Park Corporation
formally leases the park land held by the BBPDC, manages the development and revenue generation
efforts and has responsibility for ongoing maintenance and park programming.
The neighborhood activist group that led the campaign to create the park became the Brooklyn
Bridge Park Conservancy which initially served mainly as an advocacy organisation for the park. The
Conservancy eventually formalised into a non‐profit agency and works collaboratively with the
Brooklyn Bridge Park Corporation in handling the park’s year‐round events programming. The
Conservancy’s volunteers log over 6,800 hours per year helping to support programs, visitor services
and park maintenance.

Planning
In 2004, BBPDC initiated planning for the park’s development, directing a design consultant to
preserve the dramatic experience and monumental character of the industrial waterfront while
reintroducing self‐sustaining ecosystems to the site and investing it with new social and recreational
possibilities. This resulted in a General Project Plan approved in 2005.
The proposed park design removed the former industrial structures and replaced them with a varied
geography bisected by meandering walking paths, promenades and bicycle trails. The park’s
elevation, soil types, vegetation, edge design, and materials were also carefully selected to help
reduce flood and storm risk. Dramatic increases of up to 10 meters in topography were proposed in
order to help transform the site and enhance its views and appeal. Changes in grade are in direct
relationship to the existing structural capacity of the site with less intense uses located on the piers
and more intense uses and development located on parcels of land. Fill was imported from another
city‐owned excavation site. Multiple berms were also proposed to act as a barrier to both current
and future flooding. A variety of salvaged materials and repurposed existing marine infrastructure
were also incorporated into the park design, simplifying engineering solutions and reducing
construction and maintenance costs.

                                                                                                   Page | 9
August 2016 | Adaptive Reuse Casebook The park plan also includes a handful of residential and commercial development sites along the park’s urban edge that will generate funds and fulfill the park’s mandate of being financially self‐ sufficient; see Map 2. The development program was determined after an in‐depth analysis of potential locations. The analysis focused on finding uses that would generate sufficient revenue to support park operations, minimize the size of the required development footprint, and be compatible with the surrounding park and neighborhood uses. Development locations were chosen to take advantage of the existing urban context by concentrating development closest to three park entrances and protecting view corridors. Map 2. Revenue-generating Development Sites within the Brooklyn Bridge Park Project Footprint Source: Brooklyn Bridge Park Corporation, http://www.brooklynbridgepark.org/pages/project‐development The development projects include a number of new residential developments as well as a hotel. Given the location, condominiums cost millions of dollars to buy. More recently, New York’s latest Mayor de Blasio has instituted mandates for affordable housing options as part of the newer residential developments. Funding The total construction costs for the park are estimated at US$350 million, which results in an average cost of US$94 per square foot (about US$1,000 per square meter). It is reported that both the State of New York and New York City provided seed funding of about US$85 million and US$65 million, respectively. Only a small fraction of the required operations and maintenance funds for the park are collected from permits and concessions. The majority of these funds come from the revenue‐generating development sites within the project’s footprint. The development projects have helped to fund about US$250 million in infrastructure improvements and they also provide over US$4 million in revenues for the ongoing maintenance of the park. 10 | Page
Adaptive Reuse Casebook | August 2016

Operations: Maintenance and Programs
The multi‐phased development of the park began in 2008. A portion of the park first opened in
March 2010 and included playgrounds, lawns, a waterfront esplanade, and walking paths as well as
dramatic changes in topography. Since then additional parts of the park have been constructed to
include additional playgrounds, lawns, and promenades, as well as sports facilities, a waterfront
greenway for pedestrians and cyclists, flower gardens, and numerous waterfront access features.
The Brooklyn Bridge Park Corporation maintenance and operations program includes horticulture,
custodial staff, security, administration and events programming. The Park Corporation is also
working to restore the pier structures through pile encapsulation. By encapsulating the timber piles
with concrete, they are protected from tidal shifts preventing fungus from further deteriorating the
piles.
There are more than 400 free events offered at the park. They include arts and culture (i.e. movies
and concerts), recreation (i.e. boating, fitness classes, volleyball workshops, and chess lessons),
education and environmental activities (i.e. stargazing and history tours), and fundraisers. The
Brooklyn Bridge Park Corporation and Park Conservancy estimate that, over the last decade,
1,000,000 visitors have participated in the Conservancy’s free events and activities. In 2015, there
were 175,000 visitors and over 500 free and low‐cost cultural, educational, and recreational events
in the park. The Conservancy’s education programs drew over 10,000 students from 50 New York
City schools and free day camps.

Key Resources
This case study was largely developed from information available at the Brooklyn Bridge Park
website, http://www.brooklynbridgepark.org/ and the book Rebuilding the American City: Design
and Strategy for the 21st Century Urban Core, Gamble and Heyda (2015). Other resources include:
Buro Happold Engineering, “Sandy Success Stories, New York, New Jersey, June 2013”
http://www.rebuildbydesign.org/research/resources/36‐resources/38/38

                                                                                                Page | 11
August 2016 | Adaptive Reuse Casebook
Case 3: Beltline, Atlanta, Georgia – A Local Government Non-
Profit Corporation Model
Project Size: 35‐km walking, jogging and
biking network around the city of
Atlanta, Georgia. Parks are also being
constructed along the network
General Land Uses: Open space, park
and recreation facilities.
Timeframe: Initial concept proposed in
1999. Formal planning and management
structure initiated in 2004. Eastside Trail
opens in 2012. Work is still ongoing.
Benefits: Provides year‐round outdoor
recreation and connects existing parks Beltline trail in Atlanta, Georgia (www.beltline.org)
and cultural facilities. Provides an
innovative approach to public transport,
linking 45 neighborhoods together and
also connecting to the regional transit
system (MARTA) and regional trails. It is
also catalyzing redevelopment and
economic development for over 2,500
ha of potentially developable land along
the abandoned rail corridor ringing
downtown Atlanta. Grand Opening of the Historic Fourth Ward Park along the
Beltline (www.beltline.org)
Context
The Beltline was first conceived by a Georgia Tech University graduate student in 1999. His thesis
proposed repurposing a 35‐km loop of largely abandoned old railroad lines, and rights‐of‐way
ranging from 24 to 91 meters in width, that circle the City of Atlanta. The former rail corridor
transects properties that were previously only seen from the rail infrastructure and included poorly
maintained backyards, parking lots, water retention ponds, and industrial relics. Students then
launched a letter campaign that finally gained traction with some members of the Atlanta City
Council. One councilmember held a town hall meeting in her district and residents liked the Beltline
idea. Soon after, that council member became City Council President and launched a 2 ½ year
citywide outreach effort to gauge the level of support among various neighborhood groups and
stakeholders across the city. A coalition of activists, developer and environment groups was formed.
Planning
In 2004, the Trust for Public Land—an international land preservation organisation—commissioned a
study to look at ways to maximize greenspace opportunities in the Atlanta BeltLine corridor. The
study was integral to the plans for comprehensive development or redevelopment of many major
greenspace improvements.
The Atlanta BeltLine Redevelopment Plan was completed in 2005 and includes the initial proposal to
combine greenspace, trails, transit, and new development along the 35 km of historic rail segments;
see Map 3. The plan provided a framework for moving the project forward by outlining the major
12 | PageAdaptive Reuse Casebook | August 2016
public infrastructure projects that comprise the project, identifying the type and scope of potential
development that would be consistent with good planning practices, and identifying the boundaries
of a potential Tax Allocation District to be established in order provide a major local funding source
for the project. (The Tax Allocation District is discussed in the Funding section of this case study.)
Map 3. Overview of the 35-km Beltline trail network encircling downtown Atlanta, GA
Source: www.beltline.org
The implementation of the Atlanta BeltLine began in 2006 with the start of the Five‐Year Work Plan
and the formation of Atlanta BeltLine, Inc. (ABI)—a subsidiary of the Atlanta Development Authority
(discussed in the Management section of this case study). The Five‐Year Work Plan served as a road
map for all targeted activities and accomplishments of the first five years for ABI and its partners.
The majority of the goals articulated in the plan were achieved in the five‐year timeframe.
The Metropolitan Atlanta Rapid Transit Authority (MARTA) conducted an Alternatives Analysis (AA)
to identify and evaluate transit improvements within the Atlanta BeltLine corridor. Finalised in 2007,
this offered options for improving local and regional mobility, accessibility, and connectivity, while
also supporting the City of Atlanta’s redevelopment plans.
Page | 13August 2016 | Adaptive Reuse Casebook In 2007, master planning began by looking at the half mile on either side of the Atlanta BeltLine corridor to create a suitable framework to support future population growth and transit ridership. In 10 distinct subareas, Atlanta BeltLine, Inc. and the City of Atlanta Department of Planning and Community Development developed 10 master plans for neighborhoods surrounding the Beltline that address land use, transportation and parks. Neighborhood residents have informed and shaped the plans by providing detailed feedback at public meetings and in writing. On December 11, 2013, ABI’s Board of Directors unanimously approved the Atlanta Beltline 2030 Strategic Implementation Plan (SIP), which will guide the citywide transportation and redevelopment program through its completion. The SIP is the culmination of a year‐long effort with extensive community and stakeholder engagement to create a living document that determines short, medium and long‐term priorities for the implementation of the Atlanta BeltLine across the city. It also provides cost estimates and funding scenarios to complete the program. Management Structure In 2006, Invest Atlanta (formerly the Atlanta Development Authority) formed a subsidiary organisation—the Atlanta BeltLine, Inc.—for the purpose of managing the implementation of the Atlanta BeltLine program. Like its parent organisation, Invest Atlanta, Atlanta Beltline Inc. is an independent, non‐profit, private development corporation empowered through the Georgia Redevelopment Powers Law. It can receive public funding but is also able to receive charitable donations and partner directly with private corporations in economic development efforts. Working with partners, including City of Atlanta departments, ABI’s functions include specifically defining the Atlanta BeltLine plan; leading efforts to secure federal, state and local funding; spearheading all design and engineering; constructing trails, parks, transit, streetscapes, affordable housing, and art; continuing the community engagement process; managing all vendors and suppliers; and serving as the overall project management office to execute the Atlanta BeltLine program. ABI is also responsible for attracting new development along the special economic zone and, in doing so, navigates the complex space between city agencies, private sector developers, residents and other stakeholders. Atlanta BeltLine, Inc. is also responsible for tracking and reporting progress on the program to the Atlanta City Council, Atlanta Public Schools, and Fulton County, the three taxing authorities that authorized the Atlanta BeltLine Tax Assessment District legislation in 2005 (discussed in the Funding section of this case study). Atlanta BeltLine Partnership is a non‐profit organisation that emerged out of the early grass‐roots movement called the Friends of the Beltline. It is funded entirely through private and philanthropic sources. The Partnership staff works with neighborhoods, businesses, community and faith organisations, and other groups to raise general awareness, and broad‐based support, for the Atlanta BeltLine. The Partnership also raises funds, and serves as a catalyst to mobilize resources to achieve the Atlanta BeltLine vision. Funding The Atlanta Beltline Inc. has spent about US$350 million for land acquisition, parks and trails construction but more than half of the system still needs to be developed. Funding has come from a mix of public and private resources. 14 | Page
Adaptive Reuse Casebook | August 2016

A Tax Allocation District (TAD) was approved in 2005 and serves as a funding resource for the
beltline construction based on the economic gains made in a 0.8‐km swath of neighborhoods on
either side of the trail (approximately 6,000 hectares and roughly 20 percent of the city’s population
and land areas). As their real estate values improve with the addition of the Beltline, the taxable
value of that incremental increase in property value goes to Atlanta Beltline Inc. A portion of the tax
increment revenue is also going to an affordable housing trust fund to help ensure that lower
income residents are not displaced from neighborhoods as gentrification occurs.
 There is one estimate that over US$1.2 billion in private sector development has already occurred in
the area ringing the trail.

Operations: Maintenance and Programs
To date, 18 km of trails have been completed and are open to the public, including permanent trails
and temporary hiking trails. The trail corridors have been constructed in phases. The southwest and
southeast corridors are currently in design.
Several of the Atlanta BeltLine parks are also completed and open to the public, providing new
recreational offerings, public health benefits, environmental benefits, and also serving as a catalyst
for economic development around the parks. The greenspace component is based on the Trust for
Public Land’s 2004 study.
Besides fundraising, the Atlanta BeltLine Partnership’s promotional efforts include: guided tours of
the Beltline, hosting special events and run/walk races on the Beltline, conducting monthly sessions
to teach residents about the Beltline, maintaining a speakers bureau to educate people about the
Beltline, and disseminating information on the Beltline through outreach, social media, and specific
activities. It also hosts the Adopt the Atlanta BeltLine in which dozens of businesses and community
organisations have committed to caring for the Atlanta BeltLine corridor. It has also created the
Atlanta Land Trust Collaborative to help address affordable housing issues, and it coordinates with
more than 40 partner organisations to connect residents with job opportunities around the Atlanta
BeltLine.
While the Beltline aims to bring together Atlanta residents of all races and economic strata, there
are also concerns about social inequity and displacement that the Beltline’s expansion bring new
economic and access opportunities to different neighborhoods in the city. Atlanta Beltline Inc. plans
to invest between US$10 and US$20 billion in infrastructure and economic development over the
25‐year life of the program. The Atlanta Beltline Inc. equitable development strategy targets the
creation of 5,600 units of affordable workforce housing, 30,000 permanent jobs, and 48,000
construction jobs, emphasizing local workforce training and hiring.

Key Resources
This case study was largely developed from information available at the Atlanta Beltline Inc. website,
http://www.beltline.org/ and the Invest Atlanta website, https://www.investatlanta.com. The book
Rebuilding the American City: Design and Strategy for the 21st Century Urban Core, Gamble and
Heyda (2015) was another important resource.

                                                                                                  Page | 15
August 2016 | Adaptive Reuse Casebook
Case 4: Railroad Park, Birmingham, Alabama – A Local
Government and Non-profit Partnership Model
Project Size: 8 ha of open space in
downtown Birmingham.
General Land Uses: Open space park and
recreation facilities that include local
recreation, family activities, concerts, and
cultural events.
Timeframe: Park‐specific planning was
initiated in 2005 and the park opened in
2010.
Benefits: Provides year‐round recreation
and a source of economic development, th
The 17 Street plaza is home to concerts, food truck festivals and
connecting Birmingham's downtown area other cultural events. The excavated pond provides for water
with surrounding neighborhoods and the storage and flood protection (http://www.railroadpark.org).
University of Alabama‐Birmingham
campus.
Context
The City of Birmingham, Alabama was an industrial hub in the early 20th century but many of those
industries like steel production faltered in the second half of the century. Abandoned rail yards were
just one of the artefacts that the City of Birmingham had to contend with.
Back in its heyday, the city of Birmingham and the surrounding Jefferson County had commissioned
the famous Olmsted Brothers to prepare a plan for a comprehensive open space network through
the city. The plan addressed storm water and floodplain management and recommended a system
of new and expanded parks through the “thriving industrial center.” Even after resources for the
plan’s implementation diminished in the 1930s and 1940s, the notion of downtown parks and
recreation endured.
Planning
The abandoned railroad yards have been the subject of numerous planning efforts over many
decades. In 2002, however, the City of Birmingham invited the Urban Land Institute—a worldwide
land use and real estate development membership organisation—to conduct an advisory service
panel on how to enhance quality of life and stimulate economic redevelopment in downtown
Birmingham. The panel had a broad‐based steering committee that included neighborhood leaders
and business leaders. A Railroad Preservation Park was one of the panel’s five focus areas that it
recommended could be a “unifying design element and social magnet” to generate increased
property value and the development of new residential and commercial uses. Friends of the Railroad
District formed in 2001 and provided advocacy and fundraising for the park.
A 2004 citywide master plan stressed the transformative potential of the railroad park. The
University of Alabama had a growing hospital and research facilities just to the south of the park
and, together with the Children’s Hospital, these facilities were serving as economic drivers in the
16 | PageAdaptive Reuse Casebook | August 2016
area. There was also an active entertainment district on the south side of the park and an emerging
loft district on the north side.
In 2005, the City of Birmingham engaged a design team for Railroad Park. The city worked with its
Citizens’ Advisory Board, which represented all 99 city neighborhoods, to ensure that the 14
neighborhoods abutting the park were involved in the planning process.
A proposed park design was presented to the city on March 28, 2006 and ground was ceremonially
broken on October 6th of that year. The planning team proposed that this should be a “train front”
park just as other cities have a river, bay, or ocean front park. There were still 11 active rail tracks
with several slow‐moving trains running through the site on a 5‐meter elevated viaduct every day.
The planning team embraced the industrial elements and proposed a Rail Trail to get people closer
to the level of the trains. It also proposed large‐scale grading to elevate some portions of the site,
and to also create ponds, streams and a 1‐hectare reservoir. About 30% of the site is covered in
water.
After a year of design development and site preparation, a second groundbreaking was held in
February 2008. Site clearing officially began on April 1, 2008. However, failed negotiations with
railroad operators for use of easements forced changes to the design and delayed the start of heavy
construction until December 2008. Phase I opened to the public in September 2010. It includes all of
the park's landscape features along with park administration offices, a concession stand, restrooms,
and a catering kitchen (see Map 4). In October 2012, the park won the "Urban Open Space Award"
from the Urban Land Institute.
Map 4. Amenities at Railroad Park
Source: Railroad Park Foundation, see http://www.railroadpark.org/files/event‐guide.pdf
Page | 17You can also read