Colombo, Sri Lanka The case of
←
→
Page content transcription
If your browser does not render page correctly, please read the page content below
The case of
Colombo, Sri Lanka

                                                                                                                   Source: CIA factbook
by Sevanatha

Contact

Urban Resource Centre
14 Schol Lane, Nawala Road, Rajagiriya
Sri Lanka
Tel/Fax: 94-1-878893

 I.    INTRODUCTION

A.      NATIONAL OVERVIEW

1. Location and Climate
    Sri Lanka is an island situated in the tropics, between     sion. Monsoon rain, which is the dominant type, occurs
the latitudes of 6 and 10 degrees north just at the south-      in two monsoon periods per year. These two seasons
ern tip of India. It covers an area of 64,454 km2 includ-       have been identified as the south-west and north-east
ing the large inland water bodies, which constitute about       monsoons. Convection rain and depression rain occur
1,156 km2 The island is pear-shaped, the maximum                mainly during the inter-monsoon periods. The annual
north-south distance being 435 km and the greatest              average rainfall varies between 1,000 ml in the arid parts
east-west width being 225 km. The mountainous area in           of the north-west and south-east of the island to over
the south-central region, which rises to 2500 metres is         5,000 ml on the south-western hill slopes. Relative
surrounded on all sides by coastal plains, narrow in the        humidity varies generally from about 70 per cent during
west, east and south, but broadening to an extensive            the day to about 90 – 95 per cent during the night. In the
area in the north. The coastline of the country is about        Dry Zone these values are about 5 per cent lower.
1,600 km long (Mendis, 1998).
    Climatically, Sri Lanka falls into two distinct regions –
The Wet Zone and the Dry Zone. The Wet Zone corre-              2. Demographics
sponds mainly to the south-western quadrant of the                 Sri Lanka's first population census was taken in the
country, which covers about 30 per cent of the land area        year 1871, and was repeated every 10 years thereafter.
while the remaining 70 per cent of the land area forms          According to the first census, the total population of the
the Dry Zone.                                                   country was recorded as 2,400,400 people
    A distinct variation in temperature can be observed         (Department of Census and Statistics, 1871). 100
between the Central Hill Country and Low Country with           years after the first census, in 1971 the country's popu-
minimum and maximum average temperatures of 17.6C               lation had increased to 12,698,900 people (Department
and 25.8C in the Hill Country and 24.3C and 31.5C in            of Census and Statistics, 1971). The subsequent pop-
the Low Country respectively.                                   ulation censuses were taken in 1981 and 2001 (no cen-
    The country receives rainfall throughout the year iden-     sus was taken in 1991 due to civil disturbances in north-
tified by three types: monsoon, convection and depres-          ern and eastern parts of the country). The total popula-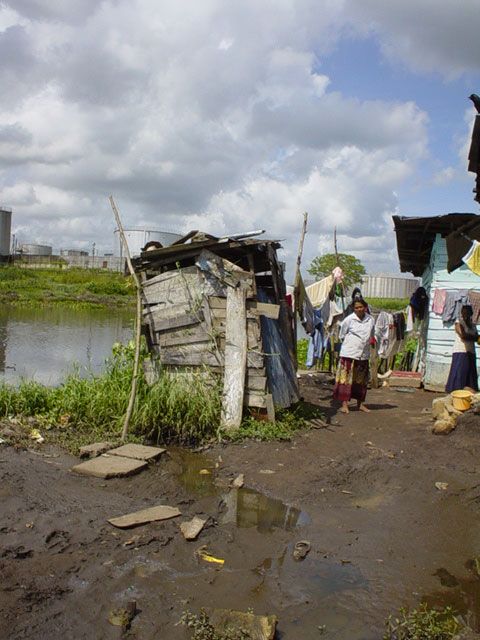
Urban Slums Reports: The case of Colombo, Sri Lanka

tion of the country according to the population census of                  As indicated in the above table, it is clear that the
2001 was 16,864,687 (Department of Census and                           country's GDP is still dominated by the service sector
Statistics, 2001).                                                      activities and the agriculture sector. The manufacturing
   It was revealed that particularly from the 1980s to the              sector, although it has received a great deal of attention,
present, the annual population growth rate has been                     particularly since the early 1980s (when the economic
below 1.5 per cent (Department of Census and                            liberalisation policies were introduced), its contribution
Statistics, 1981). According to the Human Development                   has not yet even reached a quarter of the country's GDP.
Index, life expectancy was 71 for males and 76 for
females (Central Bank, 2001) The country has a litera-
cy rate of 91.4 per cent, 94 per cent for men and 89 per                5. The Urbanisation Pattern
cent for women, indicating the benefits of equal oppor-                    According to the census of population, the country's
tunities in education (Central Bank, 2001) .                            population is concentrated into three major economic
                                                                        sectors. These include Urban, Rural and Estate
                                                                        Plantation sectors. According to the 2001 census, 72.2
3. Racial Composition of the Population                                 per cent of the country's population live in the rural sec-
  Sri Lankan society is a multi-racial one in which a                   tor, 21.5 per cent in the urban and 6.3 per cent in the
majority Sinhalese and several minority racial groups                   estate plantation sector (Department of Census and
have been living together for centuries. The racial and                 Statistics, 2001) This provides a clear picture of the spa-
religious composition of the population according to the                tial distribution of population, which is predominantly a
1981 census is indicated below.                                         rural bias distribution.
                                                                           In Sri Lanka, there is no clear definition of urban
4. Economic Trends                                                      areas. The urban status for an area is statutorily con-
   Sri Lanka being a developing country, its economy                    ferred purely for local administrative purposes by the
relies mainly on agriculture and service sector activities.             minister in charge of local government. The urban
Its GDP growth rate has been fluctuating over the years                 administrative areas are identified by two categories,
and observed varied between 6.9 per cent in 1993 and                    municipal council areas and urban council areas.
4.7 per cent in 1998 which was moving up to 6.0 per                     Presently, there are about 18 municipal council areas
cent in the year 2000 (Central Bank, 2001).                             and 37 urban council areas in Sri Lanka. The rest of the
   With continuing a war situation in North/East                        country falls under rural councils, which are known as
province, since early 1980s , the country's economy                     Pradeshiya Sabhas (PSs) "local councils". There are
was managed to maintain a GDP growth rate of above                      about 254 such PSs in the country. (Source :Sri Lanka
5% . This was reflected in the per capita GNP which                     Instiute of Local Goverance,2002) The municipal council
has ranged from 804 US$ to 841 US$ during the period                    areas include most of the districts and provincial town
1997 – 2000 (Central Bank, 2001).                                       centres located throughout the country. The Colombo

                                                    Table 2: Economic Statistics / National Accounts

                                                                                1978 1993 1994 1995 1996 1997 1998 1999 2000

  Table 1: Racial and Religious                     Per Capita GNP US $           175     587    651     709    747     804    826        813   841
  Composition of the Population
                                                    Real GDP Growth%               8.2    6.9     5.6     5.5    3.8     6.3    4.7       4.3    6.0
  By Ethnicity       %      By Religion      %

                                                    GDP by Sectors

 Sinhalese                  Buddhist                Agriculture %
                     74.0                    69.3                                 30.5   24.6    23.8   23.0    22.4   21.9    21.1   21.3      20.5

 Sri Lankan
                            Hindus                  Mining and quarrying %
 Tamils              12.6                    15.5                                  1.8    1.9     2.0     1.9    2.0     2.1    1.9       1.8    1.7

 Indian Tamils              Muslims                 Manufactu-ring %
                      5.5                     7.5                                 20.0   15.2    15.4   15.7    16.2   16.4    16.5   16.8      17.4

 Moors                      Christians              Construction %
                      7.1                     7.6                                  4.9    7.2     7.3     7.4    6.9     7.0    7.6       7.6    7.0

 Others                     Others                  Services %
                      0.8                     0.1                                 42.9   51.1    51.5   51.9    52.4   52.6    52.8   52.9      53.4
  Source:   Economic and Social statistics of Sri
  Lanka 2001, Central Bank of Sri Lanka             Source: Economic and Social Statistics of Sri Lanka 2001, Central Bank of Sri Lanka

                                                                                                                                                  2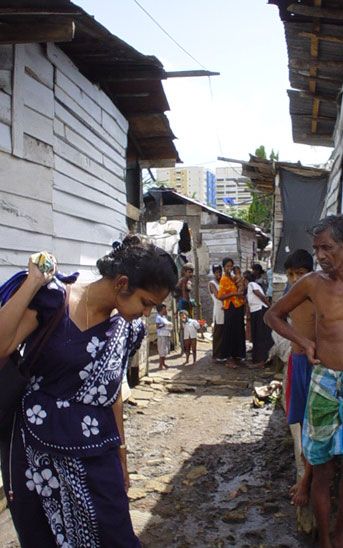
U N D E R S TA N D I N G S L U M S : C a s e St u d i e s f o r t h e G l o b a l R e p o r t o n H u m a n S e t t l e m e n t s 2 0 0 3

    Municipal Council functions as the country's primate                    work as self-employed people and or running their own
    urban centre accommodating a residential population                     business usually earn more than Rs. 500.00 per day.
    of about 642,000 (2001) and a daily floating population                 Thus an average unskilled worker could earn about Rs.
    of another 400,000, making it a city of over one million                4,000.00 to Rs.5,000.00 per month while a skilled work-
    population (Department of Census and Statistics,                        er can earn more than Rs. 6,000.00 per month. It was
    2001).                                                                  found through recent investigations carried out in urban
       One of the significant features of the urbanisation                  poor settlements where SEVANATHA have been
    patterns of Sri Lanka is its slow rate of urban growth. It              engaged in improvement work, that self employed
    is evident that the rate of urbanisation over the past 50               urban poor earn over Rs. 8,000.00 per month
    years has been very slow and the share of urban pop-                    (SEVANATHA, 2001). In this context, it can be said that
    ulation remains below 25 per cent of the Country's pop-                 the informal sector activities in Colombo provide reliable
    ulation. Another significant feature is the low level of                opportunities for the urban poor to earn a reasonable
    migration of population from rural to urban areas. This                 income.
    may be due to several factors such as the smaller size                     However, many of the informal sector activities in the
    of the country allowing people to reach towns and cities                city face problems of integrating into the city's formal
    within a reasonable time, and then to move back to                      sector activities. The pavement hawkers are not allowed
    their place of residence, low transport costs, and above                to operate in some busy streets. The Urban
    all the reasonable level of infrastructure development                  Development Authority as well as the Colombo
    that has been taken place in the rural areas of the                     Municipal Council are making arrangements to provide
    country. Particularly during the past four to five decades              them with alternative spaces to operate. In the mean-
    the government's priority has been investment in the                    time, the municipal council has launched a programme
    rural agricultural sector and plantation sector. Major irri-            to introduce movable carts with roofs and spaces for
    gation and colonisation schemes and developments in                     identified pavement hawkers to operate their business
    district town centres with health, schooling, banking                   activities in a manner acceptable to the council. Thus,
    and other services may have held back migration to the                  the need for integrating the informal sector activities into
    cities. In this context, the primacy of city of Colombo                 the city's formal system has been recognised in
    remains unchallenged.                                                   Colombo. Therefore, large-scale evictions and hostile
                                                                            actions by the city authorities towards informal sector
                                                                            activities have not taken place so far in Colombo. It was
    6. Nature and Extent of the Informal                                    also evident that a majority of people who do engage in
      Sector                                                                informal sector activities have organised themselves
       The term “informal sector activities” is used in                     into some form of associations so that they can
    Colombo to describe those income earning activities                     approach the officials and politicians to discuss their
    which are not registered as business activities either in               problems.
    the municipality or in any other government institution.                   In the absence of recent official studies, the views
    Therefore, by their very nature they do not have official               expressed above are based on the experiences of the
    recognition. In addition to business activities, the irreg-             project staff of SEVANATHA.
    ular work that people perform is also classified as infor-
    mal activities. In Colombo, it is generally assumed that
    over one third of the city's population engages in infor-                B.     THE HISTORY OF COLOMBO
    mal sector activities. In term of jobs, they include
    unskilled workers in the city's markets and establish-                    Colombo was built by the colonial rulers of the island,
    ments, housemaids and domestic helpers etc. In terms                    who included the Portuguese from 1505 to 1656, the
    of business activities, those engaged in pavement                       Dutch from 1506 to 1796 and the British from 1796 to
    hawking activities, mobile vendors, (fish, vegetable, or                1948. The country gained independence in 1948 from
    ornamental goods and household items etc.) repair and                   the British rule. In building the city, the colonial rulers
    cleaning activities, cart-pullers and many other busi-                  seem to have paid greater empjhasis on the port and
    ness activities without recognised status are being                     port related activities to support their trade activities and
    called informal sector activities. In terms of people                   administration. They built a canal network, a rail and
    employed both men and women engage in this type of                      road network connecting Colombo with the hinterland to
    business activity but when it comes to housemaids and                   ensure transportation of commodities from the country-
    helpers it is mostly women. Children below 14 years of                  side to the port. The development of city activities in the
    age are also found working in the informal sector activ-                past seem to have been mainly concentrated in the
    ities but their number is not significant.                              area around the port (presently Pettah and Fort areas)
       In terms of incomes, those engaged as workers or                     and towards the northern highland area of Mattakkuliya
    helpers earn a daily wage ranging from Rs. 200.00 to                    where housing and warehouses were located. The east-
    Rs.400.00 (unskilled & skilled respectively). Those who                 ern flood plain remained undeveloped while the south-
3
Urban Slums Reports: The case of Colombo, Sri Lanka
ern area and coastal belt of the city attracted the middle 1. Density
and high-income inhabitants. The average population density of the city according
to the first available records in 1871 was 40 people per
hectare. This has reached up to 105 people per hectare
1. Planning History of Colombo in 1940. The current density is 172 people per hectare
The first city plan was prepared by an eminent (2001 census). (Department of Census and Statistics,
British Town Planner, Sir Patrick Geddes in 1921. The 2001)
concept of the plan was to preserve the rural spirit of This figure indicates only the city-wide average pop-
the town, and to make Colombo a “Garden City of the ulation density. However, there are some Municipal
East". Though the plan had not been fully implented in Wards, which represent higher densities such as 974
the city, it has had influenced the subsequent planning people per hectare. The highest population density is in
interventions. Colombo North, which is predominantly a low-income
With the enactment of Town & Country Planning residential area. The Colombo Southern area repre-
Ordinance in 1946, the Colombo Municipal Council sents a low-density distribution of population, which is
embarked on preparing a town-planning scheme for the very much close to the city’s current average population
city. The government had invited a British Town Planner, density of 172 persons per hectare.
Sir Patrick Abercromby to prepare the second city plan.
Abercromby's plan of 1949 covered the Colombo
Metropolitan Region as a whole but it did not translate 2. Topography
into detailed proposals. The plan emphasised the A dominant physical aspect of the city is its harbour
decentralisation of the city's activities and creation of and the extensive network of watercourses. A large part
satellite towns around Colombo. of Colombo is below the 30 metre mean sea level and
The third city plan was the Colombo Master Plan of some areas in the east of Colombo are even below the
1978, of which the main objective was the promotion sea level. Rivers are supplemented by numerous
of balanced regional development and accelerated canals either draining the rainwater from the low-lying
economic development of the country. The Colombo land or constructed for water transportation purposes.
Master Plan has provided the basis for city planning The climate of the city is warm and humid for the
programmes implemented since 1978 particularly in the greater part of the year. The mean temperature is 270C
Greater Colombo Area. and the mean rainfall 2,300 mm.
The next city plan was the Colombo Development Plan
prepared by the Urban Development Authority (UDA) in
1985 based on the Colombo Master Plan. This develop- 3. Demography
ment plan laid the foundations for implementing zoning According to the first census of population in 1871,
and building regulations in the city in keeping with the Colombo had a population of 98,847 people. This fig-
future socio-economic development patern in the city. ure became slightly more than doubled by the 1911.
The most recent city plan was the Colombo The current city population according to the 2001 pop-
Metropolitan Regional Structure Plan (CMRSP) pre- ulation census was 642,163 people. The unique feature
pared in 1998 by the Urban Development Authority, of population growth in Colombo has been its slow
whose overall objective to prepare action programmes growth. The annual population growth rate has been
for the development of the region with a view to meet- varying between 0.5 and 3.7 in the recent past
ing the aspirations of the citizens and improving the (Department of Census and Statistics, 2001).
quality of life of the people of Western Province and the
people of Sri Lanka. 3.1 Population by Gender
According to the 2001 census of population, the age
group and gender distribution of the city population is
C. THE PHYSICAL CITY as indicated below.
The significant feature of the above distribution is that
The Colombo Municipal Council was established in a large percentage (29.1 per cent male, 30.4 per cent
1866 under the Colombo Municipal Council Ordinance female) of the population was between the age group
of 1865.. According to the Centenary Volume of of 15 – 29 years .
Colombo Municipal Council 1963, (CMC, 1963) the
physical size of the city was 24.5 km2 in 1871. The amal- 3.2 Ethnic Groups:
gamation of adjoining areas from time to time increased Like many other towns and cities of Sri Lanka, the
the physical size of the city. Such changes occurred in capital city of Colombo is a multi-racial city where
1901, 1911, 1946, 1953 and 1963. The present city size Sinhalese, Tamils, Muslims and other community
has increased up to 37.3 km2. The changes of the city groups have been living together for generations.
size is indicated in the table below:
4U N D E R S TA N D I N G S L U M S : C a s e St u d i e s f o r t h e G l o b a l R e p o r t o n H u m a n S e t t l e m e n t s 2 0 0 3
3.3 Income Distribution II. SLUMS AND POVERTY
There is no data available for income distribution of
the population at city level. The consumer finance and
Socio-Economic Survey of 1996/97, by the Central D. OVERVIEW OF SLUMS IN
Bank of Sri Lanka provides details of income recipients COLOMBO
based on major economic sectors such as urban, rural
and plantation sectors. The data for the urban sector
1. Types
could be used as the basis for understanding the Four main types of slums have been identified in
income distribution patterns of the city population in the Colombo (Upgrading Steps – Ministry of Local
absence of city level data. Government Housing and Construction, 1984)
Slums: Old deteriorating tenements or subdivided
derelict houses. The slum tenements, built mostly of
permanent materials, are very often singled roomed
and compactly arranged, in back to back rows. The
Table 3: The Area, Population Density & Growth Rate
of Colombo (1870 – 2001) occupants have a definite legal status of occupancy.
Shanties: Improvised and unauthorised shelters,
Extent Density Growth
Census
(Ha)
Population
(P/Ha) Rate constructed by the urban squatters on state or privately
1871 2448.6 98,847 40 -
Table 5: Population By Ethnicity, CMC, 2001
1881 2448.6 110,509 45 1.18
1891 2448.6 126,825 52 .8 Ethnicity Population % Of Total
1901 2720.6 154,691 56 2.201
Sinhalese 265,657 41.36
1911 3091.1 211,274 68 3.66
Sri Lankan Tamils 185,672 28.91
1921 3350.3 224,163 73 0.61
Indian Tamils 13,968 2.17
1931 3368.4 284,155 84 2.67
Sri Lankan Moors 153,299 23.87
1946 3438.4 362,074 105 1.83
Burghers 5,273 0.82
1953 3593.9 425,081 118 2.48
Malays 11,149 1.73
1963 3710.4 511,639 138 2.04
Sri Lankan Chetty 740 0.11
1971 3711.0 562,430 152 1.24
Bharatha 471 0.07
1981 3711.0 587,647 158 0.45
Other 5,934 0.96
2001 3729.0 642,163 172 0.45
Total 642,163 100.0
Source: Centenary Volume, CMC, 1963 and Urban Development
Authority, 1996
Source: Department of Census and Statistics, 2001
Table 4: Population by Age and Sex, CMC, 2001
Table 6 Income Distribution by Sector
Age Male Female Quintile Urban Rural Plantation
Less than 4 Year 08.6 08.1
Top 20 per cent 57.3 48.1 37.6
5-14 16.8 16.3
2nd 20 per cent 19.8 22.3 22.0
15-29 29.1 30.4
30-44 25.6 24.3 3rd 20 per cent 12.1 15.2 17.7
45-64 14.9 15.5
4th 20 per cent 7.5 10.0 14.1
More than 65 05.0 05.4
Bottom 20 percent 3.3 4.4 8.6
Total 100.0 100.0
Source: Municipal Budget Report, CMC, 2001 Source: Consumer Finances & Socio Economic Survey, 1996/97
5Urban Slums Reports: The case of Colombo, Sri Lanka
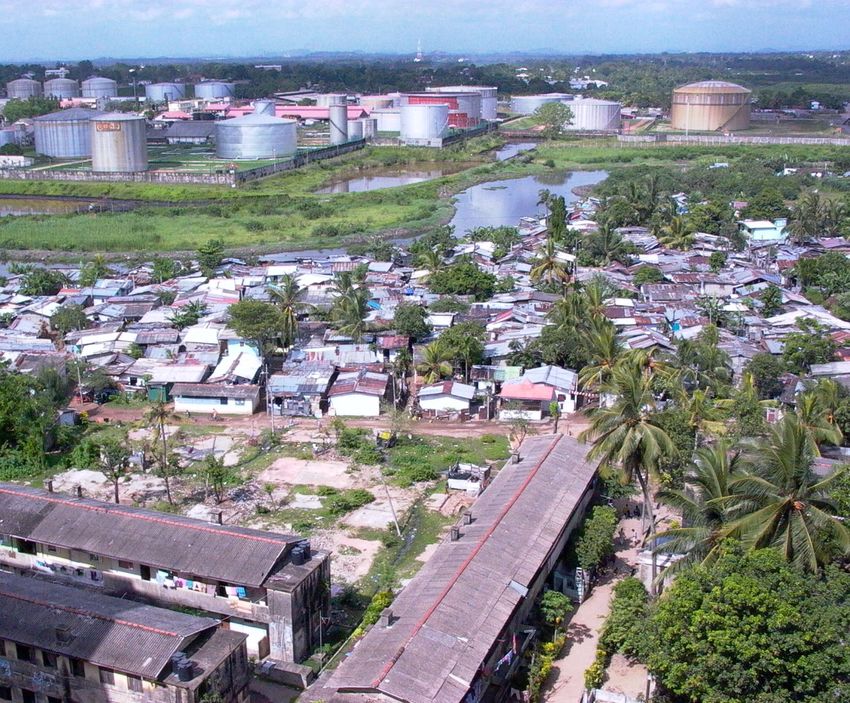
owned land, without any legal rights of occupancy. The 2. Location of Slums
areas are badly serviced and very often unsanitary. The most common slums in Colombo are the inner
city slums and the shanties. Slums are located on high-
Unserviced Semi-urban Neighbourhoods: Badly lands in the old parts of the inner city areas. Shanties
serviced residential areas in the suburban areas of are mostly located in the periphery of city on road and
Colombo and secondary towns. One difference from the canal reservation lands that are mostly low-lying areas
squatter areas is that residents of these settlements liable to frequent floods. Other types of slums are scat-
have definite legal titles and the plot sizes are relatively tered through out the city.
larger than the shanties.
Labour Lines or Derelict Living Quarters: These 3. Age
are derelict housing areas belonging to the local author- Slums in the inner city areas are the oldest low-
ity or government agencies occupied by temporary or income housing in Colombo. These are the old residen-
casual labourers. These settlements are in unsanitary tial quarters built mostly in the 1930s by private land-
and derelict conditions due to lack of maintenance over lords for labourers who were engaged in processing
a period of long time. agricultural products for export. Houses vacated by
middle-income residents and traders in the inner city
areas during the Second World War were gradually
occupied by the low income population which later
became slums. The partitioning of large old residences
was done either by the owner himself or by tenants who
had rented out the single units at low rents to low-
Table 7: Distribution of Low-income Populations by
Types in 1999 income-people who had migrated to the city searching
for new jobs during a period when a thriving plantation
Low-income Settlement No of No of Housing
industry required labour for processing, packing, stor-
Type Settlements Units
age, handling and shipping. Shanty settlements
Slums 1,071 25,500 emerged after independence in 1948 and escalated in
the 1950s particularly during the Korean War time due
Shanties 183 13,313 to influx of migrant workers from rural areas to the city
looking for employment. Many shanty settlements
Low-cost Flats 103 8,950 along the canal banks and road reservations were reg-
ularised under the Million Houses Programs and
Relocated Housing 97 14,814
Colombo Canal Improvement projects from 1984 to
Old Deteriorated Quarters 31 2,575 1995.
Unplanned Permanent
21 870
Dwellings
Total 1,506 66,022 E. SLUM POPULATION, SIZE AND
Source: Survey Report of Urban Low-income Settlements of CHARACTERISTICS
Colombo, STP, 1997/98
The low income population of Colombo has been
identified under different categories in a city -wide sur-
vey carried out in 1997/1998, the results of which are
shown below:
The 2001 survey carried out by the Colombo MC and
SEVANATHA S has identified a total of 77,612 families
living in 1,614 low-income settlements in the city. It was
estimated by many people and organisations that the
total population of these settlements was nearly a half
of the city population but many communities enjoy the
comfort of improved housing conditions and services.
Therefore, it was difficult to categorise all the identified
low-income settlements as being slums (CMC and
SEVANATHA, 2002).
A unique character of the low income settlements in
colombo was that they are relatively small in size. 74
per cent of them have fewer than 50 housing units while
6U N D E R S TA N D I N G S L U M S : C a s e St u d i e s f o r t h e G l o b a l R e p o r t o n H u m a n S e t t l e m e n t s 2 0 0 3
the larger settlements with more than 500 units account G. UNOFFICIALS DEFINITIONS OF
ed for about 0.7 per cent of the total low-income settle- SLUMS USED FOR POLICY
ments in Colombo.
PURPOSE
1. Popular Perceptions of Slum Dwellers
F. THE OFFICIALS DEFINITIONS A series of interviews and discussions were held with
OF SLUMS USED FOR POLICY the people from different social classes to find their
PURPOSES common understanding about the slum communities in
the city. The following were the perceptions shown by
The Policy Paper on Slum and Shanty Upgrading in the public based on their interaction with the slum com-
Colombo prepared by the Slums and Shanty Division of munities.
the Urban Development Authority of Ministry of Local
Government, Housing and Construction in 1979, was Case 1:
the first ever attempt by the government to identify the A council member of the Colombo MC, who has been a
slums for larger development programme in the councillor more than 10 years feels that he has become a
Colombo MC. The terms used are as follows. councillor because of the support given by slum communities
of the area. He thinks that these communities are living in
unsanitary conditions because all people in Colombo neglect
1. Slums slum areas. He thinks that politicians are happy if people in
As previously explained, the term slum refers to old slums are living in such conditions, because they can promise
tenement buildings built for influxes of migrant labour to people to provide with what they need during the election peri-
the city mostly in the 1930s. In the local language this od and get their votes.
type of settlement arrangement is called mudukku. Case 2:
People who live these types of houses do not like to call A lady living in an upper middle-income area close to a slum
their houses by the official name or the popular local community suggested that slum people are the troublemakers
term. They usually call these houses ‘row houses’ (peli of the area. According to her experience, they always engage
gewal). in quarrels with each other, do have bad habits, and difficult to
protect their own belongings because the people from slum
areas sometimes rob or remove others’ property. Children in
2. Shanties slums follow the habits of their elders and become socially
The collection of small, single-unit improvised struc- unwanted people. They sometimes take things from others
tures constructed with non-durable materials on vacant even by force.
land throughout the city are shanties. Shanties illegally
occupy state or private land, usually with no regular Case 3:
water, sanitation or electricity supply, the majority are A Programme Officer working for a leading NGO in the city,
built on land subject to frequent flooding.’ said that slum people are also a part of the city population and
In local language this type of settlement arrangement economy. Therefore, the city should recognise them as anoth-
is called pelpath. This term reflects a group of people er partner or stakeholder in the development process. The
who live in more difficult conditions and greater poverty most important thing is the understanding the people and the
than mudukku or slums according the common usage. development of a good relationship by showing commitment to
Watta in the local language is the common term used them. Then it is very easy to work with these people. The
for both slums and shanty settlements in Colombo by framework in which slum people are to use to work is called the
the general public. The English translation of watta is informal system because the formal system in the city does not
garden. Captain Garden, Ali Watta, Kadirana Watta are recognise them.
some examples of the names of Colombo slums and
shanties. Case 4:
In official documents, low-income settlements are A Health Education Officer attached to the Public Health
mostly identified according to the different types of set- Department of the CMC who works with the slum communities
tlement arrangements as slums, shanties, upgraded directly says that most of slum people are not educated at high
settlements, relocated settlements or low-cost flats. school level and have not gained any training in marketable
skills to engage in regular income earning occupations. As a
result, they suffer from a lot of problems related to livelihoods.
The officials and politicians cheat them most of the time, hence
they have no trust in the commitment of the officials and official
programmes. She urged that the officials should give priority to
the needs of slum dwellers.
7Urban Slums Reports: The case of Colombo, Sri Lanka
2. Slum Dwellers’ Perception of their own poverty lines, the lower poverty line and the higher
Status poverty line have been defined. For the year 1996/1997,
the Central Bank has set the lower poverty line at Rs.
Case 1:
860.00 and the higher poverty line at Rs. 1,032.00 per
A community leader in one of the slums in Colombo South person per month (Central Bank of Sri Lanka, 1997)
said that they had been living in bad conditions without basic Poverty is not only manifested in an inability to afford
facilities for about 20 years. But now they have land rights and basic consumption goods but also in terms of a lack of
improved services with assistance from the government, munic- access to basic needs, such as access to education,
ipality and NGOs. But, still people who live outside the commu- health care, safe drinking water, safe sanitation facilities
nity identify them as slum dwellers or still called their settlement and electricity.
watta. Residents in his community do not like people to call their Rural poverty in Sri Lanka is more acute than urban
settlement a watta. They think that their community is like other poverty. The majority of the population in districts far
neighbourhoods in Colombo. away from the more urbanised parts of the country is
poorer than the people in urbanised areas. In 1996, the
Case 2: provincial poverty level ranged from 55 per cent of the
A young girl who lives in a slum community thinks that she is households in Uva province to 23 per cent of the house-
living in a community that many people outside her community holds in Western province where Colombo is located
see as a socially backward area where residents are not well (Central Bank of Sri Lanka, 1997)
behaved. Outside her community she does not like to say her There have been no conceptual changes to the offi-
community’s real name in public because of the perception of cial definitions of poverty. But the poverty line has been
others about her community. She never invites her school increased from time to time based on the cost of living
friends to her house. and the rate of inflation.
Urban shelter improvement and public health pro-
Case 3: grammes have not been identified based on the official
One young girl said that girls in slum communities couldn’t find poverty lines used in national poverty reduction pro-
boy friends with a good background from normal society; grammes. Areas where the deficiency of basic services
because they do not like girls living in slum communities. such as drinking water, sanitation facilities and other
Therefore, most of the girls have to marry boys in the same com- civic services is high, are commonly recognized as
munity or similar ones. urban poor areas. The income level of the people in
such areas varies from high income to very low level of
Case 4: income.
A female shanty dweller in one of the communities comments Colombo Municipality along with SEVANATHA, a
on the problems her community is undergoing not only with the local NGO based in Colombo has developed a set of cri-
people outside but also with the authorities that do not provide teria to classify the low-income settlements in the city
the basic facilities such as water and toilets. based on twenty indicators (CMC and SEVANATHA,
2002).These indicators are selected in order to measure
Case 5: the level of poverty based on livelihood assets available
A shanty dweller comments that they have no problem with in the community and the factors that change the vul-
their income. But the problem is that the government depart- nerability condition of the people. Using these criteria
ments and authorities do not recognise them. According to his the settlements were not classified as slums or shanties
experience, they cannot send their children to the nearest pop- but were classified into four types of settlement based
ular government school, because they do not have documents on the poverty indicators:
that the school requires for admission.
Poor Settlements
Unserviced Settlements
Upgraded Settlements and
H. OFFICIAL DEFINITIONS OF Fully Upgraded Settlements.
POVERTY USED FOR POLICY
Poverty in Colombo can not be regarded as one of
PURPOSES
low level of income. It is considered in a broader sense
The Poverty Reduction Framework Report of Sri of social marginalisation in which social exclusion, lack
Lanka (2000) uses two yardsticks to measure poverty of access to basic services and lack of shelter are all
ie., absolute poverty and relative poverty, in the nation- being crucial aspects of poverty. Therefore, the
al context. approaches to poverty reduction in the past have been
Absolute poverty is measured with respect to the abil- improving access to services, empowerment and inte-
ity of a household to afford a minimum set of consump- gration of the poor into the main stream of city develop-
tion requirements. To measure absolute poverty two ment process.
8U N D E R S TA N D I N G S L U M S : C a s e St u d i e s f o r t h e G l o b a l R e p o r t o n H u m a n S e t t l e m e n t s 2 0 0 3
Lack of secure sources of income: A majority of urban
I. OFFICIAL DEFINITIONS OF poor consider that they have lots of income opportuni-
POVERTY ties in the informal sector activities of the city. But lack
of opportunities for skill improvements and secure
1. Popular Understandings of Poverty sources of income are a major cause of the poverty.
There are a large number of families suffering from Lack of access to credit: A majority of urban poor
lack of basic services and low-incomes scattered consider that they are poor, because they do not have
throughout the city. As they are not living in the designat- easy access to credit. They always rely on moneylend-
ed low-income areas called slums or shanties, such ers for emergency credit due to lack of access to the for-
mal banking system. Recognising the above limitations
households are generally get excluded from the urban
community savings & credit societies have been formed
poor improvement programmes of the city. People who
by a section of the poor. Women have been playing a
are unemployed, single-headed households, especially leading role in this process. However, the community
women, disabled, elderly and sick people are also con- savings & credit programmes have not been recognised
sidered poor. by the government programmes.
2. The Poor’s Perception of their Own
Poverty
Community perceptions on urban poverty were J. THE ORIGINS OF THE SLUMS
reviewed at different community forums held in Colombo IN COLOMBO
by SEVANATHA. One such forum was held under the
research project carried out by SEVANATHA in collabo- 1. Social, Economic and Political Forces
ration with WEDC of Loughborough University, UK on that have Formed and Removed
Regulatory Guidelines for Urban Upgrading based on Slums
the Sustainable Urban Livelihoods Framework and the
community assessment survey to review the findings Slums including tenement gardens came into exis-
with the communities. (CMC and SEVANTHA, 2002). tence in colombo with the expansion of export trade
The poor’s perception of their own poverty as stated by associated with the rubber boom (during the Korean
them are indicated below: War in 1953) after the Second World War. The charac-
ter of Colombo changed in keeping with the new eco-
Feelings of social exclusion: Low-income people feel nomic demands for warehousing, workers accomoda-
that they are poor, because they are socially excluded tion and the road network improvement.. The city core
by the formal sector institutions. Hence, they have no became more congested and the city elite moved out
access to the city's services, such as piped water, sani-
into more spacious residential areas in the suburbs. The
tation, drains and waste collection. They have no access
central part of Colombo became a predominantly low-
to the formal banking system, hence they depend on
the moneylenders in the area. Their children cannot be income residential area with many slums, and the north-
enrolled in the good schools of the area. They have no ern and eastern parts of the city were occupied by
faith in the institutions and the officials systems to shanties.
acqure services due to poor relations with them. Their
organisations are not genuinely recognised for planning
and development process. 2. Social, Political and Economic
Advantages of Slums to the City
Lack of land tenure: The urban poor recognise their Half of the population of Colombo has been living for
land as being the single most important asset of their
many years in slums, shanties and other types of low-
whole livelihood pattern, hence lack of freehold rights to
their land has been a major cause of their poverty. income settlements. The city needs their services for
Some people responded that they always lived with the proper functioning of various sectors of the urban
eviction threats. Sometimes the government introduced economy. Many people in developing countries cannot
some programmes; especially the relocation pro- afford the services provided by the formal sector. The
gramme without any consultation with the people and informal sector, which is predominantly owned and run
most of these programmes badly affected their liveli- by the people in the low-income areas, provides the
hood. necessary services and goods needed by the majority
of the city in parallel with the formal sector. Most skilled
Government victimisation: People in the urban poor
and unskilled labour needed for the city comes from the
settlements think that the government does not want to
develop these settlements. Most of the respondents who informal sector. Slums are the urban housing providers
were interviewed said that the authorities want to evict at cheap rent for those who come to city not only for
them from their lands and resell to the private sector. seeking employment but also for many other purposes.
9Urban Slums Reports: The case of Colombo, Sri Lanka
Even though slum dwellers can not afford formal sec- 3. Permanent Structures
tor goods and services, they have been able to build Seventy per cent of families live in permanent hous-
their houses and some infrastructure on a self-help es of which 23 per cent were two storied (permanent
basis without being a burden to local authorities and the structures are composed of walls with fired bricks or
government. As the slum dwellers are migrants from the cement sand blocks, roofed with asbestos sheets, cor-
rural areas, they socially and culturally maintain their rugated iron sheets and floored with cement, floor tiles
local values. Politically slum dwellers are important and terrazzo finish). Only 30 per cent of houses are
because they could elect and select members of the semi-permanent and temporary units. This reveals that
city council as well as the higher political authorities as even without freehold rights to land, people have
they hold the majority of votes in the city. Generally, improved their houses.
low-income people have close relationships with the
elected representatives at all political levels in the coun-
try. When these people are aware of the policies and 4. Access to Water
programmes being implemented by the government, Thirty per cent of families have difficult access to
they have been able to influence it in favour of poor drinking water while only 44 per cent have individual
through their contacts with the elected representatives. house connection. 24-hour availability of piped water
covers only 56 per cent of the urban poor families in the
city. About 10 per cent of the families receive less than
10 hours of water per day. This shows that provision of
K. BASIC DATA RELATED TO improved water supplies to a majority (56 per cent) of
THE SLUMS IN COLOMBO urban poor is a critical issue in Colombo.
The key indicators relating to slums presented in the
following tables are drawn from the Poverty 5. Access to Sanitation
Assessment Survey in Colombo conducted by the The availability of the city sewerage network was
Colombo MC and SEVANATHA in 2001 (CMC & recorded for about 70 per cent families (a majority of
SEVANTATHA, 2002) individual toilets and some common toilets were con-
nected to the sewer network. However, in Colombo
North Districts (District 1, 2A, 2B) where a large number
1. Land Ownership in the Slum of low-income settlements located, a sewerage network
Communities connection was available for only 51 per cent families.
Owner occupancy was considered significant in The remaining 30 per cent without sewage connection
respect of the SL approach. But it was found that only facilities used septic tanks and soak pits while some
23 per cent of families have ownership rights to their families directly discharged sewer into canals. As such,
land. improving sanitation conditions in low-income settle-
A majority (46 per cent) live on government owned ments located in Colombo North district is more critical
land (including the National Housing Development than in Colombo South district where about 70 per cent
Authority, Commissioner of National Housing, Urban of families have access to the city sewer network.
Development Authority, Ports Authority, Sri Lanka Land
Reclamation and Development Corporation, Sri Lanka
Railway Department etc).
Lack of land ownership for more than 70 per cent of
the urban poor families is therefore a critical issue in Table 8: Land Ownership of the Settlement / Community
improving their livelihoods.
Land No. of No. of
per cent per cent
Ownership Settlements Families
2. Secure Tenure
Owned by
550 34 19,117 23
Only 37 per cent of families (a majority of this catego- Occupants
ry in low cost flats) enjoy freehold rights, while 40 per
Municipal Land 219 14 15,148 20
cent have user permits, 10 per cent are unauthorised
occupants and the remaining 13 per cent have lease- Government
569 35 35,008 46
hold agreements. As such, about half of the urban poor Owned Land
families have no security of tenure of their occupancy. Privately
276 17 8,339 11
Owned Land
Total 1,614 100 77,612 100
Source: Poverty Profile, CMC and SEVANATHA, 2002
10U N D E R S TA N D I N G S L U M S : C a s e St u d i e s f o r t h e G l o b a l R e p o r t o n H u m a n S e t t l e m e n t s 2 0 0 3
6. Access to Municipal Waste Collection 8. Source of Income
These figures show that extending the solid waste About 45 per cent of the income-earning household
collection service to about 66 per cent of the low-income members engage in unskilled employment activities
families is necessary. (waged labours, helpers etc.) About 9 per cent of fami-
lies do not have any source of regular income. As such,
7. Internal Access Roads lack of a regular source of income is a problem for about
These figures show that about 67 per cent low- 54 per cent of urban poor families.
income settlements needs improvements to their inter-
nal access roads.
9. Poor Relief Assistance
Table 9 Type of Tenure
The research showed that the CMC spends about
Rs.6.1 millions per month on poor relief assistance for
Type of about 12,693 families in the city (which is about 16 per
No. of No. of
Ownership of per cent per cent
Settlements Families cent of urban poor families). Those families whose total
Tenure
family income is less than Rs. 1,500.00 per month are
Freehold
725 45 28,256 37 eligible for CMC poor relief. The distribution of these
Ownership
families in the urban poor settlements revealed that only
Leasehold 296 19 10,169 13
34 per cent of settlements had more than 10 per cent
families receiving poor relief assistance. In this respect
User permit 485 30 31,040 40
it is important to note that between 10 per cent and 25
Unauthorised per cent of families who receive poor relief assistance
108 06 8,147 10
Occupation are present in a majority (89 per cent) of poor settle-
ments.
Total 1,614 100 77,612 100
Source: Poverty Profile, CMC and SEVANATHA, 2002
10. Women Headed Families
Table 10 Housing Conditions Women headed families (due to death, abandonment
No. of No. of or permanent disability of husband) in urban poor settle-
Nature of Housing % %
Settlements Families ments in Colombo were found to constitute a serious
Permanent structures social issue.
with over 50% two 404 26 18,033 23
storied
Permanent structures 11. Functioning of Community
with over 50% single 881 54 36,411 47
storied
Development Councils (CDCs)
Most slum and shanty communities have organised
Semi-permanent 231 14 14,418 19 CBOs, in the form of Community Development Councils
(CDCs). The Colombo MC introduced the system of the
Temporary 98 6 8,750 11 CDC in 1979 and they operate at community level to
improve the basic amenities of their own slum settle-
Total 1,614 100 77,612 100 ments. Through the mechanism of three-tier develop-
Source: Poverty Profile, CMC and SEVANATHA, 2002 ment council system (community, municipal district and
city level) these communities have been able to partici-
Table 11 Piped Water pate in the planning of programme activities to enable
the municipal authorities to deliver the basic amenities
No. of No. of that they really need.
Water Supply % %
Settlements Families
Nevertheless, 67 per cent of the urban poor settle-
Individual house ments do not have CDCs at present. Only 9 per cent of
connection 693 45 34,037 44
the settlements do have properly functioning CDCs. As
Common stand post such, organising the urban poor communities is to be
with easy access 462 28 17,806 23
considered a critical issue in improving their livelihoods.
Common stand post The CDCs fulfil several important activities at commu-
with limited access 396 24 24,026 31 nity level. They provide the channel through which the
Not available within urban poor communicate with governmental and non-
community 63 3 1,743 2 governmental organisations, The CDC is a forum of
people at which the community can take decisions on
Total 1,614 100 77,612 100
the settlement improvement activities. Once a CDC is
Source: Poverty Profile, CMC and SEVANATHA, 2002 formed by an urban poor community it has to be regis-
11Urban Slums Reports: The case of Colombo, Sri Lanka
tered with the public Health Department of the Colombo
Table 13 Solid Waste Collection
Municipal
Council so that it gains recognition by the municipal Type of Solid Waste No. of
%
No. of
%
Collection Settlements Families
council. Some common activities performed by CDCs
are as follows. House to house col-
lection 561 36 26,716 34
To represent the community at different forums and
agencies Communal bin
793 49 38,380 49
To promote collective feelings in the community
regardless of religion, ethnicity, sex, age or cast dif- No regular collection 169 10 8,360 11
ferences
To help community realise that overcoming poverty No regular collection 91 5 4,156 6
is a common target
To support the community to get rid of attitudes of
Total 1,614 100 77,612 100
dependency on others and help raise community
confidence
Source: Poverty Profile, CMC and SEVANATHA, 2002
To co-ordinate development activities implemented
by agencies and people coming from outside
To co-ordinate communication between outside Table 14 Internal Access Roads
agencies and the people in the community to share
information Type of Internal No. of
%
No. of
%
To assist the municipality and other support organi- Access Roads Settlements Families
sations to carry out their project activities (health Tarred / paved
awareness campaigns, environmental improvement 459 30 23,706 31
with side drains
work etc.)
To assist in community development activities initiat- Tarred / paved 409 25 20,886 27
without side drains
ed by different organisations in the following areas
Gravel 298 18 14,906 19
Housing advisory/information services
Income generation activities No proper access 448 27 18,114 23
Environment protection roads
Maintenance of common services
Total 1,614 100 77,612 100
Health and nutrition
Pre-school education Source: Poverty Profile, CMC and SEVANATHA, 2002
Skills development
Women’s development programmes
Savings and credit programmes
Cultural projects
To take initiatives in the operation and mainte-
nance of the common amenities.
Table 12 Sanitation Facilities
No. of No. of
Sanitation per cent per cent
Settlements Families
Individual toilets 503 33 25,905 33
Common toilet with
577 35 21,347 28
easy access
Common toilet with
470 29 28,583 37
limited access
Not available within
64 3 1,777 2
community
Total 1,614 100 77,612 100
Source: Poverty Profile, CMC and SEVANATHA, 2002
12U N D E R S TA N D I N G S L U M S : C a s e St u d i e s f o r t h e G l o b a l R e p o r t o n H u m a n S e t t l e m e n t s 2 0 0 3
12. Access to Community Centres
Table 15 Source of Family Income
Community centres are buildings usually located with-
in an urban poor settlement which the people of the par- Source of Family No. of No. of
% %
ticular community use for their common activities. Income Settlements Families
Mostly, the management of the community centres
becomes responsibility of the municipal council if the Over 50 % of family
income from permanent 218 15 9,342 12
building belongs to the municipality. If it is owned by the job
community (gifted by a project), the CDC undertakes
the management of the community centre. Different Over 50 % of family
CDCs use their community centres for different kind of income from self-enter- 654 40 26,325 34
prise
activities.
Over 50 % of family
income from unskilled 626 38 34,639 45
13. Availability of Community Saving labour
Programmes
Over 50 % of family
116 7 7,306 9
members not employed
Given that the majority of poor households do not
have access to community savings and credit facilities,
Total 1,614 100 77,612 100
the introduction of such programmes for the urban poor
is a necessity. Source: Poverty Profile, CMC and SEVANATHA, 2002
Table 16 Poor Relief Assistance
III. SLUMS: THE PEOPLE
Range of families
L. SHORT LIFE HISTORIES OF receiving poor
No. of
Settlements
%
No. of
Families
%
SLUM DWELLERS relief
Case 1: Mrs. Velaudan Vilasani in Samagiwatta,
Below 10 % 42 66 33,189 43
Narahenpita
Mrs. Velaudan, 55 years old, mother of three children 10 per cent – 25 % 377 23 26,104 34
(one son and two daughters) lives in a low-income
shanty settlement variously known as Samagiwatta, 140 8 14,165 18
25 per cent – 50 %
Elvitigala Mawatha, Narahenpita, and Colombo 05. She
is of Indian origin, and migrated to Sri Lanka with her
parents when she was a child. They received support Over 50 % 55 3 4,184 5
from her uncle to find a house in Poorwarama (another
shanty community) and a job for her farther. When she
Total 1,614 100 77,612 100
married Mr. Madhawan, they faced a lot of problems
finding a place to live at a reasonable price. They rent- Source: Poverty Profile, CMC and SEVANATHA, 2002
ed a small room near to their parents’ house and start-
ed a new life. They were very poor at that time and did
not have a comfortable life.
While her husband was searching for a job and a suit- Table 17 Women Headed Families
able place to live, they heard about a plot of land situat- Range of Families No. of No. of
% %
ed on the railway reservation close to her parents’ in the Settlement Settlements Families
place. This land lot was then used for vegetable farm-
ing. They heard about the land from a neighbour. At that Below 10 %t 1,239 78 49,844 64
time this land was owned by a businessman called Mr.
10 per cent – 25 % 238 14 17,373 22
Edwin from Maharagama. Edwin had divided this land
into several plots for cultivation. About 7 families were
25 per cent – 50 % 98 6 6,392 8
able to take lots, and they paid a rent of about
Rs.140.00 per month. They lived in a small house, Over 50 % 39 2 4,003 6
which was made of timber planks and tin sheets. It was
a very small room more than a house, where her small Total 1,614 100 77,612 100
children grew up. She worked hours in the farm to sup-
port her husband’s business. Not only that, she had to Source: Poverty Profile, CMC and SEVANATHA, 2002
13Urban Slums Reports: The case of Colombo, Sri Lanka
take the produce to the nearest market for sale and she Women’s Bank. Gradually she and her other communi-
went from house to house with a vegetable basket on ty members received the temporary permit from the
her head selling produce. She was very committed for government to stay in the same community and
earning money. Her husband died in 1980. Another 20 improved the community into a small shanty improve-
families were settled in her community by the govern- ment scheme. This is a great achievement in her life
ment. As a result, she could not continue farming and and changed her life style too. Atpresent , all of her chil-
her family suffered due to the financial crisis. In order to dren are married and live in their own houses in the
overcome these difficulties she started to work as a same community.
house maid for one of rich families in Colombo. In the Households in her community have not received legal
meantime, women in her community started a small title for their land yet, but they have private piped water
savings programme under the Women Bank. She joined and electricity. Now her children have become active
the CBO formed by the members of community and members of the CBO and the savings group.
Case 2: Mr. Mahathun, a community member of
Table 18 Functioning of the CDCs at Settlement Level Bakery Watta shanty community.
Level of Functioning
No. of
%
No. of
%
Mr. Mahathun is 53 years old, and the father of five
Settlements Families
children. He was born in Matara district, 150 km away
Functioning as
126 9 10,131 13 from Colombo.. He came to Colombo in the 1960s look-
institution
ing for a job, when he was 18 years old. He was a
Functioning irregularly 100 6 8,662 11 plumber by profession and worked for a private con-
tractor for 30 years. At the beginning it was difficult to
Not functioning 296 18 19,036 25 find a boarding house in a decent area within the city
due to high rent. Then he lived with his uncle close to
No CDCs at
community
1,092 67 39,785 51 the Narahenpita Junction, in Colombo 8. He met his
wife who was living in Bakery Watta close to his uncle’s
Total 1,614 100 77,612 100 house. He settled down with his wife’s parents after the
marriage. In 1995 his left leg was badly injured. As a
Source: Poverty Profile, CMC and SEVANATHA, 2002
result, he couldn’t continue his job as a plumber.,
Table 19 Access to Community Centres because the doctor advised him to take a rest. This sit-
uation created a lot of financial problems. They didn’t
No. of No. of
Availability % % have any savings to face emergencies. Their relatives
Settlements Families
provided some assistance. Then he started a business
Available with
81 7 7,563 9 at his house. He sells commodities that his community
easy access
Available with lim-
members need for their daily life. He earns around Rs.
40 2 5,844 7
ited access 10,000.00 per month. The income he gained from his
Not available but business is quite sufficient for his family expenses. Four
435 26 18,840 24
easy access of his children are married and live in their own houses
in the same community Mahathun’s community is still
Not access 1,058 65 45,365 60
not regularised. Part of their settlements is affected by
the road widening. The Urban Development Authority
Total 1,614 100 77,612 100
(UDA) has informed them that no family will be allowed
Source: Poverty Profile, CMC and SEVANATHA, 2002 to stay on the same location as they are currently living
on the road reservation. Hence, they organised into a
Table 20 Community Savings & Credit Programmes Community Development Council to negotiate with UDA
No. of No. of
for a better relocation project. Now, Mahathun is playing
Coverage % %
Settlements Families a leading role in negotiating with the relevant agencies
Over 50 % of
to get an alternative land for their houses.
47 3 3,391 4
families
25 % - 50% of
39 2 2,074 2
families
Less than 25 %
87 6 8,263 11
of families
Not available 1,441 89 63,884 83
Total 1,614 100 77,612 100
Source: Poverty Profile, CMC and SEVANATHA, 2002
14U N D E R S TA N D I N G S L U M S : C a s e St u d i e s f o r t h e G l o b a l R e p o r t o n H u m a n S e t t l e m e n t s 2 0 0 3
M. ASPIRATIONS, PLANS AND N. HOUSEHOLD INDICATORS FOR
BARRIERS WOMEN-HEADED AND OTHER
Case 1: HOUSEHOLDS
According to Ms. Velaudan, she had a lot of aspira- The information in this section was taken from a sam-
tions and plans when she was young and settled in her ple of Bakery Watta. This data was gathered by
community (Samagi Watta). She aspiring for a comfort- SEVANATHA under its research project on Public and
able life with her husband and the children like other Private Partnerships for Transport and the Poor in
families who live in the city. Her dream was to build a Colombo in 2001.
new house for the family and to give a good education
to her children, because she understood that it is the
1. Overview of the Community
only way that she can avoid her children going into
socially unacceptable life. It has been very difficult to ful- Bakery Watta is one of the oldest shanty communities
fil her dreams due to the absence of regular and suffi- on government owned land in Narahenpita ward in
cient income, insecurity of land tenure and untimely Colombo South. This community originated in 1956, by
death of her husband. After her husband’s death she encroaching the area by a group of nine poor house-
took over the responsibility of maintaining the family. holds .. By now it has grown into a shanty settlement of
The money that was earned from her jobs was just 64 housing units. The community is now threatened with
enough for survival. When she needed more money for eviction, because the area was declared a commercial
the children’s education or any other family matter, they improvement zone under the development plan of the
approached the moneylender in the area. She borrowed UDA. But no one has a clear idea of the date and
money from them and had to pay back with an interest process of the development and the people have
of 20 per cent per month. This system kept both she formed a CDC to negotiate with the UDA for requesting
and other members of her community perpetually alternative land within a reasonable distance of their
indebted to the moneylenders. working places and other social activities.
The main social indicators for this settlement are
given below.
Case 2:
According to the Mr. Mahatun’s experience, all slum
dwellers have their own dreams of a decent family life. 2. General Household Information
But, it is very difficult to achieve this dream, because the Over 90 per cent of economically active inhabitants of
Bakery Watta are unskilled labourers and small and
others in the city neglect people in slums or shanties.
petty traders.
Many poor people who live in low-income settlements
do not own the land. The price of the land and housing Almost all-housing units are single story houses of
rent in the city are very high so that they cannot afford which 95 per cent are temporary built with corrugated
them. Hence the alternative that they have is to iron sheets for roof, timber planks for walls and cement
encroach on the marginal or r rent out a small room rendered floors.
available in the informal settlements in the city. As these
settlements are considered illegal, no state or local gov- It was found that 5 per cent of households are women
ernment agency is willing to provide the basic services headed.
like water, sanitation, electricity and waste collection.
“The government officials think that we are troublemakers. 3. Income Sources and Levels
Officials make a lot of legal barriers as an easy way to bypass The main sources of income are from activities such
as three-wheel driving, working in construction sites,
our requests. Officials and the business sector always try to
cleansing work and small trading or hawking (fruit, fish
evict us from the city. Therefore, we recognised the need for
and vegetable etc) and especially the women work as
an organisation of our own. In my community we have formed maids in high income houses in Colombo and in over-
a Community Development Council (CDC) and I am the seas.
President of our CDC. Now, we are negotiating with the
Housing Ministry to get a block of land for our community from The unemployment rate is as high as about 60 per
the city. The government has promised alternative land for our cent among the youth in the community
people but we do not know when they are going to allocate it,
or where”. Twenty per cent of families including women headed
families receive public assistance from the government
The average income per family about Rs. 5,000.00
per month.
15You can also read