No Transport No Treatment - Community transport to health services in NSW - Cancer ...
←
→
Page content transcription
If your browser does not render page correctly, please read the page content below
No Transport
No Treatment
Community transport
to health services in NSW
No Transport
No Treatment
Community transport
to health services in NSW

 Prepared by:
 David Denmark, Transport Planning and Management
 Anne Hurni, Social Research Consultant
 Brian Cooper, Community Planning and Social Mapping Consultant
Community Transport
Table of Contents
List of figures 3
List of tables 3
Acronyms 5
Executive summary 6
1. Introduction 10
1.1 Aims 10
1.2 Methodology 10
1.3 The sample 11
1.4 Limitations of the research 12
1.5 Structure of the report 12
2. Context 13
2.1 Community transport in NSW 13
2.2 Funding of community transport 14
2.3 Health transport policy in NSW 16
2.4 The NSW Government State Plan 17
2.5 Changing demands for health related transport 17
2.6 The impact of changes to health service provision 20
2.7 Regional differences in health and transport 21
2.8 Regional differences in cancer incidence and treatment 23
2.9 Indigenous people and health related transport 24
2.10 Research on health related transport needs 24
3. Results 28
3.1 Number of health related trips 28
3.2 Service provision models 28
3.3 Proportion of trips to health destinations 30
3.4 Day of travel 30
3.5 Users of health related community transport 30
3.6 Health destinations 30
3.7 Type of clinic visited 31
3.8 Distance travelled to health facilities 32
3.9 Methods of managing demand 32
3.10 Unmet need/demand 34
3.11 Client contributions 36
4. Health related transport: An Aboriginal perspective 38
4.1 Issues in Aboriginal transport 38
4.2 How Aboriginal people travel to health appointments 41
4.3 Health service providers and community transport 43
4.4 Issues for Aboriginal transport industry workers 44
4.5 Improving health related transport for Aboriginal people 45
2 No Transport No Treatment
5.        Solutions                                                                          46
 5.1       The NSW Government State Plan                                                      46
 5.2       Increase funding for non-emergency health related transport                        46
 5.3       Allocate resources so health transport is available to all                         47
 5.4       Prioritise access of Aboriginal people to health transport                         47
 5.5       Increase the role of public transport                                              49
 5.6       Include transport as part of all health planning                                   51
 5.7       Collect data on transport needs                                                    53
 5.8       Conclusion                                                                         54

           Appendix I.                                                                        56

Figures

 Figure 1      Population aged over 65 years in NSW, 2006.
 Figure 2      Projected population aged over 65 years in NSW, 2031.
 Figure 3      ARIA index map of NSW.
 Figure 4      Service provision models for health related community transport.
 Figure 5      Health destinations served by community transport in each
               Are Health Service.
 Figure 6      Types of demand management measures used in rural and
               urban community transport groups.

Tables

 Table 1       Participating community transport providers by Area
               Health Service
 Table 2       Community transport funding by government program
 Table 3       Provision of health related trips by paid and volunteer drivers.
 Table 4       Most visited clinics by community transport services.
 Table 5       Demand management measures used by community
               transport groups.

                                                                                  No Transport No Treatment   3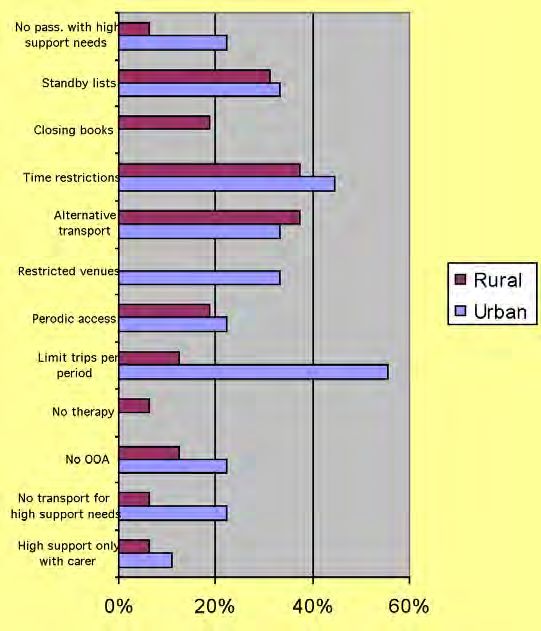
Acronyms

AAS        Area Assistance Scheme
ABS        Australian Bureau of Statistics
ACE        Adult Community Education
AHS        Area Health Service
AIHW       Australian Institute of Health and Welfare
AMS        Aboriginal Medical Service
ARIA       Accessibility/Remoteness Index of Australia
ATSI       Aboriginal and Torres Strait Islander
ARIA       Accessibility and Remotes Index of Australia
CDEP       Community Development Employment Program
CT         Community Transport
CTP        Community Transport Program
CPI        Consumer Price Index
CSO        Community Service Obligation
DADHC      NSW Department of Ageing Disability and Home Care
DVA        Department of Veterans’ Affairs
GCMO       Gold Coast Mobility Office
GP         General Medical Practitioner
GSAHS      Greater Southern Area Health Service
GWAHS      Greater Western Area Health Service
HACC       Home and Community Care Program
IPART      NSW Independent Pricing and Regulatory Tribunal
IPTAAS     Isolated Patients Travel and Accommodation Scheme
HNEAHS     Hunter and New England Area Health Service
MDS        Minimum Data Set
MoT        NSW Ministry of Transport
NCAHS      North Coast Area Health Service
NCOSS      New South Wales Council of Social Service
NGO        Non-Government Organisation
           Northern Sydney and Central Coast Area Health
NSCCAHS
           Service
NHS        UK National Health Service
PET        Pensioner Excursion Ticket
POW        Prince of Wales Hospital
PTS        Patient Transport Service
RACV       Royal Automobile Club of Victoria
RDF        Resource Distribution Formula
RTA        NSW Roads and Traffic Authority
SESIAHS    South East Sydney and Illawarra Area Health Service
SWSAHS     South West Sydney Area Health Service
TAFE       Technical and Further Education
TFH        Transport for Health Program
WSAHS      Western Sydney Area Health Service
YACS       NSW Department of Youth and Community Services

                                                                 No Transport No Treatment   5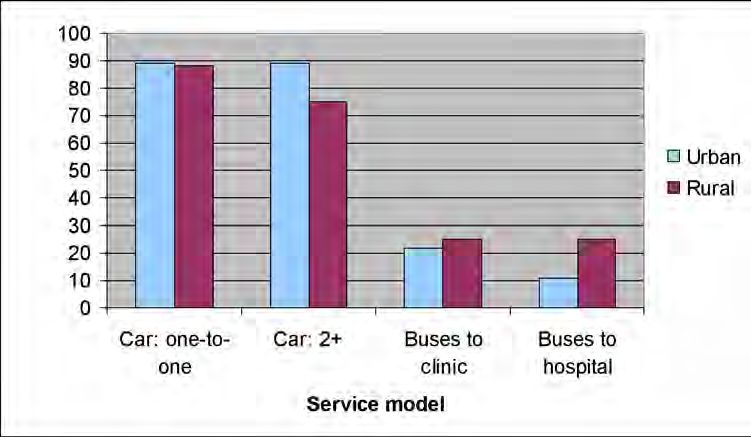
Community Transport
Executive Summary
“Community Transport to health services is vital. Put simply, patients cannot be treated if they cannot
attend their appointments.
transport
providers Community transport offers non-emergency transport to people who are unable to travel by
in NSW refuse car or public transport, with a strong focus on providing services for older people and people
with disability. However, health-related transport is increasingly using a greater proportion
an estimated of the community transport budget. Community transport groups supply approximately
90,000 680,000 health-related trips per year in NSW. Many providers are routinely forced to refuse
requests for requests for transport to health treatment with some services closing their books on
requests because they do not have the resources to meet demand.
transport to
health services The Cancer Council NSW (TCCNSW), Council of Social Service of NSW (NCOSS) and the
each year.” NSW Community Transport Organisation (CTO) commissioned a major study of community
transport in this state. The report, the first of its kind, examined the pressures of non-
emergency health-related transport faced by community transport providers. A third of
community transport providers were surveyed, including those who service remote and
Indigenous communities.
The report found that thousands of people across the state are finding it difficult to access
the health treatment they need, and community transport providers are struggling to
address demand.
Key Findings
This report makes 5 key findings in relation to the delivery of health transport services by
community transport providers in NSW.
1. There is increasing demand for transport to health services in NSW.
The delivery of health services in NSW has changed significantly over the years.
There has been:
• A concentration of services in fewer hospitals
• Moves towards early discharge and increasing use of day surgery
• A decline in the number of general practitioners in regional areas.
These changes have meant that people have to travel more often to access health services;
people without access to a car or reliable public transport face the prospect of not receiving
treatment because of access problems.
As such, demand for community transport has increased substantially. Community transport
providers have more than doubled the number of trips they provide to health services over
the last ten years: from 240,000 in 1996 to 680,000 trips in 2006. The proportion of trips
that serve health facilities has grown from 16% to 28% of total community transport trips.
As such, Community transport providers in NSW refuse an estimated 90,000 requests for
transport to health services each year.
2. There is inadequate funding for transport to health services.
NSW Health only provides 10% of the funding for the 680,000 trips provided by community
transport providers to health services. This means that providers must either draw from
other funding sources or fundraise in order to meet demand. Inadequate funding for
transport to health services has also meant that existing government programs (such as
the Home and Community Care program) are inundated with requests for health transport,
while also struggling to provide transport for other target destinations, such as shopping
services and social outings for older people, people with disability and carers.
6 No Transport No Treatment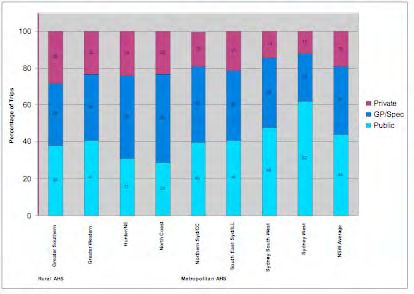
3. Both metropolitan and rural areas have health transport problems.                                     “The
There is inconsistent provision of health-related transport across the state. Transport for              responsibility
Health program funding is not available to all community transport groups. Many country
                                                                                                         for medical
groups do not have access to paid drivers or vehicles and in some location’s resources are
consumed by long distance trips, especially to regular therapy appointments.                             transport
                                                                                                         appears to be a
Community transport providers must turn away requests for transport to health services on                grey area… in
a daily basis. Although this is a state-wide phenomenon, the problem appears more acute
                                                                                                         the meantime
in urban areas. Metropolitan community transport providers refuse an average of 1 in 6
requests for health transport.                                                                           people are not
                                                                                                         receiving the
Urban community transport groups also spent more of their time providing transport to                    service they
health services compared to other trips: among urban groups 44% of trips were to health
                                                                                                         need…”
treatment, compared with the state-wide average of 28%.
                                                                                                         TP&M interviews,
4. Indigenous groups are disadvantaged regarding health transport                                        Western Sydney, 2005
Indigenous people appear to be the most disadvantaged in terms of access to suitable
transport services to health services. This is related to:
    • The low number of people in some Indigenous communities with driving licences or
        cars
    • Issues of distance and a lack of public transport
    • Low socioeconomic status and a reduced ability to purchase transport services
    • The poor health status of many Indigenous people
    • Culturally inappropriate transport services.

Many Indigenous people rely on family and friends for transport to health services, or on
community services that do not normally provide transport. In some cases Indigenous                      “We were told
people must walk long distances or hitchhike to access services.                                         of one woman
                                                                                                         in an isolated
5. Cancer patients are also disadvantaged regarding health transport.
Although cancer is one of the most common causes of morbidity in our society, with 1 in 3                community who
people affected in their lifetime, access to transport for cancer patients can be difficult. The         has to attend
necessity for specialised vehicles, concerns about the side-effects of cancer treatments,                treatment three
and the problems these issues raise for staff and volunteer drivers have led to problems in
                                                                                                         times per week.
community transport for cancer patients. Dialysis patients can also face transport problems
due to the frequency and complexity of their treatment.                                                  She has transport
                                                                                                         arranged for one
Solutions                                                                                                day and has to
The report makes a number of recommendations to improve the provision of health                          hitch-hike on
transport services in NSW. The NSW Government has made a commitment to improving
services and outcomes within A New Direction for NSW: State Plan. There is now an
                                                                                                         the other two
opportunity for Government to develop strategies systematically that will make a positive                days…”
contribution to the health and wellbeing of NSW residents. The solutions proposed within                 TP&M interview,
this report are relevant to goals and priorities within the State Plan and will contribute               Northern Rivers, 2005
towards achievement of targets. In order to address the significant problems faced in
ensuring connectivity to health services; it is recommended that the State Government of
NSW take the following steps:

1. Increase funding for non-emergency health-related transport
There is a chronic shortage of funding for the NSW Government’s Transport for Health
program. The NSW Government currently spends less than $1 on transport through this
program for every $1000 that it spends on general health services. Increased funding for
health-related transport would reduce the number of people missing or delaying health
appointments because of transport issues. This would also have the advantage of releasing
existing community transport funding for other important transport roles.

                                                                             No Transport No Treatment      7
The Cancer Council NSW, the Council of Social Service of NSW and the Community
Transport Organisation recommend an increase of NSW Health funding for non-emergency
transport services from the current less than $3 million to $10 million per annum. It would
make sense for funding for community transport services to be coordinated by one agency,
such as the Ministry of Transport.
2. Allocate resources so health transport is available to all
It is inequitable that people are not able to access health services because of where they
live or who they are. Adequate resources should be available to each Area Health Service
to meet community needs in the local region. Indigenous people face substantial problems
accessing existing services: active steps must be taken to work with service providers and
the community to remove these barriers.
3. Include transport as a part of all health planning
Transport should not be a barrier to accessing health services. If health services are
restructured, government must ensure that people can travel easily to them. Transport
should be an essential element of health planning. This should include planning for the
provision of transport to treatment centres including those providing cancer treatment and
dialysis. The government is urged to measure and report on its progress in solving transport
problems relating to access to health services.
Recommendations
Recommendation One
Increase NSW Health funding for non-emergency transport services from the current
amount of less than $3 million, to $10 million per annum.
NSW State Plan: S1, S2, F1, F2, F3, F5
Recommendation Two
That the distribution of growth Transport for Health funds to community transport groups be
more equitably distributed across the state, taking into account population profiles, health
indicators, the location of health facilities and the relevant costs of providing transport.
NSW State Plan: S1, S2, F1, F2, F3, F5
Recommendation Three
That the NSW Government develop a strategy to address access to health transport
by Aboriginal people that includes consideration of: resources and funding for services,
planning and coordination, access to motor vehicles and licenses, geographic isolation,
patient travel assistance and accommodation schemes, cultural appropriateness of existing
services, and information on public and community transport services.
NSW State Plan: F1
Recommendation Four
That the NSW Ministry of Transport work with NSW health to support bus operators to
develop demand responsive flexible bus services that serve hospitals and other health
facilities.
NSW State Plan: S2, S6, F1, F2, F3, F5
Recommendation Five
That NSW Health work with local and non-government service providers and other
government agencies to develop a regional planning process for health transport.
NSW State Plan: S1, S2, S6, F1, F2, F3, F5
8 No Transport No TreatmentRecommendation Six
That systems be put in place by Health Transport Units and community transport operators
to aggregate demand so that more effective use can be made of available transport
resources and services.
NSW State Plan: S1, S2, S6, F5
Recommendation Seven
That NSW Health review discharge planning procedures to ensure that patient transport
needs are prioritised at discharge and for future health treatment.
NSW State Plan: S2, F1, F3, F5
Recommendation Eight
That Area Health Services establish transit lounges at major health facilities and that major
hospitals reserve areas near to hospital entrances for short-term parking reserved for use by
community transport, Area Health transport and Ambulance transport services.
NSW State Plan: S2, S6, F1, F2, F3, F5
Recommendation Nine
That all Transport for Health data be made publicly available.
NSW State Plan: S1, S2, S6, F1, F2, F3, F5
Recommendation Ten
That a periodic unmet transport needs data collection among funded community transport
operators should be undertaken regularly by the Ministry of Transport.
NSW State Plan: S2, F1, F3, F5
No Transport No Treatment 9Chapter 1
1. Introduction
This research project was a joint initiative of The Cancer Council NSW, the leading cancer
charity, the Council of Social Service of NSW (NCOSS), a peak body for non government
human service organisations, and the Community Transport Organisation, the peak body for
community transport providers. Transport Planning and Management were commissioned to
undertake the research and compile the report.
1.1. Aims
There has been growing anecdotal evidence from community transport (CT) providers in
NSW of increasing demand for transport to health treatment. Growing demand for health
transport places pressure on CT providers to do more with limited resources and reduces
the capacity of providers to offer transport to other important destinations, such as social and
recreational journeys. In many cases, CT providers are reporting that they must increasingly
refuse requests for transport to health treatment, because they have no capacity to respond
to growing needs.
The aim of this research was to analyse the scope and nature of the demands for non-
emergency health related transport on CT providers in New South Wales and the resource
implications which result from this demand.
The project objectives were to:
• Quantify the nature and extent of the provision of health-related transport provided
by CT groups
• Assess the impact of the demand for health related transport on CT providers in
relation to their other transport functions
• Estimate the extent of demand for health related transport that cannot be met by
CT providers
• Identify and analyse variations in the provision of health related transport by CT
groups and the unmet need for these services in relation to demography, health
conditions, service models or service policies
• Identify and analyse the impact of the use of different service models and service
policies.
The project included a focus on access for cancer treatment and analysis of service differences
between rural and metropolitan Area Health Services (AHS).
1.2. Methodology
The research design involved the collection and analysis of both quantitative and qualitative
data from CT providers geographically spread across the four metropolitan and four rural Area
Health Services, using the following methods:
a) Travel survey data: Information about the provision of health related CT services for a
one week period was collected from 38 CT providers. A total of 42 CT providers were
invited to participate and 38 responded. Information collected included age, gender and
details of all health related transport trips over the period including origins, destinations,
type of facility visited, times and dates. All identifying information was deleted from the
records by the participating groups to protect client confidentiality.
10 No Transport No Treatmentb) Interviews with CT providers: A structured interview was conducted with 12 CT
providers; by telephone to rural providers and face-to-face with metropolitan providers.
The interviews aimed to collect qualitative information about how non-emergency health
related services were delivered, and gather the views of providers about the nature of the
demand and problems and solutions for meeting the demand.
Additionally, information from two group discussions supplemented the individual
interviews. One discussion group was held with providers in the North Coast AHS and
the other with providers in the South Eastern Sydney/ Illawarra AHS.
A total of 19 groups were invited to participate, out of which 12 were interviewed, 2
declined, 4 did not respond and one participated in the (North Coast) discussion group. Of
the 12 that were interviewed 9 also returned their short survey (see below).
a) CT interviewee survey data: Each CT provider who was interviewed was asked to
complete a short, self administered survey to collect information about their service to
enable comparisons to be made between the information from the interviews and the
Travel Survey Data.
b) Unmet needs survey: Participants in the travel survey and the CT provider interviews
were invited to complete by email the unmet needs survey along with a number of other
groups. Those who opted into this additional survey kept a record of unmet requests for
transport. This involved a short self-administered survey based on records of requests
for health related transport. This aimed to provide some information about the types of
services that agencies have difficulty in providing and why services are refused.
Agencies were asked to provide information about the requested date of travel, frequency
of requested travel, destination and clinic to be visited, reason for refusal and whether the
person was referred to another provider and the result of that referral. Participants in the
travel survey and the CT provider interviews were invited to complete the unmet needs
survey along with a number of other groups. A total of 16 CT providers responded to the
unmet needs survey. Additionally, information from the South Eastern Sydney/Illawarra
AHS CT providers, who had completed the survey for another project, was included.
c) Consultations with Indigenous service providers: Staff from eight Aboriginal Health
Services around the state were interviewed. These telephone interviews were conducted
by two former Aboriginal Transport Workers. The consultants also attended a meeting of
the State Aboriginal Transport Workers Forum and also met with the NSW Ministry of
Transport Aboriginal Transport Coordinator.
1.3. The sample
Sampling took into consideration the number of CT providers in each AHS region, the size of
the locality where the providers are based and the remoteness of the locality based on the
ARIA index, in an attempt to ensure a reasonable spread across the current distribution of CT
providers. Consideration was also given to coastal versus inland locations for Great Southern
AHS and Hunter/New England AHS. The number of groups participating in the project in each
AHS region is shown in Table 1.
No Transport No Treatment 11Table 1. Participating community transport providers by Area Health Service
Area Health Service
South East Sydney/
Sydney South West
Northern Sydney/
Greater Southern
Greater Western
Central Coast
Sydney West
Hunter/ New
North Coast
Illawarra
England
Total
Survey Type
Travel data 3 5 4 4 6 3 7 6 38
CT interviews - -* 2 2 2 1* 2 3 12
CT interview survey - - 1 2 1 1 1 3 9
Unmet needs survey - 6 1 2 4 1 1 1 16
Total study participants 4 10 6 6 9 3 10 10 50
CT providers in each AHS 9 15 7 9 23 6 32 18 119
*Group discussions were held in two AHS with a number of transport providers attending.
1.4. Limitations of the research
Overall a total of 50 CT providers participated in the project, which represents more than 40%
of all CT providers in NSW. This sample size is sufficiently robust to provide an indication of
the issues facing CT providers in their delivery of transport to health destinations.
Nevertheless there are limitations. For example, it is difficult to compare representation across
regions because of the variability in the resources of CT providers and the populations they
serve. Similarly, the travel survey data represents a relatively short period of time within a
calendar year – it does not account for the ‘seasonal’ fluctuations in demand that CT providers
are likely to experience. Thus, the data was corrected for these fluctuations.
Although there are large amounts of data collected by transport providers, their funding
bodies and health services, it is difficult to analyse systematically or spatially, because of
different jurisdictional boundaries used by the government departments (namely transport
and health), different data collection requirements by the different funding bodies, and
different collection methods used by the providers themselves. Further, under-reporting in
the Home and Community Care (HACC) Minimum Data Set information currently collected
by this Commonwealth/State government program and an absence of publicly available data
about transport activity funded under the NSW Health Transport for Health program and the
Department of Veterans’ Affairs, limits the potential to draw definitive conclusions from these
sources. The interviews conducted as part of this project aimed to overcome some of the
research limitations described above, by providing in-depth information on the key issues that
face the CT industry.
It is acknowledged that the mix of face-to-face, telephone and survey responses used in this
research will limit the strict comparability of results arrived at by different methodologies.
For example face-to-face structured interviews were used for metropolitan providers
and telephone interviews for rural providers: it can be expected that this use of different
methodologies will affect comparability between metropolitan and rural responses for
structured survey results.
1.5. Structure of the report
The methodology and findings from the interviews and surveys conducted as part of this
research are set out in Chapters 1 and 3 of this report. The background and policy context
of community transport in NSW is described in Chapter 2, as well as a literature review of
previous health related transport studies. Consultations with Aboriginal health and transport
workers are presented and discussed in Chapter 4. Suggested actions required to redress the
inequities in health related community transport are recommended in Chapter 5.
12 No Transport No TreatmentChapter 2
2. Context
Improving the health of the population is a priority concern of state and federal governments.
Access to health care services by all people in the community is a critical factor in determining
health outcomes. “The purpose
of community
The availability of suitable transport, beyond emergency ambulance assistance, is integral to transport is to
enabling access to health care services. Where the use of private motor vehicles or public
transport is either not available or not practical, the demand for non-emergency health related meet the needs
transport falls largely to community transport providers. The purpose of community transport of specific
(CT) is to meet the needs of specific transport disadvantaged groups in the community transport
including isolated families, the frail aged, younger people with disabilities, and their carers. disadvantaged
As such, CT provides transport disadvantaged people with access to recreation, shopping,
education, medical care, social services and social contact, where conventional private or groups in the
public transport systems are not generally considered viable or appropriate.1 community
including isolated
Approximately 119 state government-funded CT groups currently exist in NSW. Transport families, the frail
Planning and Management were commissioned to undertake research investigating the
scope and nature of the demands for non-emergency health related transport on formal aged, younger
CT providers in NSW. This report aims to inform policy development, service provision and people with
resource allocation in this area. Services regarding cancer treatment were a focus of this disabilities, and
project. Transport provided by family and friends did not form part of this research. their carers.”
2.1. Community transport in NSW
Passenger transport has always occurred informally through communities, families, friends
and neighbours providing assistance to people who face barriers to accessing transport. The
first formal community transport service established in NSW was the Bathurst Community
Bus which was approved by the state government in 1978 and which still operates today. In
1981, the Department of Youth and Community Services (YACS) provided a grant to Kogarah
Community Aid and Information Centre for research into the needs of aged and disabled
people. The research, which was undertaken by the Geography Department of the University
of Sydney, led to the establishment of the St George Community Transport Project.2
In 1983, YACS funded nine CT projects totalling $72,250. In the meantime CT groups
were lobbying the Minister for Transport to take responsibility for the new industry sector.
Successive ministers refused on the grounds that it was a form of welfare and not a transport
service. Representations to the Premier Neville Wran eventually lead to the Ministry of
Transport taking responsibility for CT and the establishment of the Community Transport
Program. Other financial support came from local government, Area Assistance Schemes and
the Community Employment Program. CT workers at this time concentrated upon planning
activities, identifying unmet needs, modifying existing services, hiring spare capacity to start
new services, making greater use of community buses, and starting share-ride taxi and hire
car services.3
However, direct service provision was on the horizon. The Community Transport Organisation
(a peak body for those involved in CT issues) argued strongly that the new Home and
Community Care (HACC) program should include a transport sub-program, which is what
eventually happened in NSW. Funding from this source grew from $4.9 million in 1991 to
over $20 million last year with the bulk of the funding being used for the development and
delivery of direct services.
No Transport No Treatment 13The initial focus of the CT industry in NSW was shopping, transport to day-care and outings.
This role has shifted towards the provision of transport to health destinations. Health
related transport is increasingly using a greater proportion of CT budgets and has become
the main focus of transport by volunteers in rural areas. A report completed for the NSW
Health Department in 2001, highlighted the role CT played in access to health services. The
researchers found that 40% of publicly funded non-emergency health related transport in
NSW was provided by the CT sector, a greater proportion than either the Ambulance Service
or the Area Health Services.4
Demand for health transport has also changed the way in which CT operates in NSW, with
an increasing focus on ‘individual transport’ (i.e. the use of a car and driver to provide more
intensive support to clients) as opposed to ‘group transport.’ Some CT groups initially refused
to provide individual or health related transport but specific funding from the HACC program
for this purpose rapidly expanded this mode of CT. Individual transport was initially delivered
predominantly by volunteer drivers, however paid drivers have became more prevalent,
particularly in urban areas. Although many individual transport services are open for any
purpose, in practice most now concentrate on transporting people to and from medical
facilities. For example, a metropolitan CT service that participated in this research reported
that over 95% of its individual transport trips pertain to health facilities.
It is important to note that a large number of non government human service providers also
deliver transport as a core component of their service package, even if they are not formally
recognised for this role. This can include organisations such as community health, residential
aged care and supported accommodation providers. Home and Community Care funded
Neighbour Aid providers also provide community transport services, many to health related
destinations.
2.2. Funding of community transport
Whilst CT groups have been very inventive over the years in finding ways to finance their
operations, most funding now comes from a limited number of sources. Some of this funding
is used for general CT (which includes health related transport) services whilst some funding
is specifically allocated for the provision of health related transport. The main sources of
funding for CT are shown in Table 2.
Table 2. Community transport funding by government program*
2006-2007
Program $
Home and 26.2 million
Community Care
MoT Community 2.9 million
Transport Program
Area Assistance 660,000
Scheme
Transport for < 3 million
Health*
Department of N/A
Veterans’ Affairs
*Notes: The NSW Health Transport Program in 2006/07 was allocated $15.9m, of which funding for
non-emergency transport services was unreported, but can be estimated to be between $1 and $3
million. No data was available at this time this report was published on funding through the Department
of Veterans’ Affairs regarding community transport.
14 No Transport No TreatmentThe main source of funding for CT is via the Commonwealth/State HACC program. Government
allocates HACC funding through a formula which is partly based on population size. The overall
increase in funding through HACC has increased considerably as a reflection of changes in
population. The formula does not however take into consideration geographical differences
and variations in distances to access health services. HACC-funded transport services are
restricted to people who meet the HACC eligibility criteria. People requiring CT who fall
outside of these criteria generally have to rely on transport provided by the Community
Transport Program (CTP) funds or other sources. The funding available through CTP is not
responsive to demographic change nor geographic variations, and has not been increased
(beyond indexation for inflation) to meet changing needs. Area Health Service funding for CT
is not available in all regions, but has been increased in recent years.
The provision of health related transport tends to be more expensive on a unit cost basis than
most other forms of transport because of the increased administration involved in booking
and scheduling each individual trip and the one-to-one nature of many trips. Indeed it can be
reasonably estimated that the provision of a passenger trip on individual transport (the vast
majority of which is health related transport) takes more than twice as many resources as
does a passenger trip on group transport.5 This has implications for the available resources
for health transport, as shall be discussed further in Section 5.
Some information about fares and donations was gathered from CT groups surveyed for this
project which indicated that these groups raised about 20% of their income ‘through the
fare box.’ It is estimated that the total income from this source across NSW could be about
$5 million. This project was unable to obtain information about funding for health related
transport by local governments or the Department of Veterans’ Affairs.
HACC clients
Most funding for CT is provided by the HACC program. This program aims to prevent
inappropriate or premature admission to residential care by providing a range of community
support services, including transport, to frail older people, younger people with a disability
and their carers. The Department of Ageing, Disability and Home Care estimates that the
HACC target population in NSW is just over 558,500 people.6 However, being eligible for the
program does not guarantee a service.7
A significant proportion of HACC funding is used to transport HACC clients to health
appointments. As stated above, delivery of health transport can be comparatively resource
intensive, relative to other forms of transport. For example in one eastern Sydney community
transport provider survey paid administration hours were spent on health transport than other
transport (59% and 41% respectively, which reflects the labour- intensive nature of organising
individual trips). In the one group that used volunteer administrators, 74% of their time was
spent organising health related transport.8 Strong demand and the relative resource intensity
of health transport services will compromise the ability of community transport providers to
respond to other community needs.
Clients of other funding programs
Some groups also receive other funding from the Ministry of Transport through the Community
Transport Program (aimed at addressing transport disadvantage at the local level by primarily
facilitating efficient use of transport resources that exist within the community) and the
Area Assistance Scheme (which facilitates and supports community development and the
integrated provision of services in regions undergoing rapid urban growth or change).9
In some areas, such as North Sydney, South Sydney and Leichhardt, local councils fund
shuttle bus services which may be used to access health facilities among other destinations.
These services are open to all residents.
No Transport No Treatment 152.3. Health transport policy in NSW
In 2001, the NSW Health Department commissioned a report on non-emergency health
related transport.33 The report recommended the establishment of Health Transport Units
within each Area Health Service and Health Transport Networks in each area. Most of the
report recommendations were incorporated into a new model for non-emergency transport
called Transport for Health. This model became a policy directive of the Department in August
2006, which means that its implementation by every Area Health Service in the State is
mandatory.10
One effect of the policy directive is to amalgamate a number of separate funding programs
for non-emergency health related transport into one, called Transport for Health. It includes
the following former programs:
• The Isolated Patients Travel and Accommodation Assistance Scheme (IPTAAS)
• The Health Related Transport Program
• Inter-facility transport (non-Ambulance)
• Statewide Infant Screening-Hearing Program
• Services funded under the former Transport for Health Program.
The Transport for Health program aimed at supporting Area Health Services to be more
strategic in identifying, consolidating and integrating a full range of transport services and
resources to increase effectiveness and reduce duplication. Furthermore it promoted the use
of a mobility management approach to non-emergency transport by all Area Health Services,
through coordination between the appointments system and transport service providers, the
encouragement of closer cooperation and the development of partnerships with external
service providers such as the community transport industry.
There is funding available specifically for health related transport through the Transport for
Health Program. Eligibility for support under this program is wider than for HACC.
Transport for Health (non-emergency health related transport) services are
to be provided on the basis of a patient’s inability to reasonably gain access
to local health services by either public or private transport, rather than
inconvenience.10
In practice passengers whose trips are subsidised by Transport for Health in rural areas are
taken to regional and Sydney-based health facilities as well as local facilities. As with the
HACC program, Transport for Health is based on eligibility rather than entitlement. Priority
should be given to requests for assistance that will have the effect of preventing the
development of a medical condition or reducing the chance of an existing health condition
becoming more severe.
Non-emergency services provided by the NSW Ambulance Service do not form part of the
Transport for Health program. One of the aims of the Transport for Health policy is to transfer
some of the responsibility for Non Emergency Health Related transport from the Ambulance
Service of NSW to the Transport for Health Program.
However, as NCOSS has pointed out:
A significant injection of funds will be required by the NSW Government
into Transport for Health and other programs to replace the current NEHRT
services provided by the NSW Ambulance Service.11
Whether these funds will be made available and whether the policy will affect the demand or
supply of CT is yet to be seen.
16 No Transport No Treatment2.4. The NSW Government State Plan
There is a policy context for improving access to health services, as described in A New
Direction for NSW: State Plan.12 The NSW Government have made commitments to healthy
communities through improving access to quality health care, improving survival rates and
quality of care for people with chronic illness, and fairness and opportunity through improved
health outcomes for Aboriginal people. These priorities correlate with improved transport
to health treatment. Health transport improvements also link strongly to other priorities in
the NSW State Plan, including reduced avoidable hospital admission, improved outcomes in
mental health and increased participation for people with disability.
Chapter 5 provides an outline of how proposed solutions in this report relate to the NSW
State Plan.
2.5. Changing demands for health related transport
Over the past twenty years the provision of health related transport by CT groups has steadily
increased. This has been in response to a number of factors including regional demographic
shifts, and changes to health care service provision, transport policy and funding.
The impact of demographic change
Significant shifts in the demographic profile of regions within the state reflect two broad
social trends, namely:
• The ageing of the population, which involves an increasing proportion of the population
represented by people in older age groups, along with increasing life expectancy.
• Domestic migration, which involves shifts in residential location leading to declining
population in some regional areas and rapidly increasing populations in other areas.
Most notably has been a growth in the population of coastal areas, and a decline in
some inland regional areas.
The increasing numbers of people living beyond their eighties has meant that there more
older people who can no longer drive or use public transport. The lack of feasible transport
alternatives for older people has arguably resulted in increasing demand on CT providers,
particularly for transport areas that have not responded adequately in relation to the provision
of flexible and accessible services. Concern has been expressed both by the CT industry
and its funding organisations that, as the demand for health related transport grows, other
CT functions, such as for shopping and social activities, will be overtaken. This has particular
resonance as CT is an important means of addressing social isolation.
Other concerns regarding the ageing population have included the long-term sustainability of
using volunteer CT drivers for long journeys with passengers that are frailer and less mobile.
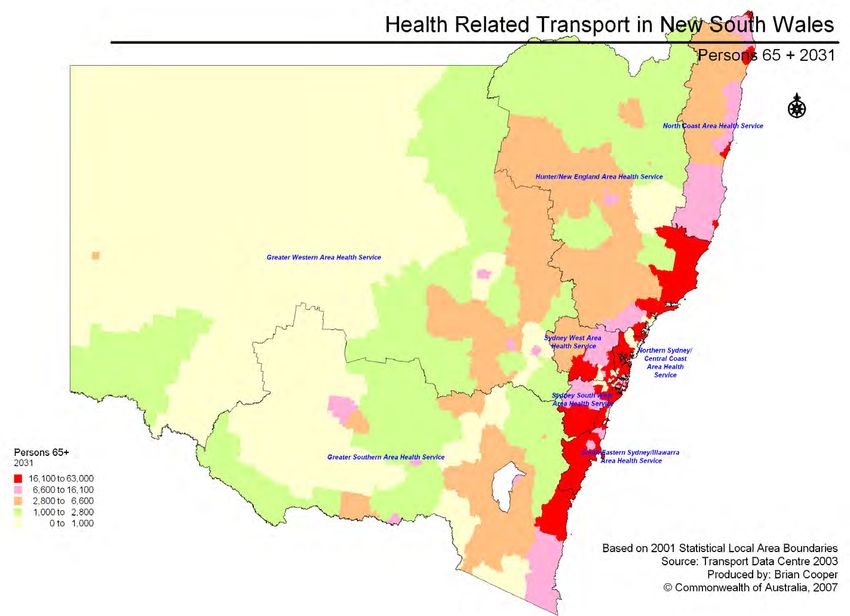
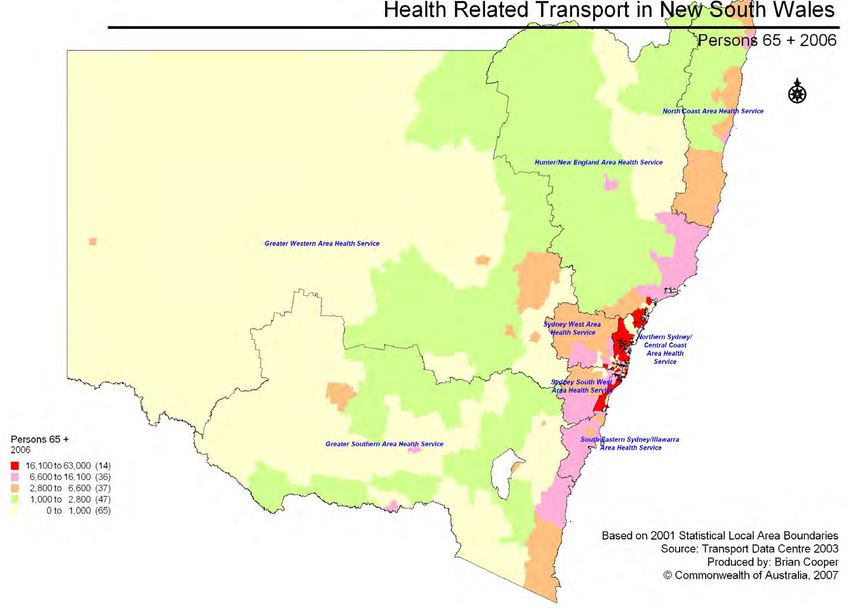
The projected growth in the proportion of older people in our population is illustrated in
Figures 1 and 2.
No Transport No Treatment 17Figure 1. Population aged over 65 years of age in NSW, 2006. 18 No Transport No Treatment
Figure 2. Projected population aged over 65 years in NSW, 2031

No Transport No Treatment
19
“For many       2.6. The impact of changes to health service provision
   people getting      Reform of health care services is an ongoing process for the NSW government, driven
                       by public demand for improved quality in health care as well as fiscal constraints. Broadly
      access to a      speaking, some important changes to the way health care is provided over the past decade
       doctor has      have had an impact on the demand for health related transport. These include the following:
  become a much
    more difficult     The concentration of services in fewer hospitals
                       For many conditions, services are now more safely and effectively treated in larger centres;
task than it might     smaller centres often do not have the capacity to support specialist practices. Concentrating
     have been in      health services in fewer hospitals frequently means people have to travel further to access
        the past.”     health care.1

                       A move to early discharge and increasing day-only surgery
                       Early discharge policies and the use of day-only surgery for treatment of a wider range
                       of conditions frequently means patients need more assistance upon discharge and while
                       travelling, making some forms of transport unsuitable, like driving themselves or catching public
                       transport. Again this has been noted in the House of Representatives Standing Committee on
                       Health and Ageing report, which argued that “early discharge, attendance as outpatients, day
                       treatment at doctors’ surgeries mean that older people must travel more frequently for health
                       care, often under circumstances when they require support while travelling.”2

                       Increased demand for health related transport has also been driven by an increase in the
                       number of procedures that can be undertaken on a day-only basis and the location of diagnostic
                       and specialist health services in larger centres as technology develops.3

                       A reduction in home visits by doctors.
                       There is evidence that GPs are making fewer home visits, necessitating travel to doctors’
                       surgeries by people who may not have private transport or the ability to use regular public
                       transport services. According to Medicare statistics, the number of home visits made by GPs
                       (mainly to elderly females) fell by 40% from 1.76 million to 1.05 million, nationwide between
                       2001 and 2006.4

                       The role of the NSW Ambulance Service
                       A change in the role of the NSW Ambulance Service has also increased unmet demand for
                       health related transport. In the early 1980s, the primary formal service provider of health
                       related transport was the NSW Ambulance Service which was providing about 600,000 non-
                       emergency trips per year at the time. Alterations to the Ambulance Transport Guidelines in the
                       mid-1980s, from recommendations contained in a Ministerial Inquiry into the NSW Ambulance
                       Service (the Gleeson Report),5 resulted in the number of non-emergency trips provided by the
                       Ambulance service dropping by over 450,000 trips – a reduction of approximately 75%.6
                       These factors have increased the importance of facilitating transport to health services.
                       Arguably, the changes in the way health services are delivered have placed an increasing
                       importance of transport being considered as a key component of the health system. One
                       medical practitioner has described transport as a form of health service because of its critical
                       role in getting people to the health service they require:
                                You bring people to the doctor; you do not necessarily bring the doctor to the
                                people. It is cheaper, so transport is actually a health service provision.7

              20     No Transport No Treatment
2.7. Regional differences in health and transport
Consideration of geographic variations in disease incidence and mortality are important for
planning health services, addressing responsible lifestyle and environmental factors, and
setting priorities for screening and other early-detection initiatives. Across Australia, people
living in rural and remote areas generally have worse health than those living in cities.8 Reasons
for this include geographic isolation, socioeconomic disadvantage, shortage of health care
providers, lower levels of access to health services, greater exposure to injury risks, and
poor health among Aboriginal people. According to NSW Health almost one quarter of people
living in rural or regional areas will face difficulty accessing health care when they need it.9
Both urban and non-urban areas have issues with health-related transport, but with different
underlying causes. In rural areas, the long distances to health care services, particularly
specialist services, cause major difficulties in the provision of health related transport
compared to metropolitan areas.
A report by the NSW Premier’s Department in 1999 suggested that in rural areas vehicle
resources may be underutilised while the transport needs of the wider community remain
unmet.10 For example, in rural areas, school bus services, which are often the only public
transport, run at restricted times and not during school holidays. This view was echoed by
another researcher of the time:
Guidelines for funding programs tend to be narrow, prescriptive and focused
on a particular target group. Service provision based on strict program
guidelines becomes increasingly unviable in small rural communities.11
Problems in health-related transport faced in metropolitan areas, particularly the inner city,
include that the supply of volunteer drivers is decreasing although the demand for health
related transport is burgeoning. One major service has recently closed its doors to all new
referrals yet requests for services continue to rise.12
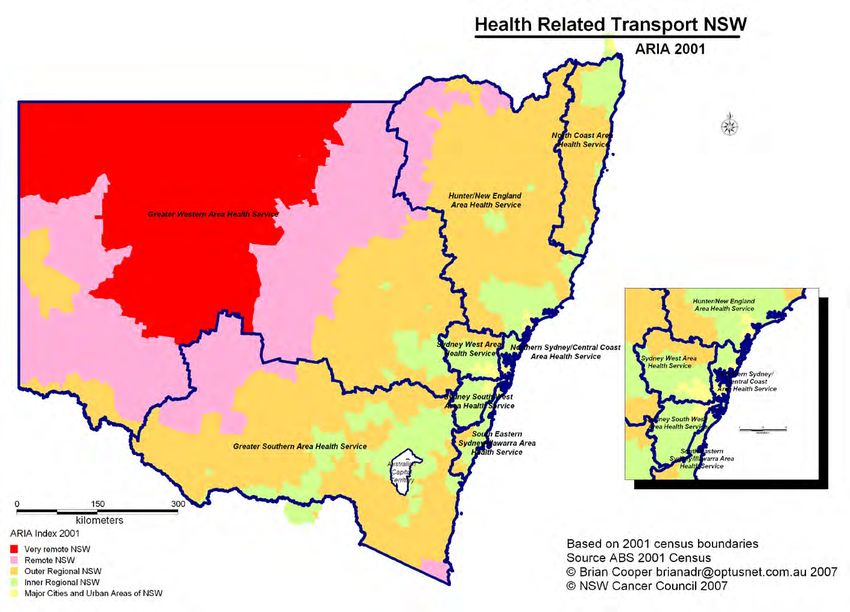
No Transport No Treatment 21Figure 3. ARIA index map of NSW 22 No Transport No Treatment
2.8. Regional differences in cancer incidence and treatment
In Australia, one in two men and one in three women are expected to be diagnosed with
cancer before the age of 85 years.1 As the population ages the incidence of cancer increases,
so more than half of all cancers are diagnosed in those aged 65 years and over. Cancer
accounts for 29% of all deaths in Australia.2

In NSW, there were 34,092 new cases of cancer in 2004, affecting 19,160 males and 14,932
females. The most common cancers were prostate, colorectal, breast melanoma and lung.
Together these accounted for 60% of all cancers.25

Geographical variations have been observed in the incidence, treatment, mortality and survival
of particular types of cancer by region. As noted in a previous NSW Cancer Institute report on
cancer in New South Wales:
         Sometimes geographic variations in mortality reflect underlying incidence patterns,
         whereas on other occasions, they are influenced by differences in treatment
         outcomes or differences in quality of care. 25

For example, the mortality rate from all cancers including prostate is significantly higher in
the Hunter New England region, although the incidence of these cancers is the same or
lower than that of the rest of NSW. Lower rates of screening tests and prostatectomy were
found to contribute to the 21% excess mortality from prostate cancer in regional and rural
areas compared to metropolitan areas across Australia.3 Lung cancer mortality rates are
significantly higher in the Sydney South West Area Health Service region, however this could
be influenced by the high incidence of these type of cancers in this area.25 The observed
variation in survival after diagnosis of colorectal cancer between Area Health Service regions
was concluded to be a function of differences in cancer treatment in another large population-
based study.4

A nation-wide assessment of cancer services which surveyed oncologists, chemotherapy
nurses and other staff in regional hospitals which administer chemotherapy, found that 65%
of respondents indicated that travel support was a problem for rural and regional patients.5
Another study, which adjusted for differences in incidence across geographic areas, found that
people living in remote NSW diagnosed with cancer were 35% more likely to die as a result
of their cancer within five years of diagnosis, compared to people living in metropolitan or
inner regional areas.6 Problems with accessing health care caused by a shortage of healthcare
providers and poor transport links also contribute to the poorer survival rates in rural and
regional areas. 26,30

Geographic differences are compounded by low socio-economic status. Individuals of low
socioeconomic status generally have a higher risk of avoidable death, and a higher number
of ambulatory care hospitalisations,20 both indications of poorer access to preventative
health treatment.

Providing transport to health services for cancer treatment presents particular logistical
and care challenges for transport providers compared to most other health related trips.
Chemotherapy and radiology treatments involve an intensive period of treatments requiring
trips to hospital three times per week for several weeks. People undergoing chemotherapy
or radiology treatment are often very ill following treatment and require specialised care and
support. Transport providers may therefore require specialised training to cater to people
who have undergone cancer treatments. The difficulties experienced in accessing treatment
for cancer and other health conditions, including those relating to transport to treatment
centres, need to be considered as part of the quality and distribution of health care available
across the state.

                                                                            No Transport No Treatment   23
2.9. Indigenous people and health related transport
The most disadvantaged population group in terms of health status are Aboriginal people.7
On average, the life expectancy of an Aboriginal person is seventeen years shorter than other
Australians. Aboriginal people comprise almost one-third of the population of very remote
areas in NSW. Remoteness has a negative effect on health outcomes. Compared with people
who live in major cities, people who live in remote or very remote areas:
“43% of people
in NSW over the • Have a life expectancy of 4 fewer years in remote areas and 11 fewer years in very
age of 60 years remote areas
• Are more likely to die prematurely, and from causes classified as avoidable
needed assistance • Report greater difficulties in getting health care when they need it
with transport.” • Are more likely to be hospitalised for conditions for which hospitalisation can be
avoided through prevention and early management.20
It is likely that inadequate access to transport to health treatment is a key factor in poor
health outcomes for Aboriginal and Torres Strait Islander people in NSW. Issues of access to
transport are discussed in more detail in Chapter Four.
2.10. Research on health related transport needs
Several government reports from Australia and overseas have highlighted that the transport
needs of the community are not being met. These reports are summarised below.
Australia’s Welfare (AIHW)
The Australian Institute of Health and Welfare reported that transport is the area with the
highest proportion of older people reporting that their need for assistance was completely
unmet (11%). The Institute also noted that such figures “do not tell the full story” as those
persons receiving some assistance may not be having their needs fully met.31
Survey of Disability, Ageing and Carers (ABS)
The ABS 2003 Survey of Disability, Ageing and Carers showed that 182,800 people (43%) in
NSW over the age of 60 years needed assistance with transport. The percentage was lower
among the 60 - 64 year age group but neared 50% for those over 75 years.8 Of these, 43,000
people had their needs partly met or not met at all.
Assistance was provided either formally (by funded services) or informally (by family or friends).
According to the survey most assistance was overwhelmingly provided by informal providers
(145,400 people compared to only 21,000 receiving assistance from formal providers). Of
these about 30,000 were male partners, 20,000 female partners and 100,000 other relatives
or friends. Significantly, 25,000 people did not receive the assistance they needed.32
Other Australian Evidence
The 2001 non-emergency health related transport report9 reported that according to a survey
of patients, 20% indicated that they had difficulty getting to or from health facilities in the
three months prior to the survey.
In 2007, the Royal Automobile Club of Victoria undertook a survey of 100 recently retired
drivers. The results showed that 5% of them do not visit the doctor or hospital and 31%
found it hard to do so.10 It also appeared from this study and another undertaken in 199911 that
difficulties in getting to health facilities is not just a rural phenomenon and that city people can
experience as much difficulty getting to health facilities as people living in the country.
24 No Transport No TreatmentInterstate and overseas evidence
There is emerging evidence from the United Kingdom that there may be a strong link
between transport and the non-attendance of hospital appointments. The researchers, from
the Transport Studies Department of the University of East London claimed that missed
hospital appointments are a problem costing the National Health Service millions of pounds
each year. It has been reported that people failing to turn up for appointments costs the NHS
in the region of £300 million ($A750 million) per year.12
The UK researchers also said that missed appointments are evident across all areas and
although health professionals tend to consider apathy the main cause, the reasons for non-
attendance can be masked by other issues such as childcare responsibilities and poor weather
and that transport rather than apathy was a significant factor.13
Another UK research report found that 31% of non-drivers and 17% of those with a car have
problems getting to their local hospital. Over 1.4 million people said that they had missed,
turned down or chose not to seek medical help during the previous 12 months because of
transport problems.14
In the USA, participants in a survey of 100 families in Ohio with a history of missed appointments
said that transport problems were a barrier to getting to appointments.15 Evidence from the
United States suggests that longer driving distances from home to treatment services is
associated with poorer glycaemic control in diabetes.16
Transport to therapy services
Previous studies have found that providing services to transport people to therapy services,
such as cancer therapy and physiotherapy, appears to be particularly difficult for some CT
groups. Therapy transport is a big commitment for CT providers, “an incredible strain” as one
stakeholder put it. People need to get to city hospitals from the urban fringe for services such
as oncology. Getting to Penrith from the Hawkesbury was described as “a disaster” by one
interviewee.17
Other groups appear to select which treatments they will take passengers to. The Cancer
Council has described some the problems this can have for patients:
Just recently we had a very distressed woman ring the office trying to find a
way to get to her radiotherapy for 6 weeks. She was feeling too sick to make
the trek of bus, train and then walk to the centre from the station etc and
was acutely anxious about possibly missing her treatment because of this
and money for transport was also an issue. Our staff spent quite some time
contacting Health, community transport and other agencies, without any
luck, even though there was some understanding from the Health Transport
Unit, but community transport (in this area) were not able to transport anyone
who needs treatment.18
There has also been a suggestion that some CT groups do not see therapy services as health
related transport at all:
Some therapy services such as hydrotherapy and physiotherapy are not seen
as medical transport by some CT providers and the people miss out. This
can delay their recovery. People have to depend on friends and relatives or
church voluntary driver.41
While there is little research in Australia on the association between transport, access to
health services and health outcomes to draw direct conclusions from, the poorer health of
people living in rural and remote areas, along with fewer health services in these regions,
suggests that transport may be an important.
No Transport No Treatment 25You can also read