Indiana State Health Assessment and Improvement Plan - May 2018 - December 2021 - IN.gov
←
→
Page content transcription
If your browser does not render page correctly, please read the page content below

Indiana State
Health Assessment
and Improvement Plan

May 2018 - December 2021

2           Indiana State Health Assessment and      Improvement Plan                                                               2018 - 2021

Contents
LETTER FROM THE STATE HEALTH COMMISSIONER                                     5
EXECUTIVE SUMMARY 6
INDIANA STATE HEALTH ASSESSMENT 10
    I ntro d u c t i on a n d P roc e ss     10
           Va lu e s 10
    Key co m p on e nt s of t h e S tate He alth A sse ssme nt                12
           Co m m u n it y h e alt h stat u s a ssessm ent 1 2
           Review o f state a ge n c y p l a n s          12
           Ass e s s m e nt o f as s e s s m e nts     12
    Id ent i f yin g p re lim in a r y p rior i ti e s    13
    Co mmu n i t y e n ga ge m e nt        14
           Pu b lic H e alt h Syste m Fo rce s o f C h a n ge a n d SWOT a n a l ysi s       17
SELECTION OF PRIORITY INDICATORS                         18
INDIANA BY THE NUMBERS 21
           Te n Le ad in g Cau s e s o f H e a l th a n d A ge - A d ju ste d M o r ta l i t y by R a ce a nd Ethni ci ty ( 2016)     21
SOCIAL DETERMINANTS OF HEALTH                          22
           Povert y      23
           Acc e s s to Care     24
REDUCE CHRONIC DISEASE AND HEALTH DISPARITIES                                      26
           O b es it y  26
           Hea lt hy Fo o d s an d B eve ra ges        29
2018 - 2021                                                               Indiana State Health Assessment   and Improvement Plan   3

       Physical A c t ivit y     29
       Tobac co U s e        30
       Chronic Dis e a s e P revale n c e a n d M o r ta l i t y     32
IMPROVE BIRTH OUTCOMES 34
REDUCE INJURY AND DEATH DUE TO OPIOID EXPOSURE                                            36
PART 2: INDIANA STATE HEALTH IMPROVEMENT PLAN                                             38
       Approac h to id ent if yin g f lag sh i p p r i o r i ti es 3 8
       Goals an d O b j e c t ives fo r Fla g sh i p P r i o r i t i es 4 0
       M aking t h e ISH IP h ap p e n 6 3
       Trac king a n d eva lu at io n     64
GLOSSARY              65
APPENDIX              68
       SWOT/ Forc e of C h a n ge               68
       Fo rc es of C h a n ge         72
       A sset M a p              74
Key i nfor mant inte r v iew q u e st io n n ai re         76
       Sc r ipt fo r i nte r v i ew        79
P ro cess Fl owc h a rt fo r t h e S tate H e al th A s s e s s m e nt an d Im p rove me nt P lan       81
Co mmi ttee M e m b e rs        82
REFERENCES 85
4 Indiana State Health Assessment and Improvement Plan 2018 - 2021

2018 - 2021                                                                               Indiana State Health Assessment     and Improvement Plan   5

Letter from the State Health Commissioner
Dear colleagues:
It is with great pleasure that I present Indiana’s    “Implementing the SHIP will require an
State Health Assessment (SHA) and State Health        alignment of efforts throughout Indiana,
Improvement Plan (SHIP). Over the past year, Indi-    using the data gathered in this assess-
ana State Department of Health staff, in conjunc-
                                                      ment to start the process and measure
tion with partners from across the state, gathered
epidemiological data and key informant inter-         success.”
views to paint a picture of the health of Indiana’s
residents. The findings from our State Health As-
sessment highlight many significant challenges.       In addition, we recognize in this SHA and SHIP the importance
However, the SHA also revealed many assets and        of the social determinants of health, as well as the disparate
positive changes in communities across Indiana.       impacts that poor health has on certain populations. The 2018-
                                                      2021 SHIP also seeks to improve the infrastructure of the public
These data informed the development of the State      health system in Indiana.
Health Improvement Plan, which provides strate-
gies and objectives for improving Indiana’s health    Implementing the SHIP will require an alignment of efforts
over the next three-and-a-half years. Themes from     throughout Indiana, using the data gathered in this assessment
previous plans, such as reducing chronic disease      to start the process and measure success. I want to sincerely
and infant mortality, have been carried forward to    thank all the partners and stakeholders across Indiana who
this new iteration, while emerging public health      contributed to this report and ask for your continued engage-
threats such as the opioid epidemic are new.          ment in the future.

                                                                                                                         KRISTINA BOX, MD, FACOG
                                                      Yours in health,

                                                      Kris Box, MD, FACOG
                                                      State Health Commissioner
6                   Indiana State Health        Assessment and Improvement Plan                                                    2018 - 2021

Executive Summary
In 2017, the Indiana State Department of Health (ISDH) began the process of
revising the State Health Assessment and State Health Improvement Plan.
This process, conducted in collaboration with over 100 partner organiza-
tions, key informants, and subject matter experts, sought to identify and ad-
dress Indiana’s greatest health challenges.

                                                                                5
The 2018 Indiana State Health Assessment (SHA) provides an overview of the
                                                                                    THE SHA INVOLVED FIVE STEPS:
health and social wellbeing of Hoosiers and the issues impacting the public         Community health status assessment
health system. Conducting this assessment provides a better and deeper
                                                                                    Assessment of prior assessments
understanding of the current health and quality of life of Hoosiers, as well
as the many influences on health, including physical, mental, emotional, and
                                                                                    Review of other agency and coalition plans
social factors. This assessment provides the foundation for the Indiana State
Health Improvement Plan (SHIP) which serves as a coordinated roadmap to             Key informant interviews/qualitative data gathering
improve the health of all Hoosiers.
                                                                                    Health need identif ication
2018 - 2021 Indiana State Health Assessment and Improvement Plan 7
8                             Indiana State Health         Assessment and Improvement Plan                                                           2018 - 2021

Indiana has stubbornly high rates of chronic disease, obesity, smoking, and infant mortality. Additionally, emerging
health threats, such as substance use disorders and resulting increases in HIV and hepatitis C, and are stretching
the resources of public health.

INDIANA IS RESPONDING TO THESE CRISES:

1           In 2011, the Indiana Perinatal Quality Improvement Collaborative
            was formed to help address the state’s high infant mortality rate.
                                                                                              8
                                                                                                  Indiana’s adult smoking prevalence has declined signif icant-
                                                                                                  ly f rom 25.6% in 2011,21.1% but it has not changed signif icantly
                                                                                                  since 20132.

2                                                                                             9
            In the 2018 legislative session, Indiana passed a bill requiring ISDH                 While e-cigarette use among Hoosier youth declined signif i-
            to establish a program to certify the perinatal levels of care avail-                 cantly between 2014 and 2016, e-cigarettes remain the most
            able at Indiana hospitals and birthing centers.                                       commonly used tobacco product among Hoosier youth3.

3           The Indiana State Department of Health and its partners were
            recognized for their multi-faceted response to an HIV epidemic in
            Indiana.
                                                                                             10
                                                                                                  In 2016, Indiana Governor Eric Holcomb made attacking
                                                                                                  the opioid epidemic a pillar of his governing f ramework
                                                                                                  and appointed a multi-agency commission to coordinate

4
                                                                                                  and hasten efforts. Initiatives include:
            In 2017 Indiana launched Liv, a health app that provides information
            for women who are pregnant, are planning to become pregnant, or
                                                                                                          o The OpenBeds platform which provides drug
            already pregnant.
                                                                                                          dependent individuals nearly real-time listing of

5           Indiana piloted, then codif ied, syringe service programs for counties                        facilities with available treatments slots, grouped

            with demonstrated high rates of hepatitis C or HIV.                                           by location, payment options, accepted health in
                                                                                                          surance, type of addiction and whether services
                                                                                                           are available for pregnant women or new mothers.

6
            Indiana piloted a study to better understand the number of in-
            fants being born with Neonatal Abstinence Syndrome.
                                                                                                          o ‘Know the O facts” awareness campaign and
                                                                                                          NextLevel Recovery website provides data and

7
                                                                                                          information about opioid use disorder.
            Indiana continues to implement the Indiana Tobacco Quit-
                                                                                                          http://www.in.gov/recovery/know-the-o/
            line, receiving 12,160 calls in 2017 1.

¹ (Indiana State Department of Health, 2016)
² (Behavioral Risk Factor Suveillance System, 2011-2016)
³ (Youth Tobacco Survey, 2012-2016)
2018 - 2021 Indiana State Health Assessment and Improvement Plan 9

10                   Indiana State Health          Assessment and Improvement Plan                                                                       2018 - 2021

Indiana State Health Assessment
Introduction and Process                                                                  VALUES
                                                                                              THE IHIP RECOGNIZED THESE VALUES TO INFORM
The Indiana State Health Assessment (SHA) takes a comprehensive look at the
                                                                                              THEIR WORK:
health of Hoosiers by presenting data on demographics, socioeconomic character-
istics, quality of life, and health behaviors, built environment, morbidity, mortality,
and other indicators of health status.
                                                                                          1   Health Equity: Indiana will be healthier by understanding the
                                                                                              strength and need of diverse populations, by addressing the under-
                                                                                              lying social determinants of health, and by ensuring that opportuni-
To begin this process, ISDH convened an advisory group of more than 100 stakehold-
                                                                                              ties to achieve optimum health are available to all Hoosiers.
ers to guide SHA and SHIP development. This group, the Indiana Health Improve-
ment Partnership (IHIP), met three times during 2017 and early 2018 to develop key
components of the SHA including values, forces of change analysis, and assessment
                                                                                          2   Effectiveness: Indiana will focus on evidence-based strategies to
                                                                                              positively impact health outcomes, while also fostering innovation
of strengths, weaknesses, opportunities, and threats (SWOT). In addition, the IHIP
                                                                                              and promoting excellence.
served as a sounding board for continuous feedback and connections to subject

                                                                                          3
matter experts. Members of the advisory group were invited to join a smaller, more
                                                                                              Integrity: Indiana will strive to achieve the best public health out-
nimble steering committee. The steering committee, over a course of three addi-
                                                                                              comes through honesty, trustworthiness, and transparency in all we
tional meetings, directed the selection of priority indicators, assisted in developing
qualitative data collection, and identified key informants for interviewing.                  do.

To help navigate the SHA, the IHIP followed a modified version of the Mobilizing          4   Respect: Indiana will respect and value all individuals for their di-

for Action through Planning and Partnerships (MAPP) Framework. This community-                verse backgrounds, cultures, and communities.
driven framework assists communities in navigating the process by which systems,
policies, and environments are assessed, threats and weaknesses are identified,
and key strengths and opportunities are leveraged. This methodology was used to
identify key priorities and strategies to alleviate the most pressing health challenges
of the state.
2018 - 2021 Indiana State Health Assessment and Improvement Plan 11
12                  Indiana State Health Assessment and                Improvement Plan                                                                             2018 - 2021

Key Components of the State Health Assessment
The SHA was conducted using a multi-pronged approach including: com-                3. ASSESSMENT OF ASSESSMENTS
munity health status assessment, assessment of previous assessments,                A small team from ISDH conducted an environmental scan to collect existing commu-
review of existing agency plans, community engagement/key informant                 nity health needs assessments (CHA), primarily from Indiana hospitals and local health
interviews, SWOT assessment, and forces of change analysis.                         departments. Assessments were included if they met the regulatory requirements for
                                                                                    the IRS rules regarding Charitable 501(c)(3) Hospitals, they were less than three years
                                                                                    old, and they included primary data collection. More than 100 assessments were re-
1. COMMUNITY HEALTH STATUS ASSESSMENT
                                                                                    viewed, representing populations from all 92 Indiana counties. The identified priority
In the spring of 2017, ISDH compiled a list of indicators assembled from a vari-
                                                                                    health needs were recorded and coded into an Excel spreadsheet.
ety of sources including: Healthy People 2020 Leading Health Indicators, County
Health Rankings, most commonly requested indicators from the Centers for Dis-
ease Control and Prevention (CDC), as well as other internal datasets and regis-
tries such as birth/death data, National Violent Death Reporting System (NVRDS),                          THE TOP TEN IDENTIFIED PRIORITIES OF

                                                                                    1
Indiana Trauma Registry, and Indiana Stats Explorer. These data were pulled by                            THE LOCAL CHAs INCLUDED:
the epidemiologists at ISDH. The IHIP steering committee reviewed and analyzed
                                                                                                           Access to care
over 90 variables to reflect the spectrum of health indicators deemed important
by the public health system. The chosen priority indicators are described further                          Mental and behavioral health
in this document with descriptive analysis.
                                                                                                           Obesity

                                                                                    0
2. REVIEW OF STATE AGENCY PLANS                                                                            Substance abuse disorders
A team from ISDH met with subject matter experts to review objectives and strat-
egies to improve the health of Hoosiers. A review of planning documents from                               Nutrition and physical activity
other state agencies was helpful in understanding the initiatives and strategies
                                                                                                           Diabetes
already being conducted or planned for the near future. A concerted effort was
made to ensure that the data, activities, and strategies in this SHA and SHIP are                          Tobacco use
aligned with other local, state, and national improvement efforts. The top ten
                                                                                                           Heart diseasse
identified priorities of the local CHAs included:

                                                                                                           Cancer

                                                                                                           Maternal and infant health
2018 - 2021 Indiana State Health Assessment and Improvement Plan 13
Identifying Preliminary Priorities
Following the review of more than 200 existing documents (assessment of assessments and review of other agency plans), over 100 variables, and speaking
with subject matter experts, findings were summarized and presented to the IHIP steering committee for initial prioritization.
Priorities f rom this process included:
Social determinants of health and health equity
Improving public health inf rastructure (funding and culture/quality of public health practice)
Improving health and reducing health disparities
a. Chronic disease
b. Birth outcomes/infant mortality
c. Reduced injury and death due to opioid exposure
c. Improved access to mental health services14 Indiana State Health Assessment and Improvement Plan 2018 - 2021
Community Engagement
Another key component of the SHA was the engagement of a broad range of community stakeholders. Subject matter experts from the preliminary
topic areas were consulted to better understand what data best described the health status of Hoosiers.
The goals of the community engagement component of the SHA included:
1. Identify barriers and assets that hinder or aid Indiana’s most vulnerable residents in their quest to achieve optimal health.
2. Better understand the needs of service providers in communities that serve disparate populations.
The IHIP steering committee approved the data collection purpose and technique, and partners at Indiana University Kokomo designed the data col-
lection tool (see appendix). Over 60 key informants were interviewed from a wide range of stakeholders. The compilation of the interviews helped
determine the health factors and foundational issues identified in this SHA.
Key informants were chosen based on four factors:
1. The population they serve has known health disparities.
2. Little information describing the health of the population they serve was available.
3. The community organization/service had a regional or statewide reach.
4. The key informant could speak to health issues of known concern.
Nearly a third of local health departments from around Indiana provided input, as well as scores of other services providers representing a wide
range of stakeholders across the state. These included: Area Agencies on Aging; WIC; 2-1-1; Anthem; United Way; Purdue Extension; fire depart-
ments; mayors’ offices; Boys & Girls Club; among many others.2018 - 2021 Indiana State Health Assessment and Improvement Plan 15 Summary of primary data: Nearly a third of local health departments throughout Indiana provided input, as well as many other service providers representing a wide range of stakeholders across the state. These included: Area Agencies on Aging; WIC; 2-1-1; Anthem; United Way; Purdue University Extension; fire depart- ments; mayors’ offices; and Boys & Girls Clubs, among many others. When asked “What strengthens your population’s ability to achieve optimal health?”, informants indicated having strong partnerships, access to evidence-based programming in the community, cultural diversity, access to social and addiction services, health education in schools, and access to workforce development opportunities as important positive features. When asked about barriers, key informants indicated low staffing levels, low funding levels, being able to break cultural barriers, increases in drug use, poverty and apathy, lack of free clinics, unaffordable healthcare and medications, lack of available affordable housing, provider billing, and limited local resources as major themes. When asked about potential solutions, key informants shared a wide range of ideas including: expanding home visiting to all new mothers; more fund- ing to local public health partners (and less to state and federal), stronger partnerships between 2-1-1, state, and local partners; focus on prevention and education; better communication between partners; mandatory INSPECT usage, change in reimbursement model for EMS transportation to pro- vider, promoting trauma-informed-care, and healthier food options for children.
16                             Indiana State Health Assessment and                    Improvement Plan                                                            2018 - 2021

Community Engagement
Key informant interview transcripts were also coded to help identify which conditions in the environment that affect a broad range of health and quality
of life outcomes4, otherwise known as social determinants of health, were mentioned and at what frequency.

                                            Frequency of SDOH Named During Key Informant Interviews----Indiana, 2017
          40
                                                                     34
          35
          30
          25
          20                        17                                                                                             18
          15
          10                                                                                 8                                                              7
                                                                                                               3
           5
           0
                       Neighborhood & Built                 Health and Healthcare   Social and Community   Education       Economic stability              Food
                           environment:                                                     Context

(Office of Disease Prevention and Health Promotion, n.d.)
4
2018 - 2021 Indiana State Health Assessment and Improvement Plan 17 Public Health System Forces of Change and SWOT analysis In May of 2017, the IHIP advisory committee participated in a SWOT and forces of change analysis. The SWOT analysis allowed participants to identify strengths and weaknesses (internal to the public health system), and threats and opportunities (external to the public health system) that have a potential to affect the future of the public health system. The force of change assessment is designed to help identify trends, factors, and events that are influencing, or could influence the health and quality of life of the community. A full compilation of the SWOT and forces of change responses is in the appendix. The results are summarized below:
18                    Indiana State Health      Assessment and Improvement Plan                                                                2018 - 2021

Selection of Priority Indicators
After completing an exhaustive review of both the primary and secondary data, a discrete set of indicators was cho-
sen by the small group steering committee to best convey the current state of health in Indiana. From these data,
pressing health issues emerge as priorities.

Criteria for choosing the final priority health issues included:

     1. Magnitude:                                                                                                    4. Health equity:

     Does the health indicator measure                                                                                Does the health indicator measure
     health issues that affect a large                                                                                issues that disproportionately af-
     proportion of the population?                                                                                    fect population subgroups?

     2. Seriousness:
                                                                               PRIMARY                                5. Social determinant:

     Does the health indicator reflect
                                                                           INDICATORS                                 Does the issue affect multiple
     health issues with high severity,                                                                                health outcomes?
     such as high mortality or morbidity
     rate?

     3. Ability to change:                                                                                            6. Availability of data:

     Does the health indicator measure                                                                                Is there data available to measure,
     health issues that are feasible to                                                                               track, and compare to other states?
     change? Are other groups able to
     provide resources?
2018 - 2021 Indiana State Health Assessment and Improvement Plan 19
1
DATA INDICATED THESE PRIORITY
Emphasizing social determinants of health—
HEALTH ISSUES:
specif ically access to health care
These priority health issue data resonated with the IHIP
steering committee, State Department of Health stakehold-
2
ers, health coalitions, key informants, subject matter ex-
perts and broader planning council and stakeholder group.
In order to provide the opportunity for the public to com-
ments on the chosen indicators, a link to the data points Enhancing the public health inf rastructure—the
was posted to ISDH website, broadcast via Twitter and Face- quality and culture of health
book, and distributed by partners’ to multiple listservs. On
social media, the link to the indicators reached over 1500
3
users. In addition, 65 individuals provided comment via an
online survey tool, the majority indicating they ‘agree’ or
‘strongly agree’ with findings the of IHIP. Comments from
the online engagement suggested more emphasis on social Improving health outcomes and reducing health
determinants of health data as well as consideration for be- disparities
havioral health.
a. Reduce rates of chronic disease
After priority topics were identified, subject matter groups
were formed in order to examine applicable data points.
b. Address the opioid epidemic
Reviewing indicators from other state plans, Healthy People c. Improve birth outcomes and reduce infant mortality
2020, strategic plans, and other sources allowed the group
to narrow down the indicators described in this report.20 Indiana State Health Assessment and Improvement Plan 2018 - 2021
2018 - 2021 Indiana State Health Assessment and Improvement Plan 21
Indiana by the Numbers
Top&Ten&Leading&Causes&of&Death&by&Race&and&Ethnicity&in&2016
Between 2010 and 2016, the population of Indiana grew by 2.3% Number&of&Deaths&|&Age]Adjusted&Rate&per&100,000&population
to 6.6 million. By 2020, the population of Indiana is expected to
Rank Black Hispanic White
exceed 6.8 million.
Heart&Disease Cancer Heart&Disease
1
P 1,102 |&213.0 185 |&88.9 12,730 |&178.5
P Preschool: 6%
O C
C College Age: 10%
Sn Seniors: 15% 2 Cancer Heart&Disease Cancer
Sn 1,049 |&195.3 164 |&91.5 12,252 |&171.7
Sc School Age: 17%
Y Young Adult: 25%
Chronic&Lower&Respiratory&
O Older Adult: 26% Unintentional&injuries Unintentional&injuries
3 Disease
Y Sc 312 |&47.7 82 |&20.2
4,002 |&56.1
Diabetes&mellitus& Stroke Unintentional&injuries
4
268 |&51.1 38 |&22.1 3,115 |&52.3
O
B
O Other: 5%
Homicide Diabetes&mellitus Stroke
B Black: 10% 5
263 |&36.0 37 |&20.6 2,764 |&38.7
W White: 86%
Stroke Homicide Alzheimer’s&disease
6
241 |&47.3 32 |&7.5 2,522 |&35.1
W
Chronic&Lower&Respiratory& Certain&Diseases&Originating&
Diabetes&mellitus
7 Disease in&the&Perinatal&Period
H 1,706 |&24.2
198 |&39.2 31 |&4.9
H Hispanic: 7% Chronic&Liver&Disease&and&
Kidney&disease Kidney&disease
8 Cirrhosis
N Non-Hispanic: 93% 173 |&34.2 1,215 |&17.1
29 |&11.7
Alzheimer’s&disease Alzheimer’s&disease Septicemia
9
141 |&33.1 27 |&18.5 1,097 |&15.5
N
10 Septicemia Kidney&Disease Suicide
100 |&19.3 27&|&16.2 944&|&16.1
Values&may¬&total&100%&due&to&rounding22 Indiana State Health Assessment and Improvement Plan 2018 - 2021
Framework
Social Determinants 9
SAN FRANCISCO FRAMEWORK FOR ASSESSING POPULATION HEALTH AND EQUITY
of Health UPSTREAM Root Causes DOWNSTREAM Consequences
According to Healthy People 2020, “Health starts in our homes, schools, workplac-
es, neighborhoods, and communities.” Social determinants of health (SDOH) are
conditions in the environment that affect a broad range of health and quality of life
outcomes.5 There are differences in the health of those living in communities with Belief Living Health Health
Systems Conditions Behaviors & Well-Being
poor SDOH, such as their ability to access safe housing, nutritious foods, transpor-
Cultural/ PHYSICAL ENVIRONMENT Nutrition QUALITY OF LIFE
tation, and environments free of toxins. As described in research, and discussed Societal Values Land Use Physical Activity FUNCTIONING
Discrimination/ Transportation Tobacco Use CLINICAL HEALTH
in Healthy People’s Public Health 3.0 a person’s ZIP code can be more of a health Stigma Housing Alcohol and Other Drugs Communicable Disease
Natural Environment Oral Health Chronic Disease
predictor than genetic code.6 In order to improve population health in Indiana, Sexual Health Injury
SOCIAL ENVIRONMENT
Preventive Care
the public health system must expand to include non-traditional partners such as Social Cohesion
Sleep
Mental Health
Safety
transportation, workforce development, and housing. 7 Several indicators related to
ECONOMIC ENVIRONMENT
SDOH, such as economic stability, education, environment, and social and commu- Educational Attainment
Employment
nity context, are presented below. Institutional
Income
Policies &
Practices Occupational Safety
Educational Attainment
SERVICE ENVIRONMENT Psychosocial
Public Policies Health Care Factors
Organizational Social Services
Practices Stress
Education
100 Lack of Control
12% No Diploma
Reactive Responding
Resilience Death
80
60
High School Community Health
64% Strategic Capacity Building Promotion &
INTERVENTIONS
Diploma Only Partnerships Prevention Medical
Community Care
Advocacy Organizing Civic Case
40 Engagement Management
20 EVIDENCE BASED POLICY MAKING
College
24%
Diploma Urban influences such as their environment, access
San Francisco Health Improvement Partnership to education,
Community Health and 2016 | 48
Needs Assessment Appendices
0 safety can have profound impacts on the ability to achieve optimal health.
⁵ (Office of Disease Prevention and Health Promotion, n.d.)
⁶ (Healthy People, 2017)
⁷ (Centers for Disease Control and Prevention, n.d.)
⁸ (Bay Area Regional Health Inequities Initiative)2018 - 2021 Indiana State Health Assessment and Improvement Plan 23
Poverty in Indiana
!"#$%&'()*&$+(,'(-%"./+ 41/3"'1$6&(A//"%&.62&2$+
-$*.$/%&%01$
A#$%*33 7B;$)>:.;
F2+/*625 21$%25*6
;923/*%&(0%"1(!*%$6&+ F".+$9"324 Indiana State Health Assessment and Improvement Plan 2018 - 2021
Access to Care
In reviewing data and listening to key inform- ties identified above. Those without insurance are often diag-
ants from around the state it is evident that not nosed at later, less treatable disease states than those with in-
all Hoosiers have the same opportunities to be surance and, overall, have worse health outcomes, lower quality
as healthy. As reflected in the assessment of the of life, and higher mortality rates.9
assessments, key informant interviews, and con-
firmed by quantitative data, an important social Indiana residents report different health status based on their
determinant for Indiana residents is the ability to location in the state. Mid-sized population areas report the low-
access affordable healthcare. est number of poor or fair health days, while rural areas report
the highest.
According to the Robert Wood Johnson Founda-
tion, access to care refers to having health insur- Indiana’s uninsured rate was 8.1% in 2016, down from 9.6% in
ance, local care options, and a usual source of 2015 and 11.4% in 2014. Indiana introduced the Healthy Indiana
care in communities. The uninsured are less likely Plan (HIP) 2.0—expanded insurance options for lower income
to have primary care providers than the insured; Hoosiers—in 2015. Approximately 20% of Indiana residents are
they also receive less preventive care, dental care, enrolled in Medicaid/Children’s Health Insurance Plan (CHIP).
chronic disease management, and behavioral Over 1.4 million Indiana residents are enrolled in Medicaid, and
health counseling, all of which impact the priori- more than 20,000 of those enrollees are pregnant.
Dental HPSA
Mental HPSA
Primary Care
HPSA or MUA
9
(Clancy C, 2013)
10
(Indiana University Public Policy Center, 2015)
11
(Indiana University Public Policy Center, 2016)2018 - 2021 Indiana State Health Assessment and Improvement Plan 25
Language barriers and cultural competency of services can be major obstacles to receiving healthcare or other social services. What we heard from Indiana
organizations providing services during key informant interviews:
“
“ […we have] a lack of Spanish speaking staff, limited resources in
the area, a big cultural gap that exists.
“
…getting information and translated into the different languages because
this is a very cultural[ly] diverse community. They have Amish, Mennonite,
“
Hispanics, Haitian, Burmese, and El Salvador.26 Indiana State Health Assessment and Improvement Plan 2018 - 2021
Reducing Chronic Disease and Health
Disparities
Chronic diseases are those illnesses and health conditions that have a prolonged impact on a person’s health. These include heart disease, diabetes, cancer, and
obesity. Chronic diseases are the leading causes of death and disability in Indiana, with heart disease, cancer, and stroke representing the top three killers for
Hoosiers. Many chronic diseases can be prevented or managed through early detection, improved nutrition, increased physical activity, and avoiding tobacco
use.12
Six of the top 10 concerns identified in the community health needs assessments (assessment of assessments) from around the state are chronic diseases
or factors related to chronic diseases. Select indicators describing the burden of chronic disease are described below.
For Every 100 Adults: 32 Are Obese 35 Are Overweight
Obesity
Indiana is the 10th most obese state in the U.S.
According to 2016 BRFSS data, over two-thirds (67.2%)
of Indiana adults are overweight (34.7%) or obese
(32.5%). Obesity disproportionately affects low-income
and rural communities, as well as the African American
population. Obesity rates have increased from 13.0% of
adult Hoosiers in 1990 to now nearly a third (32.5%) in
2016.
12
(Indiana State Department of Health, n.d.)2018 - 2021 Indiana State Health Assessment and Improvement Plan 27
A larger percentage of black, non-Hispanic adults were considered
to be obese compared to white, non-Hispanic and Hispanic adults.
Adults Youths
100 100
80 80
60 60
40 40
20 20
0 0
White Black Hispanic White Black Hispanic
% Overweight
% Obese
$3,500,000,000
According to one study obesity costs Indiana $3.5 billion
According to one study obesity costs Indiana $3.5 billion dollars a year in related medical costs;
dollars a year in related medical costs; over one-third of
over one-third of those costs are financed by Medicare and Medicaid.
those costs are financed by Medicare and Medicaid.13
13
(Trogdon, Finkelstein, Feagan, & Cohn, 2012)28 Indiana State Health Assessment and Improvement Plan 2018 - 2021
2018 - 2021                                                                                Indiana State Health Assessment               and Improvement Plan                           29

Healthy Foods and Beverages
Poor nutrition contributes to four out of the top ten causes of death in Indiana: cardiovascular disease, stroke, diabetes, and cancer. National recommendations from the US Department
of Agriculture encourage Americans to fill half their plate with fruits and vegetables or consume at least five servings per day. Many adults and children in Indiana are not consuming
even one fruit or vegetable serving per day. Eating a healthy, varied diet is crucial for chronic disease prevention, growth and development, and assuring an adequate variety of nutrients.

Physical Activity
Evidence indicates that a greater amount of moderate-to-vigorous physical activity helps individuals across the
lifespan maintain a healthy weight. Regular physical activity also reduces the risk for cancers of the breast, co-
lon, bladder, endometrium, esophagus, kidney, lung, and stomach. For individuals who already have a chronic
disease, regular physical activity can reduce the risk of developing a new chronic condition, reduce the risk of
progression of the condition they already have, and improve their quality of life and physical function 15.

The 2008 Physical Activity Guidelines recommend that adults should participate in 150 minutes of physical
activity a week. However, only 15.6% of adults in Indiana meet both the aerobic and muscle strengthening rec-
ommendations. According to the 2015 YRBS, just over a quarter (25.3%) of high school students achieved the
national recommendation of 60 minutes or more of physical activity per day.

 (Rose, 2010)
14

 (U.S. Department of Health and Human Services, 2008)
15
30 Indiana State Health Assessment and Improvement Plan 2018 - 2021
Tobacco Use
Tobacco is a leading cause of preventable illness and death nationally and in Indiana. Of Indiana adults, 21.1% smoke, the tenth-highest rate in the US.
In contrast, smoking is less prevalent in Indiana adolescents than the national average. However use of electronic cigarettes, or ‘vaping’, is on the rise.
In Indiana, tobacco use contributes to five of the top 10 leading causes of death: cardiovascular disease, stroke, diabetes, chronic lower respiratory
disease and cancer. Hoosiers who indicate frequent poor mental health days, individuals with lower incomes and education, and adults who identify
as LGBT smoke at higher rates than the general population.
Who are the Hoosiers using tobacco? Annual Percentage of Youths Who Smoke
40
38% of adults who have frequent poor mental health days
33% of Medicaid women
30
33% of adults with an annual household income of less than $25,000
32% of those identifying as LBGT 20
30% of adults with a high school education or less
8.7%
23% of African Americans 10
21% of whites 1.8%
0
20% of high schoolers '00 '02 '04 '06 '08 '10 '12 '14 '16
18% of Hispanics
14% of pregnant women Middle School High School
5% of middle schoolers
Annual Percentage of Adults Who Smoke
Tobacco Facts 27
Ø Smoking takes the lives of approximately 11,100 Hoosiers each year.
Ø Smoking costs Hoosiers an estimated $2.93 billion annually. 24
Ø Most Hoosiers who smoke want to quit. Over half of Hoosier adults
who smoke tried to quit in the past year. 21
21.1%
18
2011 2012 2013 2014 2015 20162018 - 2021 Indiana State Health Assessment and Improvement Plan 31
32                  Indiana State Health         Assessment and Improvement Plan                                                              2018 - 2021

Chronic Disease Prevalence and Mortality
The leading causes of death in Indiana among all racial and ethnic groups include are cardiovascular disease, stroke, diabetes, and cancer.

                                                                                per 100,000 population
2018 - 2021 Indiana State Health Assessment and Improvement Plan 33
34 Indiana State Health Assessment and Improvement Plan 2018 - 2021
Improve Birth Outcomes
Infant mortality, or the death of a baby before his or her first birthday, has been a state health priority since 2014. The Healthy People 2020 goal is 6.0 deaths
per 1,000 live births, and the national average is 5.9 infant deaths per 1,000 live births. Indiana’s infant mortality rate was 7.5 deaths per 1,000 live births in
2016. The leading cause of infant mortality is congenital malformations, which are physical defects present in a baby at birth. These can be genetic, result from
exposure of the fetus to agents that cause developmental malformations, or be of unknown origin. Other causes of infant mortality include: perinatal risk fac-
tors such as low birthweight or preterm birth, assaults/accidents such as homicide, accidental inhalation, falls, etc., sudden unexplained infant death syndrome
(SUIDS), and respiratory distress. African American babies die at a disproportionately higher rate (14.4 deaths/1,000 live births) as compared to the Hispanic
population (9 deaths/1,000 live births) and the white population (6.4 deaths/1,000 live births).
Strategies to reduce premature death include: increasing breastfeeding rates; ensuring babies are born in settings that are able to provide the appropriate level
of care; educating caregivers about the ABC’s of safe sleep practices (alone, on their back, in a crib); and good maternal health before a women gets pregnant.
Selected data on these indicators are provided below.
Percentage of Low Percentage of Pre-‐Term
Percentage of Mothers Receiving
In 2016, 623 infants did not see their first birthday Birthweight Deliveries Deliveries
No Prenatal Care in First Trimester
15 15
700 18 of Pregnancy
50 16 10 10
600
Bars: Total Number of Infant Deaths
14 Lines: Infant Morality Rate by Race
500 5 5
(per 1,000 live births)
12 2012 2013 2014 2015 2016 2012 2013 2014 2015 2016
400 40
10
Percentage of Mothers Not Percentage of Mothers
300 8 Breastfeeding at Discharge Smoking During Pregnancy
40 20
6
200 30
30
4
10
100
2 20
0 0 10 0
20
2012 2013 2014 2015 2016 2012 2013 2014 2015 2016 2012 2013 2014 2015 2016
2012 2013 2014 2015 2016
Hispanic Black White2018 - 2021 Indiana State Health Assessment and Improvement Plan 35
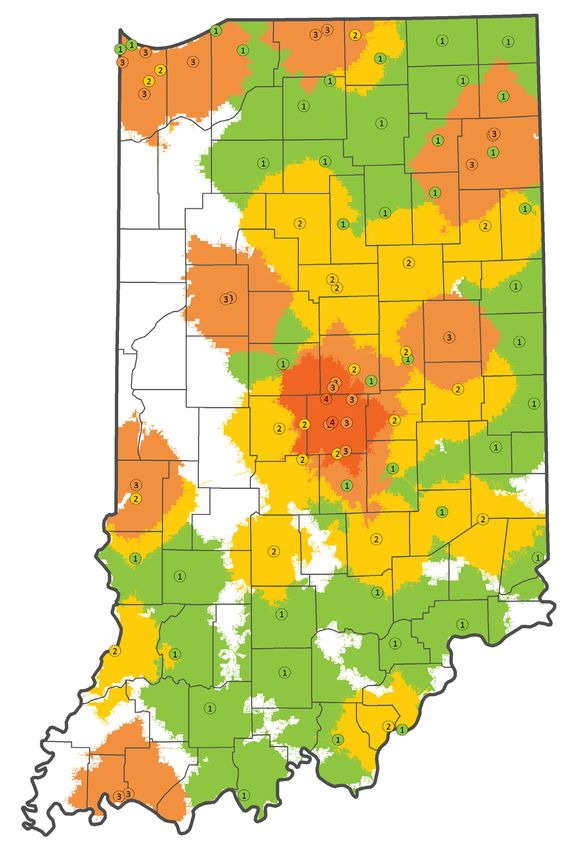
Levels of Care/Access to Care
Birthing hospitals are those facilities that are equipped to care for at-risk babies. Many counties
and regions in Indiana do not have a birthing hospital, forcing women with high risk pregnancies
to drive long distances to deliver their babies. The map depicts birthing hospital locations in In-
diana by level of care along with the highest accessible level of care within an average 30 minute
drive from any location. Approximately 37% of childbearing age women do not reside within 30
minutes of a level 3 or 4 Indiana birthing hospital. Over 30% of pregnant women in Indiana in
2016 did not receive prenatal care in the first trimester.
Birthing hospital
Percentage of Mothers Receiving by level of care
No Prenatal Care in First Trimester 4 3 2 1
of Pregnancy
50 Highest level of care
accessible within
a 30 minute drive
4
40
3
2
1
30
20
2012 2013 2014 2015 2016
Hispanic Black White36 Indiana State Health Assessment and Improvement Plan 2018 - 2021
Reduce Injury and Death Due to Opioid Exposure
Drug overdose and opioid-related deaths in Indiana increased five-fold between 1999-2016. Of all drug overdose deaths, 85.1% were
unintentional, 6.9% were suicide or intentional self-harm, and 7.8% had undetermined intent. Men were more likely than females to
die of a drug overdose, and adults ages 25-34 years had the highest death rate of all age categories (39.2 per 100,000).
In 2015, an HIV outbreak in Scott County focused the national spotlight on health outcomes related to injection drug use and opioid
addiction. The outbreak, along with increasing rates of opioid misuse and hepatitis C, prompted legislation allowing syringe service
programs in counties meeting specific criteria. In 2017, Governor Eric Holcomb continued the emphasis on attacking the opioid epi-
demic and included a comprehensive strategy in his Next Level Indiana agenda.16 Select indicators describing the opioid epidemic in
Indiana are included below.
Number of Annual Drug Overdose Deaths 6,934
All Drug Overdoses Overdoses Involving Any Opioid Hoosiers visited an
1600 emergency department in
2016 involving a non-fatal
1400 1,518 Hoosiers Died of overdose of an opioid
Drug Overdoses in 2016
1200
1000
Overdose deaths have
800
increased 725% since 1999
785 Hoosiers Died of
600
400
Opioid Overdoses in 2016
2,426
Hoosiers were hospitalized
Deaths Involving opioids have in 2016 involving a non-fatal
200
increased 1,725% since 1999 overdose of an opioid
0
2000 2002 2004 2006 2008 2010 2012 2014 2016
Office of the Governor of Indiana, 2018)
16(2018 - 2021 Indiana State Health Assessment and Improvement Plan 37
38                  Indiana State Health         Assessment and Improvement Plan                                                                   2018 - 2021

Part 2: Indiana State Health Improvement Plan
Approach to Identifying Flagship Priorities
After the final review of indicators with the IHIP team during the SHA process, the final flagship priorities were chosen due to their potential
to impact Indiana’s most pressing health issues. The priorities address Indiana’s top ten causes of death, the top needs identified from the
review of statewide assessments, and many of the concerns key informants brought up in interviews. The final priorities are:

1    Improve birth outcomes and reduce infant mortality

2    Address the opioid epidemic

3    Reduce rates of chronic disease

4    Improve the public health infrastructure
2018 - 2021                                                                              Indiana State Health Assessment               and Improvement Plan            39

These flagship public health priorities reflect the importance of healthy living as a necessary condition for achieving and maintaining good health and happiness.
Yet an individual’s ability to live healthfully is influenced by his/her environmental conditions, i.e., social determinants of health. One’s ZIP code can have more
impact on health outcomes than one’s genetic code. Adequate transportation, educational attainment, income, housing, social support and safe neighborhoods
are necessary foundations for the health of people and communities. Not every Hoosier has the same opportunities for achieving optimal health. Disparities in
health status are evident in the data supporting each of the flagship priorities. Therefore, each flagship priority in the ISHIP addresses social determinants of
health and elements of health equity.

In February 2018, ISDH worked with subject matter experts to gather evidence and practice-based strategies to address the priority indicators identified in the
State Health Assessment. Action teams started by choosing goals, strategies, and objectives that define areas of impact for each flagship issue over the next four
years. The proposed strategies and goals were reviewed by subject matter experts and action teams between February and April during a series of in-person
and virtual meetings. They were then released for public comment using social media and email. Respondents either agreed or strongly agreed with the outlined
strategies to address the flagship issues.

The majority of the goals and strategies in this plan directly align with Indiana’s disease specific improvement plans that meet the rigorous planning standards
of the SHA and SHIP. Plans were included for review if they:
         1. Were authored within the past five years
         2. Included a range of stakeholder input during the plan development
         3. Included an assessment of relevant data
         4. Used strategies that are evidence-based or promising practices and align with national priorities

For example: The strategies presented to reduce rates of chronic disease in this SHIP reflect similar strategies offered in Indiana’s Coordinated Chronic Disease
Plan, and the strategies presented to reduce Indiana’s high infant mortality rate are based on recommendations from the Indiana Perinatal Quality Improvement
Collaborative and Indiana’s Title V block grant. Rather than duplicating planning efforts, the IHIP team favored adopting strategies already validated by subject
matter experts. Alignment also ensures that partners across the state are working towards the same goals.
40 Indiana State Health Assessment and Improvement Plan 2018 - 2021
Flagship Priority 1:
Reduce Infant Mortality
GOAL 1: Reduce infant mortality
GOAL 2: Improve maternal and infant
health outcomes
GOAL 3: Increase safe sleep practices
GOAL 4: Improve access to prenatal care2018 - 2021 Indiana State Health Assessment and Improvement Plan 41
Flagship Priority 1: Reduce Infant Mortality
GOAL 1: Reduce infant mortality
OBJECTIVES STRATEGIES
OBJECTIVE 1 Increase the number of delivery hospitals who are appropriately leveled according to Levels of Care legislation passed in 2018
Reduce infant mortality from 7.5 per
1,000 live births in 2016 to 7.0 per
1,000 live births by 2020 (2018 data)
2 Develop and pilot location and demographic specific MCH programming aimed to increase awareness and change behavior of
expecting mothers and families
OBJECTIVE
Reduce Indiana’s black infant mortality
rate from 14.4 per 1,000 live births in
3 Participate in national and regional learning communities and alliances to improve the quality of services Indiana delivers
2016 to 14.0 per 1,000 live births by
2020
4 Increase the number of families served in evidence-based home visiting programs from 6,962 in 2016 to 10,000 in 2021 (2019 data)
OBJECTIVE
Reduce Indiana’s Hispanic infant
mortality rate from 9.0 per 1,000 live
births in 2016 to 8.0 per 1,000 live births
by 202042 Indiana State Health Assessment and Improvement Plan 2018 - 2021
Flagship Priority 1: Reduce Infant Mortality
GOAL 2: Improve maternal and infant health outcomes
OBJECTIVES STRATEGIES
OBJECTIVE 1 Increase the number of hospitals participating in quality improvement projects aimed to increase breastfeeding in their facilities
Increase percentage of women
breastfeeding at hospital discharge
from 80.9% in 2016 to 82.5% by 2021
2 Increase the number of women accessing peer support services
OBJECTIVE 3 Increase the number of hospitals using the NAS diagnoses codes for improved surveillance
Decrease the number of babies born
with Neonatal Abstinence Syndrome
(baseline TBD) (HP2020 MICH-11.4) 4 Increase the number of providers certified to provide prenatal care and deliver buprenorphine
OBJECTIVE 5 Increase smoking cessation during pregnancy program coverage to include every county in Indiana by 2021
Reduce the number of women who smoke
during child bearing years from 19.6% in
2016 to 15.0% in 2021
6 Decrease percentage of mothers receiving Medicaid who smoke during pregnancy from 23.4% in 2016 to 20.0% by 2021 (2019 data)
(HP2020 MICH-11.3)2018 - 2021 Indiana State Health Assessment and Improvement Plan 43
Flagship Priority 1: Reduce Infant Mortality
GOAL 3: Increase safe sleep practices
OBJECTIVES STRATEGIES
OBJECTIVE 1 Promote and support Fetal and Infant Mortality Review (FIMR) Teams and their development of strategies and objectives
Decrease Indiana’s 5 year (2012-2016)
SUIDS rate from 93.7 per 100,000 live
births by 15% by the year 2021
2 Increase the number of FIMR teams by 50% by 2021 from 7 established teams to 11
(HP2020 MICH-1.8,1.9)
OBJECTIVE
Increase the number of MOM’s helpline
calls that address needs for safe sleep 3 Promote MOM’s Helpline and 211 as connections to statewide resources such as transportation, dental care, health care, safe sleep
from 1525 in 2016 to TBD in 2021
OBJECTIVE
Increase families enrolled in home
visiting programs who use safe sleep 4 Continue to provide education and resources to mothers and families enrolled in evidence-based home visiting services
practices (as measured by MIECHV
home visiting data) from 62.2% in 2017
of enrolled families to 63.5% in 2021
(HP2020 MICH-20)44 Indiana State Health Assessment and Improvement Plan 2018 - 2021
Flagship Priority 1: Reduce Infant Mortality
GOAL 4: Improve access to prenatal care
OBJECTIVES STRATEGIES
OBJECTIVE 1 Increase awareness of physicians about the importance of scheduling prenatal visits in the first trimester
Increase the percentage of pregnant
women who receive prenatal care in the
first trimester from 69.3% in 2016 to 72%
2 Increase the number of MOM’s Helpline and 211 calls directing women to prenatal care providers
by 2021 (HP2020 MICH-10.1)
OBJECTIVE
Increase the number of transportation
options for pregnant women to prenatal 3 Partner with the office of Medicaid to create pregnancy wraparound support services for high-risk mothers
and other pregnancy related care visits
(baseline TBD)
OBJECTIVE
Decrease the number of counties that do 4 Identify high-risk areas throughout Indiana that do not have obstetric providers in order to develop a plan for improving
not have an obstetric provider (baseline access to OB care
TBD)2018 - 2021 Indiana State Health Assessment and Improvement Plan 45
Flagship Priority 2:
Addressing the opioid epidemic
GOAL 1: Prevent substance use disorder
GOAL 2: Minimize the harm as a result of
substance use disorder
GOAL 3: Ensure access to treatment for
opioid use disorder46 Indiana State Health Assessment and Improvement Plan 2018 - 2021
Flagship Priority 2: Addressing the opioid epidemic
GOAL 1: Prevent substance use disorder
OBJECTIVES STRATEGIES
OBJECTIVE
Increase the number of physicians 1 Increase the number of prescribers that are registered to access INSPECT; use before each new pain prescription and quarterly to
utilizing the state’s prescription drug monitor drug use
monitoring program INSPECT to 100%
by 2021. (baseline TBD)
2 Encourage the use of alternative pain management treatments and therapies and hospital-driven post-operative pain management protocols
OBJECTIVE
Decrease the number of opioid prescrip- 3 Support relevant education and training of prescribers and patients regarding pain medications and potential for misuse
tions that are written every year from
84/100 Hoosiers to 70.6/100 Hoosiers by
4 Increase the number of elementary, middle and high schools implementing evidence-based prevention programs
2021
5 Use the Next Level Recovery, Know the “O” Facts website to spread awareness about substance use disorder
6 Encourage and support increased availability and awareness of drug “take back” opportunities
OBJECTIVE
Increase the number of reported and 7 Identify and provide technical assistance to high-burden communities and counties, especially with efforts to address problematic prescribing
completed overdose death cases in the
National Violent Death Reporting
System (NVDRS) from 46% to 90% by
20212018 - 2021 Indiana State Health Assessment and Improvement Plan 47
Flagship Priority 2: Addressing the opioid epidemic
GOAL 2: Minimize the harm as a result of substance use disorder
OBJECTIVES STRATEGIES
OBJECTIVE
Decrease the rate of overdose death
rates (all drug poisoning) from 22.88 in
2016 to TBD by 2021.(HP2020 SA-12) 1 Increase access to naloxone for first responders, individuals using opioids illicitly or taking opioids for pain management or treatment of substance
use disorder, their families and friends, and other pertinent individuals in the community per the U.S. Surgeon General’s 2018 Health Advisory
2 Increase awareness of syringe exchange service programs
OBJECTIVE
Increase the number of LHDs who
receive naloxone kits from 48 (52%) in 3 Expand access to comprehensive programs in communities, as permitted by the Indiana Administrative Code, to provide a safe space for harm
2018 to 69 (75%) by 2021 reduction services
4 Increase the availability of supportive community services such as access to food and housing
5 Partner with Local Coordinating Councils for county and community level solutions
OBJECTIVE
Increase the number of individuals
who receive training on naloxone
administration from 298 in 2018 to
900 in 2021 (HP2020 SA-8.1)48 Indiana State Health Assessment and Improvement Plan 2018 - 2021
Flagship Priority 2: Addressing the opioid epidemic
GOAL 3: Ensure access to treatment for opioid use disorder
OBJECTIVES STRATEGIES
OBJECTIVE
Increase the number of persons who 1 Increase the number of healthcare providers in Indiana with expertise in recovery, licensed recovery counselors, and primary care providers able
were treated in an emergency depart- to provide buprenorphine treatment
ment for an opioid overdose who then
access treatment (baseline TBD)
2 Promote the use of Recovery Support Specialists and peer recovery coaches as part of treatment teams and on-call response to overdoses
in emergency departments (EDs)
3 Expand access to supportive environments for people in recovery to live while transitioning back into the community, such as recovery or sober
living houses
OBJECTIVE
Increase the number of Hoosiers
receiving Medication Assisted Treat-
4 Decrease stigma of substance use disorder by spreading awareness with the Next Level Recovery Know the “O” Facts website and resources
ment (baseline TBD)
5 Expand access to all three forms of Medication Assisted Treatment (methadone, buprenorphine, naltrexone) for individuals with opioid use
disorder across all settings
OBJECTIVE
Increase the number of individuals who
receive training on naloxone administra- 6 Increase access to adequate insurance coverage for opioid use disorder treatment
tion from 298 to 900 in 2020
(Aligned with Indiana’s Strategic Approach to Addressing Substance Abuse)2018 - 2021 Indiana State Health Assessment and Improvement Plan 49
Flagship Priority 3:
Reduce chronic disease
GOAL 1: Reduce the burden of obesity living
GOAL 2: Increase opportunities for active living
GOAL 3: Increase opportunities for healthy eating
GOAL 4: Decrease the burden of tobacco use
GOAL 5: Decrease the burden of cardiovascular disease and diabetes
in Indiana and encourage chronic disease self-management
GOAL 6: Reduce the burden of asthma on Indiana adults and children
GOAL 7: Ensure all Hoosiers are appropriately screened for cancer50 Indiana State Health Assessment and Improvement Plan 2018 - 2021
Flagship Priority 3: Reduce chronic disease
GOAL 1: Reduce the burden of obesity
OBJECTIVES STRATEGIES
OBJECTIVE
Increase the percentage of adults at a
healthy weight from 31.0% in 2016 to
32.5% in 2021 (HP2020 NWS-8)
1 Increase the number of employers who utilize multi-component worksite wellness programs in Indiana
OBJECTIVE
Increase the percentage of children and
2 Increase the number of schools that utilize the whole school, whole community, whole child model for school wellness
adolescents at a healthy weight from
60.3% in 2016 to 63.0% in 2021
3 Increase the number of out-of-school-time programs that follow healthy eating and active living guidelines (HEAL)
(HP2020 NWS-10)
4 Increase the number of trainings, including webinars, provided to early care and education centers (ECEs) that provide
OBJECTIVE guidance on increasing healthy foods and beverages and increasing opportunities for physical activity
Decrease obesity among the adult black,
non-Hispanic, population from 42.1% in
2016 (Indiana average is 32.5%) to
40.0% in 2021 (HP2020 NWS-10)
OBJECTIVE
Decrease obesity among the adult black,
non-Hispanic, population from 42.1% in
2016 (Indiana average is 32.5%) to
40.0% in 2021. (HP2020 NWS-10)2018 - 2021 Indiana State Health Assessment and Improvement Plan 51
Flagship Priority 3: Reduce chronic disease
GOAL 2: Increase opportunities for active living in Indiana
OBJECTIVES STRATEGIES
OBJECTIVE
Decrease the percentage of adults who
report not meeting the aerobic recom- 1 Increase the number of built environment plans and policies adopted to encourage physical activity, such as bicycle and pedestrian plans
mendations of 150 minutes per week of
moderate activity from 44.1% in 2015 to
43.3% in 2021 (HP2020 PA-2.1) 2 Provide technical assistance and support for communities designing neighborhoods that support active living
OBJECTIVE
3 Increase the number of school based prevention programs and policies such as Safe Routes to School, active recess,
Increase the number of adolescents who enhanced school-based physical education, classroom physical activity breaks, and extracurricular activities
meet the recommendations for physical
activity of 60 minutes per day from
4 Provide professional development to school staff on how to incorporate enhanced physical activity programs and policies
25.3% in 2015 to 27.3% in 2021
before, during and after the school day
(HP2020 PA-3.1)You can also read