Independent schools What would a smart state do? - NZIER report to Independent Schools New Zealand
←
→
Page content transcription
If your browser does not render page correctly, please read the page content below
Independent schools
What would a smart state do?

NZIER report to Independent Schools New Zealand
June 2020
About NZIER

     NZIER is a specialist consulting firm that uses applied economic research and analysis to
     provide a wide range of strategic advice.
     We undertake and make freely available economic research aimed at promoting a better
     understanding of New Zealand’s important economic challenges.
     Our long-established Quarterly Survey of Business Opinion (QSBO) and Quarterly
     Predictions are available to members of NZIER.
     We pride ourselves on our reputation for independence and delivering quality analysis in
     the right form and at the right time. We ensure quality through teamwork on individual
     projects, critical review at internal seminars, and by peer review.
     NZIER was established in 1958.

Authorship

     This paper was prepared at NZIER by Mieke Welvaert, Prince Siddharth and Derek Gill. It
     draws on an earlier NZIER report prepared in 2003 by Preston Davies and John Beckett.
     It was quality approved by John Yeabsley.
     The assistance of James Hogan and Sarah Spring is gratefully acknowledged.

     Registered office: Level 13, Willeston House, 22–28 Willeston St | PO Box 3479, Wellington 6140
     Auckland office: Ground Floor, 70 Shortland St, Auckland
     Tel 0800 220 090 or +64 4 472 1880 | econ@nzier.org.nz | www.nzier.org.nz

     © NZ Institute of Economic Research (Inc). Cover image © Dreamstime.com
     NZIER’s standard terms of engagement for contract research can be found at www.nzier.org.nz.

     While NZIER will use all reasonable endeavours in undertaking contract research and producing reports to ensure the information is as
     accurate as practicable, the Institute, its contributors, employees, and Board shall not be liable (whether in contract, tort (including
     negligence), equity or on any other basis) for any loss or damage sustained by any person relying on such work whatever the cause of
     such loss or damage.
Key points in a nutshell
Independent schools:
• offer genuine educational choice by catering for diverse social and
educational needs
• improve student outcomes with higher PISA scores and NCEA
endorsement rates (around 10% more students attain excellence at
Level 3) and all at lower fiscal costs
• save the Government at least $175 million p.a. in operating
expenses but only by making some parents pay twice for their
children’s schooling
• face a widening gap between their funding and that for state or
integrated-schools which exposes Government’s already stretched
fiscal position to further risk.
A smarter strategy would be to increase the subsidy for independent schools so
it is linked to the cost of the most efficient state system schools.
Summary
Independent schools’ market share is shrinking
Independent schools in New Zealand accommodate over 30,000 pupils across 91 schools.
At the same time, the national school roll is increasing, and capacity pressures are growing
for state schools in key urban areas where there is limited space to expand. While funding
for the state school network is growing, funding for independent schools has been capped
since 2009.
Increasing long-run cost risk facing the government
The boost to teacher salaries at state and independent schools as well as increased capital
funding for state schools puts increasing pressure on independent schools to continue
providing a tailored service at the same fees.
The widening gap between independent school funding and state or state-integrated
school funding means that independent schools are becoming less viable. The impact of
Coronavirus will only increase the financial challenges facing independent schools due to
reduced enrolments and fundraising capability.
Other countries fund and regulate independent schools differently…but some fund
state and independent equally
Some countries, such as the Netherlands, Belgium, and France treat purchasing education
the same as providing education, and thus fund independent and state provided education
equally. In contrast, countries which have a longer standing culture of communities funding
iveducation often have less state involvement in funding and regulating independent
education.
In New Zealand, funding for independent education is low relative to the countries that
fund education in any way.
Supporting independent schools is in the New Zealand community’s best interests
There are several arguments for increasing funding to independent schools:
• Optimising government expenditure of schooling in total. Increasing the number
students that attend independent schools, would reduce the cost of system expansion
for the government and deliver high levels of achievement at a lower cost to the public
purse.
• Offering stability to the sector – the current pooled funding creates uncertainty for
independent schools and families, making both more cautious to participate in
independent schooling.
• Offering genuine educational choice – independent schools are better placed to
provide for diverse learning needs and preferences.
• Supporting innovation – which comes at a lower cost to the government because
independent schools’ parents and donors co-fund the innovation costs, limiting
government exposure to risk.
• Ensuring horizontal equity – parents who send their children to independent schools
pay twice. Once through taxes, which largely go to state or state-integrated schools
and again through independent school fees because funding to independent schools is
as low as 20% of state school salary and operating funding.
We analysed the data from the state school network to assess the performance of
efficient state schools
In order to assess the cost running an efficient school, we used a technique called Data
Envelopment Analysis (DEA). DEA is a ground-up technique that finds the maximum outputs
in terms of educational achievement at different schools for varying levels of inputs. This
gives an empirically based benchmark for comparing independent school funding with the
funding for the most efficient state and state-integrated schools.
A smart state focused on maximising wellbeing would increase the Private School
Subsidy Funding
If the state wants to minimise the risk of future long-run costs, it would ensure that funding
of independent schools is adequate to keep the sector viable. The fiscal analysis provided in
this paper suggests increasing the subsidy to independent schools would paradoxically save
the government money.
A state concerned about promoting educational achievement and overall wellbeing would
pay more than this fiscal breakeven value. Linking the subsidy to independent schools to
that of the most efficient state and state-integrated schools, would increase the funding
from around $2,000 per secondary student in 2017 to between $8,600 per secondary
student (based on direct costs) and $11,600 per student (using full costs).
vContents
1 Introduction – a brief history of schooling in New Zealand ........................................................ 8
2 The state has a pivotal role in education ................................................................................. 10
2.1 The challenges of education .......................................................................................... 10
2.2 Types of state intervention............................................................................................ 11
3 Independent schools in New Zealand ...................................................................................... 13
3.1 Independent schools sector is small but significant ....................................................... 13
3.2 Independent schools are mostly in main centres ........................................................... 13
3.3 Independent schools cater for diverse social, cultural, and educational needs............... 14
3.4 Independent schools provide competitive stimulus ....................................................... 16
3.5 Independent schools reduce government spending on education ................................. 19
3.6 Summary....................................................................................................................... 23
4 Funding for independent schools in New Zealand ................................................................... 23
4.1 Rationale for funding independent schools ................................................................... 27
5 Changes afoot ......................................................................................................................... 27
5.1 What would a smart state do? ...................................................................................... 30
6 What is an efficient level of funding? ...................................................................................... 31
6.1 The task ........................................................................................................................ 31
6.2 What is funding efficiency? ........................................................................................... 32
6.3 Results .......................................................................................................................... 33
6.4 Limitations .................................................................................................................... 35
7 Conclusion .............................................................................................................................. 36
8 References .............................................................................................................................. 38
Appendices
Appendix A Theoretical concepts ...................................................................................................... 42
Appendix B The DEA approach .......................................................................................................... 44
Appendix C A framework for assessing the fiscal effects of government funding of independent
schools.................................................................................................................................... 47
Figures
Figure 1 The Government’s role in different school types in New Zealand ........................................... 9
Figure 2 Vertical equity in theory ...................................................................................................... 12
Figure 3 Number and roll size of independent schools in New Zealand.............................................. 13
Figure 4 Independent school locations .............................................................................................. 14
Figure 5 Private school roll compared to funding .............................................................................. 20
Figure 6 Per student funding for independent schools 1996–2017 .................................................... 23
Figure 7 How did we get here?.......................................................................................................... 24
Figure 8 Funding for independent schools varies under a cap............................................................ 25
Figure 9 Per student funding growth comparison .............................................................................. 26
Figure 10 Funding for independent schools compared to state school funding .................................. 27
Figure 11 State and state-integrated school rolls are increasing faster than forecast ......................... 29
viFigure 12 Integrating private schools into the state system is expensive ........................................... 30
Figure 13 100% efficient schools are on the “efficient frontier” ......................................................... 32
Figure 14 Results in concept.............................................................................................................. 33
Figure 15 Education in a free market = lower consumption ............................................................... 43
Figure 16 Level of government funding for independent schools....................................................... 49
Tables
Table 1 NCEA endorsement attainment across schools ..................................................................... 17
Table 2 Decile 10 NCEA endorsement attainment across schools ...................................................... 17
Table 3 Calculating elasticity ............................................................................................................. 52
vii1 Introduction – a brief history of schooling in New Zealand
New Zealand has three main types of schools: state schools, state-integrated schools, and independent
schools.
For the most part, we have these different schools because of history. Initially all schools were
independent from the government, unregulated, and funded by attendants or their communities. Māori
have long had whare wānanga (houses of learning) (Swarbrick 2012a). Many schools set up by European
settlers were faith-based.
As the state began expanding its functions, it began funding existing schools and setting up schools –
providing education itself. By 1877 New Zealand had free, secular and compulsory education (Swarbrick
2012a). But independent (often Christian-based) schools remained. From this point we had two
established types of schools: state schools and independent (otherwise known as private) schools.
However, as the New Zealand economy hit a rough patch in the 1970s, the government began to
partially fund independent schools. By 1975, the then quite large body of independent schools,
particularly Catholic schools, negotiated with the government to integrate into the state system
(Swarbrick 2012b). This was the beginning of state-integrated schools, which receive similar funding to
state schools but can also ask for attendance dues and additional donations from parents for their
‘special character’ buildings (e.g. chapels) and education features.
As a result, we now have three main different types of schools with three different arrangements for
regulating, funding, and providing education (see Figure 1)
8Figure 1 The Government’s role in different school types in New Zealand
More of the building filled in (dark) indicates more government involvement
INDEPENDENT SCHOOLS STATE SCHOOLS STATE-INTEGRATED
SCHOOLS
4
REGULATION
Government Government Government
oversight of oversight of oversight of
school and school, school,
teaching teaching, and teaching, and
curriculum curriculum
FUNDING
OPERATIONS >80% from Government Operational
AND STAFF parent fees or funded funding
FUNDING donations equivalent toWe then look at the question of how much, and what is an efficient level of funding. We have
undertaken some empirical analysis to determine an efficient level of funding for state and state-
integrated schools. This research can form an empirical basis for any decisions the government wishes
to make about funding independent schools.
We then conclude what a smart state could do given the economic objectives of equity and choice, and
government objectives of building wellbeing, innovation, and maintaining fiscal efficiency.
2 The state has a pivotal role in education
Schooling creates health, wealth, and wellbeing benefits for New Zealanders. This comes in the form of
fulfilment and a sense of self-worth for the individual, integration into wider society (social capital),
reduced burden of care for parents raising children which combined with skills development, increases
earning ability for both the individuals receiving education and their communities.
However, because these benefits do not always accrue directly to the person engaging in schooling, or
the people paying for education, education requires government intervention. As a result, governments
often assume the responsibility for addressing the challenges of education in such a way that total
wellbeing is enhanced to the greatest extent possible (The Treasury 1987, 2:272).
2.1 The challenges of education
Government intervention helps mitigate key difficulties associated with education:
• Who pays (concerns about equity)?
• Who chooses (the agency problem)?
• Who benefits (how benefits disperse among society)?
• Who is accountable (efficiency concerns)?
(The Treasury 1987)
We discuss these in more detail below.
Who pays?
Not everyone has the same level of income to pay for the same level of suitable education. Hence the
net benefits that society and individuals draw from education may not be fairly distributed to all (The
Treasury 1987, 2:272).
Who chooses?
Most people who engage with education are not adults and also not in a position to know the best
program of education for them. Furthermore, often parents do not have all the information to make the
best educational choices for their child. At the same time, education providers have more information,
but also have a stake in how much they share with the parents (the consumers). This is known as
asymmetrical information (discussed further in Appendix A).
As a result, those receiving education are exposed to agency failure – where the people responsible for
a child’s educational decisions and the consequences for that child’s future, lack adequate information
to act in the child’s best interests.
10Who benefits?
Individuals receiving education and agents delivering education do not always capture the full benefits
(or costs) of the education transaction. As a result, market settings often lead to sub-optimal education
consumption (see positive externalities in Appendix A for more detail).
Who is accountable?
Customers may not be able to hold providers satisfactorily to account (The Treasury 1987, 2:272).
Families paying for education may not be able to seek adequate recompense if that education is not up
to scratch. Governments mitigate this efficiency risk by regulating the education sector for quality and
quantity (see Section 2.2 for how).
2.2 Types of state intervention
To address these challenges, governments intervene in education through regulation, funding, and
provision.
Regulation
Government regulation of education markets comes in two forms – quality and quantity.
Regulating quality helps maintain efficiency and horizontal equity. The government regulates curriculum
content, provides information through reviews undertaken by the Education Review Office, and sets
standards for teacher behaviour. All these regulations help ensure that all students receive at least a
minimum level of education appropriate to their age.
Regulating quantity helps ensure that the students leave school with the tools to survive, thrive, and
contribute to New Zealand society. The government achieves this by requiring that all students aged
from six to sixteen attend school (Ministry of Education 2019a).
Funding
The amount of funding provided from government for education is significant. In the 2019 Budget, the
government allocated $14.3 billion to education alone (Treasury 2019). This represents about 16% of
core Crown expenses (Treasury 2019). Of this amount, around 46% is allocated to secondary and
primary education (Treasury 2019). Schools, therefore, are a major expenditure destination for the
revenue raised by general taxation.
The government uses taxes and subsidies to redistribute education funding so that those with different
means and needs have access to education (vertical equity). Although various other regulatory (deciles,
zoning, rankings and ratings) and economic (competition for good teachers) drivers interfere with
creating vertical equity,1 the underpinning redistribution helps even out school funding access. This in
turn raises educational outcomes for more of the New Zealand population – improving our human and
social capital. A more educated population is more productive, earns more, and is more socially
cohesive. Redistributing funding for education so that more people are educated to a higher standard
ensures a more even and equitable distribution of outcomes (see Figure 2).
1 In some locations, people pay premiums for some state school zones that are similar to or greater than private school fees.
11Figure 2 Vertical equity in theory
The government redistributes tax revenue to fund wider access to education
High
income Education for children from
high-income families
High net tax
NZ government
NZ population
Medium net tax
Education for children from
low-income families
Low net tax
Low income
Source: NZIER
Production
In the case of production, the state effectively bypasses large parts of the market and produces
education goods and services itself. The state school sector is an example of large-scale state
production.
School education provision does not need to be concentrated in the state sector. States can purchase
education from providers, such as the private sector. Some governments, such as the Netherlands and
Denmark, weigh purchasing education from an independent provider equally against providing
education themselves. We discuss different countries’ approaches to regulating, funding and providing
education below in Section 3.5.1.
2.2.1 Conclusion
The state plays a pivotal role in schooling. This means how intervention occurs is important for an
efficient and effective sector. The following section discusses why interventions that support
independent school-based education are both effective and cost saving from a government perspective.
123 Independent schools in New Zealand
The relationship between private and publicly funded education has changed over the history of
education in New Zealand. In this section we discuss what independent schools look like now, how they
accommodate emerging education needs in New Zealand, and how they help the government provide
education equity and efficiency.
3.1 Independent schools sector is small but significant
Independent schools currently make up 3.7% of the total school roll, which is equivalent to just over
30,000 students across 91 schools (Education Counts 2019). Independent school rolls have fluctuated
over the past two decades. At the same time, state and state-integrated schools have grown
consistently. Factors affecting the number of students attending independent schools are population
growth, the state of the New Zealand economy, family preferences and needs, as well as supporting
funding from the New Zealand government.
Figure 3 Number and roll size of independent schools in New Zealand
32,000 120
30,000 110
28,000 100
26,000 90
24,000 80
22,000 70
20,000 60
2000 2002 2004 2006 2008 2010 2012 2014 2016 2018
Roll Number of schools (secondary axis)
Source:
Education Counts 2019
3.2 Independent schools are mostly in main centres
More than half (52%) of students attending independent schools are in Auckland (Education Counts
2019). Much of the rest of the independent school roll is focused in the main urban centres of
Canterbury (16% of independent school students), Wellington (10%) and Waikato (10%). Independent
schools need a critical mass of families wanting the educational experience independent schools offer
within a reasonable catchment, and therefore independent schools are more common in more densely
populated urban areas.
13Figure 4 Independent school locations
Source: Education Counts 2019
3.3 Independent schools cater for diverse social, cultural, and educational needs
The independent and public education sectors can be viewed as complementary systems. The key
difference between the independent and public education sectors, however, relates to how education is
delivered. A high degree of influence is exerted by union groups, particularly in the secondary sector,
which has a stifling effect on innovation and flexibility. Free of such constraints, independent schools
have more ability to innovate, and cater for diversity.
Independent schools cater for a wide range of community and schooling needs
Independent schools cater to a wide range of communities. Many independent schools provide a
religious or values-based education. Others promote a particular educational philosophy or
interpretation of mainstream education (Independent Schools Council of Australia 2019). Some
examples of education variation and diversity supported by the private schools in New Zealand are:
14• Schools with extensive sections for Learning Support, e.g. Summit Point School, ADDI Enrichment
Academy, Diocesan School for Girls, Scots College, King’s College.
• Schools with extensive bursary support for low income families, e.g. Dilworth School, Diocesan
School for Girls, St Cuthbert’s College, Saint Kentigern College, Christ’s College, Scots College, to
name just a few.
• School for Gifted and Talented students, e.g. AGE School.
• Schools with Special Character, e.g. Diocesan School for Girls, King’s College, St. Cuthbert’s College,
St. Mark’s Church School, Scots College, St Margaret’s College.
• Schools with mostly International Students e.g. Auckland International College, ACG Schools.
• Faith-based schools: e.g. Muslim Schools, e.g. Iqra School and Christian denominational and non-
denominational schools, e.g. Samuel Marsden Collegiate School, Scots College, Rangi Ruru Girls’
School, Hereworth School.
• Montessori schools, e.g. Harbour Montessori College, Meraki Montessori School, Nova Montessori
School, Waikato Montessori Education Centre, Peace Experiment.
• Steiner schools, e.g. Motueka Rudolf Steiner School, Titirangi Rudolf Steiner School, Waiheke Island
Steiner School.
• Schools that cater for students who come from disadvantaged backgrounds, e.g. Dilworth, or are
recovering from traumatic experiences or addictions, e.g. Odyssey House School Auckland.
Why do families choose independent schools?
Consumers’ demand for independent school services is dependent on several variables, including:
• Characteristics of the household, such as income, attitudes to risk, family size, requirement for
boarding, health status, and whether the household lives in a rural or urban area (or parts of urban
areas).
• Characteristics of the school, its reputation, the facilities available, its objectives and philosophy,
and extra-curricular activities such as sport and the arts.
• The price of attending an independent school (i.e. fee levels).
• Characteristics of the state school system. These include perceptions around academic integrity,
quality, price and location relative to comparable state schools.
The differences between independent and public education affect parents’ demand
People choose independent schools in New Zealand to cover a gap between their or their children’s
preferences or needs and what the public system provides. This gap changes as both public and
independent systems evolve:
• Public expenditure priorities change, some services become more obtainable in the public system
and others become less obtainable (such as class size).
• New technologies emerge and the relative speed of uptake of these technologies in the public and
independent sectors, such as devices in schools, will influence the demand for education services in
either sector.
• General preferences and cultural attitudes change, such as preferences for single sex or co-ed
schools.
15• Economic conditions change, for example house price growth and enrolment schemes (“zoning”)
means that some state schools are outside of the (house) price range for some families.
Independent schools are a way for these families to access their preferred choice of education
without being constrained by where they can afford to live.
If the public system does not keep up with service expectations, people will look for independently
provided alternatives. Independent schools can be more agile than their state counterparts.
In a society with ever-widening tastes, preferences and cultures, such flexibility is important in ensuring
the best delivery of the educational outcomes sought by increasingly eclectic consumers.
3.4 Independent schools provide competitive stimulus
The presence of a strong independent sector can have direct effects on the academic achievement of
those attending independent schools and may have instrumental effects through the competitive effect
on state schools – both of which contribute to improving outcomes.
Higher achievement by independent schools in many countries
A consistent finding across a range of countries is that students attending independent schools have
higher achievement rates than students attending public schools. Using PISA2 data for 16 OECD
countries (including New Zealand) and 10 partner countries, the OECD found
the typical private school student outperforms the typical public-school student. This private
school “advantage” shows itself in PISA reading scores that are 30 points higher – the
equivalent of three-quarters of a year’s worth of formal schooling – among private school
students. (OECD 2011, 1)
This OECD research concluded that three quarters of this difference is explained by advantages in the
socio-economic backgrounds of students attending independent schools, with the balance explained by
the degree of autonomy over curriculum and resourcing (OECD 2011).
New Zealand data also shows higher achievement by independent schools but attribution is a
problem.
The evidence for New Zealand, using both PISA scores and achievement measured through NCEA data,
suggests higher achievement by independent schools.
An analysis of 2011 PISA data undertaken for the Independent Schools of New Zealand compared New
Zealand independent schools PISA scores with their international counterparts and schools in the state
system network. Compared to their international private counterparts, New Zealand independent
schools PISA scores were ranked third in Mathematics and second in both Reading and Science.
Students from NZ Independent Schools also scored significantly better in PISA tests than their
counterparts in the NZ state system schools: 17.3% higher in Mathematics, 16.5% higher in Reading and
15.6% higher in Science (Hock Gan 2012).
An analysis of the most recently available NCEA achievement data found independent schools achieved
significantly higher rates of Excellence endorsements under NCEA than their state and integrated school
counterparts and generally higher rates of Merit as well. Table 1 Error! Reference source not found.
shows the achievement rates for all students attempting NCEA qualifications in 2019 for all three types
of schools. It is broken down by the year level as well as the qualification endorsements.
2 Programme for International Student Assessment (PISA) is a worldwide study by the OECD that evaluates educational systems by measuring 15-year-
old school pupils' scholastic performance on mathematics, science, and reading.
16Table 1 NCEA endorsement attainment across schools
Percentage of those attempting NCEA who achieved endorsements in 2019
School type Level 1 Level 1 Level 2 Level 2 Level 3 Level 3
Merit Excellence Merit Excellence Merit Excellence
State
32.7% 17.7% 23.6% 14.7% 25.1% 12.9%
Schools
Integrated
38.9% 25.3% 31.7% 23.0% 29.8% 18.6%
schools
Independent
42.4% 38.9% 39.4% 30.2% 36.6% 26.8%
schools
Note: Bold denotes the highest rate of achievement of Merit and Excellence endorsement by type of school.
Source: NZIER, NZQA
Table 1 shows that independent schools have significantly higher rates of Merit and Excellence
endorsements. Table 2 provides a similar comparison but for Decile 10 schools only.
Table 2 Decile 10 NCEA endorsement attainment across schools
Percentage of those attempting who achieved in 2019
School type Level 1 Level 1 Level 2 Level 2 Level 3 Level 3
Merit Excellence Merit Excellence Merit Excellence
State
41.5% 29.0% 32.3% 25.7% 32.2% 20.3%
schools
Integrated
44.7% 36.2% 43.5% 29.0% 36.1% 13.2%
schools
Independent
41.7% 42.8% 39.9% 34.1% 39.1% 28.3%
schools
Note: Bold denotes the highest rate of achievement of Merit and Excellence endorsement by type of school.
Source: NZIER, NZQA
It shows that Decile 10 independent schools significantly outperformed state and integrated schools in
Excellence endorsements at all levels, while also achieving higher rates of Merit endorsements at Level
3.
Combining Decile 10 Merit and Excellence endorsements together, independent schools’ achievement
rates for Level 1 are between 5% and 9% higher than those integrated and state schools respectively.
Similarly, at Level 2 independent schools’ endorsement rates are 1.5% and 16% higher, while at Level 3
the gap widens to 15% for state schools and 18% for integrated schools. Using combined data on
attainment of endorsements for all schools – not just Decile 10 schools – the gap is an order of
magnitude greater again.
However, comparisons using NCEA data such as simple school-by-school league tables or aggregates
such as those shown in Table 1 and 2 need to be interpreted extremely carefully. The data doesn’t simply
speak for itself because the schools’ performance isn’t fully captured by NCEA data.
Firstly, this is because some ‘single pathway’ schools use international assessments such as Cambridge
International Examinations (CIE) or the International Baccalaureate (IB) as an assessment framework.
Other schools have a dual pathway approach, with some students using NCEA but the top students are
17encouraged to sit the CIE or IB. Participation in other forms of assessment will tend bias downwards
those schools’ NCEA results so simple league tables don’t adequately capture relative performance.
Secondly, private schools often offer a wider variety of co-curricular activities. The additional strengths
of extensive sport, performing arts, cultural and after-school activities are often a reason why parents
select a private school. The investment of funds into co-curricular activities is a strength of private
schools as it is seen as a value-added contribution to the development of well-rounded individuals.
However, these effects are not directly captured in NCEA data.
Thirdly, achievement measured by NCEA data is not the same as learning. John Hattie’s research
highlights that the greatest influence on learning is the expectations of students and teachers and the
largest barrier to student learning is within-school variability. He argues “in the course of my Visible
Learning research, I have found that the greatest influence on learning is the expectations of the
students and the teachers. Further, recent research by Rubie-Davies (2014) shows that a teacher typically
has high, medium or low expectations for all the students in their class, with the students of high-
expectation teachers being very successful in achieving their teachers’ expectations and the students of
teachers with low expectations being similarly successful at making lower gains” (Hattie 2015, p. 11).
There are numerous factors (such as teacher’s expectations, and student characteristics such as innate
ability, family background, environment, income levels, etc.) that could explain the relatively better
performance of independent versus state system schools. Our empirical research (discussed in Section
6) also shows that there is uneven NCEA performance among state and state-integrated schools.
Educational researchers have used a range of research tools to remove or account for the
socioeconomic factors in private schools that might account for the higher levels of achievement
observed. One conclusion is that when interpreting the results of any of these analyses, it should be
borne in mind that private schools constitute a heterogeneous category and may differ from one
another as much as they differ from public schools. Public schools also constitute a heterogeneous
category. A typical finding is that the variation in achievement within a school, and between schools of
the same type, is greater than the differences between public and private schools (US Department of
Education National Centre of Education Statistics 2006). Consequently, while the data is consistent with
higher achievement by independent schools, an overall comparison of the different broad types of
schools is of modest utility.
Some country studies show that the presence of independent schools raises outcomes for all schools
The independent sector provides important benchmarks against which public schools can measure
themselves in areas such as innovation, diversity, and curriculum delivery. This acts as a stimulus for
state schools. The existence of private schools could affect those ‘left behind’ in public schools. For
instance, (Hepburn and Robson 2002) cite evidence of average test scores being higher in Canadian
provinces that fund independent schools than those in provinces that do not. This differential is made
up of higher absolute test scores for those who attend independent schools, and higher average test
scores for those in state schools relative to state school students in other provinces. Robson and
Hepburn explain the latter point by claiming that when faced with competitive pressures from the
independent schools, public schools improve their programmes and performance.
The report also showed that children from low-income families attend independent schools in greater
numbers and form a higher percentage of total independent school enrolment than they do in provinces
that do not fund independent schools. There is also a weaker correlation between socio-economic
status and achievement in those provinces that fund independent schools. A larger independent school
sector did not appear to ‘skim’ the more advantaged students from the public system. Funding
independent schools seems helpful, rather than harmful, to the pursuit of educational equity.
18Similar results were reported for Sweden. Sandström and Bergström (2005) looked at how individuals in
public schools perform, after controlling for the tendency for private schools to enrol more children
from higher income and immigrant families. They found that the presence of greater competition from
independent schools’ results in better public school performance in standardised tests. More recently,
Böhlmark and Lindahl (2015) found the presence of a strong independent sector resulted in positive
development of the state sector.
By contrast, other country studies found no positive impact on the overall performance of national
education system. Looking at US experience for example, Urquiola (2016) concludes the literature “has
produced mixed results rather than a distinct sense that greater competition raises achievement”.
Overall the empirical literature finds mixed results. Independent schools do appear to benefit the
individual students who attend them, and these results are achieved at lower cost to the public purse.
However, there is no systematic evidence that independent schools help to raise the level of
performance of the national school system as a whole across countries.
3.5 Independent schools reduce government spending on education
Independent schools divert those willing to pay away from the publicly financed system, freeing up
funds for those remaining, without compromising outcomes. In 2018, government funding for
independent schools was equivalent to 19% of the per pupil operating and salary costs of educating
children in the state sector. Independent schools covered the remaining 81% of operating costs as well
as all their own capital costs. This provides considerable savings for the government including $174m in
operating and salary expenses calculated from the 2018 roll and funding data (Education Counts 2019
and Ministry of Education 2019c). 3
For a full account of the fiscal effects of independent schools see Appendix C.
Benefiting government resource allocation
As a result, the independent sector diverts pupils away from the public system, freeing up valuable
resources. Channelling individuals into the independent sector is one way to redirect resources to other
parts of the public education system.
3.5.1 Other countries approach independent education differently
A variety of funding and regulatory arrangements exist for non-government schools around the world,
often shaped by constitutional and historical factors (Nesdale 2003). In this section we discuss
government intervention in schools from several countries that we compare to ourselves, with a focus
on funding arrangements. Figure 5 shows the diversity of funding and independent schools’ roll share
among our counterparts.
3 Operating and salary expenses saved = Student roll at independent schools × (Operating and salary expenses per student at state schools - Per student
funding to independent schools)
19Figure 5 Private school roll compared to funding
Funding for private schools compared to public school funding, per student operational and salary expenses
60%
Bel gium
50%
Private school roll as a % of total
40%
Aus tra lia
30%
Bri ti sh Columbia Bri ti sh Columbia
20% Bri tish Columbia
group 3 a nd 4 group 2 group 1 Denmark primary
Qubec Denmark secondary
10% UK a nd Wales
Onta ri o Ma ni toba Netherlands
Al berta 1
Nova Scotia NZ NZ Al berta 2 Sa s katchewan 1
0%
Newfoundland Sa s katchewan 2
New Brunswick Pri nce Edward Island
-10%
0% 20% 40% 60% 80% 100% 120%
Private school per student funding as a share of state school funding
(operational and salary expenses)
Notes
1 New Zealand is highlighted in pink.
2 Canadian provinces’ data is the total private school roll – roll breakdowns for different funding groups were unavailable.
3 Groups for British Columbia refer to group definitions of private schools in the province.
4 The private school roll for Denmark is separated into primary and secondary schools.
Source: NZIER using data from Independent Schools Council of Australia 2019, Independent Schools Council 2019, Milke 2014,
MacLeod 2018, OECD 2017, OECD 2014c, OECD 2014a, The World Bank 2019a, The World Bank 2019b
Australia
Without state integration, arrangements for independent schools in New Zealand would probably look a
lot like Australia’s. Independent schools (including catholic schools) also make up a higher share of the
school roll in Australia with 34% of school enrolments (Independent Schools Council of Australia 2019)
compared to 3.7% in New Zealand (Education Counts 2019).
Independent schools in Australia also receive more funding than in New Zealand. Australian state and
central governments pay for 46% of school’s operational costs and 10% of capital expenses
(Independent Schools Council of Australia 2019). Australia reflects a number of factors in its funding
allocation formula, including community income and diversity (Department of Education 2019).
England and Wales
In England and Wales, independent schools do not receive general government subsidies, and run on
fees and donations alone (GOV.UK n.d.). Although many independent schools do follow the national
curriculum and assessment schedule (Independent Schools Council 2019), the government does not
require independent schools to do so (GOV.UK n.d.). As in many countries, funding is often tied to
government involvement in school regulation (Nesdale 2003).
20United States
Funding and regulation of independent schools varies from state to state in the United States (US) (U.S.
Department of Education, Office of Innovation and Improvement, and Office of Non-Public Education
2019).
Although independent schools are traditionally funded through tuition fees, donations, grants, tax
credits, and other endowments (Nesdale 2003), school voucher programmes are becoming more
common in the US (Fiddiman and Yin 2019).
Voucher programmes are an effort to enable more access to independent schools (Fiddiman and Yin
2019). The state provides families with a voucher covering the equivalent fees of a public education to
use at an independent school (Fiddiman and Yin 2019). Milwaukee and Ohio adopted voucher
programmes to improve educational outcomes in their states by shifting students from “low
performing” public schools to (in this case) more resourced independent schools (DeAngelis and Hoarty
2018).
However, as independent schools are often less regulated, many opponents argue that the voucher
system empowers independent schools to discriminate among pupils on a racial basis. Meanwhile many
proponents are also minorities and people from disadvantaged communities who don’t feel well-
serviced by public schools in their area. Voucher programmes currently operate in 29 states (Fiddiman
and Yin 2019).
Canada
As with the United States, regulation and funding for independent schools varies from province to
province in Canada. Alberta provides independent schools with grants covering 60-70% of public-school
operating expenses (Van Pelt and Clemens 2015), so long as the schools have certified teachers and a
certified principal (Government of Alberta 2019). British Columbia sits in a middle ground and provides
independent schools with funding if more than 50% of their students are Canadian citizens (Government
of British Columbia 2019). Funding in British Columbia is also higher if the independent school has
operating costs lower or equal to public schools in the province (Government of British Columbia n.d.).
Meanwhile none of the Atlantic states nor Ontario provide government funding to independent schools
(Milke 2014).
Netherlands
In the Netherlands, all schools are funded the same way, regardless as to whether they are public or
independent schools (OECD 2014c). Equal funding has been in place since 1917 and ties in with the
Dutch Constitution which sets out that schools should have the freedom to set their own educational,
philosophical, and religious principles, their own content and teaching methods, and do not need prior
approval from the government to exist (Ministerie van Onderwijs 2014).
The Netherlands has high rates of student achievement but also one of the longest periods of
compulsory primary and secondary education. Education in the Netherlands is compulsory for everyone
between the ages of five and 18 (inclusive) (OECD 2014c).
Belgium
Belgium has a similar approach to regulating schools as the Netherlands (OECD 2017). Most (99%) of the
private schools in Belgium receive funding equal to public schools (OECD 2017).
Denmark
Education is compulsory for children, but the Danish constitution purposefully does not to specify what
that education might be. As a result, parents can home-school their children (unrestricted) or send their
children to private or municipal public schools (Nesdale 2003).
21The Danish Ministry of Education administers national and international assessments for both private
and public schools, but generally school regulation takes place at the municipal level (OECD 2014a). Like
New Zealand state schools, schools are governed by boards of parents, teachers, and student
representatives (OECD 2014a).
Government funding for private schools is set to ensure that total funding (government plus parental or
other external contributions) for private and public schools is the same (OECD 2014a). Older research
indicates that funding for private schools is high at 80-85% of school expenses (Nesdale 2003).
France
Almost all private schools receive state funding for teacher salaries (OECD 2014b). A core goal is
maintaining education equity between territories in France and public funding is distributed more to
schools and areas where education is falling behind – regardless of whether the school is public or
private (OECD 2014b).
How do these arrangements compare?
The large variety of arrangements makes a general comparison difficult. Differences in the scale of the
respective economies, and responsibility for education provision, may also make comparisons difficult.
Larger economies are likely to have proportionally more wealthy individuals and more entrenched
fundraising and donating networks that may generate larger sums to donate to private schools, reducing
the need for government funding (see Figure 5). These factors all affect how likely parents are to send
their child to an independent school, given costs – their elasticity of demand (see Appendix C for further
discussion).
Nevertheless, some relevant themes do emerge. Funding arrangements in the US, England, Wales and
eastern parts of Canada are less generous than those in New Zealand. However, the growing adoption of
voucher systems in some US states suggest a shift to more funding for private schools to improve access
to education. The Local Education Authorities in England have experimented with contracting some
school operating functions to private concerns. Both of these actions are in response to concerns with
the public system about diversity in provision, school improvement, innovation and parental choice.
In contrast, funding arrangements in countries such as Australia, France, the Netherlands, Belgium,
Denmark, and parts of Canada aim to equalise access to education and thus fund private education as
much or close to as much as public schools.
Nesdale (2003) also observed a positive relationship between the level of government funding for
independent schools and the extent of regulation imposed on such schools. This is especially evident in
the case of France and the Netherlands where funding is tied to private schools agreeing to provide a
certain standard of education or curriculum. In the case of New Zealand, private schools must be
registered.4 The criteria for registration states that a private school must have:
• Suitable premises, staff, equipment, and tuition standards
• A curriculum
• Fit and proper managers
• At least nine students.5
4 Section 35A of the Education Act 1989.
5 Section 35C of the Education Act 1989.
223.6 Summary
Independent schooling makes a significant contribution to the government’s goals by enabling public
resources to go further, by improving individuals’ access to quality education, and by more efficient
allocation of resources. A well-struck balance between the two sectors can improve the overall
performance of the education sector as a whole.
4 Funding for independent schools in New Zealand
Funding for independent schools in New Zealand has ebbed and flowed over time.
Historically, New Zealand has not witnessed the kind of bipartisan political support for government
funding of independent schools seen in Australia (Nesdale 2002). Although not always, government
funding rates to independent schools tend to relate to the government of the time. Episodes of lower-
level funding generally coinciding with ‘centre-left’ governments and higher levels generally coinciding
with governments of the ‘centre-right’.
Figure 6 Per student funding for independent schools 1996–2017
Nominal funding over time, unadjusted, with key policy changes in grey
$3,000
New Cap on Some grants and
funding funding $10m budget supplementary
$2,500 formula $5m budget top up funding removed
top up
$2,000
$1,500
$1,000
$500
Funding
increases
$0
1996 1998 2000 2002 2004 2006 2008 2010 2012 2014 2016 2018 2020
Events Years 1-6 Years 7-8 Years 9-10 Years 11+
Source: Education Counts 2019, Ministry of Education 2019c, Secretary of the Cabinet 2009
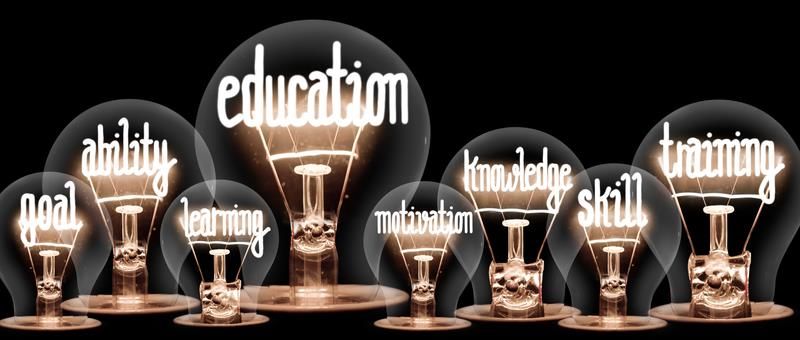
Figure 7 and Figure 8 show the different policy changes affecting increases and decreases in funding for
independent schools (without any adjustment for inflation). In contrast, Figure 9 shows how inflation
further erodes any funding for independent schools particularly since funding has been under a nominal
cap since 2000.
23Figure 7 How did we get here?
A history of funding for independent schools on New Zealand, borders represent Labour (red), National (blue), or both (black) governments, respectively
The beginning of state contributions Building funding back up in the 90s Working under a cap since the millennium
1877 The New Zealand Education Act 1995 Government changes methodology for 2000 Government caps funding at nominal level
•Crea ted a national system of state primary s chools made calculating funding •Ca pped funding equivalent to 42% of s tate funding per pupil
no provi sion for the a id of independent schools. •Ba s ed on per student a verage cost of state s ector
•Intended to i ncrease funding in l ine with s tate funding
1877-1969 2000-2008 Real spending on independent schools
•Governments s upply s ome goods a nd s ervices to decreases
Independent schools e.g. school milk, free textbooks (after 1996 new funding formula implemented •Equi valent to 20% of total s tate costs per pupil
1957) a nd access to a dvisory s ervices
1969 State resourcing 1998 funding now higher at 2009 $10m budget top up
•Incl udes gra nts for operational expenses and furniture a nd •25% of tota l state costs per pupil for students in years 1-10 •Equi valent to 23%-24% of state funding per pupil
equipment for new classrooms •40% of s ta te costs per pupil for s enior s econdary s tudents •Incl uding $2.6m for s cholarships to s tudents from l ow-
i ncome families
1970 State funding provided 1999 Further increases for younger students 2009 onwards Real spending on independent schools
•To i ndependent s chools •30% of s ta te funding per year 1-10 s tudents
decreases
•Equi vlaent to 20% of teacher s alaries •no cha nge for year 11-13 s tudents •Equi valent to 19% of total s tate costs per pupil
1970-1975 funding increases 2017 The Education Act 1989 incorporates the Private
•To 50% of tea cher salaries in i ndependent schools by 1975 Schools Conditional Integration Act 1975
•Strea mlines how priva te schools ca n be i ntegrated
1975 Private Schools Conditional Integration Act 2017 Scholarships for low-income families abolished
•Ma ny pri va te schools integrated i nto the state system •Government abolishes scholarships for l ow-income fa milies
under this Act to a ttend i ndependent schools
2019 Grants and supplementary payments removed:
1985-1990 State funding reduced •Ki wi sport •NCEA Gra nt
•Mā ori La nguage •Te Kura (previously the
Progra mme funding Corres pondence School)
2020 Funding to drop
•Equivalent to 19% of total state funding per pupil
1990 State funding at zero
Notes
1 RE: 2019 Grants and supplementary payments removed. Te Kura funding continues for Ambury Park Centre, Odyssey House and Hohepa School.
Source: Cook 2012a, New Zealand Government 1975, Ministry of Education 2017, Ministry of Education 2019a, Board of Trustees of Te Aho o Te Kura Pounamu 2018, The
Treasury 2009, The Treasury 2019b
24There is a risk that current funding arrangements for private schools
will lead to a continued gradual decline in the share of total
enrolments in the private school sector and ongoing pressure by a
number of private schools for integration into the state sector
(Ministry of Education 2016, 4)
The pooled funding for independent schools has been under a cap since 2000. This cap has
placed a fiscal limit on how much the government spends on independent schools in New
Zealand, but also creates a large degree of uncertainty for independent schools (around the
viability of their business) and for families (around whether they can afford to send their
children to independent schools). This is because per student funding depends on how
many students attend independent schools (see Figure 8).
As funding is no longer strictly benchmarked against state school expenses, the real value
of funding decreases in real terms until concerns build around the overall financial viability
of the sector and a specific decision is made to increase the value of the funding pool
(Ministry of Education 2016, 4), as in 2009.
Figure 8 Funding for independent schools varies under a cap
Per-student funding vs. funding cap, both GST exclusive and inflation adjusted
$2,500 $60m
$2,200
$50m
$40m
$1,900
$30m
$1,600
$20m
$1,300
$10m
$1,000 $m
1999 2001 2003 2005 2007 2009 2011 2013 2015 2017
Per-student funding Total funding cap (secondary axis)
Source: Various, including Education Counts 2019, Ministry of Education 2019c, The Treasury 2009
Meanwhile per student funding for state and state-integrated schools has increased
steadily since 2005 (see Figure 9).
25You can also read