MAPPING THE VOID: TWO-SPIRIT AND LGBTIQ+ EXPERIENCES IN HAMILTON
←
→
Page content transcription
If your browser does not render page correctly, please read the page content below
MAPPING THE VOID:                                                                   A RESEARCH PARTNERSHIP AMONG:
                                                                                    McMaster University, The AIDS Network

TWO-SPIRIT AND LGBTIQ+
                                                                                    and Hamilton community researchers who
                                                                                    identify as Two-Spirit and Lesbian, Gay,
                                                                                    Bisexual, Transgender, Intersex, Queer
EXPERIENCES IN HAMILTON                                                             JUNE 11, 2019

                                                     Hamilton, Halton, Haldimand,
                                                          Norfolk and Brant

 This research was supported by the Social Sciences and Humanities Research Council of Canada.

    Report production in partnership with mps.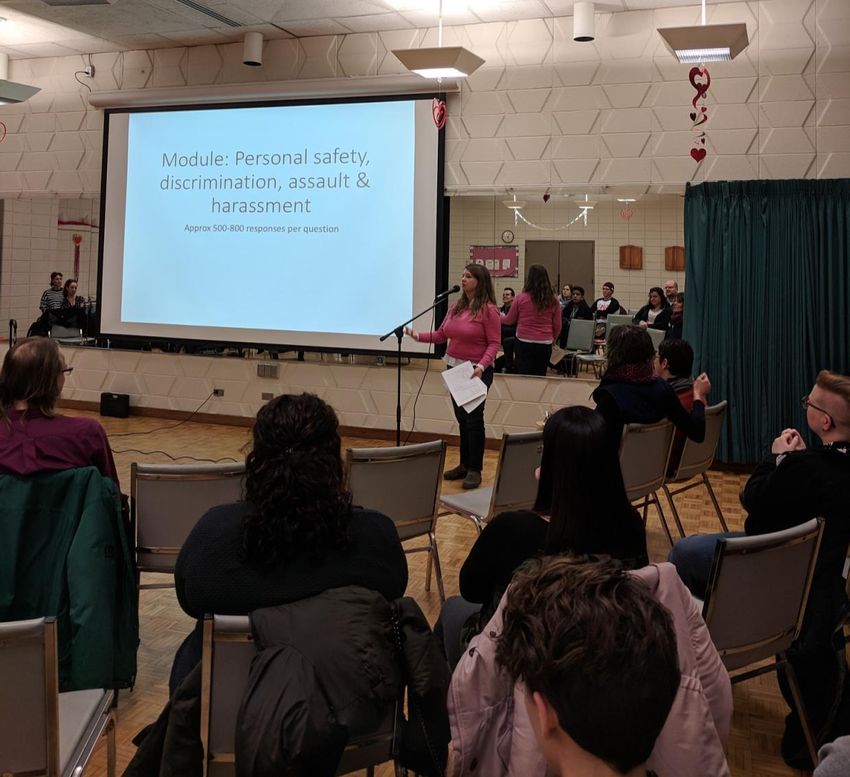
Report Authors:                                    Editor:
Suzanne Mills, McMaster University*                Cole Gately
Michelle Dion, McMaster University
Daniel Thompson-Blum, McMaster University
Chris Borst, City of Hamilton*
James Diemert, AIDS Network*

Community Researchers                              Research Assistants and Staff:
Chris Todd-Kane                                    Klara Longfellow Richards
Marina Fensham                                     Sophie Geffros
Mariko Brown-Kai                                   Leah Klein
Danielle Walton                                    Janice Lee*
Mela Pothier                                       Angela Di Nello
                                                   Namita Chhabra

*= also a member of community research advisory committee

Other advisors/contributors
Natalie Lazier, community member
CA Klassen, community member
Marlon Picken, community member
Aditya Harchand, McMaster Queer Students Community Centre
Padmaja Sreeram, McMaster Women and Gender Equity Network
Joel Guillemette, Equity Officer with CUPE 3906
Autumn Getty, Facilitator of Hamilton Trans Peer Support Group
Tim McClemont, Executive Director of The AIDS Network
Ty Laframboise, Facilitator of Support Around the Gender Experience (SAGE)
Aric Bales, Youth Council member at St. Joseph’s Youth Wellness Centre
Ian Jarvis, community member
Morgan Turnbull, community member
Lynn Turnbull, community member
Luisa Caruso, community member
Vanessa Parlette, Health Strategy Specialist with Hamilton Public Health Services
Mela Pothier, LGBT Client Advocate, North Hamilton Community Health Centre
Lyndon George, Coordinator of Yen:Tene, Aboriginal Justice Program, Hamilton Community Legal
Clinic
Samuel Mason, Staff Lawyer, Queer Justice Program, Hamilton Community Legal Clinic
Dr. Carys Massarella, Physician, St. Joseph’s Healthcare and Quest CHC
Simon Lebrun, community member
Marco Felvus, Mohawk Positive Space, Social Inc.
Ash Couillard, Human Rights and Inclusion, Hamilton Health Sciences
Rebecca Hicks, Bachelor of Health Sciences Student
Dawson Lucier, Bachelor of Health Sciences Student
Note: not all contributors are listed since some chose to remain anonymous.

                                                                                               1
Table of Contents

LIST OF TABLES ............................................................................................................................................... 4
LIST OF FIGURES ............................................................................................................................................. 6
1.0        INTRODUCTION/ SETTING THE STAGE: OUR CHANGING NEEDS........................................................ 8
   1.1 A note about terminology .................................................................................................................10
   1.2 Limitations of the study .....................................................................................................................10
2.0        A GRASSROOTS APPROACH: METHODOLOGY .................................................................................12
3.0        WHO WE ARE ...................................................................................................................................15
   3.1 Gender Identity ..................................................................................................................................15
   3.2 Sexual Orientation .............................................................................................................................17
   3.3 Age .....................................................................................................................................................18
   3.4 Race/Ethnicity and Indigeneity ..........................................................................................................19
   3.5 Immigration .......................................................................................................................................20
   3.6 Disability.............................................................................................................................................21
   3.7 Education ...........................................................................................................................................22
   3.8 Relationships ......................................................................................................................................22
4.0        OUR EXPERIENCES ............................................................................................................................23
   4.1 Education ...........................................................................................................................................24
   4.2 Housing ..............................................................................................................................................26
   4.3 Income, Economic Well-being and Employment ..............................................................................27
       4.3.1 Income ........................................................................................................................................28
       4.3.2 Economic Wellbeing ...................................................................................................................30
       4.3.3 Employment ................................................................................................................................31
   4.4 Safety in public spaces and relationship with police .........................................................................33
   4.5 Religion, Spirituality, and Faith ..........................................................................................................36
   4.6 Health .................................................................................................................................................38
       4.6.1 Physical Health Experiences and Access.....................................................................................38
       4.6.2 Mental Health .............................................................................................................................44
       4.6.3 Sexual Health and HIV.................................................................................................................48
       4.6.4 Trans Experiences and Gender-Affirming Care ..........................................................................51
5.0        COMMUNITY CONNECTION & DESIRES ...........................................................................................54
   5.1 Connection to Hamilton and Two Spirit and LGBTQIA+ community .................................................54
   5.2 Needs and desires for spaces and services........................................................................................56

                                                                                                                                                                2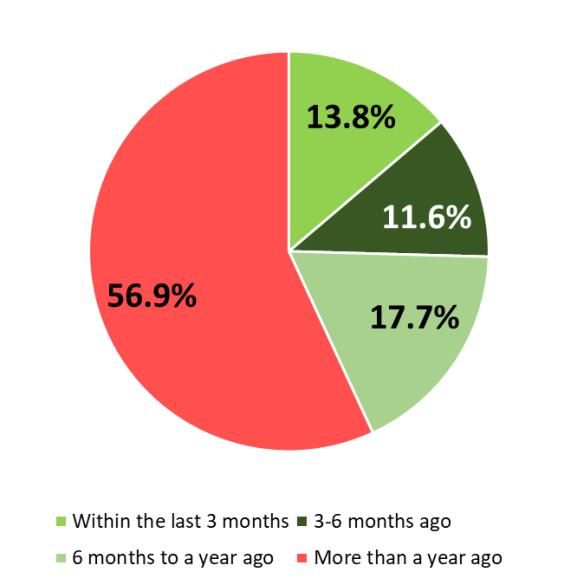
6.0 CONCLUSION..........................................................................................................................................61
   Appendix A: Hamilton survey ..................................................................................................................63
   Section 1 – General Survey (mandatory) ...............................................................................................63
       Your experiences in Hamilton.......................................................................................................67
   Section 2 – Health (optional) ..................................................................................................................70
   Section 3 – Trans Experiences (optional) ...............................................................................................75
   Section 4 – Work, Employment & Income (optional) ............................................................................77
   Section 5 – Recent Education (optional) ................................................................................................80
   Section 6 – Housing (optional)................................................................................................................83
   Section 7- Religion, Spirituality & Faith (optional) ................................................................................84
   Section 8 – Body Image, Sex, Relationships (optional)..........................................................................85
   Section 9 – General HIV-related question (optional) ............................................................................88
   Section 10 – Justice & Violence (optional) .............................................................................................89
   Section 11 – Parent / Guardian / Caregiver of child(ren) (optional).....................................................90
   Appendix B: Coding for Gender Identity..................................................................................................94
   Appendix C: Coding Sexual Orientation ...................................................................................................97

                                                                                                                                                        3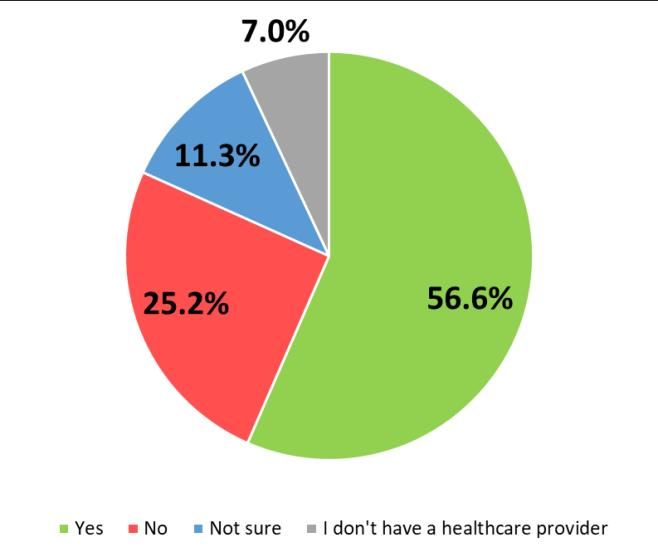
LIST OF TABLES
3.0.1   Percent of all respondents who completed each optional survey module ………………….......................15
3.1.1   Gender identity with female-identified, male-identified, and gender non-conforming categories…...16
3.1.2   Gender identity resorted into three categories………...................................................................……….16
3.1.3   Gender identity resorted into two categories. ………………………………............................................…..…16
3.2.1   Sexual orientation re-sorted into five categories. ………………….………………………………………………………..18
3.3.1   Comparison of age groups between survey participants, the population of the City of Hamilton, and
        an estimation of the Two-spirit and LGBTIQ+ population in Hamilton…………………..………………………..19
3.4.1   Survey respondents’ self-identification as “a member of a racialized community” compared with
        results for the city of Hamilton and the city of Hamilton adjusted for age……………………………………….20
3.4.2   Percent of respondents from specific racial or ethnic categories compared to results for the City of
        Hamilton…………....................................................................................................................................20
3.5.1   Percent of respondents belonging to different immigration/residence categories compared with
        results for the city of Hamilton and the city of Hamilton adjusted for age………………………..……..........21
3.6.1   Percent of participants in each gender category that identified as living with a disability……….....……21
3.6.2   Percent of participants in each sexual orientation category that identified as disabled…………………...21
3.6.3   Percent of participants in each age category that identified as living with a disability………………………21
3.7.1   Highest level of education achieved, including current students………………………………………………………22
3.8.1   Relationship status and relationship practices. ….…………………………………………………………………………….22
3.17    Percent of respondents are currently, or who have taken steps to become, a parent, caregiver or
        guardian………………………………………………………………………………………………………………….……………….………23
4.1.1   Percent of students reporting the presence of LGBT2SIQ+ efforts. ...................................……..………..26
4.2.1   Current living arrangement (not including full-time university students) …………………………….……….….26
4.2.2   Percent of respondents reporting barriers and/or discrimination in housing opportunities………..……27
4.3.1.1 Individual gross annual income of survey respondents compared to the Hamilton population as a
        whole………………………………………………………………………………………………………………………......………….……..28
4.3.3.1 Employment situation in the past 12 months. ‘Other’ includes: self-employed, on-leave, retired,
        receiving social assistance or disability, or providing care work……………………………………………..………..31
4.3.3.2 Employment situation in the past 12 months: Survey respondents compared with total Hamilton
        residents, adjusted for age…………………………………………………………………………………………………….………..32
4.3.3.3 Percent of respondents who had ever suspected they had been denied employment, fired, or passed
        over for an advancement opportunity because of the following aspects of their identity………....…….33
4.4.1   The most common locations where respondents reported discrimination on the basis of Two-Spirit
        and/or LGBTIQ+ identity. ……………………………….…………….……………………………………………………….………..34
4.6.1.1 Reasons that respondents have delayed or not sought health care for physical health issues…….……39
4.6.1.2 Percent of respondents who felt uncomfortable being ‘out’ about their Two-Spirit and/or LGBTIQ+
        identity in the healthcare settings in Hamilton…………………………………………………………………………………40
4.6.2.1 Reasons for delaying or not seeking out health care for mental health issues……………………………...….48

                                                                                                                                                         4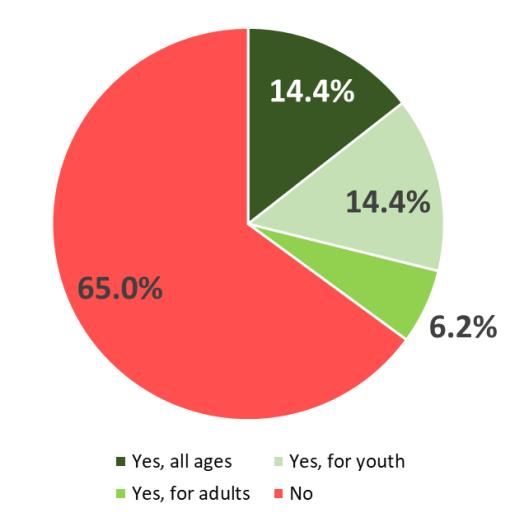
4.6.4.1 Percent of participants who completed the Trans Experiences module who indicated they had
        experienced the following with a health care provider…………………………………………………………………….53
5.2.1   Two-Spirit and LGBTIQ+ services or community that respondents looked for outside of Hamilton….57

                                                                                                       5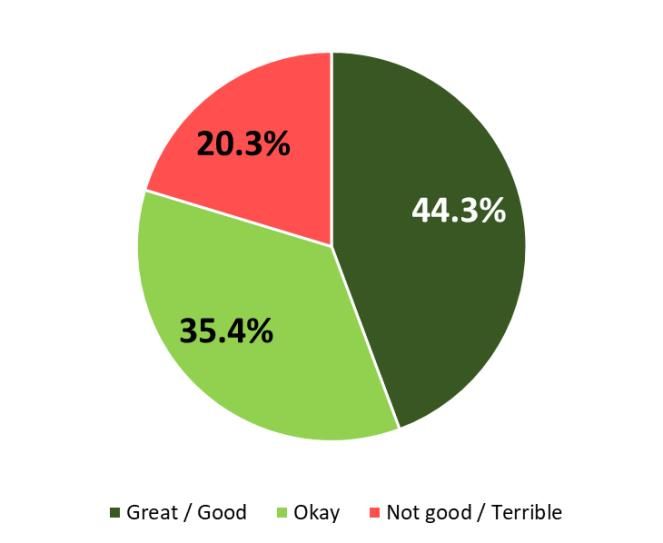
LIST OF FIGURES
3.1.1   Gender identity resorted into three categories, organized by participants’ age. ……………………………..17
3.2.1   Sexual orientation resorted into five categories, organized by participants’ age. …………………………….18
4.1.1   Percent of students reporting that their school had a safer space for 2S & LGBTIQ+ students. ……….25
4.1.2   Percent of students who felt comfortable accessing the safe space for 2S & LGBTIQ+ students. …….25
4.2.2 Percent of respondents reporting feeling physically safe, by gender identity. …………………………………27
4.3.1.1 Individual gross annual income (not including full-time university students). ………………………………….29
4.3.1.2 Individual gross annual income (not including full-time university students). ………………………………….29
4.3.1.3 Individual gross annual income (not including full-time university students). ………………………………….29
4.3.2.1 Percent of respondents who had difficulty paying for the above items in the past year (not including
        full-time university students). ………………………………………………………………………………………………………….31
4.4.1   Percent of respondents who feel unsafe being ‘out’ in the above locations, according to gender
        identity and racialization. ………………………………………………………………………………………………………………..33
4.4.2   Percent of respondents reporting that they experienced the listed forms of discrimination on the
        basis of their Two-Spirit and/or LGBTIQ+ identity in Hamilton, either frequently or occasionally. …..35
4.4.3   Percent of respondents who reported ever having experienced harassment, violence, or a hate crime
        in Hamilton, by gender identity and racialization. …………………………………………………………………………..35
4.4.4   Likelihood of reporting harassment, violence, or a hate crime by gender and racialization. …………….36
4.5.1   Perceived support for Two-Spirit and/or LGBTIQ+ identity among respondents who are currently
        practising a religion/spirituality/faith. ……………………………………………………………………………………………..37
4.5.2   The extent of loss of spiritual or faith community as a result of Two-Spirit and/or LGBTIQ+
        experienced by respondents who were currently practicing. …………………………………………………………..38
4.6.1.1 Does your current primary health care provider know that you identify as LGBT2SIQ+. ………………….40
4.6.1.3 Percent of respondents who agreed with, disagreed with, or had a neutral opinion of the above
        statements about health care in Hamilton. ……………………………………………………………………………………..41
4.6.1.4 Percent of respondents who agreed with, disagreed with, or had a neutral opinion of the above
        statements about healthcare in Hamilton. ………………………………………………………………………………………42
4.6.2.1 Self-reported ratings of overall happiness. ………………………………………………………………………………………45
4.6.2.2 Self-reported ratings of overall happiness, by gender identity. ……………………………………………………….45
4.6.2.3 Self-reported ratings of overall happiness, by sexual orientation. ……………………………………………………45
4.6.2.4 Percent of respondents who wanted support for their mental health in the last 12 months. ………….46
4.6.2.5 Percent of respondents who wanted support for their mental health in the last 12 months, by gender
        identity. …………………………………………………………………………………………………………………………………………..46
4.6.2.6 Percent of respondents who wanted support for their mental health in the last 12 months, by sexual
        orientation. ……………………………………………………………………………………………………………………………………..47
4.6.3.1 In general, how were your experiences accessing sexual health related services? …………………………..49
4.6.3.2 Time since last HIV test for all respondents who indicated that they ever been tested for HIV ……….50
4.6.3.3 Time since last HIV test for all respondents who indicated that they ever been tested for HIV, by
        sexual orientation…………………………………………………………………………………………………………………………….50
4.6.3.4 Percent of respondents who engaged in bareback sex. ……………………………………………………………………51
4.6.4.1 Percent of transgender respondents who were aware of trans mental health services in Hamilton ..52

                                                                                                             6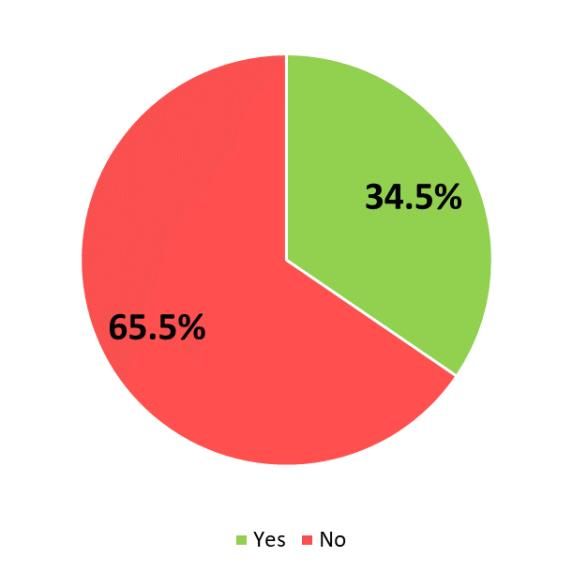
4.6.4.2 The furthest distance that transgender respondents have travelled for trans-related physical health
         care……………………………………………………………………………………………………………………………………………….. 52
5.1.1   Percent of respondents who report varying senses of connection to Hamilton. ………………………………54
5.1.2   Sense of connection to Hamilton, by age. ……………………………………………………………………………………….55
5.1.3   Percent of respondents who feel or do not feel a sense of community amongst Two-Spirit and
        LGBTIQ+ people in Hamilton. …………………………………………………………………………………………………………..55
5.1.4   Percent of respondents who feel or do not feel that they are a part of a Two-Spirit and/or LGBTIQ+
        community in Hamilton. ………………………………………………………………………………………………………………….55

                                                                                                          7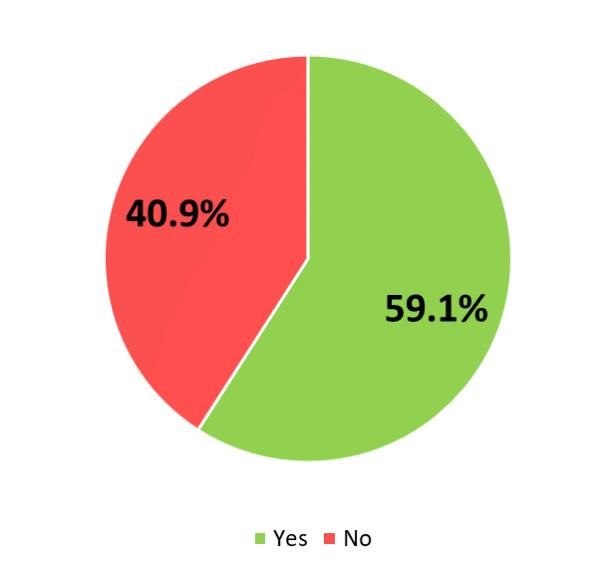
1.0 INTRODUCTION/ SETTING THE STAGE: OUR CHANGING NEEDS
In September of 2016, the Steel Lounge – a gay restaurant and bar – closed its doors. Earlier that
year, The Well: Hamilton’s LGBTQ+ Community Wellness Centre shut down after 10 years, as
had the Embassy Nightclub, which had served our communities younger patrons since the mid-
90s. For the first time in decades, Hamilton’s Two-Spirit and LGBTIQ+ communities were
without any community space to call their own. Without visible, dedicated public spaces, there
was a sense that while Hamilton may be home to queer people, it lacked queer community – at
best, it was now much harder to find. While the sustainability of any particular business or social
service should not be taken as a good indicator of the health of the communities it serves, there
could be little doubt that these closures pointed to changes in the needs of Two-Spirit and
LGBTIQ+ Hamiltonians. The closure of dedicated Two-Spirit and LGBTIQ+ social spaces is not
unique to Hamilton – it has been occurring in cities across North America and Europe.
To some degree, the decline of Two-Spirit and LGBTIQ+ spaces, particularly commercial ones,
has occurred alongside advances in the legal recognition of our communities rights, as well as
the more widespread acceptance of people of diverse sexual orientations and (to a lesser extent)
gender identities in society. Sexual orientation was recognized as a protected ground under the
Charter of Rights and Freedom in 1995, leading up to the recognition of same-sex marriage in
2005, and to the extension of rights to adopt and access assisted reproduction. According to
CROP polling firm, as many as 75% of Canadians were in favour of same sex marriage in 2017 1
(CBC, 2017). This means that many people still do not support equal rights for Two-Spirit and
LGBTIQ+ people, and some may be hostile towards them. The same poll found that three
quarters of Two-Spirit and LGBTIQ+ people had experienced bullying. This lack of complete
acceptance also takes a toll on mental health; for example, numerous studies have found that
Two-Spirit and LGBTIQ+ youth, particularly those who identify as transgender, have a suicide
risk several times higher than that of cisgender, heterosexual individuals 2 (di Giacomo et al.
2018).
Shifts in acceptance have not been equally beneficial for all members of Two-Spirit and
LGBTIQ+ communities. Gender expression and gender identity only became protected grounds
under the Canadian Human Rights Act in 2017, and in Ontario’s Human Rights Code since
2012, and transgender people continue to face structural barriers, discrimination and violence
that result in negative health outcomes. Moreover, the CROP poll cited above found that
racialized people were less likely to be accepted by family and friends. In other words, while
some members of our communities – notably affluent, white, able-bodied, middle-class lesbians
and gay men – may not feel that they need dedicated community spaces, this is not true for many
others – particularly those who are transgender, racialized, Indigenous, living with disabilities,
and/or living in poverty. Because people’s identities are composed of multiple intersecting
aspects, many members of Two-Spirit and LGBTIQ+ communities face intersecting barriers
based on race, ability, age, and income. For these groups, services and spaces are critical and

1 CBC 2017. For Canada's LGBT community, acceptance is still a work in progress, survey suggests CBC News ·
Posted: Aug 09, 2017 11:14 AM ET | Last Updated: August 9, 2017 retrieved April 3 rd, 2019,
https://www.cbc.ca/news/canada/montreal/canada-lgbt-community-survey-1.4240134
2
  di Giacomo, E., Krausz, M, Colmegna, F., Aspesi, F. and M. Clerici. 2018. Estimating the Risk of Attempted
Suicide Among Sexual Minority YouthsA Systematic Review and Meta-analysis. JAMA Pediatr. 172(12):1145-
1152. doi:10.1001/jamapediatrics.2018.2731

                                                                                                               8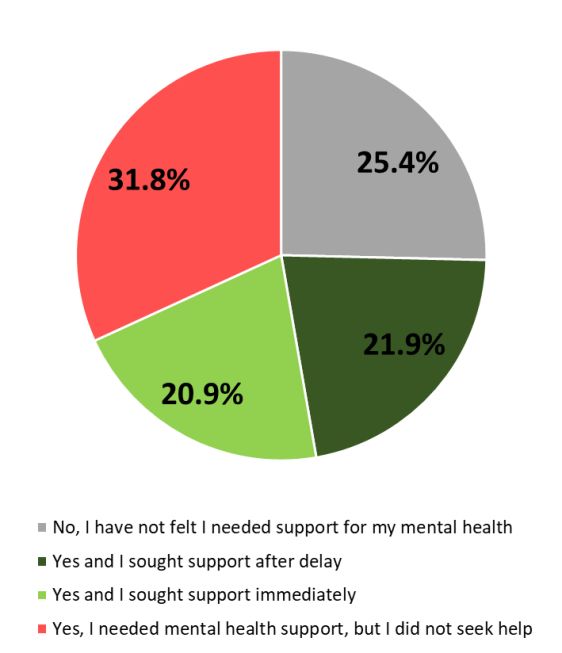
need to continually adapt to their specific needs (Oswin 2008; Nero 2005; Manalansan 2005;
Doan 2007).
In the fall of 2016, when we first began developing this study, there was no permanent, public
social space for Two-Spirit and LGBTIQ+ community members, and very few services designed
to assist them. Since this time, several social service organizations have begun to fill the void by
providing services for Hamilton’s Two-Spirit and communities. The AIDS Network, which since
its inception in 1986 has always provided services to Hamilton’s diverse queer communities, has
responded to the recent decline in spaces and services by expanding its mandate to provide more
generalized, non-AIDS related programming. The AIDS Network became a formal partner on
the project in the fall of 2017 and intends to use the information from the study to tailor their
current services more towards the needs of Two-spirit and LGBTIQ+ communities. The
information will also be used to assess whether additional services are needed.
This report builds on previous studies within Hamilton’s Two-Spirit and LGBTIQ+
communities. In partnership with Hamilton Pride Festival Inc., the Social Planning and Research
Council (SPRC) of Hamilton conducted a needs assessment report in 2006-7. This involved a
survey at Pride and in various community locations, with multiple follow-up focus groups.
Numerous community members were involved in its design and implementation. The report was
well-received by the community but received a small number of responses and covered a limited
range of needs. A subsequent 2016 study was more limited, conducted with few resources and
short timelines. Consisting of only a handful of focus groups, few community members were
involved in its design, implementation or response. This update ignited a community
conversation within Hamilton’s Two-Spirit and LGBTIQ+ communities about lack of services
and meaningful engagement of issues facing our diverse communities. During two town hall
meetings in the fall of 2016 and the winter of 2017, there was discussion of the need for a more
comprehensive, bottom-up, needs assessment that would provide a detailed picture of the
changing realities of life for Two-Spirit and LGBTIQ+ Hamiltonians. The team behind Mapping
the Void set out to meet this need.
Mapping the Void aimed to capture the full range of Two-spirit and LGBTIQ+ experiences,
especially those of traditionally marginalized populations. By exploring a variety of dimensions,
the project aimed:
       1. to engage Two-spirit and LGBTIQ+ communities in Hamilton in the process of
       designing and implementing a survey;
       2. to describe the lived experiences of Two-Spirit and LGBTIQ+ people; and
       3. to deduce what services, spaces, and institutional changes are needed to meet the needs
       of Two-Spirit and LGBTIQ+ people in Hamilton.
The rest of this report is divided into five sections. We begin by describing our methodology
(Section 2.0) and how community members shaped the scope and approach of the survey. In
Section 3.0 – “Who We Are” – we provide a snapshot of Hamilton’s Two-Spirit and LGBTIQ+
communities and compare the characteristics of survey respondents to the greater Hamilton
population. Section 4.0 – “Our Experiences” – describes community-members’ experiences in a
wide variety of spaces and with diverse institutions, organizations and social services. Section
5.0 – “Community Connections and Desires” – examines how Two-Spirit and LGBTIQ+ people

                                                                                                   9
generally feel about Hamilton, as well as what services they leave the city for. We end with
Section 6.0 – “Conclusions” to provide some thoughts about the study’s findings and the future
for Two-Spirit and LGBTIQ+ people in Hamilton.
1.1 A note about terminology
Language is important because it can be used to affirm or dismiss people’s identities and lived
experiences. Affirming language is also critical to ensuring that everyone under the broad
umbrella of gender and sexual minorities is included. Having said this, language is always
evolving to better represent the many facets of our diverse communities. As a result, there are
many different views on how gender and sexuality should be represented. As a result of feedback
from the town hall session, we have decided to change the language used in the report from the
original terms used in the distributed survey. When designing the survey, we used the initialism
LGBTQ2SIA+ communities. Two-Spirit and LGBTIQ+ is used throughout the report, and
LGBTQ2SIA+ is used when the report makes reference to the specific wording of survey
questions that were asked.
Since the time of conducting the study, Two-Spirit members of our communities, requested that
Two-Spirit be separated from the initialism and written in full before the rest of the initialism
This change reflects our desire to de-colonize our community practices by ensuring that Two-
Spirit members are not hidden within the initialism, and to affirm that the marginalization of
Two Spirit people in our society is not a result of Indigenous cultural tradition, but rather an
extension of the settler-colonial marginalization of Indigenous people as well as all people of
diverse sexual orientations and gender identities. We also hope that writing ‘Two-Spirit’ out
fully helps to educate people within and outside of Two-Spirit and LGBTIQ+ communities in
Hamilton about the presence and importance of Two-Spirit people. We must also acknowledge
that while this choice in language represents our commitment to emerging best practice and
respect for the direction received by our communities in consultation, that it could give the
impression that this study includes meaningful data relating to people who identify as Two
Spirit, which is unfortunately not the case. Two Spirit respondents represent too small a group in
our sample to make any meaningful observations or recommendations specific to Two Spirit
people, and we strongly recommend more research is done specifically examining the needs of
Two Spirit people in Hamilton.
Also note that the survey used the term “racialized minorities” as synonymous for people of
colour. Although there is emerging literature in critical race theory that characterizes all people,
regardless of skin colour as “racialized”, for the purposes of this report, the language will be
“racialized people” or “people of colour” to denote all people who are not white and “white
people” to denote people who did not self select into categories indicating racial minority or
racially marginalized status.
1.2 Limitations of the study
We recognize that life experiences are not only the result of someone’s gender identity and/or
sexual orientation but also the product of the how these intersect with other social markers such
as ability, income, being Indigenous, or whether or not a person is racialized. Where possible, we
compared outcomes among distinct populations under the Two-Spirit and LGBTIQ+ umbrella.
However, this was not always possible, both because of the limitations of our sample and
10because of the small numbers within some categories in the overall surveyed population. Of
particular note, the numbers of trans women, Two-Spirit LGBTIQ+ people, and older adults
(64+) were too small to be analyzed. We recommend that future studies use sampling strategies
particularly targeted to studying the experiences of these groups.
112.0 A GRASSROOTS APPROACH: METHODOLOGY
The research for this report emerged from community discussion and was developed and
implemented by community members. In this sense, every aspect of the research, including the
research questions themselves, reflect the values and priorities of Two-Spirit and LGBTIQ+
people living in Hamilton. The project therefore engaged a community-based participatory-
research approach to building and implementing the survey.
The project began as a response to two town hall meetings, which took place in October 2016
and January 2017. These broadly publicized meetings brought Two-Spirit and LGBTIQ+
community members together to discuss the future of research involving their communities in
Hamilton. Interested participants were invited to form a research steering committee. To keep to
a commitment of openness and inclusion, anyone who identified as Two-Spirit or LGBTIQ+ was
welcome to join the steering committee at any point during the research, as long as they lived or
worked in the Greater Hamilton Area.
Early on, the steering committee decided to use an online survey method, believing that it would
encourage the greatest participation from Two-Spirit and LGBTIQ+ people who are often
considered a “hidden population”. This method was thought to be beneficial in reaching people
who may not be ‘out’. The steering committee spent six months drafting questions and
consulting with over 30 key informants about what questions should be asked and how they
should be worded. Key informants included Two-Spirit and LGBTIQ+ people working for
organizations serving Two-Spirit and LGBTIQ+ people, as well as individuals from social
groups not represented by the steering committee.
Those who participated in this step of survey formation were incredibly productive! The number
of questions they came up with made for an overly long survey, so at this stage the survey was
divided into sections to make participation easier. Demographic questions, as well as questions
that were identified as having the highest priority were included in a General Survey, which all
survey participants were required to complete. After completing the General Survey, respondents
were then able to choose whether or not to participate in several sub-surveys that would capture
more detailed information about a variety of topics. These included: Health; Trans Experiences;
Work, Employment, and Income; Recent Education; Housing; Religion, Spirituality, and Faith;
Body Image, Sex, and Relationships; general HIV-Related Questions; Justice and Violence; and
Parent/Guardian/Caregiver of Children.
The survey was open to anyone over the age of 16 who identified as ‘LGBT2SIQ+’ (or was
romantically or sexually involved with someone of the same gender) and who also lived, worked,
or played in the City of Hamilton. The survey was launched on the LimeSurvey platform hosted
by McMaster on June 15th, 2018.
The success of the project depended heavily on reaching a large and diverse sample of Two-
Spirit and LGBTIQ+ community members, spanning dimensions of age, race, class, disability,
and HIV risk factors, as well as geographic coverage of Hamilton. We used $5 gift cards and a
draw for an iPad to incentivize participation. The research team promoted the survey in three
main ways. First, we relied on our own personal networks including e-mail lists, word of mouth
and social media. We also promoted the survey at Two-Spirit and LGBTIQ+ community events,
spaces and groups (including Pride Events, Queer Pub Night, Cedars Campground, SAGE,
12Hamilton’s Trans Youth Support Group, PFLAG and Speqtrum). One of our most successful
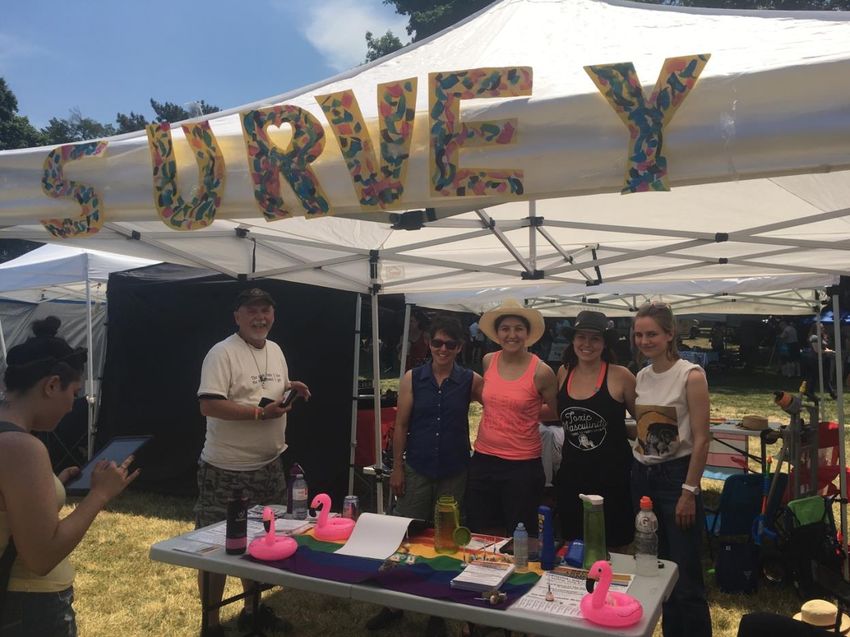
outreach endeavours came from having a survey booth at Hamilton's Pride Festival in June 2018,
where individuals could fill out the survey on-site on one of five iPads. Hundreds of leaflets were
handed out over the course of the day encouraging engagement. Last, we promoted the survey
using posters in public spaces such as Hamilton Public Library, grocery store bulletin boards and
coffee shops. Paper surveys were available at The AIDS Network and at the North Hamilton
Community Health Centre – now known as Compass Community Health - to allow people
without Internet access to participate. To refer to a paper copy of the survey as they were printed,
please see Appendix A.
The survey remained open until September 30th, 2018, at which point responses from 906 unique
individuals had been collected. Data was analyzed from October 2018 to February 2019.
Responses to demographic questions that allowed multiple answers were recoded into larger
categories for analysis.
On January 31st, 2019, The AIDS Network, Speqtrum and the YWCA partnered to organize a
town hall meeting with Hamilton’s Two-Spirit and LGBTIQ+ communities. The aim was to
present initial findings and solicit community feedback for the final report. This meeting, which
was attended by approximately 40-50 people despite very cold temperatures, informed additional
analysis as well as the overall direction of the final report. In general, attendees called for greater
information about some demographic groups, such as people living with disabilities and older
13adults. There was also interest in analyzing data with university students removed because
university students were over-represented in the sample and some thought that their presence in
the sample might under represent discrimination and over represent access to resources and
support. Others also requested more information about mental health, police interactions, as well
as insignificant and/or positive data to frame other results. The research team responded to these
requests wherever possible. As mentioned in the limitations above, there were times when the
number of responses became too small to provide an accurate picture of what specific groups
experience.
143.0 WHO WE ARE
This section describes the demographic characteristics of those who responded to the survey and
compares these characteristics to those of the population at large. These characteristics are
interesting in themselves, since there is no good existing source of demographic information
about Hamilton’s Two-Spirit and LGBTIQ+ population. Just as importantly, this section
identifies groups that we heard from more than we might have expected and groups that we
heard from less than we would have hoped for. Although we heard from many more people than
any local needs assessment has ever achieved before, there are still limitations to be aware of.
The survey received a total of 906 valid responses. On the basis of national survey numbers 3, the
total size of Hamilton’s Two-Spirit and LGBTQ+ population, 16 years of age or older, should be
in the order of 27,000. That means we heard from about 3.3% of the whole community – about 1
in 30.
We wanted to hear from people who ‘live, work, study, or play in Hamilton’, since we know that
as a larger centre, Hamilton serves as a cultural, economic and services hub for people living in
the region more broadly and that Hamilton may be a critical access point for services for Two-
Spirit and LGBTQI+ people living in surrounding communities. To find out where people live,
we asked for the first three digits of their postal codes. Using these partial postal codes, it was
determined that 74.7% of respondents were Hamilton residents, while 7.0% were living
elsewhere, and are assumed to either work or spend leisure time in the city (of 906). 18.3% of
participants did not provide their postal code data (of 906).
Though 906 people filled out the general survey, only a portion of these respondents filled out
additional modules. 52.5% of all survey participants also filled out at least one optional module
(of 906). Table 3.0.1 shows the percent of all respondents who completed each section.
Table 3.0.1: Percent of all respondents who completed each optional survey module. N=906
Section Respondents (%)
Health 46.0
Trans Experiences 10.7
Work, Employment, and Income 37.9
Recent Education 37.0
Housing 19.6
Religion, Spirituality, and Faith 36.0
Body Image, Sex, and Relationships 42.4
General HIV-Related Questions 23.1
Justice and Violence 34.1
Parent/Guardian/Caregiver of Children 7.4
3.1 Gender Identity
The question: “Which of the following best describes your present gender identity?” was
designed to allow survey participants to self-select their personal gender identity. Participants
3See
https://www.forumresearch.com/forms/News%20Archives/News%20Releases/67741_Canada-
wide_-_Federal_LGBT_(Forum_Research)_(20120628).pdf
15could select all that applied from a list of 20 terms, with another option consisting of a blank
space allowing participants to self-identify their gender.
One quarter (25.7%) of all 906 respondents chose two or more of the options provided. In order
to analyze participants’ shared experiences, it was necessary to regroup respondents into clear
categories. The full breakdown of gender identity categories is in Appendix B. We first grouped
participants into seven gender categories (Table 3.1.1). People were sorted into trans, non-binary
or cis categories based on their selections.
Table 3.1.1: Gender identity with female-identified, male-identified, and gender non-conforming categories. N=862
Gender identity Respondents (N) % of respondents
Female-identified 419 48.6
Cisgender women 311 36.1
Cisgender women + otherwise
gender non-conforming
marker(s) 85 9.9
Transgender women 23 2.7
Male-identified 279 32.4
Cisgender men 202 23.4
Cisgender men + otherwise
gender non-conforming
marker(s) 14 1.6
Transgender men 63 7.3
Non-binary 164 19.0
These categories were then clustered into a three-category gender identity variable (cisgender,
transgender and gender non-conforming) and a two category gender identity variable (cisgender,
transgender). Tables 3.1.2 and 3.1.3 show the results of this resorting. For more information on
this process.
Table 3.1.2: Gender identity resorted into three categories. Respondents could select multiple options. N=906
Gender identity Respondents (N) % of respondents
Cisgender 513 56.6
Otherwise Gender non- 263 29.0
conforming
Transgender 86 9.5
No response 44 4.9
Table 3.1.3: Gender identity resorted into two categories. Respondents could select multiple options. N=906
Gender identity Respondents (N) % of respondents
Cisgender 612 67.6
Transgender 250 27.6
No response 44 4.9
16Figure 3.1.1: Gender identity resorted into three categories, organized by participants’ age. N(under 25)=277, N(25-
54)=473, N(55+)=63
The relationship between gender identity and age revealed some differences. For example,
respondents over the age of 55 were more likely to self-identify using a gender non-conforming
marker (e.g. a cisgender woman selecting butch or a cisgender man selecting femme) compared
to other age groups. Conversely, respondents under 25 who selected at least one identity marker
were more likely to identify as transgender. Figure 3.1.1 shows the percentages of each age
category that identified as cisgender, gender non-conforming, and transgender.
When asked: “Does your gender identity match your gender expression?” just under half of
transgender and gender non-conforming respondents reported that their expression and identity
aligned (44.8%, of 239). However, others indicated that it only matched some of the time (50.6%
of 239), and for some, it did not align at all (4.6% of 239). This suggests that many people may
not be ‘out’ with respect to their gender identity and do not or cannot present in a way that aligns
with their identity. For some individuals this may be true all the time, and for others it may be
situational.
3.2 Sexual Orientation
As was the case with gender identity, participants could select any combination of 13 options to
indicate their sexual orientation, and/or fill in an option for additional identifiers. One third
(31.9% of 906) chose a combination of two or more options to reflect their attractions to others.
Again, these responses were re-sorted for analysis. Participants were re-sorted into five
categories (See Table 3.2.1. and Appendix C).
There was a relationship between participants’ age and how they self-identified in terms of their
sexual orientation. Participants under the age of 25 were more likely to select options that were
classified as bisexual/pansexual and were less likely to select ‘lesbian’ or ‘gay’ compared to
those older than 24 (see Figure 3.2.1). Since the categories used to indicate sexual attraction to a
particular gender (lesbian, gay and heterosexual) presumed that respondents were situated on one
side of the gender binary, people who identified as non-binary were more likely to choose
bisexual/pansexual than other sexual orientation categories.
17Table 3.2.1: Sexual orientation re-sorted into five categories. Respondents could select multiple options. ‘Other’ is a
category consisting of those who indicated they were asexual, heterosexual, or questioning, and those who gave no
response for their sexual orientation. N=906
Sexual orientation Respondents (N) Respondents (%)
Bisexual/pansexual 443 48.9
Gay 196 21.6
Lesbian 166 18.3
Queer 44 4.9
Other 57 6.3
Figure 3.2.1: Sexual orientation resorted into five categories, organized by participants’ age. N(under 25)=287, N(25-
54)=498, N(55+)=68
3.3 Age
Most survey participants provided information about their age when the survey asked: “In what
year were you born?” (94.2% of 906). Of the 853 participants who indicated their age, 33.6%
were under the age of 25, 58.4% were between the ages of 25 and 54, and 8.0% were over the
age of 55 (Table 3.3.1).
18Table 3.3.1: Comparison of age groups between survey participants, the population of the City of Hamilton, 4 and
an estimation of the Two-spirit and LGBTIQ+ population in Hamilton. 5
Estimated Hamilton
Age Respondents (%) City of Hamilton (%) Two-spirit and
LGBTIQ+ pop. (%)
Under 25 33.6 14.2 25.6
25-34 31.5 16.1 28.6
35-44 16.9 14.9 19.1
45-54 10.0 17.9 9.6
55-64 6.0 16.9 8.3
64+ 2.0 20.0 8.8
Table 3.3.1, shows survey respondents tended to be much younger than the Hamilton population
at large, and we received responses from only a small fraction of those over the age of 55.
However, this is the one case where national surveys 6 can allow us to say something about Two-
Spirit and LGBTIQ+ populations, independent of our survey. Self-identified Two-Spirit and
LGBTIQ+ populations actually are younger than the population at large. As identifying this way
has become less of a risk over the last few years, younger people have become increasingly
willing to do so. If we accept this premise, our respondents no longer seem as unrepresentative.
By an estimate, about 29% of our respondents should be between 25 and 34, and 31.5% actually
are. About 8% of our respondents should be between 55 and 64, and 6.0% actually are.
That said, while the gaps are much smaller once we allow for how Two-Spirit and LGBTIQ+
communities differ from the population in general, 20-somethings were still over-represented in
our sample, and older respondents were still under-represented. We clearly were more successful
reaching younger than older Two-Spirit and LGBTIQ+ people with our survey. This will limit
what we can say about the specific needs of Hamilton’s Two-Spirit and LGBTIQ+ seniors.
3.4 Race/Ethnicity and Indigeneity
One particular goal of this needs assessment was to be able to look specifically at how
experiences and needs differ for people who are racialized. 17.5% (of 874) participants self-
identified as a member of a racialized community.
As shown in Table 3.4.1, survey respondents are actually exactly as likely to self-identify as what
Statistics Canada calls a “visible minority” as the Hamilton population as a whole. Since the
racialized population of Hamilton is younger than the total population, however, a perfectly
4 City of Hamilton figures for all tables in this section, including those adjusted for age, were
derived from Census data by special request to the City of Hamilton. SOURCE: Statistics
Canada. 2018. EO2755 Table 8 (CD-CSD) – 2016 Target Group Profile – Age groups – Part 1
(table). “2016 Census: Semi-custom profile.” Census. Ottawa, Ontario. Last updated November
2, 2018.
5 See
https://www.forumresearch.com/forms/News%20Archives/News%20Releases/67741_Canada-
wide_-_Federal_LGBT_(Forum_Research)_(20120628).pdf
6 See note 3.
19representative sample of people of colour given that the age demographics of the sample skew
young should be approximately 22%. When the population of Hamilton is weighted so that its
age demographic matches that of the survey sample, racialized respondents are under-
represented to a small degree.
Table 3.4.1: Survey respondents’ self-identification as “a member of a racialized community” compared with
results for the city of Hamilton and the city of Hamilton adjusted for age. N(survey respondents)=874
City of Hamilton
Respondents (%) City of Hamilton (%) adjusted for age (%)
Racialized 17.5 17.5 21.9
White 82.5 82.5 78.1
We then posed a more detailed question, asking, “Which of the following best describes your
racial or ethnic group?” and invited people to check as many as apply. Results were re-coded
into eight categories7 (Table 3.4.2.).
Table 3.4.2: Percent of respondents from specific racial or ethnic categories compared to results for the City of
Hamilton. N(survey respondents)=874
Racial or ethnic group Respondents (%) City of Hamilton (%)
Asian – East 4.2 2.5
Asian – South 3.2 4.2
Asian – South East 1.5 2.8
Black 3.1 3.8
Indigenous 2.4 2.3
Latin American 1.1 1.6
Middle Eastern 1.5 2.9
Mixed Heritage* 4.8 0.7
* 2.7% of all respondents who gave an answer indicated they were of ‘Mixed Heritage’. 4.8% of all respondents
who gave an answer indicated they were of ‘Mixed Heritage’ or answered ‘Yes’ to multiple heritages.
While the number of respondents who belonged to Indigenous or the racial and ethnic groups
listed above was large enough to discern one from another, they were too small to reliably
analyze differences among ethno-racial groups. As a result, throughout the report we analyze
differences between racialized people, including Indigenous respondents, and white people.
25.5% of the 145 participants who provided information about their gender and racial minority
status were both racialized and transgender. This compares to 28.9% of 686 white participants
who identified as transgender. Additionally, 33.3% of 153 participants who identified as being
racialized also reported living with a disability, compared to 39.0% of 721 white participants.
3.5 Immigration
Of the 896 participants who answered the question: “How long have you been living in
Canada?” 83.3% had been living here since birth. 16.7% were born elsewhere, and 3.0% had
lived in Canada for less than five years (Table 3.5.1). The survey sample under-represented the
7 Respondents who checked either (or both) of Asian - South and/or Indian - Caribbean were
reported as Asian - South. Respondents who checked one or more of Black - African, Black -
Caribbean, and/or Black - North American were reported as Black. Respondents who checked
one or more of First Nations, Inuit, Métis, and/or Indigenous, were reported as Indigenous.
Respondents who checked more than one ethnic/racial identity were reported as Mixed Heritage.
20You can also read