CITY OF KAMLOOPS | June 2021
←
→
Page content transcription
If your browser does not render page correctly, please read the page content below
CITY OF KAMLOOPS | June 2021

Kamloops is located within the ancestral lands of the Tk’emlúps te Secwépemc peoples.
                                                                          Tk’emlúps, which means “where the rivers meet”, has been an important centre of trade
                                                                          routes for centuries. The Secwépemc developed a unique culture that was totally
                                                                          self-sufficient pre-European contact through the seasonal use of natural resources.i As
                                                                          we face the challenges of climate change together, we have the opportunity to learn
                                                                          from traditional ecological knowledge to understand local climate impacts and foster
                                                                          sustainable ways of living that have long been practised on these lands.

i
    “Our Land”, Tk’emlúps te Secwẻpemc, accessed March 22, 2021, https://tkemlups.ca/profile/history/our-land/.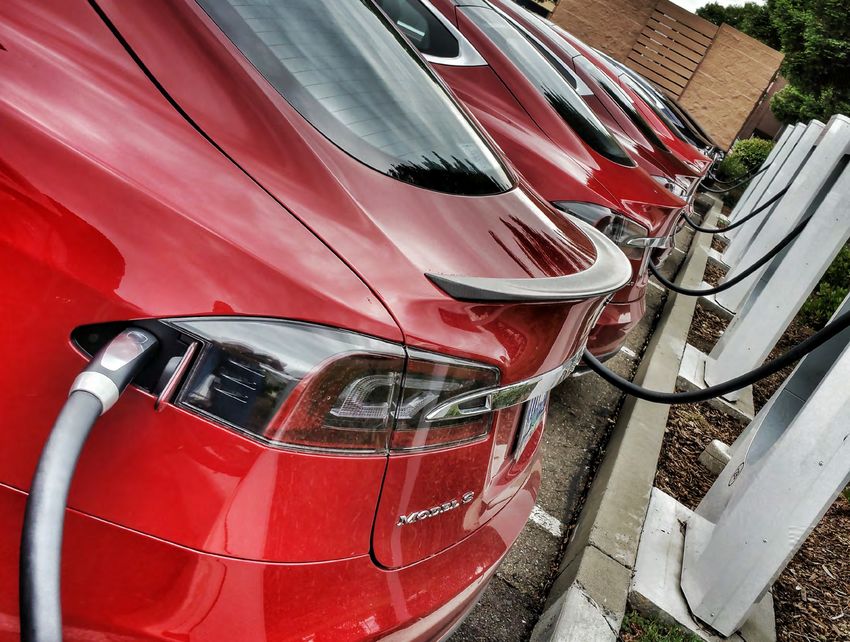
TABLE OF
CONTENTS
 Climate Change: A Call to Action                       Big Move 3: Zero-Emissions Transportation 								 34
   Local Context 																			 2                  Big Move 4: Zero-Carbon Homes & Buildings 							 40
   Why Act Now? 																			 3                   Big Move 5: Zero-Waste/Circular Economy 								 45
   Foundations for Climate Action 												 4        Big Move 6: Renewable Energy 													 51
   Planning Process 																		 5                Big Move 7: Municipal Climate Leadership 								 56
   Public Engagement Highlights 													 6         Big Move 8: Healthy Urban Ecosystem 										 62
                                                        Big Moves Emissions Reductions Summary 								 68
 Objectives & Targets 				 7
                                                      Advocacy					 69
 Current & Projected Emissions
   Key Emission Sources in Kamloops 											 9     Equity & Climate Justice 				 70
   Emissions Drivers and Status 													 10      Implementing Climate Action 			                                     72
   Projected Future Emissions 														 12
                                                      Measuring & Reporting Progress 			                                  82
 Kamloops’ 8 Big Moves 				 15
                                                      Big Moves Art Project 				 83
   Co-Benefits 																				 17
   Emissions Reductions 																 18           Appendices 					 86
   Economic Considerations 															 19          A: Glossary 																				 86
   Big Move 1: Low-Carbon Development 										 20    B: Implementation Priorities Methodology and Analysis 			 89
   Big Move 2: Car-Light Community 											 26      C: Summary of Energy and Emissions Modelling Methodology 92

                                                                                Community Climate Action Plan | CITY OF KAMLOOPS   1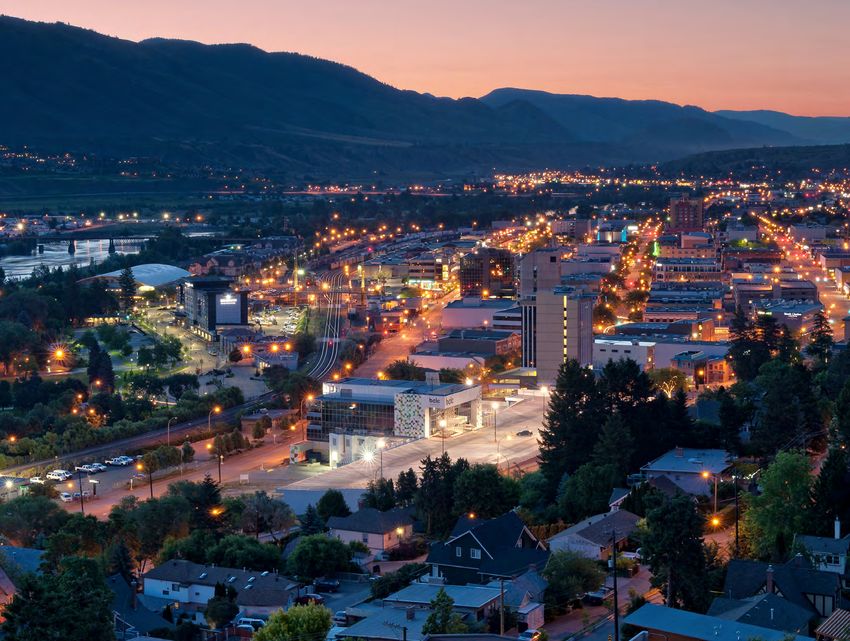
CLIMATE
CHANGE:        Local Context

A CALL TO
            The City of Kamloops is committed
            to building a healthy and sustainable
            community. A place with clean

ACTION
            air and pristine drinking water
            where residents can walk, bike,
            or roll to access their daily needs;
            where wildlife and nature thrive;
            where local food systems provide
            nourishment; and where secure,
            green jobs support a vibrant
            local economy.
            Unfortunately, climate change threatens this future,
            and many of its impacts are already being felt,
            including increasing extreme summer heat waves
            and droughts, more frequent and intense wildfires,
            seasonal flooding, warmer winter temperatures leading
            to pine beetle infestations, changes to stream flow
            affecting salmon populations, and stresses to natural
            ecosystems and agriculture. Climate scientists predict
            that these impacts will only intensify as average global
            temperatures continue to rise.
            But the worst impacts of climate change are not
            inevitable. By working together as a community and
            with all levels of government, we can minimize our
            greenhouse gas (GHG) emissions that contribute to
            climate change and increase our resilience to
            its impacts. This plan is a call to action, and it will
            require municipal, public, and private collaboration to
            combat climate change.

                     Community Climate Action Plan | CITY OF KAMLOOPS   2
WHY ACT NOW?
        Climate change is happening at
        global and local scales and is the
        greatest threat to environmental
        and human health of our times.

Climate change is the result of excess GHGs being
emitted into the earth’s atmosphere from human
activity such as cutting down carbon-absorbing forests
for agriculture and urban development and burning
fossil fuels such as oil, gas, and coal. As these gases
accumulate, more heat is trapped in our atmosphere.
Human activities are already estimated to have caused
approximately 1.0°C of global warming above
pre-industrial levels.i As of 2021, the previous six years
have included all of the warmest years on record.
The Intergovernmental Panel on Climate Change
(IPCC) has underscored that global temperature
rise must stay below 1.5°C by drastically reducing
GHG emissions and balancing remaining emissions
through carbon sinks (e.g. oceans, plants, and soils) to
achieve net-zero emissions by 2050.ii This is necessary

                                                                                 1.5°C
to avoid the most catastrophic impacts of climate
change, such as multi-metre sea level rise, large-scale
species extinctions, and extreme weather events at a
frequency and intensity that would be very difficult to
adapt to. This target is especially important for Canada,
which, because of its northern latitude, is experiencing

                                                                                 RISE LIMIT
a rate of warming approximately twice the global
average. Kamloops, along with the rest of the world,
must act now and do its part to avoid the worst
impacts of climate change.

i
     “Global Warming of 1.5°C. An IPCC Special Report on the impacts of global
     warming of 1.5°C,” IPCC, 2018, https://www.ipcc.ch/sr15/chapter/spm/.
ii
     Ibid.
                                                                                              Community Climate Action Plan | CITY OF KAMLOOPS   3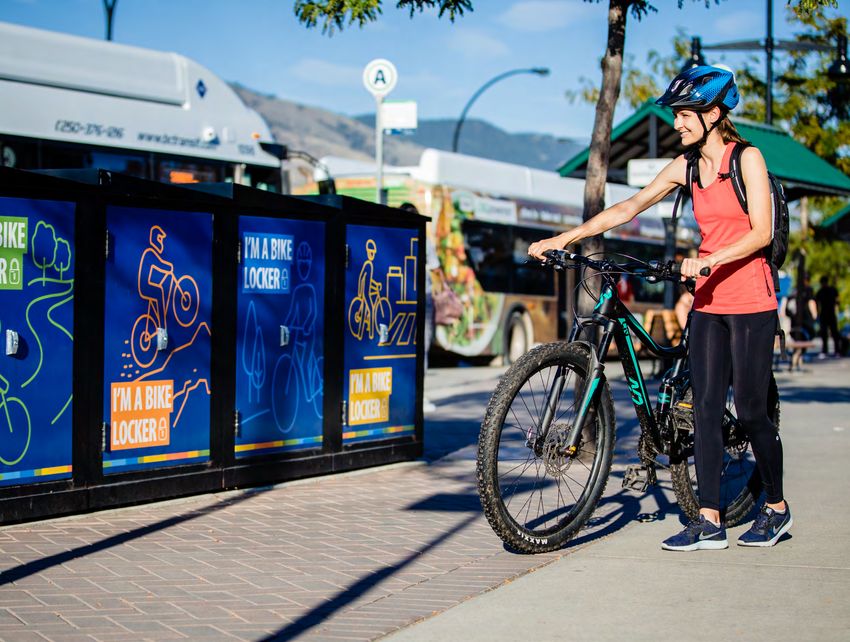
Foundations for Climate Action
Since signing the BC Climate Action Charter in 2007, the City has
undertaken a number of climate action initiatives, including the following:
                                                                                                                 2018: City acquires first electric fleet vehicles
                                                                                                                 2018: Xget’tem’ Trail multi-use path complete
  CLIMATE ACTION INITIATIVES
                                                                                  2017: Dufferin Wetlands                  2019: BC Energy Step Code
  2007: Residential curbside                                                      Restoration Project complete
                                                                                                                           implementation strategy adopted
  recycling collection launched

             2008: Tournament Capital                                                                                               2020: Major infrastructure and
             Centre achieves LEED certification                 2016: 24 kW solar system installed on                               energy efficiency improvements at
                                                                the West Highlands Community Centre                                 Canada Games Aquatic Centre
                                  2010: City joins BC Hydro’s   2016: Inaugural Green Living Expo
                                  Energy Manager Program                                                                                         2021: Curbside
                                                                                                                                                 organics collection pilot
                                          2011: Installation of universal                                                                        2021: City has 11
                                          water meters complete                                                                                  electric fleet vehicles

    2010: Sustainable Kamloops Plan
                                                                                                                              2020: Electric Vehicle and E-Bike Strategy
                          2012: Airshed Management Plan                                                                       2020: Downtown Transportation
                                                                                                                              Choices Strategy
                                                  2013: Corporate Energy                                                      2020: Transit Future Action Plan
                                                  and Emissions Management Plan
  SUPPORTING PLANS                                2013: Food and Urban Agriculture Plan                   2018: Transportation Master Plan
                                                  2013: Agricultural Area Plan                            2018: Official Community Plan

                                                                                           2016: Urban Forest Management Strategy

                                                                                                                         Community Climate Action Plan | CITY OF KAMLOOPS    4
Planning Process
The Community Climate Action Plan was developed through a community engagement
process involving the public, key stakeholders, the CCAP Advisory Group, and City Council.

       PHASE 1                                PHASE 2                                  PHASE 3                                  PHASE 4
UNDERSTANDING                           EXPLORING                                CHOOSING                               PLANNING
THE PRESENT                             THE FUTURE                               OUR FUTURE                             OUR FUTURE
(October 2018– February 2019)          (March 2019–March 2020)                   (April–November 2020)                  (December 2020–June 2021)
Phase 1 consisted of background        Phase 2 involved developing               Phase 3 saw further development        Phase 4 consisted of refinement to
research and collecting baseline       preliminary emissions reductions          of the Big Moves strategy options,     the Big Moves and the development
information to understand Kamloops’    strategies and actions in collaboration   following which, community and         of a draft plan based on internal
community energy and emissions         with internal stakeholders. Upon          stakeholder input was sought           staff, public, stakeholder, and Council
profile and to explore opportunities   Council’s request, this evolved           through a series of engagement         feedback along with detailed emissions
for action.                            into developing bolder options to         activities, including a survey and     modelling of proposed strategies.
                                       enable Kamloops to contribute to          discussion forum on                    Further public and stakeholder
                                       international efforts to limit global     LetsTalk.Kamloops.ca/ClimateAction.    engagement was conducted in
                                       warming to 1.5°C.                                                                preparation for presenting the plan to
                                                                                                                        Council for adoption in June 2021.

                               Concurrent to the City’s CCAP process, Tk’emlúps te Secwépemc have also been developing a
                               Community Energy Plan. This presents an opportunity to build upon partnerships, collaborate on
                               climate action projects and initiatives, and share insights at Community to Community Forums
                               that will help both communities to reduce emissions, mutually benefit from sustainable economic
                               development, and adapt to climate change.

                                                                                                                   Community Climate Action Plan | CITY OF KAMLOOPS   5
Public Engagement Highlights
The City thanks everyone who took time to learn about
the plan and share their feedback. This input ultimately
shaped and strengthened the CCAP and reflects the
many voices heard throughout the project.

                  262+
                  participants at in-person and
                  virtual engagement sessions

                  2,947
                  unique visitors to the Let’s
                  Talk Climate Action page

                  532
                  survey responses
                                           89%
                                            924
                                                      viewed climate change as a
                                                      somewhat or very serious problem

                                                      comments contributed

                                                    Visit LetsTalk.Kamloops.ca/ClimateAction for more information
                                                    on the engagement process and feedback received.

                                                                                         Community Climate Action Plan | CITY OF KAMLOOPS   6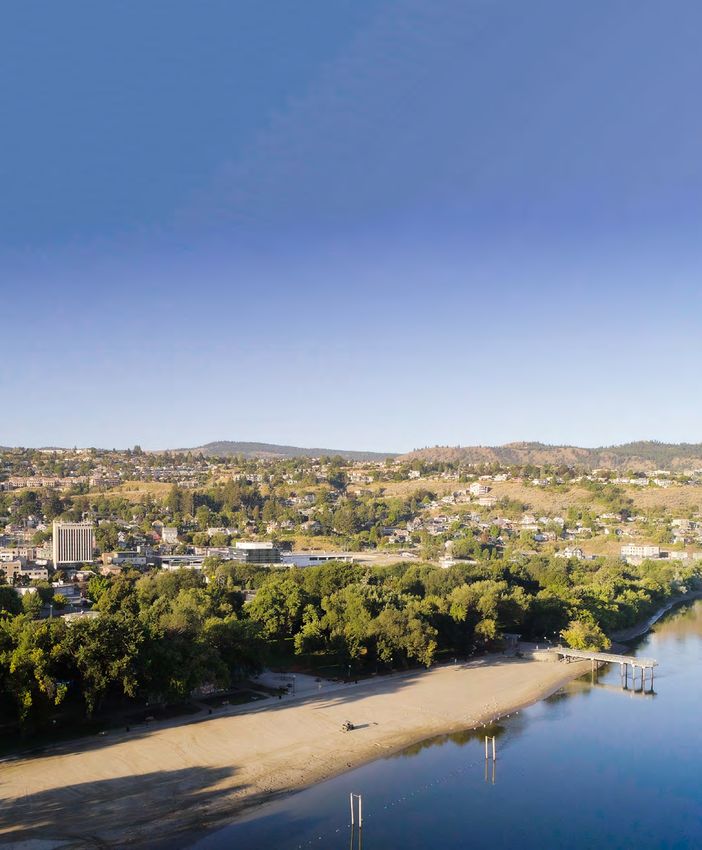
OBJECTIVES
& TARGETS
                              The Kamloops City Council Resolution that was
                              adopted on June 25, 2019, stated:
                              Therefore be it resolved that Kamloops City Council:
                              a) set a strategic goal for reducing community
                                 greenhouse gas emissions that is in line with
                                 Kamloops’ portion of global efforts to keep global
                                 temperature rise to 1.5°C
                              b) mandate staff, through the work on the Community
                                 Climate Action Plan, to outline a series of actions
                                 that would reduce greenhouse gas emissions in
                                 Kamloops to align with the global efforts to keep
                                 global temperature rise to 1.5°C
                              In response, 8 Big Moves and 24 strategies were
                              created, which have the potential to reduce
                              community GHG emissions at a pace consistent with
                              Council’s resolution. Further, a set of short-, medium-,
                              and long-term actions to implement the Community
                              Climate Action Plan’s (CCAP’s) Big Moves were
                              identified along with interim and long-term targets
                              to help focus local commitment towards clear and
                              measurable outcomes.

8 BIG MOVES   24 STRATEGIES            66 ACTIONS
                                        Community Climate Action Plan | CITY OF KAMLOOPS   7
BY 2024                                               BY 2030                                              BY 2050
              undertake                                             reduce community                                     reduce community
              all short-term                                        GHG emissions                                        GHG emissions
              actions                                               by at least 30%                                      by at least 80%
                                                                    compared to 2007                                     compared to 2007

The 2030 interim target accounts for the lead time required to implement the short- and medium-term actions and for their emissions reductions to take effect.
The CCAP sets a pathway to reduce community emissions by up to 80% by 2050. While a target of reaching net-zero emissions by 2050 (i.e reducing emissions to as close to
zero as possible and absorbing remaining emissions through carbon sinks) is recommended by the IPCC, the City currently has limited jurisdiction over some key emissions
sources, principally heavy-duty transportation and existing buildings. As future technology and policy solutions emerge, there will be opportunities to address these
emissions and update the target.

                                                                                                                               Community Climate Action Plan | CITY OF KAMLOOPS   8
CURRENT & PROJECTED
EMISSIONS 2017 Greenhouse Gas Emissions
400,000
(tCO2e) per Sector
Key Emissions Sources in Kamloops 66%
350,000
Understanding where our emissions are coming from is key for identifying emissions reductions opportunities.
An inventory of GHG emissions was undertaken using data from internal sources and external sources such as 300,000
BC Hydro, FortisBC, ICBC, BC Transit, and Statistics Canada. While emissions come from a variety of GHGs
(e.g. methane and nitrous oxide), they are reported in tonnes of carbon dioxide equivalent (tCO2e), which is
a standard measure that converts any non-CO2 GHGs to an equivalent measure based on their global 250,000
warming potential.
200,000
150,000 29%
*primary sources
100,000
Transportation: Buildings: Solid Waste: 50,000
gas and diesel fuelled vehicles* natural gas space organic waste in landfill*
and water heating* 0
5%
Transportation Buildings Solid Waste
How do we compare?
11%
Registered vehicles
BC Average 5.7 tCO2e per household in 2019
per capita
higher than the 1.5 Canadian Average
Kamloops 6.3 tCO2e BC average
1.9 in Kamloops
per capita
Community Climate Action Plan | CITY OF KAMLOOPS 9Emissions Drivers and Status
SECTOR KEY DRIVERS STATUS
Land Use Land use planning influences Walkability can serve as a proxy for close
transportation and buildings access to daily needs. In Kamloops:
emissions through: • Downtown and the North Shore have the highest walkability.
• More compact, complete, and connected neighbourhoods Densification in the Core sector is occurring at a more rapid
with access to shopping, work, school, and recreation have pace than projected by the City’s Official Community Plan.
decreased energy demands. • Westsyde, Brocklehurst, and Valleyview have moderate
• Mixed-use development (i.e. residential and commercial), walkability scores due to the commercial corridors being along
providing access to daily needs amenities. arterial roads.
• Connectivity of transit and active transportation infrastructure. • Aberdeen, Juniper Ridge, and Batchelor Heights have very low
walkability scores due to the absence of local amenities.
• Location of new growth in core and urban areas with limited
growth in suburban and rural areas.
Transportation Major influences on transportation Kamloops is a car-intensive community:
emissions include: • In 2017, 88% of all trips in Kamloops occurred by car compared
• Mode share of transit, carpooling, car sharing, cycling, and to 5% for transit and 7% for active modes.
walking, which is affected by access to and availability of • Trucks and SUVs were the most common passenger vehicle in
supporting infrastructure. the City, comprising 60% of all registered vehicles.
• Vehicle size with compact vehicles being generally more • In 2019, 191 EVs and 712 hybrid vehicles were registered in
fuel-efficient. Kamloops.
• Fuel type as the average electric vehicle (EV) is currently four
times more efficient than a gas or diesel-powered vehicle. In
BC, EVs are fuelled with low-carbon electricity.
Community Climate Action Plan | CITY OF KAMLOOPS 10SECTOR KEY DRIVERS STATUS
Buildings Emissions in buildings The following are trends
are primarily influenced by: for buildings in Kamloops:
• Energy sources used with natural gas (a fossil fuel) having far • In 2017, buildings in Kamloops used 5,428,358 GJs of natural
higher emissions than electricity and renewable energy. gas (63%) and 3,219,623 GJs of electricity (37%).
• Building size and type with smaller homes and units that share • There has been a sustained surge in medium- to high-density
walls being more thermally efficient. multi-family development since 2016.
• Building age, design, and efficiency as energy efficiency • The average new single, detached home in Kamloops is
requirements have increased over time. 2,650 sq. ft., over 70% larger than homes built prior to 1976.
• Space and water heating types and efficiency as these are • Family size is shrinking, and Kamloops has a particularly high
major consumers of energy. share of households with a single person (28%) and couples
without children at home (33%), which leads to high per capita
• Construction components, which can have varying levels of
emissions.
embodied carbon.
• The rate of house demolition is very low—0.05%—meaning
that very few older homes are being replaced by more efficient
new homes.
• Some steps of the BC Energy Step Code will be adopted in
2022, which will require higher energy efficiency standards in
new construction.
Solid Waste Emissions from solid waste In Kamloops, solid waste
are influenced by: management trends include:
• Quantity of organic matter (i.e. paper, wood, textiles, and food • In 2019, 0.73 tonnes per capita of waste was landfilled.
waste) decomposing in the landfill, where it becomes methane,
• Approximately 38% of residential waste disposed of in the
a potent GHG.
landfill is organic matter.
• Organics collection and waste diversion programs.
• The City has a residential curbside pickup service for garbage
• Collection and conversion of methane gas. and recycling as well as a program for multi-family and
commercial businesses.
• The City is implementing a residential organics collection
program, establishing a curbside service before expanding to
include multi-family buildings.
• The Mission Flats Landfill has some methane collection in place.
Community Climate Action Plan | CITY OF KAMLOOPS 11PROJECTED EMISSIONS REDUCTIONS
Projected Future Emissions AND REMAINING EMISSIONS, 2007–2050
2017 CCAP Emissions Inventory 30% Reduction by 2030 Target 80% Reduction by 2050 Target
700,000
600,000 2007 Baseline Emissions
ns
io
Reductions from existing
ct
du
500,000 City, provincial, and
Re
federal government
ns
policies and plans
io
Tonnes CO2e
iss
Em
400,000
Reductions from
the Big Moves
300,000
200,000
Total Emissions Remaining
ns
io
iss
Em
100,000
ng
ni
ai
m
Re
0
2007 2050
Transportation - Personal Transportation - Medium- and Heavy-Duty* Buildings - Residential Buildings - ICI** Solid Waste
*Medium-duty refers to vehicles weighing between 19,000 and 33,000 lbs, while heavy-duty
(primarily long-haul transportation) weigh more than 33,000 lbs.
**Institutional, commercial, and industrial (ICI) buildings include small- to medium-sized industry only.
Community Climate Action Plan | CITY OF KAMLOOPS 12Projected emissions reductions
from the 2007 baseline
430,750
(612,000 tCO2e) by 2050:
Existing City, provincial, and federal
government policies and plans: tCO2e
222,000 tCO2e
TOTAL REDUCTIONS
FROM 2007 BASELINE
(36.3% REDUCTION)
(70% REDUCTION)
Additional reductions from Existing City, federal, and provincial commitments will not result in sufficient
CCAP Big Moves strategies: reductions to meet the 80% by 2050 target; therefore, significant additional
208,750
actions from the CCAP’s Big Moves are required. Combined, total reductions of
70% are projected. This leaves a 10% gap to meet the target, which could be
tCO2e accounted for by future solutions for medium- and heavy-duty transportation
(34.1% REDUCTION) emissions or government legislation requiring fuel switching and retrofits of
existing building stock.
Community Climate Action Plan | CITY OF KAMLOOPS 13Overview of factors driving
projected emissions reductions: LAND USE: Official Community Plan projections for residential growth in
higher-density areas of the city, particularly in the downtown core and neighbourhood
centres, support transportation and buildings emissions reductions. The Big Moves
propose to further limit emissions from developments in suburban and rural areas.
PROVINCIAL AND FEDERAL
CLIMATE COMMITMENTS BUILDINGS: Implementation of the BC Energy Step Code will support new building
efficiency improvements, while higher efficiency technologies and incentives from
the provincial and federal governments will make it easier and less costly to construct
Government of BC and retrofit more efficient buildings. The Big Moves will accelerate energy efficiency
improvements proposed by the BC Energy Step Code, increase the use of electric space
• Emissions reduction targets: 40% by 2030, 60% and water heating in all buildings, and provide additional support for retrofits. However,
by 2040 and 80% by 2050 (below 2007 levels) buildings already constructed will still comprise the majority of the city’s building stock
and associated emissions in 2050.
• 2018 CleanBC Plan priorities:
- setting EV sales mandates
- increasing renewable natural gas supply
TRANSPORTATION: Significant emissions reductions will primarily be achieved
through provincial and federal supports for electric vehicles (EVs) and low-carbon fuel
- reducing emissions from landfills standards. The Big Moves will further facilitate the transition to EVs while enabling
- supporting building energy retrofits the use of sustainable and active transportation modes. Medium- and heavy-duty
transportation are projected to account for the largest proportion of remaining emissions
in 2050 unless cost-effective technologies for electrification are developed or the use of
Government of Canada renewable fuels increases.
• Target: net-zero carbon emissions by 2050
(legislation pending) SOLID WASTE: The Big Moves will further advance the objectives of the
Thompson-Nicola Regional District Solid Waste Management Plan to divert
• 2020 A Healthy Environment and a Healthy methane-generating materials from the landfill, with additional actions to reduce
Economy climate plan priorities: waste. Despite this, emissions are expected to remain by 2050 as a result of waste already
- clean energy and technology disposed in the landfill that will continue to decompose into methane.
- financial support for electric vehicles,
building retrofits, and ecosystem restoration
- increasing the federal carbon tax
Community Climate Action Plan | CITY OF KAMLOOPS 14KAMLOOPS’
8 BIG MOVES
The Big Moves outline ambitious strategies that
will have the biggest impact towards achieving our
community’s 80% emissions reduction by 2050 target.
1 BIG MOVE 1: 5 BIG MOVE 5:
Low-Carbon Development Zero-Waste/Circular Economy
Promoting compact, mixed-use development Enhancing waste reduction, diversion, upcycling,
supported by sustainable transportation options. and reuse.
2 BIG MOVE 2: 6 BIG MOVE 6:
Car-Light Community Renewable Energy
Facilitating the increased uptake of walking, cycling, Supporting localized renewable energy production
carpooling, and transit. and use.
3 BIG MOVE 3: 7 BIG MOVE 7:
Zero-Emissions Transportation Municipal Climate Leadership
Supporting zero-emission vehicle use. Taking the lead in shifting to zero-carbon facilities
and fleets and applying a climate lens to planning and
decision-making.
4 BIG MOVE 4: 8 BIG MOVE 8:
Zero-Carbon Homes & Buildings Healthy Urban Ecosystem
Ensuring all buildings maximize energy efficiency and Preserving ecosystems and using green infrastructure
use low-carbon energy sources. to provide carbon sequestration and climate resilience.
Community Climate Action Plan | CITY OF KAMLOOPS 154% Municipal
TARGET
Climate Leadership
6% Renewable Energy
80%
12% Low-Carbon
Development
13% Zero-Waste/
Circular Economy
5% Car-Light
EMISSIONS
Combined, the Big Moves Community
could decrease emissions by
208,750 tCO2e
by 2050* REDUCTION
BY 2050
14% Zero-Emissions
Transportation
46% Zero-Carbon
Homes and Buildings
*Tonnes of carbon dioxide equivalent (tCO2e) is a metric that
converts all greenhouse gases to an equivalent measure
based on their relative global warming impacts.
Community Climate Action Plan | CITY OF KAMLOOPS 16The Big Moves will reduce greenhouse gas emissions
and can also benefit our community’s health, economy,
environment, and quality of life.
Co-Benefits
GREEN ECONOMY AND INNOVATION
ENHANCED LIVABILITY from increasing through creating local jobs in construction and retrofits,
access to sustainable transportation infrastructure, waste upcycling, renewable energy generation, and
green spaces, and daily amenities. research and development.
IMPROVED PUBLIC HEALTH as a result of ECOSYSTEM PRESERVATION from restoration
promoting a more active and connected community. projects, the use of native plants and promoting
development in existing neighbourhoods.
IMPROVED WATER QUALITY by reducing
IMPROVED AIR QUALITY due to less vehicle run-off to the rivers by using green infrastructure and
tailpipe emissions and combustion of natural gas. trees that absorb rainfall.
INCREASED CARBON SEQUESTRATION ENHANCED RESILIENCE to climate change
from preserving grasslands and increasing the impacts through green infrastructure, high-performance
tree canopy. buildings, and backup renewable energy sources.
Community Climate Action Plan | CITY OF KAMLOOPS 17Emissions Reductions
Each of the 24 strategies within
the Big Moves has been modelled
for its potential annual emissions Very High
reductions by 2050 under the 20,000 tCO2e
Moderate
following sectors: 1,000–9,999
and above
personal transportation tCO2e
medium- and heavy-duty
transportation
residential buildings
institutional, commercial, and
High
10,000–19,999
industrial (ICI) buildings
solid waste
Enabling tCO2e
strategies that have not
The estimated total annual reductions are specified
along with a descriptor to show the relative scale of
been modelled but are
necessary to enable
Supporting
projected reductions (i.e. very high, high, moderate, strategies with modest
etc.). emissions reductions in
other areas emissions reductions that
The relative scale of a strategy’s emissions reduction
potential is not necessarily an indicator of its have not been modelled
importance or priority. Achieving the City’s emissions
reductions goals will require contributions, both
large and small, from every emissions source in
our community.
Community Climate Action Plan | CITY OF KAMLOOPS 18Economic Considerations
The financial impacts of climate change are rising globally as weather-related disasters like floods, storms, and
wildfires are becoming more frequent, more extreme, and more expensive. In Canada, catastrophic weather events
totalled over $18 billion in insured losses between 2010 and 2019, and there were triple the number of catastrophic
events than in the 1980s.i In 2018, an estimated $615 million was spent on fire management and suppression
operations in BC, with significant additional costs associated with evacuations, property losses, declining tourism,
and impacts on agriculture from the devastating wildfire season.ii
Insurers and taxpayers share the costs of recovering from severe weather damage. For every dollar of insurance
claims paid to households and businesses, governments are spending much more to repair the damage to public
infrastructure.iii The cost from the impacts of uncontrolled climate change has been estimated to equate to at least
5% of global GDP, yet studies consistently show it would cost less to make the deep emission cuts needed to avoid
the worst impacts.iv Therefore, investments in reducing emissions and increasing resilience today will limit the
future costs borne by our society.
Actions to mitigate the impacts of climate change will require investments by the City, residents, businesses,
institutions, and developers, many of which will also boost the local economy. Some investments are easier to
predict in the short term (e.g. the current price premium to purchase an electric vehicle [EV]). However, given
rapid technological advancements, changes in energy prices, evolving legislation and funding from other levels of
government, cost estimates are difficult to project out to 2050.
Economic considerations have been included for all strategies within the Big Moves,
with high-level estimates included only for the most current-day approximations.
Through the municipal budget process, specific actions will require a detailed
business case at the time of implementation, which will provide an opportunity to
evaluate these with the most up-to-date costs, personnel requirements, available
grants, and other identified funding sources.
i
“Experts warn, Canada must act now to head off rising costs of climate change,” Canadian Institute for Climate Choices, December 3, 2020, https://
climatechoices.ca/news/experts-warn-canada-must-act-now-to-head-off-rising-costs-of-climate-change/.
ii
Jennie Wang and Katharine Strong, “British Columbia’s forest fires, 2018,” Statistics Canada, May 29, 2019, https://www150.statcan.gc.ca/n1/pub/16-508-
x/16-508-x2019002-eng.htm.
iii
“Severe Weather Caused $2.4 Billion in Insured Damage in 2020,” Insurance Bureau of Canada, January 18, 2021, http://www.ibc.ca/on/resources/media-
centre/media-releases/severe-weather-caused-$2-4-billion-in-insured-damage-in-2020.
iv
Matthew Bramley “Why should Canada act on climate?,” The Globe and Mail, Dec. 14, 2010, https://www.pembina.org/op-ed/2139.
Community Climate Action Plan | CITY OF KAMLOOPS 19BIG MOVE 1
1
LOW-CARBON
DEVELOPMENT
Community Climate Action Plan | CITY OF KAMLOOPS 20BIG MOVE 1: CONTEXT
1
BIG MOVE 1:
LOW-CARBON
DEVELOPMENT
How and where new development occurs is one of the most important
determining factors that influence a community’s carbon emissions.
Low-density residential development located far from a city’s core results
in higher emissions due to greater car use and environmental impacts from
land clearing, habitat fragmentation, and creating impervious surfaces.
When people live close to their daily needs—jobs, promoting mixed-use development within existing
schools, healthcare, food, leisure, etc.—they don’t neighbourhoods to provide more daily needs close
need to drive as much, and enabling transit use, to home, increasing housing types and availability
cycling, and walking leads to residents’ saving on through residential suites and infill, and ensuring
transportation costs and improved health, livability, that any new peripheral developments meet higher
and community connectedness. standards of building efficiency and support the
use of electric vehicles (EVs). Encouraging growth in
Building upon the recent increase in multi-family
existing serviced areas instead of undeveloped lands
housing in Kamloops, low-carbon development
on the city’s periphery, while respecting the Aberdeen
strategies focus on prioritizing increased housing
Growth Management Boundary, reduces the cost of
density located near amenities, services, and jobs,
building and maintaining new infrastructure. Shifting
with access to sustainable transportation options.
to more efficient and compact land use also preserves
This Big Move addresses emissions from buildings
more land for agriculture, recreation, and ecological
and transportation in several ways, including
conservation, which enhances carbon sequestration
CO-BENEFITS and climate change adaptation.
By 2050, 90% of residents can access
TARGET their daily needs and efficient transit
within a 10-minute walk or roll.
Enhanced Improved Ecosystem
Livability Air Quality Preservation
Community Climate Action Plan | CITY OF KAMLOOPS 21BIG MOVE 1: STRATEGIES
1A
1A - Ten-Minute City
GOAL: ACTIONS:
To support the integration of daily needs Identify priority areas to support infill projects that further increase housing density, mixed uses, and access to
amenities in existing neighbourhood centres transit and active transportation infrastructure in existing neighbourhood centres.
and, wherever possible, to concentrate Increase incentives to promote infill development (e.g. revitalization tax exemptions and reduced development
housing near existing and proposed transit, cost charges [DCCs]).
cycling, and walking networks. Increase availability of affordable market housing options that also contribute to higher density (e.g. density
bonus for rental-only multi-family buildings).
ECONOMIC
PROJECTED ANNUAL GHG REDUCTIONS BY 2050:
CONSIDERATIONS: This level of emissions reductions relies on 90% of new development being infill.
• Providing incentives for infill development is more
equitable and reflective of service provision and
infrastructure costs.i A shift from peripheral single- 1A - Ten-Minute City
family development to higher-density urban housing
results in relative reductions in City infrastructure and
1B - Diverse Housing Solutions
17,400
tCO2e
service costs.ii For instance, if multi-family units were
to account for 40% of new construction (3,890 units)
by 2050, this would result in City infrastructure and
1C - Green New Neighbourhoods
service cost savings of $8.7 million per year.iii (High)
• Households in higher-density areas spend, on
average, 25% less on transportation due to 0 5,000 10,000 15,000 20,000
better access to transit and active transportation
infrastructure. This represents a savings of $3,600 per Transportation - Personal Transportation - Medium- and Heavy-Duty
year in Kamloops, which increases disposable income Buildings - Residential Buildings - ICI
and consumer spending.iv
• Increasing access to daily needs has the potential to
reduce inequities in the community by improving
walkability for all.
• Housing affordability provisions will be necessary
to mitigate the impacts of gentrification on lower-
income households.
Community Climate Action Plan | CITY OF KAMLOOPS 22BIG MOVE 1: STRATEGIES
1B
1B - Diverse Housing Solutions
GOAL: ACTIONS:
To support additional housing Promote the development of legal residential suites when new homes are being constructed in areas where
opportunities on residential lots. suites are permitted.
Promote ground-oriented housing such as townhouses, row houses, multi-plexes, and small lot residential infill.
ECONOMIC Review secondary suite policy and consider guidelines for permitting a secondary suite and an accessory
dwelling unit (e.g. carriage suite or garden suite) on a single-family lot in designated areas.
CONSIDERATIONS:
• Residential suites can provide a source of income
for homeowners and add value to homes while
PROJECTED ANNUAL GHG REDUCTIONS BY 2050:
increasing the availability of rental housing. This level of emissions reductions would be expected if 3,000 suites are built (i.e. 25% of new units being suites).
• Small-lot residential infill can provide more
affordable housing options within existing
1A - Ten-Minute City
neighbourhoods.
• Encouraging developers to build legal residential
suites at the time of construction will increase 1B - Diverse Housing Solutions 2,500
costs incrementally, as many new single-family
developments are already including basic servicing 1C - Green New Neighbourhoods
tCO2e
needed for suites (e.g. plumbing and a wet bar).
(Moderate)
0 5,000 10,000 15,000 20,000
Transportation - Personal Transportation - Medium- and Heavy-Duty
Buildings - Residential Buildings - ICI
Community Climate Action Plan | CITY OF KAMLOOPS 23BIG MOVE 1: STRATEGIES
1C
1C - Green New Neighbourhoods
GOAL: ACTIONS:
To require that all new buildings and Require developers to meet a higher BC Energy Step Code step than regulated and/or meet a specified GHG
neighbourhoods in suburban and rural intensity.
greenfields meet higher sustainable Require developers to install one charging station (capable of Level 2 charging) for every two stalls of off-street
development standards. parking in single-family developments, in addition to any city-wide EV-ready policy.
Increase DCCs for developments in peripheral areas (suburban and rural) to address the costs of required
ECONOMIC service upgrades or extensions.
Explore regulatory options to limit new natural gas servicing in favour of all-electric power and/or on-site
CONSIDERATIONS: renewable energy.
• Reducing GHG emissions intensity of construction
could result in construction cost premiums of
between 2.85% and 3.24%.v For example, according
PROJECTED ANNUAL GHG REDUCTIONS BY 2050:
to the NRCan LEEP Costing Tool for Kamloops, This level of emissions reductions would require avoiding natural gas servicing to new developments, ensuring
purchasing a central air source heat pump instead that electricity or renewable energy is used.
of a gas furnace results in an incremental cost of
approximately $4,000–$7,000 per unit
without incentives. 1A - Ten-Minute City
• There will be some incremental costs to installing
electric vehicle (EV) charging infrastructure at the 1B - Diverse Housing Solutions
5,450
time of development, but this is more affordable
than retrofitting EV stations at a later time.
1C - Green New Neighbourhoods
tCO2e
• Higher DCCs will increase the recuperation of (High)
higher capital costs associated with new peripheral
developments such as new booster pumping 0 5,000 10,000 15,000 20,000
stations.
Transportation - Personal Transportation - Medium- and Heavy-Duty
• Limiting natural gas servicing will avoid costs of
Buildings - Residential Buildings - ICI
adding gas lines and ensure that only electric space
and water heating systems and appliances are
installed at time of development.
Community Climate Action Plan | CITY OF KAMLOOPS 24BIG MOVE 1: STRATEGIES
10% Buildings - ICI
TOTAL BIG MOVE 1
PROJECTED
37% Transportation -
19% Buildings - Personal
Residential
ANNUAL 25,350
EMISSIONS tCO2e
REDUCTIONS
(tCO2e) BY 2050, BY SECTOR 34% Transportation -
Medium- and Heavy-Duty
Low-carbon development strategies will reduce emissions across a variety of sectors through enabling future
development to be more compact and connected to local amenities by active transportation infrastructure and
transit. Buildings emissions will be reduced through increasing density, with multi-family buildings, duplexes,
and residential suites having lower energy demands per unit than single-family homes. Some infill development
will replace older, inefficient buildings with new buildings built to higher energy efficiency standards. Requiring
new developments in suburban and rural greenfields to meet higher standards of building efficiency and support
the use of EVs will reduce emissions from buildings and transportation, and help mitigate the impacts of being
located further from jobs and services.
i
“Managing Urban Sprawl: Reconsidering Development Cost Charges in Canada,” Smart Prosperity Institute, January 2012, https://institute.
smartprosperity.ca/sites/default/files/managing-urban-sprawl.pdf.
ii
“Settlement Pattern and Form with Service Cost Analysis,” Halifax Regional Municipality, April 2005, https://usa.streetsblog.org/wp-content/uploads/
sites/5/2015/03/Halifax-data.pdf.
iii
“CCAP Economic Analysis Summary,” City of Kamloops.
iv
Ibid.
v
Ibid.
Community Climate Action Plan | CITY OF KAMLOOPS 25BIG MOVE 2
2
CAR-LIGHT
COMMUNITY
Community Climate Action Plan | CITY OF KAMLOOPS 26BIG MOVE 2: CONTEXT
2
BIG MOVE 2:
CAR-LIGHT
COMMUNITY
In 2017, 66% of Kamloops’ greenhouse gas (GHG) emissions came from
transportation, with the majority (49%) coming from passenger vehicles.
Reaching the CCAP targets will require a significant vehicles due to their efficiency, assistance with hills,
shift to transit, cycling, walking, car sharing, and and in the case of cargo E-bikes, storage capacity.
carpooling. While cars can be convenient, they have Micro-mobility devices, such as E-scooters, are also
many hidden costs, from air pollution and vehicle emerging as potential transportation solutions that
collision mortalities to the space required and high can be easily complemented by transit for longer
cost to build and maintain roadways and parking distances (i.e. carried onto buses and used to get
amenities. By contrast, active modes of transportation around at a destination). Programs and incentives will
(walking and cycling) have a net benefit to society. support the transition to sustainable transportation
modes, and for those who need a car, carpooling and
This Big Move lays out the actions to become a
car sharing offer lower-carbon options, especially
car-light community, where people of all ages and
when zero-emissions vehicles (ZEVs) are used. With
abilities can safely and conveniently get around
less private vehicle traffic, streets will be safer and
without needing to own a vehicle. In the future,
some can be redesigned to prioritize socializing,
most Kamloops residents will live close to their daily
active transportation, and green space. Owning
needs, with reliable and frequent transit service,
and operating fewer vehicles increases household
protected bike lanes, and sidewalks to connect
disposable income, while active transportation use
all key destinations. E-bikes are already helping
also improves physical and mental health, lowers air
to displace some trips that are made using larger
pollution, reduces parking demand, and minimizes
CO-BENEFITS road maintenance costs.
By 2050, 50% of trips in Kamloops are to
TARGET be by active transportation and transit.
Improved Enhanced Improved
Public Health Livability Air Quality
Community Climate Action Plan | CITY OF KAMLOOPS 27BIG MOVE 2: STRATEGIES
2A
2A - Active Mobility
GOAL: ACTIONS:
To enable the safe, secure, and efficient Build out a connected active transportation network by 2030, starting with completing connections along
transport of people and goods using active north–south and east–west corridors, followed by filling in any gaps to ensure key feeder connections to
core routes.
transportation modes.
Increase the availability of publicly accessible, secure, end-of-trip bike storage amenities in major
neighbourhood centres and other key destinations.
ECONOMIC Develop and implement an incentive program for E-bike/cargo bike purchases as per the Electric Vehicle (EV)
CONSIDERATIONS: and E-Bike Strategy.
• City investments in active transportation
infrastructure could require up to $1 million/year
of funding (in addition to current budget).i
PROJECTED ANNUAL GHG REDUCTIONS BY 2050:
• Increasing access to active transportation 2A - Active Mobility
infrastructure reduces reliance on private
5,000
motorized vehicles and decreases household 2B - Optimize Transit Service
transportation costs.
tCO2e
• Lively, walkable neighbourhood centres and 2C - Shared Streets
separated bike lanes are good for local businesses, 2D - Transportation Demand
with studies showing retail sales increase with new Management
bike lanes.ii (Moderate)
2E - Kamloops Car Share
• Lower air pollution and increased physical activity
due to using active modes of transportation can 0 1,000 2,000 3,000 4,000 5,000
result in healthcare cost savings.
Transportation - Personal
Community Climate Action Plan | CITY OF KAMLOOPS 28BIG MOVE 2: STRATEGIES
2B
2B - Optimize Transit Service
GOAL: ACTIONS:
To optimize transit service to support Improve infrastructure and amenities (e.g. seating, pads, shelters, and real-time bus arrival information) to
low-carbon development and land encourage transit use.
use goals. Identify light rail transit (LRT) rights-of-way to be reserved for future iterations of the transit network
(i.e. the sequential development of future HOV lanes to be replaced by bus only lanes and eventual
LRT development).
ECONOMIC Develop a Frequent Transit Strategy with BC Transit that explores options such as electric bus rapid transit
CONSIDERATIONS: (eBRT) to connect higher-density areas and key destinations.
• Accelerating transit infrastructure and amenity
improvements would require $250,000/year (in
addition to current budget).iii
PROJECTED ANNUAL GHG REDUCTIONS BY 2050:
• Families whose children benefit from increased 2A - Active Mobility
access to bus services or active transportation
2,000
options will spend less than transporting children to 2B - Optimize Transit Service
school by personal vehicles.
tCO2e
• Optimized transit service can open up employment 2C - Shared Streets
opportunities for those who cannot drive or for 2D - Transportation Demand
whom car ownership is cost prohibitive. Management
(Moderate)
2E - Kamloops Car Share
0 1,000 2,000 3,000 4,000 5,000
Transportation - Personal
Community Climate Action Plan | CITY OF KAMLOOPS 29BIG MOVE 2: STRATEGIES
2C
2C - Shared Streets
GOAL: ACTIONS:
To create street space that is accessible to Pursue opportunities to convert select street space (temporarily at first) into areas that prioritize pedestrian-
all ages and abilities, enhances pedestrian only or pedestrian-friendly areas with public amenities such as trees and gardens, seating, art installations, and
bike parking and with vehicle access limited to local residents, businesses, and emergency vehicles.
safety and comfort, and prioritizes active
transportation. Identify suitable streets to implement reduced road width initiatives that contribute to traffic calming and
convert space for community benefit (e.g. active transportation infrastructure, parks, community gardens,
daycares, or affordable housing).
ECONOMIC Implement low-traffic neighbourhood projects that extend pedestrian zones to multiple urban blocks (with
CONSIDERATIONS: emergency vehicle access only).
• Local businesses may benefit from increased foot and
cycle traffic in pedestrian-friendly areas. PROJECTED ANNUAL GHG REDUCTIONS BY 2050:
• Reduced road widths can slow traffic and create
economic vibrancy in commercial areas. 2A - Active Mobility
2B - Optimize Transit Service
1,000
tCO2e
2C - Shared Streets
2D - Transportation Demand
Management
(Moderate)
2E - Kamloops Car Share
0 1,000 2,000 3,000 4,000 5,000
Transportation - Personal
Community Climate Action Plan | CITY OF KAMLOOPS 30BIG MOVE 2: STRATEGIES
2D
2D - Transportation Demand Management
GOAL: ACTIONS:
To decrease trips by single-occupancy Strategically promote targeted neighbourhood transportation demand management (TDM) programs to
vehicles by facilitating the uptake of residents (e.g. promote uptake of new active transportation infrastructure or increased transit service levels to
reduce localized congestion areas and avoid road widening).
sustainable transportation options
(i.e. transit, carpooling, car sharing, Develop and promote TDM measures for employers city-wide, including facilitating the use of sustainable
transportation options and reducing the need for travel (i.e. through virtual meetings, flexible work hours, and
cycling, and walking) and reducing the work-from-home options).
need to travel.
Review Parking Management Plan (to be completed in 2021) measures to encourage the use of sustainable
transportation options as active transportation infrastructure and transit service levels improve.
ECONOMIC
CONSIDERATIONS: PROJECTED ANNUAL GHG REDUCTIONS BY 2050:
• TDM measures can defer or avoid the need for costly
road expansion projects, reduce congestion delays, 2A - Active Mobility
and make roads safer. Estimates have shown returns
2,500
on investment of up to $9 per every dollar invested 2B - Optimize Transit Service
in TDM measures.iv TDM measures are included in the
City’s Downtown Transportation Choices Strategy
tCO2e
2C - Shared Streets
adopted in 2020.
2D - Transportation Demand
• Employer investments could include end-of-trip Management
amenities such as bike storage, showers, and lockers, (Moderate)
which may be offset by improved health and 2E - Kamloops Car Share
productivity of employees.
0 1,000 2,000 3,000 4,000 5,000
• By reducing the need for travel and promoting
collaborative office environments, employers can Transportation - Personal
reduce the amount of office space needed, which
would result in real estate savings. Flexible work
arrangements can also save employers money by
reducing absenteeism and boosting productivity
of employees.v
Community Climate Action Plan | CITY OF KAMLOOPS 31BIG MOVE 2: STRATEGIES
2E
2E - Kamloops Car Share
GOAL: ACTIONS:
To reduce the number of Explore business models for car-share options and prioritize opportunities to integrate plug-in hybrid and EVs
privately-owned vehicles in the city through into car sharing fleets.
membership-based car sharing services. Encourage the use of established car sharing services in new developments in higher-density urban areas to
reduce parking space requirements.
ECONOMIC
PROJECTED ANNUAL GHG REDUCTIONS BY 2050:
CONSIDERATIONS:
• There are various potential models for establishing 2A - Active Mobility
a car sharing service. Some are run by private
1,000
companies or cooperatives, while others have been 2B - Optimize Transit Service
supported by municipalities through allocating
select City fleet vehicles for community use outside
tCO2e
2C - Shared Streets
of work hours.
2D - Transportation Demand
• Households could save thousands of dollars annually Management
in car ownership and maintenance costs if a car (Moderate)
sharing membership enables them to not own a car 2E - Kamloops Car Share
or decrease the number of vehicles they own.
0 1,000 2,000 3,000 4,000 5,000
Transportation - Personal
Community Climate Action Plan | CITY OF KAMLOOPS 32BIG MOVE 2: STRATEGIES
TOTAL BIG MOVE 2
PROJECTED
ANNUAL 100% Transportation -
Personal
11,500
EMISSIONS tCO2e
REDUCTIONS
(tCO2e) BY 2050, BY SECTOR
Emissions reductions primarily result from the strategies reducing reliance on personal vehicles and their
associated fossil fuel use. Remaining emissions from gas powered vehicles will be further reduced by transitioning
to EVs, as outlined in Big Move 3.
i
“CCAP Economic Analysis Summary,” City of Kamloops.
ii
Eric Jaffe, “The latest evidence that bike lanes are good for business,” Medium online, September 5, 2019, https://medium.com/sidewalk-talk/the-latest-
evidence-that-bike-lanes-are-good-for-business-f3a99cda9b80.
iii
“CCAP Economic Analysis Summary,” City of Kamloops.
iv
“Transportation Cost Savings Calculator,” Mobility Lab, accessed March 10, 2021, https://mobilitylab.org/calculators/.
v
“OSH Answers Fact Sheets: Flexible Work Arrangements,” Canadian Centre for Occupational Health and Safety, last modified March 31, 2021, https://
www.ccohs.ca/oshanswers/psychosocial/flexible.html.
Community Climate Action Plan | CITY OF KAMLOOPS 33BIG MOVE 3
3
ZERO-EMISSIONS
TRANSPORTATION
Community Climate Action Plan | CITY OF KAMLOOPS 34BIG MOVE 3: CONTEXT
3
BIG MOVE 3:
ZERO-EMISSIONS
TRANSPORTATION
Two-thirds of Kamloops’ community GHG emissions in 2017 were from the
use of gas- and diesel-powered vehicles.
Reliance on personal vehicles will eventually be This Big Move outlines strategies to facilitate the
reduced through the changes in neighbourhood transition to zero-emissions light-, medium-, and heavy-
design and improvements to transit and active duty vehicles. There is still a purchase cost premium
transportation that are prioritized in this plan. In the for EVs compared to their gas-powered counterparts;
meantime, ZEVs do not produce tailpipe emissions therefore, incentives may be important until cost parity
as they have electric motors that are powered by is reached, which is anticipated within the next few
batteries or hydrogen-based fuel cells. While electric years. Increasing access to charging amenities and
vehicles (EVs) require electricity for battery recharging, outreach on the benefits of EVs (e.g. reduced operating
BC’s electrical grid is mostly supplied by low-carbon and maintenance costs) could encourage faster uptake.
hydroelectricity. The number of ZEVs in Kamloops is While technologies for electrification of medium- and
rising rapidly, and they are supported by provincial heavy-duty vehicles currently lag behind passenger
sales targets regulations that require that by 2040, all vehicles, there are opportunities to support their
new passenger vehicles sold in BC be zero emissions. adoption (e.g. through encouraging the use of electric
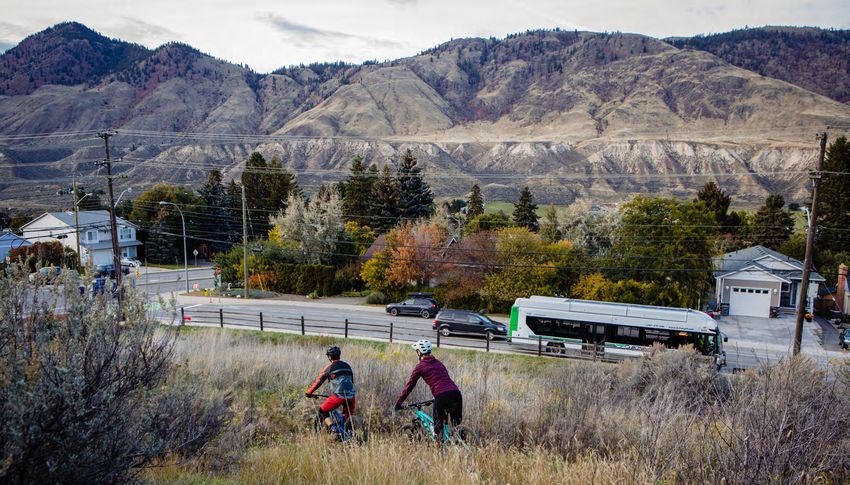
Other initiatives, such as BC Transit’s commitment to delivery vans and E-cargo bikes for urban freight
buying only electric buses starting in 2023, will help delivery). These strategies will result in reduced carbon
to drive innovation and demand for zero-emissions and noise pollution, which will improve our air quality
medium- and heavy-duty vehicles. and health.
CO-BENEFITS
By 2050, 85% of kilometres driven by
TARGET Kamloops-registered passenger vehicles
will be by zero-emissions vehicles.
Improved Improved Green Economy
Air Quality Public Health and Innovation
Community Climate Action Plan | CITY OF KAMLOOPS 35BIG MOVE 3: STRATEGIES
3A
3A - Zero-Emissions Light-Duty Vehicles
GOAL: ACTIONS:
To support the transition to zero-emissions Implement the City’s EV and E-bike Strategy, prioritizing support for home, workplace and public EV
transportation choices. charging infrastructure.
Encourage private sector investment in new EV charging infrastructure.
ECONOMIC
CONSIDERATIONS: PROJECTED ANNUAL GHG REDUCTIONS BY 2050:
• City investments in community-based EV and E-Bikes
initiatives are estimated at $240,000/year and help 3A - Zero-Emissions Light-Duty Vehicles
5,000
address barriers such as access to home charging.i
3B - Zero-Emissions Medium-
• To establish an EV charging network would cost and Heavy-Duty Vehicles
tCO2e
$20,000/year ($600,000 amortized over 30 years;
City-owned and/or private sector incentives).ii 3C - Low-Carbon Urban Freight Delivery
• Currently, there is a cost premium to purchase
an EV over a comparable gas-powered vehicle 0 5,000 10,000 15,000 20,000
(Moderate)
(approximately 9% for light-duty vehicles). Electric
versions of light-duty vehicles are projected to reach Transportation - Personal Transportation - Medium- and Heavy-Duty
cost parity by as early as 2026. Used EVs will also
increase in availability.
• Being more efficient and having fewer moving parts,
the cost to maintain EVs is up to 40% lower than for
gas-powered vehicles.
• In 2050, the average household cost to operate and
maintain a vehicle will be nearly $3,000 less than it is
in 2020, as a result of increased EV ownership.iii
Community Climate Action Plan | CITY OF KAMLOOPS 36BIG MOVE 3: STRATEGIES
3B
3B - Zero-Emissions Medium- and Heavy-Duty Vehicles
GOAL: ACTIONS:
To support institutional, commercial and Implement EV and E-bike Strategy actions that encourage the electrification of commercial fleets.
industrial fleets’ transition to zero-emissions Promote the use of renewable, low-carbon fuels (e.g. biofuel, hydrogen, and fuel cell technology) in municipal
vehicles and equipment. or commercial fleets, where electrification options are not available or feasible.
ECONOMIC PROJECTED ANNUAL GHG REDUCTIONS BY 2050:
CONSIDERATIONS:
• Presently, electric medium- and heavy-duty vehicles 3A - Zero-Emissions Light-Duty Vehicles
20,000
have a much higher cost premium than light-duty
electric vehicles, and electric options for some 3B - Zero-Emissions Medium-
heavy-duty uses are not available. However, a and Heavy-Duty Vehicles
wide range of electric options are projected to be
cost competitive within 5–10 years, depending 3C - Low-Carbon Urban Freight Delivery tCO2e
upon vehicle type, due to declining battery costs,
lower fuel and maintenance costs, and improved 0 5,000 10,000 15,000 20,000
(Very High)
functionality.iv
Transportation - Personal Transportation - Medium- and Heavy-Duty
Community Climate Action Plan | CITY OF KAMLOOPS 37BIG MOVE 3: STRATEGIES
3C
3C - Low-Carbon Urban Freight Delivery
GOAL: ACTIONS:
To encourage the shift to zero-emissions Identify low-carbon urban freight and last-mile delivery logistics opportunities as part of the proposed Truck
delivery vehicles within the urban core Route Study to reduce traffic and encourage the adoption of smaller and cleaner delivery vehicles, including
electric cargo vans and cargo bikes.
and neighbourhood town centres as the
demand for home deliveries increases. Develop zero-emissions delivery zones in select commercial areas of the city and incentivize the use of smaller,
cleaner vehicles (e.g. e-cargo bikes, electric delivery vans) for last-mile delivery.
ECONOMIC PROJECTED ANNUAL GHG REDUCTIONS BY 2050:
CONSIDERATIONS:
• City incentives or support in establishing an urban
3A - Zero-Emissions Light-Duty Vehicles
freight logistics hub may make the adoption of
low-carbon delivery modes more feasible for freight
companies.
3B - Zero-Emissions Medium-
and Heavy-Duty Vehicles
3,500
• Private companies that invest in electric delivery
vehicles and/or cargo bikes will have lower
operational and maintenance costs.
3C - Low-Carbon Urban Freight Delivery tCO2e
(Moderate)
0 5,000 10,000 15,000 20,000
Transportation - Personal Transportation - Medium- and Heavy-Duty
Community Climate Action Plan | CITY OF KAMLOOPS 38You can also read