EU Market Outlook For Solar Power 2020 - 2024 - SolarPower Europe
←
→
Page content transcription
If your browser does not render page correctly, please read the page content below

EU Market Outlook For Solar Power 2020 - 2024
Join 200+
SolarPower
Europe
members

Influence   Intelligence    Network                Discounts                 Visibility              © M. Agnor

                                          SolarPower Europe – Leading the Energy Transition
                           SolarPower Europe is a member-led association that aims to ensure that
                           more energy is generated by solar than any other energy source by 2030.
                                                                       www.solarpowereurope.org
Foreword

Welcome to SolarPower Europe’s EU Market Outlook for Solar Power 2020–2024.
The solar PV sector is no stranger to positive surprises – in recent years this has included surpassing expectations
in terms of steep cost reduction, flexibility, user-friendliness, manifold applications, and its rapid growth rate.
However, the latest entry in this list has been a really big surprise: newly installed solar power in the European
Union increased by 11% to 18.2 GW in 2020! Not only did demand for solar PV systems in the EU grow over the
course of a year that was defined by the COVID-19 pandemic, it increased by double digits to a level that marks
the second-best ever in EU solar history. There was not a single analyst who forecasted such a positive outcome
six month ago, especially considering the fear of a ‘second wave’ haunting Europe this autumn and winter.
As the association representing the European solar sector, we are deeply relieved about this encouraging
development of our industry that is the most job-intensive among all power generation sources. With that said,
the growth seen in 2020 is 12% less than projected in our previous market outlook, from 2019. We anticipate
that it will take until 2022 before demand for solar PV systems will have compensated the delays in deployment
caused by COVID-19, meaning we have lost precious time in our race against climate change.
The European solar sector appreciates the efforts of the European Commission setting ambitious carbon
reduction targets, towards climate neutrality via its Green Deal, and through the tools offered in its Next
Generation EU recovery plan that tie over one third of financial support for member states to climate-related
expenditures. This offers many opportunities to foster rapid solar growth in Europe. Our policy recommendations
in this document were developed together with our members, in particular national solar associations, to help
policymakers in EU member states identify the many programmes on offer, and establish the most efficient
incentive mechanisms to boost solar as the lowest cost and most effective power generation technology to
manage the clean energy transition.
More commitment for solar on the EU member state level should remain a high priority. While most member
states are increasingly seeing total solar capacities grow and have acknowledged solar in their National Energy
and Climate Plans (NECPs) to meet 2030 EU targets, most of these deployment levels are still not ambitious
enough. The average 19.8 GW/year solar growth projected in the NECPs for the next decade is close to the
volume the EU has installed during its most severe economic crisis. Moreover, we are seeing market leaders,
such as Germany, putting regulatory obstacles in the way of solar that make investments much more difficult,
and thus slow down long-term growth. This is not the way forward! As we have shown for Paris Agreement-
compatible scenarios modelled in our recent 100% Renewable Europe report, the volume of solar that the EU
must install is at least 2.5 times higher than the expected NECP totals by 2030. To enable Europe’s citizens,
corporates, and financing institutions to embrace the lowest-cost and most versatile power generation
technology, even more enthusiastically after the COVID-19 crisis, EU member states must provide optimal policy
frameworks for solar to continue to surprise us positively in the future.
SolarPower Europe, together with its national association and corporate members, looks forward to working
with policy stakeholders to enable solar to deliver on its immense potential to meet the EU’s 2030 targets,
provide the maximum benefit for Europe’s climate, and contribute significantly to the Green Deal.

                                                                                Thanks to our Sponsor Members:

WALBURGA                        AURÉLIE BEAUVAIS   MICHAEL SCHMELA
HEMETSBERGER                    Deputy CEO and     Executive Advisor
Chief Executive Officer         Policy Director

EU Market Outlook For Solar Power 2020 - 2024                                                                          3
Table of contents

                                             Foreword                                                                                                             3
                                             Executive summary                                                                                                    5
                                             Policy recommendations                                                                                               6
                                             1     The EU solar market                                                                                            9
                                                   1.1.       Top 5 EU solar markets 2020                                                                       11
                                                   1.2.       EU solar market prospects 2021-2024                                                               17
                                             2     Key policy files for solar                                                                                  22
                                             3     Assessment of national energy and climate plans                                                             30
                                             4     Top 5 EU solar markets                                                                                      44
                                                   4.1.       Germany                                                                                          45
                                                   4.2.       Netherlands                                                                                      48
                                                   4.3.       Spain                                                                                            51
                                                   4.4.       Poland                                                                                           54
                                                   4.5.       France                                                                                           56

    Project manager & lead author: Michael Schmela, SolarPower Europe.

    Market intelligence: Omar Hatoum, Raffaele Rossi & Michael Schmela, SolarPower Europe.

    Internal co-authors: Aurélie Beauvais, Naomi Chevillard, Máté Heisz, Miguel Herrero Cangas, Merce Labordena, Thomas Lewis & Raffaele Rossi, SolarPower Europe.

    External co-authors: : Peter Molengraaf & Amelie Veenstra, Holland Solar (NL); José Donoso & Alejandro Labanda, UNEF (ES); Stanislaw M. Pietruszko, PV POLAND
    (PL); Marie Buchet, SER (FR).

    External contributors: PV Austria (AT); APSTE (BG); OIE (HR); Solární Asociace (CZ); European Energy (DK); Fortum & LUT University (FI); Enerplan (FR); BSW-
    Solar (DE); HELAPCO (EL); MANAP (HU); ISEA (IE); ANIE Rinnovabili & Elettricità Futura (IT); LSEA (LT); Stowarzyszenie PV (PL); APREN (PT); RPIA (RO); SAPI (SK);
    Svensk Solenergi (SE).

    Text editing: Lukas Clark-Memler & Milena Koot, SolarPower Europe.

    Please cite as: SolarPower Europe (2020): EU Market Outlook for Solar Power 2020-2024.

    Published: December 2020.

    ISBN: 9789464073478.

    Contact: info@solarpowereurope.org.

    Design: Onehemisphere, Sweden.

    Methodology: SolarPower Europe’s five-year forecast consists of Low, Medium and High Scenarios. The Medium scenario anticipates the most likely
    development given the current state of play of the market. The Low Scenario forecast is based on the assumption that policymakers halt solar support and
    other issues arise, including interest rate hikes and severe financial crisis situations. Conversely, the High Scenario forecasts the best optimal case in which
    policy support, financial conditions and other factors are enhanced.

    Segmentation is based on the following system size: Residential (
Executive summary

Solar PV power in the European Union has shown strong         The surprisingly positive 2020 for the EU solar sector
resilience in 2020 despite Coronavirus negatively             will be followed by 4 years characterised by even
impacting everyone’s life in many aspects. Surprisingly,      stronger demand. Our Medium Scenario now
demand for solar power technology in the European             forecasts additions of 22.4 GW in 2021, which means
Union did not decrease but rather increased notably in        5% higher demand than forecasted last year. For the
2020. EU members states installed 18.2 GW of solar            following 2 years, we are even more upbeat, now
power capacity in 2020, an 11% improvement over the           projecting 27.4 in 2022 and 30.8 GW in 2023,
16.2 GW deployed in the previous year. While this is less     translating into 15% and 18% higher deployments than
than what we forecasted in last year’s EU Market              in our EMO 2019. And in 2024, SolarPower Europe sees
Outlook, it is significantly higher than our estimate in an   demand cross the 35 GW level, bringing total installed
adjusted post-outbreak forecast in late spring. 2020          solar PV capacity to 253 GW.
was the second-best year ever for solar in the EU, only
                                                              There are many good reasons for solar’s recent
topped by 2011, when 21.4 GW was installed.
                                                              positive developments and optimistic outlook in the
Germany installed 4.8 GW, enough to become again              European Union beyond its unique versatility and
the largest solar market in Europe, a position it held for    constantly improving cost leadership – and that is
most of the time in the last 20 years. The other Top 5        policy support in Brussels and many other EU capitals,
include the Netherlands (2.8 GW); last year’s market          creating the right market framework conditions for
leader Spain (2.6 GW); Poland, which more than                any type of the manifold possible solar applications.
doubled annual solar deployment (2.2 GW); and France
                                                              The Key Policy Files that SolarPower Europe is
(0.9 GW). Like last year, we have invited national
                                                              intensively working on are briefly summarised in
associations to write detailed country profiles for the
                                                              Chapter 2 (see p. 22), showing the crucial topics
leading EU markets (see p. 44).
                                                              under discussion to speed up solar growth, including
In total, the European Union’s Top 5 solar markets were       ambitions for the Clean Energy Package 2.0, how to
responsible for 74% of the 2020 installed capacity in         tackle the gap on carbon pricing, initiatives to tap
the region compared to a 5% points higher share (79%)         Europe’s gigantic solar roof potential, and constraints
in 2019. That means, even though the contribution of          of the power grid. In our Policy Recommendations
the other 22 EU member states remains rather small,           (see p. 6), we explain how member states can boost
it is notably rising. And when taking into account that       solar by utilising the European Commission’s
the Top 5 solar markets represent about 57% of the            economic recovery plan. Applying these means
EU’s population and 61% of its GDP, their share is not        correctly is a unique opportunity to invest into solar
that prevalent anymore.                                       as the most job creating and flexible renewable
                                                              energy source to accelerate the clean energy
The broadening acknowledgment of solar PV’s
                                                              transition. This is because the member states’
benefits can be also observed in another trend: in
                                                              National Energy & Climate Plans (NECPs) outlining
2020, 22 of the 27 EU member states installed more
                                                              their strategies to meet the 2030 EU targets do take
solar than the year before, compared to 21 out of 28
                                                              solar into consideration but need to do much more,
in 2019. All this has resulted in the European Union
                                                              as our analysis in Chapter 3 shows (see p. 30).
increasing the cumulative installed solar power
capacity by 15% to 137.2 GW by end of 2020.

EU Market Outlook For Solar Power 2020 - 2024                                                                           5
Policy recommendations

    Next Generation EU – Solar Powering the European Economic Recovery
    The coronavirus pandemic didn’t spare the solar power sector. Whereas COVID-19 slowed the very steep
    growth curve observed over the past 2 years, the European solar industry has demonstrated a very strong
    resilience. While growth levels are still 12% lower compared to our expectations before the crisis, we now see
    an 11% increase in deployment of solar projects across the EU in 2020 with only 5 out of 27 EU Member States
    installing less capacity than in the previous year. SolarPower Europe anticipates a return to normality in 2022,
    with the speed depending heavily on the economic recovery and stimulus packages.
    The EU’s recovery plan, Next Generation EU is an unprecedented and ambitious investment plan which aims to
    mitigate the impact of the COVID-19 pandemic by accelerating Europe’s green and digital transition, creating
    new opportunities for industrial growth and job creation at the service of Europe’s climate-neutrality ambition.
    The solar industry, as the most sustainable and job creating energy source, appears as a perfect candidate to
    contribute to this challenging transition.
    The core of the so called Next Generation EU plan is the EUR 672.5 billion Recovery and Resilience Facility (RRF).
    The RRF will provide financial support for Member States which can be directly injected in their economies,
    under the form of grants, loans or state guarantees. Investments covered by the RRF must be aligned with the
    objectives of the European Green Deal, with up to 37% of the total funding exclusively earmarked for climate-
    related expenditures. At the time of writing, the European Council and the European Parliament were negotiating
    the details of the RRF, with a view to reach a final agreement by end of 2020.
    In order to access RRF funds, Member States will have to submit their “national recovery and resilience plans”
    to the European Commission, detailing the measures and sectors targeted and demonstrating the contribution
    to the achievement of Europe’s energy and climate objectives. The Commission has strongly encouraged
    Member States to concentrate their investments in 6 flagship initiatives, 4 of which are directly relevant to
    the solar sector:
    •   Power up: by 2025, build and integrate 200 GW of RES by 2030, support the installation of 6 GW of
        electrolyser capacity and the production and transportation of 1 million tonnes of hydrogen (H2).
    •   Renovate: by 2025, contribute to doubling the renovation rate and fostering deep renovations.
    •   Recharge and refuel: by 2025, deploy at least 1 million charging points and 500 H2 refuelling stations deployed.
    •   Reskill and upskill: by 2025, ensure 70% of Europeans of working age have basic digital skills, that 4 in 5
        Vocational Education and Training (VET) graduates are employed and that 3 in 5 VET graduates benefit from
        in job training.
    The Recovery & Resilience Plans are therefore a unique opportunity for Member States to invest into solar and
    boost the clean energy transition, enable sustainable growth and create green jobs. Investments into solar
    create the most jobs per million dollars of capital investment.1 Utility-scale solar investments combine job
    creation with very low costs for greenhouse gas emission abatement, whereas investments into rooftop solar
    can be implemented within a short timeframe. Furthermore, investing into solar will contribute to increase the
    competitiveness of EU industry: Solar power’s Levelised Cost of Electricity is already competitive against
    industrial and wholesale electricity prices across Europe today (see Fig. 1, p. 9).

                                                               1    IEA (2020). Sustainable Recovery.

6                                                                                        EU Market Outlook For Solar Power 2020 - 2024
To make solar a core pillar of Europe’s green Recovery & Resilience plans, Solar Power Europe together with its
members developed 6 key recommendations for EU Member States:

1.   Boost utility-scale solar and storage – Relevant flagship initiative: Power up
     Member States should allocate funds to finance additional renewable energy tenders, including tenders for
     hybrid renewable energy projects that combine solar with utility-scale Battery Energy Storage Systems
     (BESS). In combination with additional tenders, recovery funds should be used to accelerate permitting
     procedures, a key bottleneck to deploy utility-scale solar.
     Other cost-effective ways to leverage private investments with Recovery and Resilience Funds is to use
     these to provide public support for renewable energy Power Purchase Agreements (PPAs) or to de-risk
     finance for projects through budget guarantees, as detailed in Japan’s recovery plan.2

2. Roll out solar-rooftop and storage programmes – Relevant flagship initiatives: Power up, Renovate
     Up to 90% of Europe’s roof surfaces remains unused, while the potential contribution to Europe’s energy
     transition could be significant – the Moderate Scenario of SolarPower Europe’s 100% Renewable Europe
     report models 570 GW of rooftop PV capacity deployed already by 2030, a massive leap from the 90 GW
     installed today. To make the most of Europe’s solar rooftop potential and provide a short-term boost to jobs,
     Member States should design solar mandates for all new and existing buildings with suitable rooftops. Solar
     mandates should be coupled with targeted support schemes to citizens and businesses that wish to install
     on-site solar and storage that can be funded with Recovery and Resilience funds. Such measures will also
     contribute to creating new job opportunities for EU citizens.

3. Promote electrification, deploy BESS, and invest in smart grids – Relevant flagship initiatives:
   Power up, Renovate and Recharge and refuel
     Electrification has great potential to boost the European Green recovery. Only for electrical contractors,
     more than 270,000 jobs could be created in the building sector, and 112,000 jobs in e-mobility.3 Member
     States should use Recovery & Resilience funds to promote renewable-based electrification of energy end-
     uses, such as buildings, heat, transport, and industry. For example, the German recovery plan announced in
     early July offers incentives to deploy electric cars and fleets, next to additional recharging infrastructure and
     battery manufacturing. This resulted in a 221% growth for newly registered BEVs in Q3/2020 year on year,
     and a market share of 4.8% or even 20.1%, when all e-based varieties are included.4
     Furthermore, Member States should prioritise investments into the integration of BESS and smart grid
     projects that unlock distributed flexibility resources in the energy system. Spain’s recovery plan set a very
     good example in this regard, planning to allocate investments to deploy transmission and distribution level
     smart grids with a view to integrate additional shares of renewable energy.

                                                                            3   According to electrical contractors’ association EuropeOn.
2    Taiyang News (2020). Renewables Find Mention in COVID-19 Economic
     Stimulus Package Of Japanese Government; Up To $1 Billion To Support   4   Strategy& (2020). Wachsendes Angebot elektrisiert die Kunden:
     Corporate Renewable PPAs Under Commitment To RE100.                        Zulassungen von E-Autos legen in Deutschland um 168% zu.

EU Market Outlook For Solar Power 2020 - 2024                                                                                                   7
Policy recommendations / continued

    4. Support the European solar manufacturing sector - Relevant flagship initiative: Power up
       Recovery funds should support the domestic research and innovation on solar PV emerging technologies
       and facilitate the development of new manufacturing projects in Europe, strengthening Europe’s long-term
       energy security and ensuring European innovations lead to job creation and economic growth in Europe.
       To support the development of innovative solar manufacturing pan-European projects, SolarPower Europe
       launched the Solar Manufacturing Accelerator which successfully presented ten leading PV manufacturing
       projects in July 2020.

    5. Reconvert former coal and industrial sites with solar
       Member States should seek to support the reconversion of former coal and industrial sites into hubs for
       innovative solar applications. Supporting the development of utility-scale solar, floating solar, biodiverse solar
       and agricultural photovoltaics coupled with BESS creates new growth ecosystems in areas affected by the
       clean energy transition.

    6. Finance training & re-skilling programs
       Solar creates more jobs than any other energy source.5 By boosting the deployment of solar, Member States
       will drive job creation for workers across a very wide range of experiences and backgrounds.
       National Recovery & Resilience Plans should support job creation in solar by providing fiscal and
       administrative incentives for companies looking to expand their workforce. In addition to this, recovery plans
       should be used to launch large-scale training programmes to provide the necessary skills to deploy the
       infrastructure needed to achieve the clean energy transition. Specifically, recovery funds should be used to
       fund the re-skilling of fossil fuel workers.

                                                                                                                     © Shutterstock/lalanta71

                                                               5    IRENA (2020). Renewable Energy Jobs Continue Growth to 11.5 Million
                                                                    Worldwide.

8                                                                                        EU Market Outlook For Solar Power 2020 - 2024
1
                                  EU solar markets 2020

                                  © Shutterstock/Altrendo Images

Solar power in the European Union has shown strong                                                                         power plant developers and operators have been
resilience in 2020 despite Coronavirus negatively                                                                          dealing with unexpected competition in 2020. Due to
impacting everyone’s lives in many ways. While the                                                                         lower economic activities, industrial and wholesale
solar industry has successfully worked on further                                                                          electricity prices dropped dramatically across the
reducing costs for solar power generation, commercial                                                                      Continent (see Fig. 1).

FIGURE 1 PV LEVELISED COST OF ELECTRICITY (LCOE) IN FIVE EU LOCATIONS, 2020-2050

                                    110
                                   100
Utility-scale PV LCOE (EUR/MWh)

                                     90
                                     80
                                     70
                                     60
                                     50
                                     40
                                     30
                                     20
                                     10
                                      0
                                            2020
                                                   2025
                                                          2030
                                                                 2040
                                                                        2050

                                                                               2020
                                                                                      2025
                                                                                             2030
                                                                                                    2040
                                                                                                           2050

                                                                                                                  2020
                                                                                                                         2025
                                                                                                                                2030
                                                                                                                                       2040
                                                                                                                                              2050

                                                                                                                                                     2020
                                                                                                                                                            2025
                                                                                                                                                                    2030
                                                                                                                                                                           2040
                                                                                                                                                                                  2050

                                                                                                                                                                                         2020
                                                                                                                                                                                                2025
                                                                                                                                                                                                       2030
                                                                                                                                                                                                              2040
                                                                                                                                                                                                                     2050

                                                    Finland                           Germany                              France                                  Italy                           Spain

                                                   2020 industrial electricity prices *                                            Additional PV LCOE with 10% nominal WACC
                                                   2020 wholesale electricity prices **                                            Additional PV LCOE with 7% nominal WACC
                                                   2019 industrial electricity prices                                              Additional PV LCOE with 4% nominal WACC
                                                   2019 wholesale electricity prices                                               PV LCOE with 2% nominal WACC

*: H1 2020 average national price for medium-size industrial consumers (without taxes).
**: H1 2020 average national price for wholesale baseload electricity.
SOURCE: European Commission (2020); Eurostat (2020); ETIP PV (2020).                                                                                                                      © SOLARPOWER EUROPE 2020

EU Market Outlook For Solar Power 2020 - 2024                                                                                                                                                                               9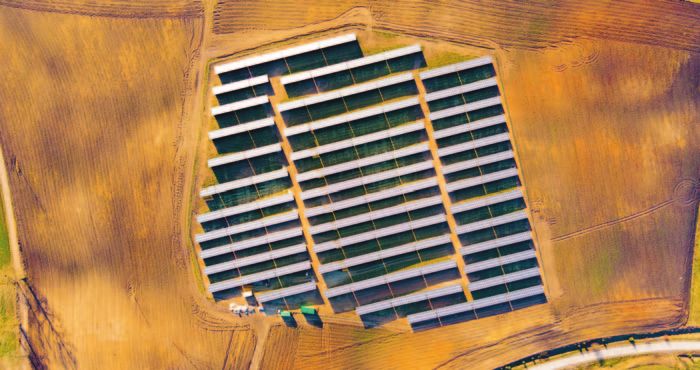
1 EU solar markets 2020 / continued

     In 2019, large-scale solar power plants easily                                            Surprisingly, demand for solar power technology in the
     outcompeted both industrial and wholesale                                                 European Union did not decrease but rather increased
     electricity prices in southern and northern Europe in                                     notably in 2020. EU members states installed 18.2 GW
     basically any interest rate environment. Only a few                                       in 2020 – that’s an 11% improvement over the 16.2 GW
     months later, the business case for large scale solar                                     deployed in the previous year (see. Fig.2). This makes
     was different, requiring much better financing                                            2020 the second-best year ever for solar in the EU,
     conditions to beat wholesale power prices. But this                                       only topped by 2011, when 21.4 GW was installed. The
     and other challenges brought upon the European                                            number is about 12% less than what we had
     solar sector through Coronavirus have had less                                            forecasted in last year’s Medium Scenario of the EU
     impact than anticipated.                                                                  Market Outlook, but higher than in our Global Market
                                                                                               Outlook published in June, when we had strongly
                                                                                               revised the number downwards after the first
                                                                                               Coronavirus wave (see Box 1, p. 14).

     FIGURE 2 EU27 ANNUAL SOLAR PV INSTALLED CAPACITY 2000-2020

          25

          20
                                                                                                                                                                   18.2
                                                                                                                                                            11%

          15
     GW

                                                                                                                                                    110%

          10

                                                                                                                                             55%
           5                                                                                                                           31%

           0
                 2000

                        2001

                               2002

                                      2003

                                             2004

                                                    2005

                                                           2006

                                                                   2007

                                                                          2008

                                                                                 2009

                                                                                        2010

                                                                                                2011

                                                                                                        2012

                                                                                                               2013

                                                                                                                      2014

                                                                                                                             2015

                                                                                                                                      2016

                                                                                                                                             2017

                                                                                                                                                     2018

                                                                                                                                                            2019

                                                                                                                                                                    2020e

                   Germany                                 Netherlands                                 Spain                                   Poland
                   France                                  Italy                                       Hungary                                 Belgium
                   Greece                                  Portugal                                    Rest of EU27

                                                                                                                                                                   © SOLARPOWER EUROPE 2020

10                                                                                                                                  EU Market Outlook For Solar Power 2020 - 2024
1.1. Top 5 EU solar markets 2020 GW per year for the last 3 years, reaching 4.8 GW in
2020, 25% more than last year, and 74% higher than
Germany is again the largest solar market in Europe, a
the second largest European market.
position it held for most of the time over the last 20
years, interrupted only six times, once by Italy, twice Europe’s new No. 2 in 2020 is likely the Netherlands,
by Spain and three times by the UK. After a which moved up one rank, after installing an
consolidation phase following the first full feed-in estimated 2.8 GW, a 23% rise compared to 2.3 GW
tariff based European solar boom, the Continent’s installed in 2019. The biggest market segment in 2020
largest economy’s solar sector has been experiencing again was commercial rooftops, which increased their
a second boost as of 2018. This is due to a share to nearly 50%. The residential market, though in
combination of self-consumption with attractive absolute terms stable, saw its portion shrink by about
feed-in premiums for medium- to large-scale 10% points down to nearly 30%. The market segment
commercial systems ranging from 40 kW to 750 kW. of ground-mounted systems remained at around 20%,
It is also due to auctions for systems up to 10 MW and with the largest PV plant so far, a 110 MW in Groningen
a tried and tested regulatory scheme on the one the province, becoming operational this year. There is an
hand and solar’s steadily improving cost increasing interest in multifunctional use of space, like
competitiveness on the other hand. After a first small floating solar or solar carports, with the largest solar
subsidy-free system of 8.8 MW was installed in 2019, panel carport of 35 MW having recently started
several more powerful ones have followed in 2020, construction. The main two drivers for solar in the
with the country’s largest solar power plant, a 187 MW Netherlands continue to be net metering for the
utility-scale system starting to feed its first electricity residential and small business segments, while the
into the grid in November while still being under commercial and utility-scale markets rely on the SDE+
construction. These developments have enabled tendering scheme, where solar has to compete with
Europe’s dominant solar market to grow by around 1 other renewable energy sources (and as of 2021 with
CCS and energy saving projects).
FIGURE 3 EU27 TOP 10 SOLAR PV MARKETS, 2019-2020
6
2019
5 4.8 4.8
2020e
4 3.9
GW
3 2.8
2.6
2.3 2.2
2
1.0 1.0 0.9
1 0.8 0.8 0.7 0.6 0.7 0.6
0.5 0.5
0.2 0.2
0
Hungary
Greece
Spain
Germany
Poland
Belgium
Portugal
Netherlands
France
Italy
© SOLARPOWER EUROPE 2020
EU Market Outlook For Solar Power 2020 - 2024 111 EU solar markets 2020 / continued 12 EU Market Outlook For Solar Power 2020 - 2024
Spain’s time on Europe’s solar throne lasted only one       France fell back one place, now ranking fifth among the
year. The southern European country dropped to rank         EU’s top PV markets. It installed an estimated 945 MW
3 with an estimated newly installed capacity of around      in 2020, 7% down from 1,021 MW in 2019. In Q3/2020,
2.6 GW, down 45% from around 4.8 GW last year.              France reached the threshold of 10 GW total solar
Nearly 4 GW of the 4.2 GW ground-mounted power              capacity. This is 2 years late according to the original
plant capacity installed in 2019 mostly stemmed from        plan, which requires nearly 10 GW more to meet its
two tenders in 2017. But in 2020 there were no new          20 GW target by end of 2023, and needs over three
volumes from additional tenders to be deployed.             times more to reach the its goal of 44 GW by 2028. For
Instead, nearly 1.5 GW of the 2020 installations came       years, France’s installations have been hovering close
from PPA based systems out of a 100 GW+ pipeline            to the 1 GW level, with long administrative procedures
under development in Spain. This makes the country          and challenging grid connection processes hindering
probably the world’s largest market for subsidy-free        developers to speed up installations. Moreover,
solar, while showing at the same time that grid             investors have been irritated by a government bill to
constraints can dramatically slow down the                  retroactively cut feed-in tariffs for existing solar power
installation pace for solar power plants. The self-         plants, passed by the Parliament but later rejected by
consumption rooftop market grew less than originally        the Senate in fall 2020.
anticipated due to COVID-19, which has hit Spain
                                                            In total, the European Union’s Top 5 solar markets were
extraordinarily hard and has resulted in a dire
                                                            responsible for 74% of the 2020 installed capacity in
economic situation where many SMEs have been
                                                            the region compared to a 5% points higher share
delaying or even abandoning their solar project plans.
                                                            (79%) in 2019. When looking at the Top 10, the share
The residential segment was not impacted that
                                                            increases to 90% based on a combined capacity of
negatively, as fiscal incentives of some municipalities
                                                            16.4 GW, which is 1 GW more the group added
apparently had effects on households’ investment
                                                            compared to 2019 (15.4 GW). For the Top 10 the trend
decisions pro solar.
                                                            is similar to the Top 5. Their total share in newly
The biggest surprise on the EU’s solar map is again         installed EU solar capacity declined, in this case by
Poland, the EU’s coal bridge head, where hard and           nearly 4% points from 94% in 2019. That means, even
lignite coal represent nearly 75% of power demand in        though the contribution of the other 24 or 17 EU
2019. Poland not only exceeded the annually installed       member states remains rather small, it is notably
solar GW-scale for the first time, it is also expected to   rising. Furthermore, when taking into account that the
have jumped directly to the second floor in 2020,           Top 5 solar markets represent about 57% of the EU’s
adding 2.2 GW (our number is between the estimates          population and 61% of its GDP, its share is not that
of PV Poland’s figure of 1.85 GW and Stowarzyszenie         prevalent anymore.
PV’s figure of 2.3 GW). This positive solar development
                                                            It seems the time has come as the vast majority of EU
follows on the previous year’s scoop, when Poland’s PV
                                                            member states has been jumping on the solar train
market grew almost four-fold to 972 MW. The
                                                            directed by a few pioneers. In 2020, 22 of the 27 EU
backbone for the continued strong growth of solar in
                                                            member states installed more solar than the year
Poland is self-consumption founded on a favourable
                                                            before. Despite COVID-19, this is more than in the
policy net-metering/feed-in framework for prosumers.
                                                            previous year, when 21 out of 28 EU members
Most Polish solar systems are smaller than 1 MW, with
                                                            experienced solar market growth. This development
the bulk installed in the micro-generation segment
                                                            is supported by analysis of the members states’
(under 50 kW), adding up to around 350,000 systems
                                                            National Energy Climate Plans indicates, which
by end of 2020. Beyond net metering and FiTs, Poland
                                                            indicate growing awareness and increasing solar
offers further financial incentives, including reduced
                                                            activities in most of the countries (see Chapter 3).
VAT and income taxes, and low-interest loans. The
micro-generation segment is complemented by an
annually held RES auction scheme launched in 2016
and a newly developing PPA segment that just saw the
first few systems being installed.

EU Market Outlook For Solar Power 2020 - 2024                                                                            13
1 EU solar markets 2020 / continued
Box 1: Looking back and forth
When we published our previous EU Market Outlook in December 2019, Europe’s solar world was in order.
After the market had more than doubled in 2019, the European Union appeared well prepared for another
year of growth. Our Medium Scenario assumed 26% growth to 20.6 GW for 2020, the final year to meet
the 2020 climate targets. It also assumed a year to take a breath in 2021 with a 4% growth, before demand
was anticipated to get back to low two-digit levels, with 11% and 10% in 2022 and 2023, respectively, as
the next climate- relevant EU objectives were far off, in 2030. The advent of COVID-19 has changed
everything. After the first heavy wave hit Europe, we changed our model for the Global Market Outlook
published in June, then expecting an 18% year-on-year collapse in our Medium Scenario, while the High
Scenario still offered hope of reaching 18.6 GW. Solar has been rather lucky and walked the High Scenario
path. The second quarter results from several leading EU markets turned out much better than feared, in
particular for Germany, which kept its DIY shops open and handymen working in spring. In September, we
adjusted our main case assumption significantly upward to -10%. But even that was too pessimistic. The
attractiveness of flexible, low-cost solar power made the technology very resilient to the virus, finally
turning the tide, again resulting in another growth year, with 18.2 GW and a resulting remarkable plus 11%.
While this is still 12% less than originally anticipated in our EMO 2019, no analyst had expected such an
outcome in late spring. With several European Green Deal tools integrated in the Recovery Package, and
the momentum for the lowest cost, versatile green power only getting stronger, we have significantly
upped our growth expectations for the next 4 years. Our Medium Scenario now forecasts 22.4 GW in 2021,
which means 5% higher demand than forecasted last year. For 2022 and 2023 we are even more upbeat,
now projecting 15% and 18% higher deployments than in our EMO 2019. Still, the new growth outlook has
to be taken into perspective. A close look at the cumulative installed capacity reveals that COVID-19
impacts will delay market growth by 2 years. As it stands now, it will take until 2022, before total installed
solar power capacities will reach the level, we forecasted in our EMO 2019.
FIGURE 4 COMPARISON MEDIUM SCENARIO EMO 2019 VS 2020
300
250
3%
200 1%
-1%
GW
150 -1%
100 % Positve change
-% Negative change
50
15% 18% EMO 2019*
-12% 5%
0
EMO 2020
2020 2021 2022 2023 2024 2020 2021 2022 2023 2024
Annual Cumulative
*: Values have been adjusted by subtracting the UK values to allow comparison. © SOLARPOWER EUROPE 2020
14 EU Market Outlook For Solar Power 2020 - 2024FIGURE 5 EU27 CUMULATIVE SOLAR PV INSTALLED CAPACITY 2000-2020
140 137.2
15%
120
16%
100 8%
6%
80
GW
60
40
20
0
2000
2001
2002
2003
2004
2005
2006
2007
2008
2009
2010
2011
2012
2013
2014
2015
2016
2017
2018
2019
2020e
Germany Netherlands Spain Poland
France Italy Hungary Belgium
Greece Portugal Rest of EU27
© SOLARPOWER EUROPE 2020
The EU-27 member states’ cumulative installed solar 2020 year-end cumulative solar capacity of 9.2 GW.
capacity ranking in 2020 has remained basically the All Top 10 EU markets operate over 1 GW of solar
same (see Fig. 5). Germany keeps the major share, power capacity, with Belgium above the 5 GW level,
operating the largest capacity of solar power plants in Poland, Greece and Hungary in the 2-4 GW range, and
the European Union, with 54.6 GW of total installed the smallest one, Portugal now estimated to own 1.4
capacity. Germany’s distance from the far off second GW. Other GW-level EU solar fleets are generating
place is getting even larger, as Italy’s solar fleet, which power in Austria, Bulgaria, Czech Republic, Romania
added only around 0.8 GW, now consist of 21.3 GW. and Sweden, with the latter exceeding the GW
One major difference in our ranking is due to Brexit, threshold for the first time in 2020.
which means that last year’s No. 3, the UK, is not listed
While Germany lost a little of its cumulative market
anymore. Instead, Spain takes over the third rank in the
share, reaching 40%, down from 42% in 2019, as well
EU with 13.2 GW, which is still a few hundred MW
as Italy, now at 16%, down from 17%, the European
behind the UK. While one two-digit GW market was
Union’s two largest operators of solar power
lost, another one has come up. By the end of 2020,
generation assets together claim a total share of 56%
France is estimated to generate solar electricity from
from 75.9 GW in 2020 compared to 59% and 70.3 GW
10.9 GW. The only other EU market about to touch the
in 2019. The share of the Top 5 cumulative markets
two-digit GW level in 2021 is the Netherlands with a
reached 80%, the Top 10 accounted for 92%.
EU Market Outlook For Solar Power 2020 - 2024 151 EU solar markets 2020 / continued
FIGURE 6 EU27 TOP 10 COUNTRIES SOLAR CAPACITY PER CAPITA 2019
Germany Netherlands Belgium
1st 2nd 3rd
651 539 466
Watt/capita Watt/capita Watt/capita
Malta Italy Greece Luxembourg Estonia Denmark Spain
4th 5th 6th 7th 8th 9th 10th
425 353 321 318 305 290 283
Watt/capita Watt/capita Watt/capita Watt/capita Watt/capita Watt/capita Watt/capita
SOURCE: United Nations (2020). © SOLARPOWER EUROPE 2020
Solar per capita In summary, solar in the European Union has proved
much more resilient to the Coronavirus than
The EU country with the largest population, Germany
anticipated in the late spring. The newly installed
continues to rank highest for another comparison of
capacity in 2020 is less than forecasted in last year’s
total installed solar capacity, though in this regard its lead
EU Market Outlook, but demand has grown by 11% to
is much less prevalent. Germany has more solar installed
18.2 GW, and the cumulative installed capacity
per capita (651 W) than any other Union peer. But the
increased by 15% to 137.2 GW. In terms of watt per
Netherlands has been catching up very quickly on this
capita, two member states, Germany and the
metric, coming close with 539 W/capita, after each
Netherlands, are now having the equivalent of at least
citizen installed an average of 384 W in 2019. All other
one of the new large size 500 W solar panels installed
Top 10 EU solar markets have per capita installed
for each citizen.
capacities between 466 W (Belgium) and 283 W (Spain).
16 EU Market Outlook For Solar Power 2020 - 20241.2. EU solar market prospects 2021-2024 utility-scale solar, which is lower than for any other
power source;
A surprisingly positive 2020 for the EU solar sector will
be followed by 4 years characterised by even stronger • Solar increasingly wins in cost-based technology
demands in our Medium Scenario (see Fig. 7). After neutral energy tenders, such as in France, Spain,
demand improved by 11% in 2020, we expect a 23% Denmark, and multiple times in Germany;
boost for 2021. Installations are expected to reach
• Its low cost has also created a business case for
22.4 GW, which would mean an all-time high for the
subsidy-free solar systems, with the number of
European Union, beating the decade old 21.3 GW
corporates opting for solar to source their power
record from 2011. Market growth will not slow down
quickly augmenting;
in 2022, when new annual additions are supposed to
reach 27.4 GW. Though the growth rate will slightly • Solar’s versatility is unmatched, enabling various
decrease to 13% in 2023 and 14% in 2024, both years multi-purpose applications that meet quickly
are anticipated to see solar deployment above the 30 increasing interest now that solar is cost
GW level, with 30.8 GW in 2023 and 35.1 GW in 2024. competitive. Examples include rooftop solar for
carparks allowing direct EV charging or floating
SolarPower Europe’s growth assumptions are much
solar and Agri-PV that promise owners of
higher than the targets formulated by EU members
water/land areas to enter energy production while
states in their National Energy and Climate Plans (see
benefiting from further advantages as solar panels
Chapter 3). But with drivers for solar in Europe only
offer shading facilities, which reduces evaporation
getting stronger, the foundation is laid for further
in water reservoirs;
rapid growth in the coming years, among other
reasons, because: • Various EU policy initiatives in the context of the
EU Green Deal striving for carbon neutrality and the
• Solar’s cost reduction continues. US investment
Recovery Packages will directly or indirectly boost
bank Lazard’s latest edition of its annual Levelized
solar, as discussed in our Chapter on Key Policy
Cost of Energy Report 2020 showed a 7% year-on-
Files for Solar (see p. 22).
year decrease to an average of 0.04 USD/kWh for
FIGURE 7 EU27 ANNUAL SOLAR PV MARKET SCENARIOS 2021-2024
50
45.0
45
40
35 14%
30 28.8 13%
22%
GW
25
23% 19.8
20 18.2
14.9 Medium Scenario
15
10
Historical data
5
Low Scenario
0
High Scenario
2015 2016 2017 2018 2019 2020e 2021 2022 2023 2024
© SOLARPOWER EUROPE 2020
EU Market Outlook For Solar Power 2020 - 2024 171 EU solar markets 2020 / continued
The next 4 years of our Medium Scenario can be retroactive cuts in France or various proposals for
divided into 2 phases. In a catch-up phase we will see Germany’s EEG 2021 revision (see p. 45).
solar projects being built after they were originally
The High Scenario projects 28.8 GW already in 2021
delayed or even cancelled due to COVID-19 but are
and up to 45 GW new solar additions in 2024, which
offered new opportunities primarily through incentives
sounds also very improbable from today’s view. But
from economic stimulus funds. This 20% plus growth
solar has rather often surprised everyone positively in
phase will be trailed by a more moderate phase,
the past, including in 2020. Our High Scenario
involving a 13-14% growth period in 2023/24. Demand
assumes solar turns into a big beneficiary of the Green
in those 2 years will be driven mostly by customers
Deal and Recovery Packages, assumes no import
attracted to solar’s very flexible potential to reduce
taxes for solar products, no prohibitive taxes or fees
their energy expenses and improve sustainability. This
on self- consumption/storage, no obstacles to
will involve even more energy companies, investors
subsidy-free solar PPAs, or any other barriers that
and corporates as well as residential prosumers, while
could slow down flexible and distributed solar power.
member states will have implemented the necessary
framework conditions to push and pull renewables in The cumulative PV market scenarios from 2021 to
order to meet their 2030 EU climate targets. 2024 show constant, two-digit annual growth rates
that are a little higher than in our previous EU Market
The Low Scenario, on the other hand, anticipates
Outlook. The Medium Scenario now forecasts 16-17%
dwindling demand in 2021 to a volume of 14.9 GW,
growth rates compared to 13-16% levels last year,
growing only to 19.8 GW in 2023. This scenario was
adding around 115.5 GW to reach 252.9 GW end of
modelled on major EU markets slashing solar support
2024, from 137.2 GW today (see Fig. 8). With annual
and implementing policies that would disable key
PV deployments anticipated to be higher as of 2021,
business models. Such an outcome is close to
it will take until 2022 for the market to fully catch up
impossible when even COVID-19 had only limited
with pre-COVID-19 assumed market volumes (see
impact on solar demand in the EU, and when
Box 1, p. 14). The High Scenario sees the EU reaching
observing current solar activities and policy
292.8 GW in 2024, but even our Low Scenario
discussions, where the climate crisis is very high on
assumes the EU will add over 60 GW to operate a
many decision-makers’ agendas, even though certain
200.3 GW solar capacity by the end of 2024.
activities are indeed counter-productive, like
FIGURE 8 EU27 TOTAL SOLAR PV MARKET SCENARIOS 2021-2024
350
300 292.8
250 17% 16%
16% 16%
200.3
200
173.1
GW
150 137.2 145.1
Medium Scenario
100
Historical data
50 Low Scenario
0
High Scenario
2015 2016 2017 2018 2019 2020e 2021 2022 2023 2024
© SOLARPOWER EUROPE 2020
18 EU Market Outlook For Solar Power 2020 - 2024In line with our general very positive EU Market Outlook, Netherlands. While Spain has a huge PPA project
we are more upbeat on the solar developments of the development pipeline, grid constraints remain a major
largest 10 EU markets (see Fig. 9). For most of these obstacle. Although a new auction calendar was
markets, the 4-year installation forecasts from 2021 published, it will take time before these power plants
to 2024 (listed in the order of the Medium Scenario will be built, so that self-consumption rooftop systems
assumptions) expect more power additions than in the will become a stronger pillar over the coming years.
previous outlook. We now anticipate Germany to be Solar in the Netherlands is supposed to keep thriving
the largest market for the coming years in all 3 on a broad incentive scheme landscape, which will
scenarios, despite the uncertainties along the EEG enable the country to defend its third rank. That is,
2021 revision, which contains several provisions that unless France or Italy who both have major solar
will make life much harder for solar investors. The most growth plans finally overcome their bureaucratic
severe is the implementation of tenders for rooftop hurdles to tap the huge potential available in these
systems as of 500 kW, incrementally going down to spacious and sunny European countries. We see also a
100 kW. Still, the momentum for solar in Germany is lot of solar growth opportunities for Europe’s latest
expected to stay strong, also backed by the fast ascent shooting star Poland, now part of the Top 5 markets for
of PPA-based systems. It is most likely Spain will add the next 4 years. Notable additions in the Top 10 list are
the second most solar capacity, closely followed by the Bulgaria and Denmark. In Bulgaria, recent regulatory
FIGURE 9 EU27 TOP 10 SOLAR PV MARKETS ADDITIONS 2021-2024
32.2
Germany
15.0
20.4
Spain
8.6
19.9
Netherlands
10.2
13.8
France
8.0
13.0
Poland
3.3
10.2
Italy
2.8
High scenario
9.1
Portugal Medium scenario
2.6
5.2 Low scenario
Greece
2.2
3.1
Bulgaria
0.7
3.7
Denmark
1.6
0 5 10 15 20 25 30 35
GW
© SOLARPOWER EUROPE 2020
EU Market Outlook For Solar Power 2020 - 2024 191 EU solar markets 2020 / continued
changes for the C&I sector have triggered many likelihood, Denmark will be among the Top 10 markets
companies to look into solar self-consumption adding the largest solar volumes in the European Union
systems. Moreover, the utility-scale solar sector is over the next four years.
finally seeing renewed interest after the brief 2011-12
Our analysis sees the Top 10 EU solar markets install
FiT boom on expectations of rising wholesale prices
98.5 GW from 2021 until 2024 in the most probably
and a coal phaseout after 2025. With very little solar
Medium Scenario, 55.1 in a Low Scenario and 130.7
traction in Bulgaria in the last few years, our model
GW in the High Scenario.
shows a large spread from the Medium to the Low
Scenario. After auctions have opened the field for The fundamentals of our EU solar weather forecast
ground-mount solar in Denmark and proving its have not changed. We will again see a very sunny
competitive cost when outcompeting wind in recent business environment for solar power in the coming
technology neutral tenders, a strong trend to PPA- years, with only few clouds limiting the sun from
based systems is arising, with announcements for shining bright everywhere in the region (see Fig. 10). For
several 100+ MW solar power plants. There is high just 3 of the Top 15 solar markets, we see clouds on the
FIGURE 10 EU27 TOP SOLAR PV MARKETS PROSPECTS
Country 2020 By 2024 2021-2024 2021-2024 Political
Total capacity Total capacity New capacity Compound annual support
(GW) medium (GW) growth rate (%) prospects
scenario (GW)
Germany 54.6 81.5 26.9 11%
Spain 13.3 29.0 15.8 22%
Netherlands 9.2 24.2 15.0 27%
France 10.9 22.7 11.8 20%
Poland 3.6 11.9 8.3 35%
Italy 21.3 27.6 6.3 7%
Portugal 1.4 6.3 4.9 46%
Greece 3.4 7.6 4.2 23%
Bulgaria 1.1 3.8 2.7 35%
Denmark 1.7 4.4 2.7 27%
Belgium 5.4 8.0 2.6 10%
Hungary 2.1 4.4 2.3 21%
Sweden 1.2 3.4 2.2 30%
Austria 2.0 4.0 2.0 19%
Romania 1.4 3.3 1.9 24%
20 EU Market Outlook For Solar Power 2020 - 2024horizon (Germany, Italy, Belgium), the rest is supposed investors. The country does not have a federal auction
to enjoy truly sunny weather. The choice might seem plan for the entire country, the NECP targets are
odd at first glance, but these are the EU member states unambitious, among other reasons.
with the lowest growth expectations (Italy 7%, Belgium
Again, while there are a number of things that need
10% and Germany 11% CAGR). Nearly all others are
improvement, as outlined in our chapters on key policy
expected to boost demand by over 20%. Indeed,
files for solar (see p. 22) and NECP assessment (see p.
Germany will continue to dominate Europe’s solar
30), in general the outlook for solar is very bright in the
sector by far. We anticipate the country will reach 81.5
European Union, in particular when taking into
GW of its 98 GW Climate Law target for 2030 already
account that the regions has been hit very hard by
in 2024. But Germany, which met its 2020 climate
Coronavirus. We expect the largest 15 EU solar
goals only with the help of COVID-19 impacting its
markets to add 109.6 GW in the coming 4 years based
economy, is about to pass a revised EEG 2021 law that
on our most probable Medium Scenario, compared to
puts several obstacles in the way for its solar sector,
81.6 GW in the previous EMO 4-year forecast.
which has just recently recovered from a several year-
long market slump (for details, see feature on Germany, In 2024, the EU solar market is projected to be nearly
p. 45). Italy, despite its ambitious goals for solar, 51 GW twice as large as today, 35.1 GW vs. 18.2 GW, with
by 2030, has seen little progress. A tax incentive as part Germany still leading the region, but at a smaller share
of the Economic Stimulus for small solar and storage of 20% compared to 2020, and ahead of Holland and
systems somewhat helped, but the long-awaited Spain, just in reversed order (see Fig. 11). In the next 4
auctions, which were technology neutral tenders, years, demand will further diversify to smaller
turned out to be disappointing for solar so far. Different countries. The Top 10 market share will decrease to
schemes in Belgium’s regions make it difficult for solar 84%, from 90% today.
FIGURE 11 EU27 SHARES OF TOP 10 SOLAR MARKETS IN 2020 AND 2024
2020 2024
Germany; 27% Germany; 20%
Rest of EU; 10% Rest of EU; 16%
Portugal; 3%
Greece; 3%
Belgium; 4% Romania; 3%
Hungary; 4% Bulgaria; 3%
Greece; 3%
Italy; 4% 18.2 GW 35.1 GW
Poland; 6%
France; 5%
Italy; 6%
Poland; 12%
Portugal; 7%
Spain; 14% France; 10%
Netherlands; 15% Netherlands; 12%
Spain; 14%
© SOLARPOWER EUROPE 2020
EU Market Outlook For Solar Power 2020 - 2024 212
Key policy files
© Shutterstock/only_kim
It has been a big year for energy and climate policies, 1. Clean Energy Package 2.0: reviewing ambitions
following the announcement in November 2019 that for 2030
the EU would commit to achieving climate neutrality by
In September 2020, the European Commission
2050, and convert these climate ambitions into a new
proposed to increase the 2030 GHG emissions target
growth strategy for Europe: the European Green Deal.
from at least 40% to at least 55%. The Commission
Following this, key initiatives have been rolled out in has updated its Climate Law Regulation proposal from
2020, starting with the publication of a European March to include the new 2030 target, in addition to
Industrial Strategy in March, the publication of an the climate neutrality target by 2050. The Climate Law
Energy System Integration Strategy and Hydrogen is due to be negotiated between EU Member States
Strategy in July, and the publication of a European and the European Parliament, with the former not yet
Renovation Wave in October. More critical initiatives settled on a specific figure, and the latter supporting
are on the way: in December 2020, the European an even greater ambition of 60% GHG emissions
Commission will propose a new framework for EU reductions by 2030.
electricity grids (TEN-E) and review the Clean Energy
Regardless of the final GHG target, increased climate
Package legislation to cope with new ambitions with
ambition will require an upwards review of both
a view to propose a “Fit for 55 Package” in June 2021.
renewable energy and energy efficiency ambitions.
How can solar companies navigate in this legislative Already overshot by more than 1% according to the
jungle? NECPs, the 2030 target for renewable energy in final
energy demand will have to increase from the current
SolarPower Europe has cleared the way and summed
32%, to between 38% and 40% according to the
up the Top 10 policy trends for solar in Europe.
European Commission. Reaching at least 40% of
renewable energy penetration by 2030 will be
necessary to put Europe on track to achieve a
renewables-based energy system, according to
SolarPower Europe’s 100% Renewable Europe study.
The Commission intends to achieve increased climate
and energy ambitions through a set of legislative
initiatives under the Fit for 55 Package, which is due to
be presented in June 2021 and will include proposals to
revise the Renewable Energy Directive (RED II) and the
Energy Efficiency Directive (EED), in addition to new
policies to revamp carbon emissions rules in the EU. By
December 2020, the Commission will propose a review
of the Energy Performance of Buildings Directive
22 EU Market Outlook For Solar Power 2020 - 2024(EPBD), which will include additional provisions relevant 2. Bridging the gap on carbon pricing
to on-site solar and storage.
Increasing the EU’s 2030 GHG emissions reduction
In addition to introducing higher renewable energy target from 40% to at least 55% means that EU
targets, the review of RED II will seek to introduce new policymakers need to reinforce decarbonisation
measures to reflect the European Green Deal’s action across all economic sectors. The EU Emission
objective, as well as new elements stemming from the Trading Scheme (ETS), one of the central pillars for
Energy System Integration Strategy. decarbonisation, is set to undergo a revision to
recalibrate its strength accordingly:
This Fit for 55 Package is an opportunity to go beyond
Clean Energy Package legislation and further unlock • Tightening and strengthening the mechanisms that
the growth of solar in Europe. This can help accelerate determine the ETS stringency, such as the Linear
the implementation of EU energy and climate Reduction Factor and the Market Stability Reserve,
legislation, by introducing a stronger governance will ensure that higher carbon prices are in place in
system to steer the implementation of NECPs, and the sectors within the ETS scope, including in the
allowing targeted improvements to the Renewable power sector. A higher carbon price on electricity will
Energy Directive. In particular: foster the deployment of renewables at the expense
of fossil-based generation.
• Increasing the EU binding 2030 renewables target
to at least 40%; • An extension of the ETS to other sectors that are
currently outside of the scope is currently under
• Enhancing the EU framework for Guarantees of
consideration. What is crucial is to have some form
Origins (GOs), increasing the transparency and
of carbon pricing in all the sectors – and the ETS is
granularity of the information contained in GOs,
one of the tools to deliver this. Therefore, we
and adapting the certification system to the
support the inclusion of those sectors for which no
uptake of renewables-based hydrogen;
carbon pricing is in place today, notably the
• Further simplifying administrative procedures for shipping sector. By contrast, we identify several
solar installations, notably by introducing fundamental challenges to the direct inclusion of
European-level guidelines on permitting for utility- road transport into the ETS, and we recommend a
scale solar installations and exempting rooftop PV detailed assessment of the impacts of the
installations from construction permits; inclusion of buildings – especially due to
unintended distributional effects on poorer
• Improving the prosumer framework, by clarifying
households, the overlay of other decarbonisation
the regulatory framework for joint self-
policies, and the low effectiveness of current
consumption schemes and developing dedicated
carbon prices.
incentives for C&I systems;
In parallel to revising the ETS, the Commission intends
• Accelerating the deployment of renewable
to propose a Carbon Border Adjustment Mechanism
electricity in the transport and heating sectors.
in 2021, to target the carbon leakage issue, which is
Beyond higher energy efficiency ambition, the revision increasingly relevant as the ETS price rises. The current
of the EED will seek to overcome the 3% ambition gap Commission policy options lack adequate information
between Member States’ national contributions and on tool design and application to assess the impacts
existing 2030 energy efficiency targets. The on the solar industry, however, it is clear that along the
Commission plans to focus its efforts on reducing solar PV value chain there will be ambivalent impacts,
energy consumption in buildings, notably through the which could result in lowered EU competitiveness at
Renovation Wave Strategy, which aims to achieve a the global level. To avoid this, it is key to look at options
60% reduction in building energy consumption. The strengthening the instruments already applied within
renewables-based electrification of buildings could the EU, while using soft measures to encourage
reduce primary energy demand by more than 22% by climate action from trade partners.
2030, and 39% by 2050.6
6 SolarPower Europe (2020). 100% Renewable Europe.
EU Market Outlook For Solar Power 2020 - 2024 232 Key policy files / continued
3. Grid modernisation: building the energy transition’s the roll-out of smart technologies, which can optimise
hardware grid operation and unlock new sources of flexibility.
The increased penetration of variable renewables in • The Next Generation EU fund put forward by the
the European energy mix to at least 40%, largely driven Commission to support the recovery of Europe is
by decentralised solar capacities, and the high level of an opportunity to speed up the green and digital
electrification of end-uses to around 60%, will deeply transition, with EUR 20 billion in InvestEU
change the structure of the energy system by 2030. earmarked for sustainable infrastructure.
The limited grid capacity is already becoming a
• In addition, the upcoming revision of the TEN-E
concern, especially in member states that have seen
Regulation, which defines the procedures for
rapid growth of solar installations in the last few years,
interconnection projects to benefit from the CEF-
such as the Netherlands, Spain, and Portugal.
E fund, is an opportunity to accelerate the smart,
Rather than facing the risk of future bottlenecks in the interconnection of European power grids: it will be
connection of new projects, a comprehensive critical to prohibit the funding of new fossil fuel
modernisation of grid planning, including for grid infrastructure and reinforce the sustainability
connection and operation is needed at EU level, with criterion in the selection process of Projects of
a particular focus on distribution grids where most of Common Interest.
the solar projects and electrified end-uses will
Second, the future energy system will require an
connect. New technologies, such as advanced
increasing availability of flexibility resources. From
inverters or smart power plant controllers, will support
utility-scale batteries to domestic storage, and
the grid integration of solar. Two aspects in particular
renewable-based hydrogen, solar electricity can be
can be highlighted:
stored for later use, taking pressure off the grid when
First, the electrification of the European economy demand is high. Thanks to appropriate market and
calls for important investments into power grid price signals, households or electric vehicles loads can
development: EUR 59 billion annually in the next be aggregated and provide flexibility by encouraging
decade according to the European Commission, consumption when electricity is cheapest and in low
almost triple the amount invested annually between demand. In that regard, the development of a new
2011 and 2020. Such investments should also support network code on demand-side flexibility will be critical
Assemini PV park, 23 MW. Cagliari, Italy. © ENI
24 EU Market Outlook For Solar Power 2020 - 2024You can also read


