WASTE 2019 MARKET INTELLIGENCE REPORT - GREENCAPE
←
→
Page content transcription
If your browser does not render page correctly, please read the page content below
Waste

  2019
  Market Intelligence Report

Waste: Market Intelligence Report 2019   i
GreenCape
GreenCape is a non-profit organisation that works at the interface of
business, government and academia to identify and remove barriers to
economically viable green economy infrastructure solutions. Working in
developing countries, GreenCape catalyses the replication and large-scale
uptake of these solutions to enable each country and its citizens to prosper.

Acknowledgements
We thank Sam Smout and Kirsten Barnes for the time and effort that
went into compiling this market intelligence report. For their inputs, we
thank Annabe Pretorius, Chantal Rudman, Hein Fourie, Mike Pienaar, Noko
Sekgobela, Thomas Orr and Marc Lewis, Nokwazi Moyo, the City of Cape
Town and the Stellenbosch local municipality, as well as the various
associations, ORASA, PETCO, POLYCO, SAEWA, PASA, and PRASA. Lastly,
we wish to thank the crushing industry for supplying data, and the RecMat
committee for their technical expertise.

Disclaimer
While every attempt has been made to ensure that the information
published in this report is accurate, no responsibility is accepted for any
loss or damage to any person or entity relying on any of the information
contained in this report.

Copyright © GreenCape 2019

This document may be downloaded at no charge from www.greencape.co.za.
All rights reserved.

Subscribe to receive e-mail alerts or GreenCape news, events, and
publications by registering as a member on our website: www.greencape.co.za

18 Roeland Street, Cape Town, 8001, South Africa

Editorial and review:   Lauren Basson, Salomé Bronkhorst, Quinton Williams
                        and Nicholas Fordyce
Images:                 Bruce Sutherland, Pxhere and GreenCape
Layout and design:      Tamlin Lockhart Art Direction

ii                                                                              Waste: Market Intelligence Report 2019
This report is dedicated to South Africa’s former Minister
                    of Environmental Affairs, Edna Molewa, who passed away
                    recently. Ms Molewa made a significant contribution to a
                     democratic and sustainable South Africa. A progressive
                   and passionate minister, her vision, especially around waste
                   management in the country, will remain an inspiration to all.

Waste: Market Intelligence Report 2019                                             iii
Contents

Executive summary                                                                            x
What’s new?		                                                                                1
1. Introduction and purpose                                                                  2
2. Sector overview                                                                           4
   2.1. Sector structure                                                                     4
		      2.1.1. Public sector                                                                 5
		      2.1.2. Private sector                                                                6
		 2.1.3. Households                                                                         6
		      2.1.4. Recycling industry associations                                               7
		      2.1.5. Informal waste collectors                                                     7
   2.2. Size of the South African waste sector                                               7
		      2.2.1. Household separation levels                                                   9
   2.3. Size of the Western Cape waste sector                                              10
   2.4. General drivers for waste beneficiation                                            13
		      2.4.1. Increasing cost of landfilling                                              13
		      2.4.2. Loss of landfill airspace                                                   14
		      2.4.3. Perceived job creation in waste                                              15
   2.5. General risks and barriers                                                          15
   2.6. Highlights from 2017/2018                                                          16
3. Legislation and regulations                                                             18
   3.1. The legislative framework for waste management                                     18
   3.2. New regulatory updates                                                             19
   3.3. Draft regulations                                                                  20
   3.4. Anticipated regulations / guidelines                                               20
4. Opportunities                                                                           22
   4.1. Organics                                                                           22
		      4.1.1. Market overview                                                             22
		 4.1.2. Opportunities                                                                    26
		 4.1.3. Drivers                                                                          27
		      4.1.4. Risks and barriers                                                          27
		      4.1.5. Recent developments                                                         31
   4.2. Electronic waste                                                                   32
		      4.2.1. Market overview                                                             32
		 4.2.2. Opportunities                                                                    35
		 4.2.3. Drivers                                                                          37
		      4.2.4. Risks and barriers                                                          37
   4.3. Plastics                                                                           38
		      4.3.1. Market overview                                                             38
		 4.3.2. Opportunities                                                                    44
		      4.3.3. Drivers                                                                     44
		      4.3.4. Risks and barriers                                                          44
		      4.3.5. Recent developments                                                         45
   4.4. Builders’ rubble                                                                   45
		      4.4.1. Market overview and opportunities                                           45
		      4.4.2. Drivers                                                                     47
		      4.4.3. Risks and barriers                                                          47
		      4.4.4. Recent developments                                                         48

iv                                                       Waste: Market Intelligence Report 2019
5. Funding and incentives                                 52
   5.1. General database web page                         52
		      5.1.1 Green finance database                      52
		      5.1.2 Government funding and incentive database   52
		      5.1.3 Finfind database                            52
		      5.1.4 AlliedCrowds database                       52
6. The Western Cape: Africa’s green economy hub           54
7. GreenCape’s support to businesses and investors        58
8. Annex A: Western Cape waste tonnages                   60
   Annex B: CoCT waste characterisation study              61
9. References                                             62

Waste: Market Intelligence Report 2019                      v
List of figures

Figure 1:
Waste collection and treatment responsibilities in South Africa                                        5
Figure 2:
Classification of total waste generated in South Africa in 2011                                        8
Figure 3:
Household separation by province (2015)                                                               10
Figure 4:
Household separation by metro (2015)                                                                  10
Figure 5:
Western Cape waste characterisation in 2015                                                           11
Figure 6:
Waste characterisation for the CoCT                                                                   12
Figure 7:
Landfill gate fees for general waste for South Africa’s eight metros in 2017/2018                     13
Figure 8:
Landfill gate fees (excl. VAT) for the CoCT (2013/14 – 2020/21)                                       14
Figure 9:
Estimated landfill lifespan for each local municipality in the Western Cape                           15
Figure 10:
Organic waste relative to total waste generated in the Western Cape in 2015                           23
Figure 11:
Current and planned (by 2022) MSW, commercial, and industrial organic waste solution in CoCT          26
Figure 12:
Typical e-waste value chain                                                                          34
Figure 13:
Comparison of the use of virgin plastic versus recyclate plastic in 2017                             38
Figure 14:
Types and tonnages of plastic recycled and exported in South Africa in 2017                          39
Figure 15:
Generic plastics value chain                                                                         39
Figure 16:
Source of feedstock by value chain in 2017                                                           40
Figure 17:
Source of feedstock by stakeholders in 2017                                                          40
Figure 18:
End market of plastic recyclate in 2017                                                               41
Figure 19:
Provincial plastic distribution based on pop and GVA distribution for 2017                           43
Figure 20:
Number of plastic recyclers per province and total recyclate produced in 2017                        44
Figure 21:
Gross Fixed Capital Formation and forecast of construction sector growth                              47

vi                                                                 Waste: Market Intelligence Report 2019

List of tables

Table 1:
Recyclables processed and available in 2017 as reported by associations                       9
Table 2:
Total waste tonnages generated per district municipality / metro in 2015                      10
Table 3:
MSW generated per district municipality/metro in 2015, 2018 and 2021                          12
Table 4:
Organic waste generated in the Western Cape in 2015                                           24
Table 5:
MSW organic waste generated in the Western Cape between 2015 and 2021                         24
Table 6:
Commercial and industrial organic waste generated in the Western Cape between 2015 and 2021   25
Table 7:
Viable project models in South Africa as of March 2018                                        29
Table 8:
Reported tonnages of e-waste: South Africa and the Western Cape                               33
Table 9:
Distribution of e-waste generation across the Western Cape for 2018                           33
Table 10:
SADC e-waste generated in 2016                                                                36
Table 11:
Plastics from MSW: Western Cape and Cape Town (2015 – 2021)                                   42

Waste: Market Intelligence Report 2019                                                        vii
List of abbreviations
            and acronyms
AD                     Anaerobic digestion
AWT                    Alternative waste treatment
CCA                    Customs-controlled area
C&DW                   Construction and demolition waste
C&I                    Commercial and industrial
CoCT                   City of Cape Town
DEA                    Department of Environmental Affairs
DEA&DP                 Western Cape Department of Environmental Affairs and Development Planning
DEDAT                  Western Cape Department of Economic Development and Tourism
DoE                    Department of Energy
DST                    Department of Science and Technology
dti                    Department of Trade and Industry
EAP                    Environmental Assessment Practitioner
EAPASA                 Environmental Assessment Practitioners Association of South Africa
EIA                    Environmental impact assessment
EPR                    Extended producer responsibility
ETI                    Employment tax incentive
eWASA                  e-Waste Association of South Africa
GDP                    Gross domestic product
GFCF                   Gross fixed capital formation
GIZ                    Deutsche Gesellschaft für Internationale Zusammenarbeit
GN                     Government Notice
GRI                    Gestamp Renewable Industries
GVA                    Gross value added
GW                     Gigawatt
GWIS                   Gauteng waste information system
HCRW                   Health care risk waste
ICT                    Information and Communications Technology
IDC                    Industrial Development Corporation
IT                     Information technology
ITAC                   International Trade Administration Commission of South Africa
IPP                    Independent power producer
ISO                    International Organization for Standardization
IIWTMP                 Integrated Industry Waste Tyre Management Plan
IndWMP                 Industry Waste Management Plan
IWMP                   Integrated Waste Management Plan
KfW                    Kreditanstalt für Wiederaufbau (Reconstruction Credit Institute)
KfW Entwicklungsbank   KfW Development Bank
kWh                    Kilowatt hour(s)
LDPE                   Low-density polyethylene
MFMA                   Municipal Finance Management Act, No. 56 of 2003
MIG                    Municipal Infrastructure Grant
MIR                    Market intelligence report
MRF                    Material recovery facility
MSA                    Municipal Systems Act, No. 32 of 2000
MSW                    Municipal solid waste
MW                     Megawatt(s)
NDP                    National Development Plan
NEMA                   National Environmental Management Act, No. 107 of 1998
NEMAQA                 National Environmental Management Air Quality Act, No. 39 of 2004

viii                                                            Waste: Market Intelligence Report 2019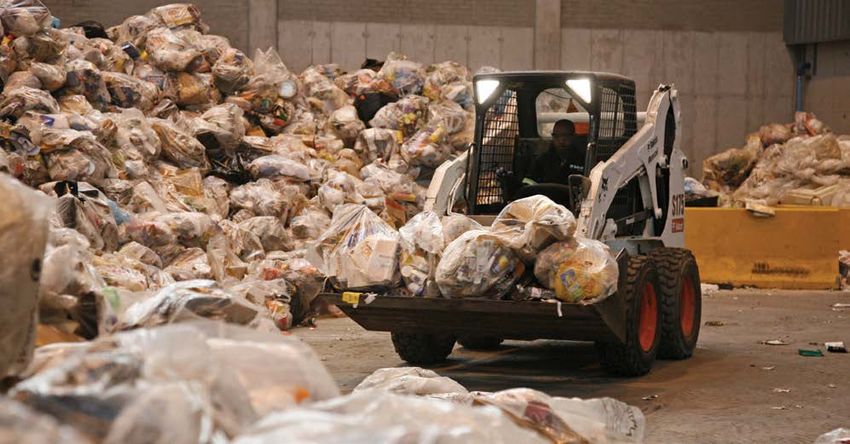
NEMWA                      National Environmental Management: Waste Act, No. 59 of 2008
NPSWM                      National Pricing Strategy for Waste Management
NWIB                       National Waste Information Baseline
NWMS                       National Waste Management Strategy
ORASA                      Organic Recyclers Association of South Africa
PCB                        Printed Circuit Boards
PE-HD                      High-density polyethylene
PE-LD                      Low-density polyethylene
PE-LLD                     Linear low-density polyethylene
PET                        Polyethylene terephthalate
PETCO                      PET Recycling Company of South Africa
Polyco                     Polyolefin Recycling Company
PP                         Polypropylene
PPP                        Public-private partnership
PRASA                      Paper Recycling Association of South Africa
PRO                        Producer responsibility organisation
PS                         Polystyrene
PS-E                       Polystyrene expanded
PSPC                       Polystyrene Packaging Council
PVC                        Polyvinyl chloride
R&D                        Research and development
RDF                        Refuse delivered fuels
RDI                        Waste Research, Development and Innovation Roadmap
REDISA                     Recycling and Economic Development Initiative of South Africa
REEEP                      Renewable Energy and Energy Efficiency Partnership
REIPPPP                    Renewable Energy Independent Power Producer Procurement Programme
rPET                       Recycled polyethylene terephthalate
SABIA                      Southern African Biogas Industry Association
SAEWA                      South African e-Waste Alliance
SALGA                      South African Local Government Association
SANEDI                     South African National Energy Development Institute
SAVA                       Southern African Vinyls Association
SAWIS                      South African Waste Information System
SEZ                        Special economic zone
SMEs                       Small and medium-sized enterprises
SMMEs                      Small, medium and micro-sized enterprises
SoWR                       State of Waste Report
StEP                       Solving the e-waste problem
SuRF                       Sustainable Roads Forum
TA                         Transactional Advisor
TGRC                       The Glass Recycling Company
UNIDO                      United Nations Industrial Development Organization
VAT                        Value-added tax
WCG                        Western Cape Government

Waste: Market Intelligence Report 2019                                                         ix
Executive summary
        The South African waste management landscape is set to experience
      a raft of legislative and regulatory changes that will advance the country
     toward a more resource-efficient economy. This will create opportunities for
      business and investors in the waste sector who focus on plastics, organics,
                    e-waste, and construction and demolition waste.

Disposal continues to dominate the South                              Although private stakeholders also own landfills,
Africa waste landscape. According to the                              municipal landfills are open for private sector
outdated 2011 national waste information                              disposal. It is more convenient for investors and
baseline (NWIB), South Africa generated ~108                          businesses to partner with the private sector
million tonnes of waste in 2011. The 2011 estimate                    waste generators and waste handlers.
indicates that 10% of the total waste stream is
being recycled with the remaining 90% being                           According to DEA (2017), the waste economy
landfilled. A 2017 update should be available by                      contributed ~R24.3 billion to the South African
early to mid-2019 when the national Department                        GDP in 2016. It provided 36 000 formal jobs and
of Environmental Affairs (DEA) publishes its first                    supported ~80 000 informal jobs/livelihoods. A
State of Waste Report (SoWR). We expect that the                      further R11.5 billion per year could be unlocked by
report will show healthy growth in waste diversion                    2023 by diverting up to 20 million tonnes of waste.
in the country.                                                       The anticipated spin-offs could include 45 000
                                                                      additional formal jobs and 82 000 indirect jobs,
The Western Cape province generates ~7.7 million                      as well create of 4 300 SMMEs.
tonnes of waste annually, of which 2.4 million
tonnes (31%) consist of municipal solid waste,                        Opportunities within the organic, e-waste,
2.4 million tonnes (31%) of agricultural and                          plastics and builders’ rubble sectors have the
forestry waste/residues, 1.7 million tonnes (22%)                     potential to unlock ~R1.2 billion in value. However,
of construction and demolition waste, and 0.9                         to unlock this value, stakeholders must be
million tonnes (11%) of commercial and industrial                     involved and technologies implemented. A variety
waste. The remaining 0.4 (5%) consist of other                        of opportunities exist:
waste streams.
                                                                      ■   Organics: In 20181 in the Western Cape there
Of the total for the province, the City of Cape                           were ~520 650 tonnes of MSW organic and ~318
Town generates a substantial portion (48%)                                626 tonnes of commercial and industrial
of the waste, which includes 1.7 million tonnes                           organic waste available for recycling. This
of municipal solid waste, 1 million tonnes of                             total market is valued at an estimated R83
construction and demolition waste, 0.6 million                            million to R158 million per year, depending on
tonnes of commercial and industrial waste, 0.07                           the end product 2. At the municipal level, the
tonnes of agricultural and forestry waste/residues,                       greatest value lies in the CoCT with a market
and 0.3 million tonnes of other waste streams.                            value for organics, depending on product
                                                                          produced, of R59 to R111 million per year.
Household waste is managed by municipalities
and/or by their appointed service providers.
Commercial and industrial waste is typically
managed by the private sector in larger
municipalities, and to some extent the
municipalities themselves.

1
  Excluding agriculture, abattoir and forestry waste
2 Based on a value of between R100 (R20 per 20kg of compost sold in store which is generated from 200kg of organic waste) and R188,
according to Waste Road Map (DST 2014) value for organics per tonne of organic waste.

x                                                                                           Waste: Market Intelligence Report 2019
■ E-waste: If a conservative range of between Key drivers of these opportunities include:
R1 309 and R1 636 per tonne of scrap e-waste
(excluding higher value materials) is applied, ■ Legislation and regulation: New and changing
then the low value of e-waste in the Western national and provincial legislation and
Cape is between R54.5 and R108.4 million per regulations are set to unlock a number of
year, with the CoCT holding the largest value key waste streams, notably organics. These
of R34.9 to R75.4 million. changes will also help to simplify rules and
procedures for alternative waste treatment
■ Plastics: If a value of between R1 950 and technologies and activities.
R2 600 per tonne of plastics is used, the value
for the Western Cape’s MSW plastics is ■ Industry waste management plans: The
between R462.2 and R616.2 million per year, paper and packaging, e-waste and lighting
with CoCT MSW plastics valued between industries will be legally required to implement
R321.5 and R428.7 million in 2018. mechanisms to ensure extended producer
responsibility. This will ensure access to
■ Builder’s rubble: The supply of and demand for feedstock, and support demand for
builder’s rubble as an alternative to virgin recovered materials.
material are growing. National government
and local municipalities are focusing ■ Government initiatives: The initiatives
increasingly on diverting rubble from landfill. identified by the national government’s
The private sector is increasingly applying fast results delivery programme, Operation
builder’s rubble as a secondary construction Phakisa, should increase access to feedstock
material, in the context of rising virgin material and stimulate growth in market demand.
costs. The current value of builder’s rubble
available to the market in South Africa is ■ Cost of disposal: Dwindling landfill space
conservatively estimated at R132 to R309 and rising management costs are pushing
million, depending in its application. up the price of landfilling in the Western
Cape and the CoCT in particular. This
increases demand from waste generators
for alternative waste treatment solutions,
which in turn improves the financial viability
of solutions.
Waste: Market Intelligence Report 2019 xiWhat’s new?
For investors and business owners who have read GreenCape’s 2018 Waste MIR, the following are new
developments discussed in this report:
The 2018 report focused on the waste opportunities opened up by industry changes at the provincial
and national level. This year’s report provides updates on:
■ market trends in organics, plastics, e-waste, and builders’ rubble;
■ industry developments, in particular on industry waste management plans, the increase in landfill
gate fees, and the latest State of Waste Report data (since the 2011 NWIB); and
■ new opportunities in the markets for organics, plastics, e-waste and builder’s rubble.
1 Waste: Market Intelligence Report 20191
Introduction and purpose
This report provides insights into the South African and the Western Cape waste
sector. It also outlines market opportunities for investors who are active or
interested in providing alternative waste treatment and beneficiation solutions.
This MIR has been compiled by GreenCape’s Waste In Section 5, we focus on finance and incentives.
Sector Desk. It highlights insights and opportunities
gathered from our engagements with stakeholders The case for the Western Cape as a greentech
in, and research on, the waste sector. hub for Africa is covered in Section 6. This
is followed by Section 7, which outlines
Section 2 below provides an overview of the GreenCape’s work and the opportunities for
waste sector in South Africa, with a focus on the investors across the South African and Western
Western Cape. This is followed by an overview in Cape green economy.
Section 3 of key policies and regulations that
guide and affect the sector. Section 4 provides For queries or to access any of our support
an overview of market opportunities, drivers, services, contact GreenCape’s Waste Sector
barriers, risks and recent developments in Desk at +27 21 811 0250 or email
organics, e-waste, plastics and builder’s rubble. waste@greencape.co.za.
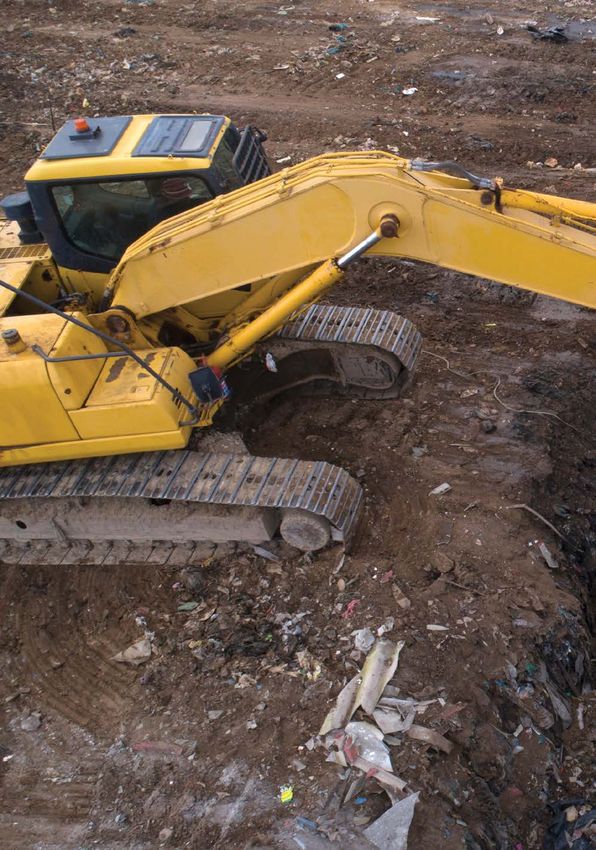
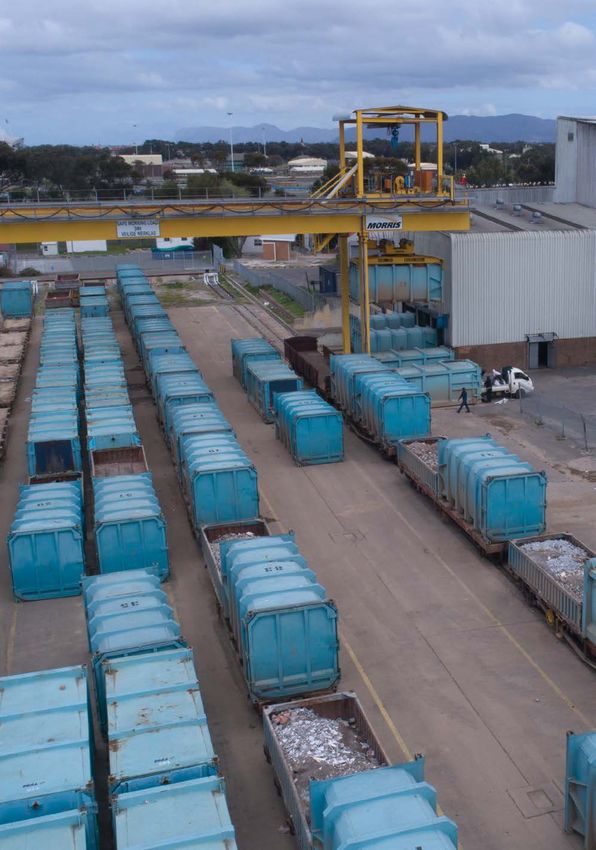
Waste: Market Intelligence Report 2019 2© Bruce Sutherland, City of Cape Town 3 Waste: Market Intelligence Report 2019
2

    This section provides investors, businesses and new entrants with an overview of
             South Africa’s waste sector, with a focus on the Western Cape.

The section covers the following:                                      The main drivers of growth in waste beneficiation
                                                                       include:
■    the structure of the waste sector;
■    key stakeholders, and their roles and                             ■   increased awareness of the impact of waste
     responsibilities;                                                     on the economy, environment, and society;
■    provincial and national sector sizes;                             ■   extensive support from producer responsible
■    drivers, risks and barriers; and                                      organisations and industry associations;
■    developments since the publishing of the                          ■   regulatory reforms (national and provincial);
     2018 MIR.                                                         ■   increased pressure on municipal landfill
                                                                           airspace;
GreenCape has been producing an annual Waste                           ■   a growing understanding of the value of
Economy MIR3 since 2014. Over the last five years,                         waste; and
the momentum in the waste sector has been                              ■   recognition by government that the
building, albeit slowly, towards a waste economy                           waste economy creates jobs and attract
increasingly characterised by waste                                        investments.
beneficiation. Private sector investments have
grown in number and scale, there have been                             The latter has resulted in a number of positive
positive regulatory reforms, and the scope and                         developments:
scale of industry organisations have expanded.
                                                                       ■   the proposal of extended producer
The South African waste economy continues to                               responsibility through the request for
experience positive growth, and there is growing                           development of industry waste management
interest in the uptake of alternative waste                                plans (IndWMP) for specific sectors;
treatment solutions and associated value chains.                       ■   various regulations to encourage waste
This has resulted in continued and increasing                              diversion from landfill;
diversion of waste from landfill, both within the                      ■   data gathering and updating initiatives;
Western Cape and South Africa.                                         ■   a Phakisa4 for the chemical and waste
                                                                           economy; and
                                                                       ■   infrastructure investments by local
                                                                           governments;
South Africa generated ~108
million tonnes of waste in 2011.                                       2.1. Sector structure
                                                                       South Africa categorises wastes into hazardous
Of this, ~10% was recycled.                                            and general waste, which are regulated by
                                                                       the National Waste Regulations (R. 625 of
                                                                       August 2012).

South Africa generated ~108 million tonnes of                          South Africa’s waste sector comprises the public
waste in 2011. Of this, ~10% was recycled.                             and private sectors, and households. Recycling

3
  Previous MIRs can be accessed at www.green-cape.co.za/market-intelligence
4 Phakisa means “hurry up” in Sesotho. Operation Phakisa is an initiative by national government to fast track the implementation of
solutions on critical development issues under the National Development Plan.

Waste: Market Intelligence Report 2019                                                                                                 4
industry associations and Producer Responsible sectors. Figure 1 shows the relationship between
Organisations (PRO) support their respective sectors, and their legal roles and responsibilities.
Collection
Local municipalities Private sector
Local municipalities are constitutionally Waste management companies can be
Household
mandated to ensure that household contracted by local municipalities
waste is collected. They can either (through a procurement process) to
provide the collection service themselves, collect household waste, or to manage
Generation
or appoint private waste contractors. drop-off facilities open to households.
Local municipalities are not obligated to Commercial and industrial waste
Commercial /
service commercial/industrial waste generators are responsible for the
Industrial
generators. However, the latter may ask management of their own waste,
local municipalities to collect waste, including safe disposal. This is usually
thereby incurring a service fee. outsourced to private waste
management.
Municipalities are mandated to ensure The private sector can either have
Treatment / Disposal
the availability of disposal facilities its own waste treatment and/or disposal
(landfills). They can support alternative facilities; or it can be contracted by
waste treatment by means of providing local municipalities to manage
material recovery and aggregation municipal recovery, aggregation or
infrastructure. Such facilities can be disposal facilities.
managed by the municipality itself, or
contracted to the private sector through
a procurement process.
Figure 1: Waste collection and treatment responsibilities in South Africa
Source: GreenCape
2.1.1. Public sector monitoring the implementation of plans. It is
All spheres of government are legally responsible expected to include monitoring and managing
for the management of waste in South Africa, and the disbursement of funds collected through
in general for upholding the requirements of the producer-paid levies.
Constitution and the National Environmental
Management Waste Act (NEMWA), Act 59 of 2008, Provincial
including related regulations. Provincial environmental authorities are
generally responsible for regulating waste
National management. Their functions include
The national Department of Environmental promulgating provincial legislation, providing
Affairs (DEA) is the overarching authority for municipal support, and monitoring municipal and
waste management in South Africa, and is the private sector activities. The Department of
licensing authority for hazardous waste Environmental Affairs and Development Planning
treatment activities. Its Waste Management (DEA&DP) is the Western Cape’s provincial
Bureau has been established to manage and authority regulating waste management.
implement the Industry Waste Management
Plans (IndWMPs) (see Section 2.5). The role of the Waste generators and handlers, triggering
bureau includes supporting and advising certain thresholds stipulated in the National
industry on the development of the plans, and Waste Information Regulations (R. 625 of 2012),
5 Waste: Market Intelligence Report 2019must register with and report waste figures to before municipalities are able to partner with the
either the national DEA, through the South private sector
African Waste Information System (SAWIS)5;
or a provincial waste information system. In the However, the NEMWA and the 2011 National Waste
Western Cape, this is the Integrated Pollutant Management Strategy (NWMS) require local
and Waste Information System (IPWIS) managed municipalities to implement alternative waste
by DEA&DP, whilst in Gauteng their waste treatment in order to divert waste from landfill
information system (GWIS) is managed by the and to minimise environmental degradation. In
Department of Agriculture and Rural Development. some cases, municipalities provide infrastructure
for aggregation (drop-offs) and the separation
Investors and businesses developing or (material recovery facilities), rather than
expanding waste initiatives that require providing the actual recycling infrastructure.
a waste management licence (see Section 3.1) These facilities are either operated by the
must apply for the licence through a provincial municipality or outsourced to the private sector.
environmental authority if general waste is
handled. If they handle hazardous waste, then 2.1.2. Private sector
applications must go through the national DEA, The commercial and industrial sector is
with the provincial environmental authorities responsible for the management of their own
as a commenting authority. Engagement with wastes. They are bound by various regulatory
provincial authorities should be undertaken requirements, whether they are waste generators,
before initiating the waste licence applications and/or waste handlers:
to ensure clarity in the process, or to confirm
whether it is needed. Waste generators
Waste generators are responsible for the
Local municipalities management of their own waste. This can either
Municipalities are constitutionally mandated be outsourced to private service providers, or to
to provide waste collection, removal, storage, the local municipality on request. Both options
and disposal of waste generated by households will incur a service fee. Private service providers
within their boundaries. Collection can be done are incentivised to explore alternative waste
by local municipalities or be outsourced to the treatment as the cost of landfilling increases.
private sector. Local municipalities are not Also, municipalities do not, in general, involve
required to provide the private sector with themselves with hazardous waste collection
waste collection services. from the private sector.
Municipalities are also expected to provide Waste handlers
waste collection and disposal infrastructure. Waste management service providers are
Although alternative waste treatment is not responsible for the provision of responsible waste
explicitly required by the Municipal Systems Act management services to their clients, or as
(MSA) (32 of 2000), it is considered in the Act to contracted to do so by local municipalities.
be a municipal support activity (National
Treasury 2008). Investors seeking access to waste streams find it
more convenient to work with the private sector
Section 76 to Section 78 of the Municipal Systems and their service providers than with
Act (32 of 2000) outline the key steps needed municipalities, as the former have fewer
procurement requirements with which to comply.
2.1.3. Households
Section 76 to Section 78 of the Households are generally serviced by their local
Municipal Systems Act (32 of 2000) municipalities, or by the private companies
outline the key steps needed before contracted by municipalities to collect waste.
municipalities are able to partner Some municipalities require households to
separate recyclables from non-recyclables, and
with the private sector
to ensure that the recyclables are disposed of
responsibly. This can be done by contracting the
5
SAWIS is South Africa’s national waste reporting system established in terms of section 60 of the NEMWA
Waste: Market Intelligence Report 2019 6local municipality (unless the municipality has a Investors or businesses who intend to enter the
recycling collection service), contracting an paper and packaging, e-waste or the lighting
accredited waste service provider, or delivering recycling sectors should engage with their
the recyclables at a licensed facility. Voluntarily relevant PROs (once designated), or in the interim
contracting in the private sector is becoming with the industry associations.
more common.
2.1.5. Informal waste collectors
2.1.4. Recycling industry associations South Africa’s informal waste sector plays a
South Africa’s recycling sector is driven by industry, principal role in waste diversion (in particular
and supported by industry-funded associations. of post-consumer recyclables) from landfill.
Each association promotes the recovery and However, in most cities and towns in South Africa,
recycling of materials at different points of the informal waste pickers are marginalised and
value chain. However, there are no regulated operate at the fringe of formal management
distinctions between the roles and responsibilities systems. The full extent of the importance of the
of the different industry associations. informal waste sector is not fully understood, due
to the nature of the informality; however, this is
South Africa has a number of industry associations currently being actively investigated by the
that focus on mainstream recyclables, e-waste, national Department of Science and Technology.
and organics. Each of the associations provide There are over 50 000 informal landfill and
varying levels of support to their members along kerbside waste pickers in the country. It is
the respective value chains. See Table 2 for a list of estimated that the informal sector supply 80%
active industry associations. to 90% of packaging waste to recyclers
(Plastics|SA, 2015).
In the past, membership and financial
contributions to associations were voluntary. 2.2. Size of the South African
This is expected to change with the waste sector
implementation of mandatory extended producer At the time of publication, the national DEA was
responsibility through adherence to IndWMPs. finalising its first State of Waste Report (SoWR)
Producers along the paper and packaging, for South Africa. This SoWR should include an
electrical and electronics, and lighting value update to the 2011 national waste information
chains will be legally required to adhere to the baseline (NWIB). The SoWR will be the most
requirements of IndWMPs (see Section 3.2), current source of information for decision makers
which will be managed by designated PROs. developing plans and policies concerning waste.
There is a range of sources and extrapolated
These PROs will more than likely replace the figures for the size of the SA waste sector, on
role of some associations and complement which investors can draw until such time as the
others, but the mission will stay the same – to SoWR is released.
ensure that waste materials are diverted from
landfill (supply) and to ensure market DEA National Waste Information
development (demand). Baseline and extrapolated figures
for 2016
According to the 2011 NWIB, South Africa
generated approximately 59 million tonnes of
Investors or businesses who intend
general waste, 48 million tonnes of unclassified
to enter the paper and packaging, waste, and 1 million tonnes of hazardous waste
e-waste or the lighting recycling – a total of 108 million tonnes in 2011 (DEA 2012).
sectors should engage with their Only 10% of all waste was recycled, with 90%
relevant PROs (once designated), landfilled6. We expect that the 2019 SoWR will
or in the interim with the industry show increased diversion and an exponential
increase in recycling rates. Figure 2 shows a
associations.
breakdown of waste types as a percentage of
total waste.
6
This does not take into account leakage, e.g. materials that enter oceans or are exported and are effectively ‘lost’ from the accounting
system.
7 Waste: Market Intelligence Report 201955+44+1L 108M
TONNES
55%
44%
1%
Figure 2: Classification of total waste generated in South Africa in 2011
The DEA presented extrapolated waste figures
for 2016 as part of the Operation Phakisa for
chemicals and waste economy. The estimates
indicated that waste generation had increased
GENERAL 59 353 901 T
UNCLASSIFIED 47 781 314 T
HAZARDOUS 1 319 096 T
waste streams7 could be beneficiated. If the
amount of industrial waste were to be reduced by
20%, and domestic waste by 60%, it would unlock
R9.2 billion resource value to the economy.
Source: DEA (2012)
by 3 million tonnes to 111 million tonnes since 2011.
The waste economy contributed R24.3 billion to Industry associations data
the South African GDP, provided 36 000 formal South Africa’s dry recyclable sector is well
jobs and supported an estimated 80 000 supported by industry-driven associations. Table 1
informal jobs/livelihoods. shows active industry associations and stream-
specific estimates tonnages generated and
In 2014, the national Department of Science and diverted as reported by industry annual reports
Technology (DST) Waste Research, Development and engagements with industry associations. The
and Innovation (RDI) Roadmap estimated that an table also provides estimated tonnages available
additional R17 billion per year worth of resources for each material for the Western Cape8.
could be unlocked if 100% of the 13 identified
7 Municipal waste (non-recyclable portion); organic component of municipal waste; biomass waste from industry; construction and
demolition waste; paper; plastic; glass; metal; tyres; e-waste; slag; ash; and waste oils.
8 The two extrapolations based on: the proportion of the population of the Western Cape compared to the other provinces, and the
nominal output of the Western Cape compared to the other provinces.
Waste: Market Intelligence Report 2019 8Table 1: Recyclables processed and available in 2017 as reported by associations
Sources: Most recent industry association annual reports, IndWMPs, and direct engagements during 2018
Collected / Diverted
Available for Recycling (Tonnes)
from Landfill
Industry Material in Circulation
Name of industry
Association (Imported / Western Cape
association
Manufactured)
Tonnages Percentage Total in SA
Nominal
Pop
Output
PET
(Beverage PETCO 143 438 93 235 65% 50 203 5 783 7 015
Bottles)
210 939
PET
(Thermoform/ – 67 500 0 0% 67 500 7 775 9 432
Edible Oil)
Plastics
LDPE 341 412 105 155 31% 236 257 27 213 33 011
HDPE POLYCO 227 000 883 999 63 333 28% 163 667 18 852 22 869
PP 315 587 47 338 15% 268 249 30 898 37 481
PVC SAVA 157 912 17 844 11% 140 068 16 133 19 571
PS PASA 50 318 5 384 11% 44 934 5 176 6 278
Paper PRASA 1 813 680 1 282 120 71% 531 560 61 227 74 273
Glass TGRC 770 412 631 738 82%9 138 674 15 973 19 376
Cans 162 000
Metal Closures MetPac-SA 18 000 217 000 164 486 76% 52 514 6 049 7 338
Drums / Pailes 37 000
ERA 360 000 45 000 13% 315 000 36 283 44 014
Ewaste
SAWEEEDA
322 000 45 000 14% 277 000 31 906 38 704
(2015)
Organic Recyclers ORASA – – – – – –
9
2.2.1. Household separation levels with larger urban populations. Figure 3 and
The availability and quality of waste, particularly Figure 4 respectively show the degree of
post-consumer streams, are dependent on the household material separation per province and
level of material separation done by households. metropolitan municipality. The Western Cape
This in turn is linked to demographics and (20.3%) and the City of Cape Town (CoCT) (23%)
“recycling culture”. Broadly speaking, higher have the highest rates of household separation
separation levels are more common in provinces (StatsSA 2018).
9
82% refers to the reuse and recycling (cullet) of glass.
9 Waste: Market Intelligence Report 201925% 25%
23%
20%
20% 20%
16%
15% 15%
13% 13%
10% 10% 8%
8% 8% 8%
6% 6%
5% 5% 5% 5%
5% 5% 4%
1%
0% 0%
LP EC NC FS KZN MP NW GT WC MAN BCM NMB ETH TSH EMM CoJ CoCT
Figure 3: Household separation by Figure 4: Household separation
province (2015) by metro (2015)
Source: StatsSA (2018) Source: StatsSA (2018)
2.3. Size of the Western Cape
waste sector
The Western Cape generated ~7.7 million tonnes of characterised by dirty mixed waste streams and
waste in 2015 (DED&T, 2016). The province’s waste large volumes of organic residues.
comprises mostly of municipal solid waste (MSW),
and agricultural waste and residues. This is to be Table 2 and Figure 5 show the tonnages
expected, as much of the Western Cape’s economy generated in the Western Cape. Annex A provides
is driven by agriculture and tertiary services. As a detailed waste distribution figures by metro and
result, much of the waste generated will be district municipality.
Table 2: Total waste tonnages generated per district municipality / metro in 2015
Source: DED&T (2016)
Municipality Municipal Agri / Construction Commercial / Other Total
Solid Waste Forestry / Demolition Industrial
Residues
City of Cape Town 1 671 146 66 885 1 090 995 637 419 247 248 3 713 693
Cape Winelands 286 482 304 734 272 749 98 976 49 489 1 012 430
Central Karoo 23 874 34 531 17 047 4 308 4 334 84 094
Eden 190 988 501 013 153 421 70 344 34 865 950 631
Overberg 95 495 540 887 85 234 30 540 15 905 768 061
West Coast 119 368 917 734 85 234 39 514 23 544 1 185 394
Western Cape 2 387 353 2 365 784 1 704 680 881 101 375 385 7 714 303
Waste: Market Intelligence Report 2019 1031+31+22115L
31% MUNICIPAL SOLID WASTE
- Non-recyclables (9%)
- Metals (7%)
- Organics (6%)
- Paper (4%)
- Plastics (3%)
- Glass (2%)
WESTERN CAPE 31% AGRICULTURAL
7.7 MILLION - Agricultural residues (28%)
- Abattoir waste (2%)
TONNES / 2015 - Forestry residues (1%)
22% CONSTRUCTION / DEMOLITION
11% COMMERCIAL / INDUSTRIAL
5% OTHER
- Wet sewerage sludge (4%)
- E-waste (1%)
- Tyres (0.2%)
Figure 5: Western Cape waste characterisation in 2015
Source: DEDAT (2016)
Commercial and industrial waste streams are The agriculture and forestry sector generates
popular with private sector solution providers. large volumes of clean homogenous waste
Private sector waste is: streams. However, agricultural waste is often
misrepresented as waste, and its re-entry into
■ often continuous, homogenous, and found in other points of the agricultural value chain, albeit
large volumes; not in the form it was intended for, is often not
■ less contaminated and easier to separate at considered. Nevertheless, it is a sought-after
points of source; stream that, because of logistical constraints, is
■ easier to access from a contractual often processed in close proximity of generation.
perspective; and
■ motivating commercial and industrial Table 3 shows the breakdown of total Municipal
generators to look for alternative solutions, as Solid Waste (MSW) generated per Western Cape
it reduces their disposal overheads. district / metropolitan municipalities for 2015, and
the extrapolated tonnages for 2018 and 2021,
based on the expected population growth.
11 Waste: Market Intelligence Report 2019Table 3: MSW generated per district municipality/metro in 2015, 2018 and 2021
Source: DED&T (2016) and Quantec (2018)
MSW (Tonnes)10
Population 2015 2021
Area 2018 (estimated)
Municipality (actual) (estimated)
(km2)
2018 Growth Per
Total Total Per km2 Total
(estimated) since 2015 person
City of Cape Town 2 446 4 254 946 6% 1 671 146 1 767 272 0.415 1 740 1 875 608
Cape Winelands 21 473 930 779 8% 286 482 310 590 0.334 43 334 820
Central Karoo 38 854 76 029 4% 23 874 24 792 0.326 2 26 131
Eden District 23 331 626 547 6% 190 988 202 584 0.323 27 214 559
Overberg 12 239 309 366 9% 95 495 104 242 0.337 25 112 951
West Coast 31 119 452 595 10% 119 368 130 871 0.289 15 142 558
Western Cape 129 462 6 650 261 7% 2 387 353 2 540 351 0.382 51 2 706 628
The CoCT, which is the only metropolitan of all waste was made up of non-recyclables such
municipality in the Western Cape, generates as textiles, residual, construction, wood, and what
more than 70% of the waste in the Western Cape. is termed “other”. See Annex B for a detailed
The most recent waste characterisation study breakdown of CoCT waste as per the waste
was undertaken in 2018. Figure 6 shows that 31% characterisation study.
31% NON-RECYCLABLE
28% ORGANIC
14% PLASTICS
13% PAPER
7% HAZARDOUS
4% GLASS
2% METALS
0.5% TETRAPAK
0.3% EWASTE
Figure 6: Waste characterisation for the CoCT
Source: CoCT (2018a)
10
This year’s MIR has separated C&D waste from the MSW as this stream has been separated at landfills
Waste: Market Intelligence Report 2019 122.4. General drivers for Africa compared to benchmarks in developed
waste beneficiation economies. In spite of this, waste generators still
regard landfilling as a costly overhead, especially
2.4.1. Increasing cost of landfilling in the Western Cape. Figure 7 shows landfill gate
The cost of landfill disposal (the gate fee charged fees for general waste across all of South Africa’s
per tonne) continues to be relatively low in South eight metros.
R600
R556
Disposal price per tonne (Rand)
R484
R450
R381
R336
R300 R331 R280
R292 R248
R230
R243
R216 R177
R200 R164
R150
R154 R143
R0
City of Cape eThekwini Mangaung City of City of City of Buffalo City Nelson
Town Ekurhuleni Johannesburg Tshwane Mandela Bay
Incl VAT (15%) Excl VAT
Figure 7: Landfill gate fees for general waste for South Africa’s eight metros in 2017/2018
Source: GreenCape
The CoCT has the highest landfill gate fees in so too does the demand for alternatives to
the country. Figure 8 shows the rise in gate fees landfill solutions. This strengthens the business
in the Cape Town metro since 2013/14, and case for investors looking to invest in solutions
expected increases up to 2020/21. As the cost of to provide cheaper alternative services to Cape
landfill disposal increases above inflation11, and Town-based businesses.
with it increasing overheads for waste generators,
11
Inflation was 4.5% on 23 Jan 2019 (www.Tradingeconomics.com)
13 Waste: Market Intelligence Report 2019R900
R812
R800
R711
R700
R641
Rand / Tonne (excl. VAT)
R612
R600
R558
R536
R515
R484
R500 R460
R421 R421
R387 R389
R400
R347
R317
R292
R300
R200
13/14 14/15 15/16 16/17 17/18 18/19 19/20 20/21
Financial Year
General Special
Figure 8: Landfill gate fees (excl. VAT) for the CoCT (2013/14 – 2020/21)
Source: GreenCape and CoCT (2018b)
The national DEA aims to implement mechanisms suitable landfills for disposal. Old landfills are
under its own control to fast track landfill closing, and the cost and sighting of new landfills
diversion. This includes plans for the have been challenging. However, the Western Cape
implementation of a landfill tax, which will is not a homogeneous entity. Some municipalities
increase overall disposal cost across the are in more serious situations than others.
country. This is still to be assessed, along Municipalities greatly affected by this will be in
with an adequate tax. need of cost-effective alternative waste treatment
technologies to assist with waste diversion.
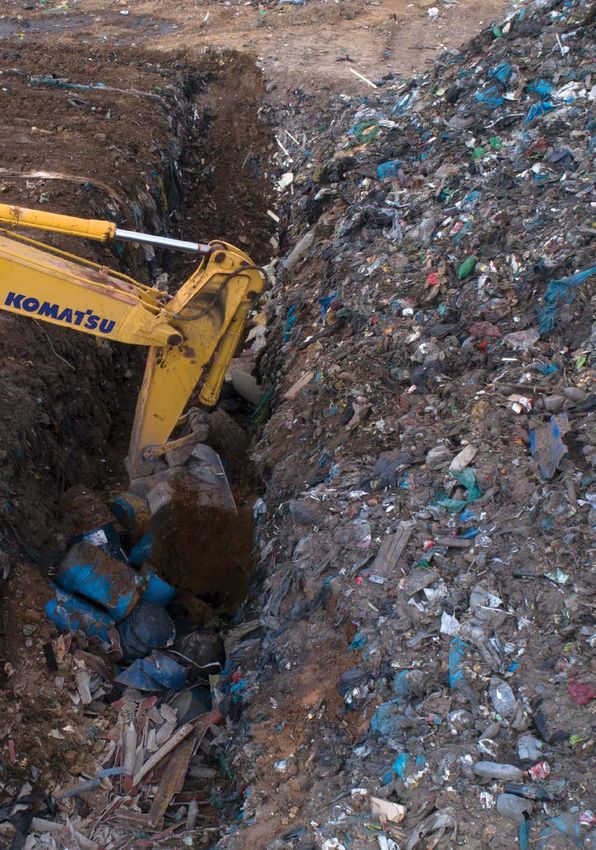
2.4.2. Loss of landfill airspace Figure 9 shows the estimated lifespan of the
The Western Cape, like many parts of South Africa, Western Cape’s municipal landfills as of 201812,
is currently grappling with the availability of and the location of intended regional landfills.
12
Landfill airspace is based on DEA&DP estimations.
Waste: Market Intelligence Report 2019 14Regional Landfills
Early planning phase
Advanced planning phase
Matzikama Operational
* Numbers indicate remaining lifespan (yrs)
Cederberg
Beaufort
West
Bergrivier
Saldanha Witzenberg
Bay Laingsburg Prince
Albert
Swartland
Oudtshoorn
Drakenstein Kannaland
Breede George
Langeberg
City of Valley
Knysna Bitou
Cape Town Mossel
Theewaterskloof Swellendam Hessequa Bay
Overstrand Cape
Agulhas
less than 5 years more than 5 but less than 15 years more than 15 years
Figure 9: Estimated landfill lifespan for each local municipality in the Western Cape
Source: Extrapolated from DEADP (2019)
The Western Cape does have privately owned 2.5. General risks and barriers
and operated landfills. However, only Vissershok
private landfill13 (next to Vissershok Municipal Extracting value from MSW
Landfill) operates as a commercial landfill It is difficult to extract value from municipal solid
receiving waste from businesses and waste (MSW) due to its complex nature and
municipalities. Furthermore, there are three depending who the owner of the waste is. Firstly,
existing and six proposed regional landfills MSW is constitutionally managed, and thus
to serve not only one local municipality, but “owned”, by local municipalities. This makes
multiple municipalities. access to the waste onerous due to municipal
procurement processes. Secondly, MSW is
2.4.3. Perceived job creation in waste essentially a mix of general household articles,
In 2017, the national DEA undertook its Operation which include general and hazardous waste, all of
Phakisa: Chemicals and Waste Economy. During which come in various quantities and ratios and
this session, the DEA identified 20 initiatives across all of which can be extremely contaminated.
four work streams to divert 20 million tonnes of Nevertheless, there is potential to generate value,
waste from landfill. If realised, these initiatives either once separation at source is implemented,
could unlock an additional R11.5 billion per year to or if a robust technology is implemented.
help create 45 000 direct and 82 000 indirect jobs
and 4 300 small, medium and micro-sized
enterprises (SMMEs). This has resulted in DEA’s
active role in regulation reform (see Section 3) and
industry SMME support.
13
Vissershok Private landfill is hazardous landfill jointly owned by two waste companies, Averda and Enviroserv.
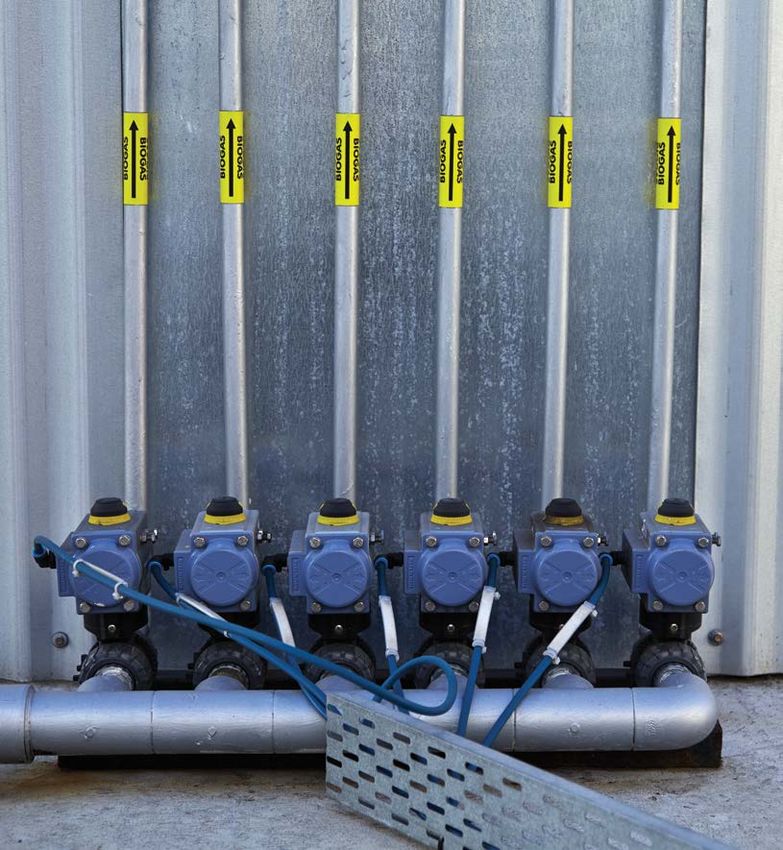
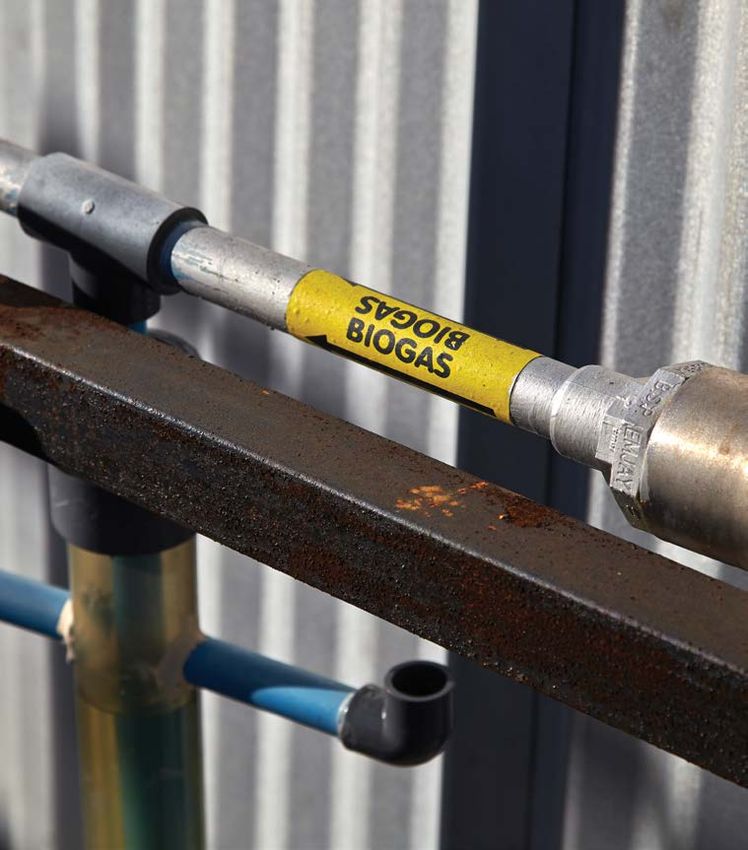
15 Waste: Market Intelligence Report 2019Low levels of separation at source City of Cape Town’s landfill
Generally speaking, South Africans do not have a gas investment
culture of separating waste at source. This makes The CoCT launched its landfill gas extraction
extracting value difficult and costly. Regarding systems in March 2018 at Coastal Park and
households, there are no incentives/disincentives Bellville South landfill sites. These systems were
for households to separate at source. ‘Post developed as a carbon-offsetting Clean
consumers’, namely households, pay for waste Development Mechanism that will generate
management through municipal rates. These carbon credits for the CoCT. Currently, the gas is
rates are required to be paid irrespective of flared, but the intention is to generate electricity.
households diverting waste or not. Secondly, It is likely that the projects will produce an
apart from the City of Johannesburg (see Section estimated 1 MW of electricity. A similar system is
2 6 below), there are generally no mandatory expected to be installed at the CoCT’s Vissershok
requirements to separate at source. Even if municipal landfill in 2019.
municipal waste management by-laws require
mandatory separation at source, municipalities Closure of Bellville South landfill
do not always have the capacity to enforce this. Due to licence requirements, September 2018 saw
However, it makes financial sense for the private the CoCT closing its Bellville South landfill. This
sector to separate and divert waste to reduce leaves only two operational municipal landfills in
landfill disposal overheads. the CoCT, these being Vissershok (municipal) and
Coastal Park landfills. However, Bellville South’s
Promulgation of the National Minimum material recovery facility and refuse transfer
Wage Act station will continue to operate as usual.
South Africa’s National Minimum Wage Act No. 9
of 2018, published in the Government Gazette of Drakenstein terminates
27 November 2018, came into effect on 01 January beneficiation project
2019. The Act provides for a blanket minimum Drakenstein local municipality has terminated its
payment structure for every South African in proposed integrated waste management facility
employment, including those in the waste sector. in the town of Wellington. This came after the
The proposed minimum wage is to be R20 per national Minister of Finance requested the
hour or R3 500 per month for a 40-hour week, project to restart the EIA process due to non-
subject to an annual review. The waste sector in compliance. This was a public-private
South Africa is labour intensive and such partnership with the prominent waste
minimum requirements are expected to impact management company, Interwaste, which would
many businesses, especially SMMEs. have seen R1 billion invested in material recovery,
biogas, and incineration. The facility was
2.6. Highlights from 2017/2018 designed to process 700 tonnes a day of MSW.
Drakenstein has indicated that they will be
City of Johannesburg separation- investigating a new waste beneficiation project.
at-source
As of July 2018, the City of Johannesburg International bid for Interwaste
implemented mandatory household separation French-based Séché Environnement announced
of dry recyclables. The phased approach makes its intention to acquire ownership of Interwaste, a
it compulsory for residents in specific areas to large South African waste management
separate dry recyclables for kerbside collection. company. This bid has been approved by the
Collections will be undertaken by Pikitup and its Interwaste board. This is the second large waste
outsourced service providers. company to be acquired by an international
waste company. The other was WasteMan by
Averda in 2015.
Waste: Market Intelligence Report 2019 16© Bruce Sutherland 17 Waste: Market Intelligence Report 2019
3
                       Legislation and
                         regulations
  This section provides a brief overview of major legislation and regulations that
govern waste management in South Africa. It also highlights draft and anticipated
           legislation and regulations that are likely to be implemented.

South Africa has a vibrant and progressive             process to be undertaken before an activity can
regulatory framework for landfill diversion of         be authorised. Commencement with any
waste and subsequently waste beneficiation.            of the ‘Listed Activities’ prior to obtaining
Over the course of three decades, the regulatory       authorisation from competent authorities is
environment has shifted from landfill                  prohibited in terms of NEMA and is regarded as
management to recycling, and recently towards          an offence. The EIA process requires a third party
extended producer responsibility.                      environmental assessment practitioner (EAP) to
                                                       undertake the application.
3.1. The legislative framework for
waste management                                       The EIA regulations do not apply to general
In terms of Chapter 2 (Bill of Rights) of the South    activities only, but include waste activities
African Constitution, everyone has the right ‘to       governed by South Africa’s National
an environment that is not harmful to their health     Environmental Management Waste Act (NEMWA)
or wellbeing; and to have the environment              (Act 59 of 2008), or more colloquially known as
protected, for the benefit of present and future       ‘the Waste Act’.
generations’. These fundamental rights underpin
the framework that governs environmental               National Environmental Management
legislation in South Africa, this being the National   Waste Act (Act 59 of 2008)
Environmental Management Act (NEMA).                   NEMWA is a waste-specific act that is guided by
                                                       integrated waste management principles aimed at
The National Environmental                             preventing negative waste-related environmental
Management Act (107 of 1998)                           impacts. Investors and businesses looking to
The NEMA is guided by a number of key                  mitigate any risks should take into consideration
integrated environmental management                    the NEMWA, its requirements, and the
principles. These aim to ensure that negative          ramifications if it is violated.
environmental impacts are prevented, mitigated,
and/or regulated. They also provide an array of        Since its promulgation, all spheres of government
instruments to monitor and manage activities           are bound to the ideals of the waste
that impact the environment.                           management hierarchy:

One of these mechanism is the environmental            ■   avoid and minimise the generation of waste;
impact assessment (EIA) regulations. The EIA           ■   reduce, reuse, recycle and recover waste; and
regulations list a number of activities that may       ■   treat and safely dispose of waste as a last
result in substantial negative impacts on the              resort.
environment. The ‘Listed Activities’ require either
a ‘Basic Assessment’ process or an ‘EIA Scoping’

Waste: Market Intelligence Report 2019                                                                 18
The NEMWA provides a list14 of waste requires that any (juristic) person intending to
management activities15 that must undergo a perform recycling, reuse or recovery activities,
waste management licensing process if certain or the sorting of waste, must be accredited with
criteria are triggered. These activities are CoCT before commencing such activities. To
deemed to have, or are likely to have, a be accredited, the person must also submit an
detrimental effect on the environment. integrated waste management plan to a CoCT
waste management officer.
Waste management activities are differentiated
into three categories that have different approval Existing waste businesses not yet registered with
and licensing requirements: their respective municipalities, or investors looking
to enter the market, must ensure that they engage
■ ‘Category A’ activities require a basic EIA; with the respective solid waste departments of the
■ ‘Category B’ activities require a scoping and municipalities where they conduct or plan to
full EIA process to be undertaken prior to conduct their activities to determine whether they
obtaining a waste management licence; and need to be registered and/or accredited.
■ ‘Category C’ activities require adherence to
specific norms and standards. 3.2. New regulatory updates
A number of legislative changes have occurred
Category C is an attempt to facilitate the uptake since the publication of the previous MIR. The
of alternative waste treatment. The DEA has following changes are likely to have an impact on
downgraded certain triggers from Category A to the waste sector:
Category C activities. Thus, instead of undertaking
an EIA process, the activities in question only need Industry Waste Management Plans
to adhere to norms and standards. The DEA has published a NEMWA Section 28
notice (Government Notice 1353) on 06 December
National Environmental Management 2017. The notice requires the paper and
Air Quality Act (Act 39 of 2004) packaging, lighting equipment, and electrical
The National Environmental Management Air and electronic industries to develop and submit
Quality Act (NEMAQA) is an air quality specific an industry waste management plan on how the
act that aims to prevent negative air quality respective industries will manage its waste.
related environmental impacts. The NEMAQA Producers17 were required to prepare and submit
provides a list of activities, published under an IndWMP to the Minister for approval by 06
Government Notice 893 in Government Gazette September 2018 or subscribe to a non-profit
37054 dated 22 November 2013, that trigger the producer responsibility organisation (PRO) that
need to undertake an air emission licensing will develop and implement an IndWMP. Once the
process. The NEMAQA is particularly relevant IndWMP has been approved by the Minister,
to waste-to-energy projects. Investors and producers must comply with the requirements of
businesses interested in waste-to-energy the IndWMP to which they have subscribed. At
activities must consider the NEMAQA, its the time of publishing this MIR, the plans were
requirements, and the ramifications if violated. to be approved by mid-March 2019 to be
implemented in October 2019. However, it is
Municipal waste management by-laws unlikely that this will be the case, and that it
Local municipalities may choose to regulate how is more likely that the IndWMPs will only be
waste is managed within their boundaries implemented in 2020.
through the promulgation of waste specific
by-laws. These by-laws often provide obligations Scheduled landfill restrictions (2018/19)
for both waste generators and waste handlers. The national norms and standard for the disposal
The CoCT’s by-law, as amended16, for example of waste to landfill (R. 636 of 23 August 2013)
14
Government Notice 921 National Environmental Management: Waste Act (59/2008): List of waste management activities that have, or
are likely to have, a detrimental effect on the environment (as amended)
15
Storage, recycling or recovery, treatment, disposal
16
Copy of the CoCT’s bylaw can be found at https://openbylaws.org.za/za-cpt/act/by-law/2009/integrated-waste-management/
resources/eng.pdf
17
A producer includes any person, or category of person, or a brand owner who is engaged in the commercial conversion or refurbishment
of new and/or used: paper and packaging material, lighting equipment, electrical and electronic equipment, or goods wrapped in primary
or secondary packing material.
19 Waste: Market Intelligence Report 2019You can also read