PRELIMINAR MARKET ANALYSIS - Foundation Knowledge Innovation Market - PlastiCircle
←
→
Page content transcription
If your browser does not render page correctly, please read the page content below
Ref. Ares(2018)6400413 - 12/12/2018

PlastiCircle
Grant Agreement No 730292

PRELIMINAR MARKET ANALYSIS
Foundation Knowledge Innovation Market

  This project has received funding from the European Union’s Horizon 2020 research
  and innovation programme under grant agreement No 730292.
Factsheet
Document name: MARKET ANALYSIS FOR TREATMENT OF PLASTIC WASTE MARKET
Responsible partner: FOUNDATION KNOWLEDGE INNOVATION MARKET
Work package: WP8
Task: TASK 8.1
Deliverable number: DELIVERABLE 8.1
Version: v.1
Version date: 15/11/2017

Dissemination level

      X          PU = Public
                 PP = Restricted to other programme participants (including the EC)
                 RE = Restricted to a group specified by the consortium (including the EC)
                 CO = Confidential, only for members of the consortium (including the EC)

Author: Jordi Gasset, Luigi Iannotti
Reviewers: All Plasticircle partners

Abstract
The following deliverable is the first draft for deliverable 8.1 of the Plasticircle
project, to be submitted in three instalments (month 6, 18 and 36) of the project
implementation. Deliverable 8.1, Market Analysis for treatment of plastic waste
market, is conceived as a study of the actual treatment of the plastic packaging
waste market needs and size in order to better define the approach for
commercialisation of the solutions / solutions developed in the framework of the
PlastiCircle project.
The objective of the present document is to present an i overview of the state of
the art of plastic waste management and treatments, including specific description
for the areas dealt with by the project and its related solutions, namely collection,
transport, sorting and recycling of plastic packaging waste.

                                                                   D8.1 Preliminary Market Analysis
Partners short names
 1. ITENE: INSTITUTO TECNOLÓGICO DEL EMBALAJE, TRANSPORTE Y LOGÍSTICA

 2. SINTEF: STIFTELSEN SINTEF

 3. RTT: RTT STEINERT GMBH

 4. AXION : AXION RECYCLING

 5. CRF : CENTRO RICERCHE FIAT

 6. UTRECHT : GEMEENTE UTRECHT

 7. INNDEA : FUNDACION DE LA COMUNITAT VALENCIANA PARA LA PROMOCION
    ESTRATEGICA EL DESARROLLO Y LA INNOVACION URBANA

 8. ALBA: PRIMARIA MUNICIPIULUI ALBA IULIA

 9. MOV: MESTNA OBCINA VELENJE

 10. SAV: SOCIEDAD ANONIMA AGRICULTORES DE LAVEGA DE VALENCIA Spain

 11. POLARIS: POLARIS M HOLDING

 12. INTERVAL: INDUSTRIAS TERMOPLÁSTICAS VALENCIANAS S.A.

 13. ARMACELL : ARMACELL Benelux S.A.

 14. DERBIGUM : DERBIGUM N.V.

 15. PROPLAST : CONSORZIO PER LA PROMOZIONE DELLA CULTURA PLASTICA
     PROPLAST

 16. HAHN : HAHN PLASTICS Ltd.

 17. ECOEMBES : ECOEMBALAJES ESPAÑA S.A.

 18. KIMbcn : FUNDACIÓ KNOWLEDGE INNOVATION MARKET BARCELONA

 19. PLAST-EU: PLASTICSEUROPE

 20. ICLEI: ICLEI EUROPASEKRETARIAT GMBH

                                                   D8.1 Preliminary Market Analysis
Table of contents

1. Executive Summary ............................................................................ 5
2. Introduction: the PlastiCircle project ............................................... 6
  2.1    Project Objectives .......................................................................................... 7
  2.2    Project Expected Impact .............................................................................. 9
3. Plasticircle General Context ........................................................... 10
  3.1    Main concepts and definitions of plastic waste management............ 10
  3.2    Plastic waste generation ............................................................................. 14
  3.3    Plastic waste recovery and collection ...................................................... 19
  3.4    Incentive mechanisms ................................................................................. 29
  3.5    Plastic transport ............................................................................................. 31
  3.6    Plastic waste sorting ..................................................................................... 34
  3.7    Plastic waste recycling ................................................................................ 36
4. Benchmarking analysis. Similar initiatives and projects .............. 38
  4.1    Collaborative projects ................................................................................. 41
  4.2    Private initiatives ............................................................................................ 44
  4.3    Institutional programmes ............................................................................. 45
5. PlastiCircle EU legislation and the circular economy ................. 46
  5.1    Background ................................................................................................... 47
  5.2    EU policy ......................................................................................................... 62
  5.3    Circular economy framework..................................................................... 63
6. Market development ....................................................................... 64
  6.1    Understanding the market .......................................................................... 64
  6.2    Market access and generation .................................................................. 67
  6.3    Inter-sector strategic collaborations .......................................................... 68
  6.4    Market development Support Policies ...................................................... 69
  6.5    Market applications ..................................................................................... 70
  6.6    Active Companies ........................................................................................ 72

                                                                                           D8.1 Preliminary Market Analysis
1. Executive Summary
The following deliverable is the second draft for deliverable 8.1 of the PlastiCircle
project, to be submitted in three instalments (month 6, 18 and 36) of the project
implementation. Deliverable 8.1, Market Analysis for treatment of plastic waste
market, is conceived as a study of the actual treatment of the plastic packaging
waste market needs and size in order to better define the approach for
commercialisation of the solutions / solutions developed in the framework of the
PlastiCircle project.
The objective of the present document is to present an initial overview of the state
of the art of plastic waste management and treatments, including specific
description for the areas dealt with by the project and its related solutions, namely
collection, transport, sorting and recycling of plastic packaging waste.
More specifically, this preliminary document will provide a state of the art of the
economic, social, legislative and technical environment in which the project will
be developed. The following information will be presented:
Identification of the operational and legislative arrangements to be taken into
consideration
Identification of similar initiatives and projects addressing similar needs and
objectives as the PlastiCircle project
Identify both the added value of the Plasticircle project face the other initiatives
and the opportunities for knowledge transfer among them.
Analyse the market conditions and current developments for the Plasticircle
solution.
Set of conclusions and recommendations aimed at guiding the development
of the project in its implementation and pilot stages.
Taking into consideration that the following is the initial draft of a deliverable that
will be submitted in month 36, and that for its development it will be fundamental
the information collected in regards of the solutions developed in the project and
the subsequent pilot process, the information provided below is very likely to be
updated, upgraded and modified in the course of the project.
D8.1 Preliminary Market Analysis
2. Introduction: the PlastiCircle project
Plastics are used to manufacture an incredible number of products we use every
day, such as beverage and food containers, trash bags and grocery bags, plastic
cup and utensils, children’s toys and diapers, and bottles for everything, from
mouthwash and shampoo to glass cleaner and dishwashing liquid. And that is not
even counting all the plastic that goes into furniture, appliances, computers and
automobiles.
Among the typologies mentioned above, plastic packaging is present in most of
the environments of our daily lives. Almost every industry and most consumable
goods rely on the use of plastic packaging. The commercial use of plastic
packaging and its preeminent use are based on their combination of flexibility,
strength, lightness, stability, impermeability and ease of sterilisation1. As it is
mentioned by the Association of Plastics Manufacturers, the main benefits of plastic
packaging are the lightness of the packaging material, its capacity to preserve
and conserve food without altering their properties, its convenience and innovative
developments (i.e. inclusion of chips and conducive materials in new plastic
packaging solutions) and its safe and hygienic capacities. All these factors make
plastic packaging a suitable and valuable solution for almost all commercial and
industrial uses and have mainstreamed their use.
Traditionally, the popularity of plastic packaging solutions has been associated with
another side of the coin, namely, the environmental impact of plastic packaging
use. The accumulation of plastic packaging, especially in landfills and its
subsequent impact upon marine environments, the polluting effect of plastic
manufacturing and incineration are commonly referred as negative impacts.
Moreover, plastics and plastic packaging accumulations represents a nightmare
for local and municipal authorities, prompting local governments to implement
specific policies aimed at the collection, transport and management of local
plastic waste.
However, the abovementioned must not hide the fact that the plastic packaging
industry does also offer important opportunities for innovation, sustainability and the
promotion of a more effective approach towards circular economy parameters. A
lot is happening around the plastic packaging industry aimed at improving the
environmental, social and economic impact of plastic solutions. Efforts in new and
innovative plastic packaging solutions (such as the design of bottles that allow for
a more shipping efficiency, down gauging rigid plastic containers, etc), the
development of more energy efficient plastic packaging production processes,
and the involvement of the plastics industry sector in environmental and

1 http://www.plasticseurope.org/use-of-plastics/packaging.aspx

                                                                 D8.1 Preliminary Market Analysis
sustainability initiatives are just small examples of the process.
But perhaps, the main cultural change that is taken place around the plastics
management vision is the need to create a new integrated and community based
effort towards a better use, design, management and treatment of plastics. It is
within this community based and integrated approach that the PlastiçCircle
project is conceived. The PlastiCircle project is a collaborative project that aims to
generate a significant improvement in the plastic waste management chain, from
a circular economy approach, with the vision of reintroducing plastic waste within
the value chain. The project represents thus, a social redefinition of plastic waste
management, through the development of specific actions for the collection,
transport, sorting and recycling of plastic waste. In other words, circular economy
and community involvement are enforced to ensure that plastic waste is managed
in a more clever way and that it is reintegrated within the value chain, reducing its
environmental impact and generating economic and social opportunities.

Aware that more than 25.8 million tonnes of plastic waste are produced per year
in the EU282 (50 kg per EU citizen), with only 29.7% being recycled, something that
represent an important market loop and going against EU legislation on waste the
Plasticircle has been conceived as a collaborative response to this situation and
launched within the framework of the European Programme H2020 and will be
implemented over the period 2017 – 20192.

Also aware of the low recycling rates and the technical difficulties of the process
the Plasticircle project aims to develop and implement a holistic process to
increase packaging waste recycling practices. To achieve its objective, the
Plasticircle project will focus on innovation in the different stages associated with
the treatment of plastic packaging waste: collection (to increase the amount of
packaging collected), transport (to reduce the costs of recovered plastic), sorting
(to increase the quality of recovered plastic), and recovery in value-added
products.

In this context the Plasticircle project has been launched within the framework of
the European programme H2020 and will be implemented over the period 2017 -
2019.

      2.1                 Project Objectives
As mentioned above, the main objective of the Plasticircle project is to improve
the plastic waste management process and to better integrate it within the circular
economy of plastics approach. To do this, four main stages associated with plastic
packaging treatment will be addressed: collection, transport, sorting and

2PlasticsEurope, 2015. Plastics – the Facts 2015 An analysis of European latest plastics production, demand and waste data.

                                                                                                                         D8.1 Preliminary Market Analysis
recycling.
Collection. The project will integrate and validate an innovative packaging
collection system which increases the amount of plastic packaging waste
collected. This system will be able to identify the quantity and quality of packaging
generated by each family/citizen, with a view to implementing compensation
policies to encourage optimal collection (“the better you separate, the less you
pay” approach). Also, information to citizens on how well they segregate in
comparison with others will be considered as a tool to improve collection. To
achieve this, efforts will centre on designing smart containers equipped with
different technologies: a user identification system, identifiable labels for deposited
garbage bags, data transmission by LoRa/SigFox, and anti-fraud measures. The
system will be competed with a characterization protocol to randomly evaluate
the quality of segregation of unitary bags.
Transport. The Plasticircle project will develop, integrate and validate an
innovative transport process from municipalities to sorting plants that will decrease
the final price of recovered plastic. The Plasticircle transport system is based on
sensors which will recognise the filling levels of containers in real time, thus
automatically optimizing collection routes through a truck traceability system. The
system will be completed with pressing systems in the waste collection trucks, with
a view to maximizing the amount of plastic waste transported per route. Efficient
driving will also be considered. It should be noted that the whole system on
collection and transport will be connected through an IoT cloud platform based on
the external communication capacity of the containers (connection to CAN-
Bus17).
Sorting. The project will develop, integrate and validate an innovative sorti ng
process for separating plastic waste into the optimal fractions to be subsequently
recovered (i.e. PET, rigid PE, PE film, rigid PP, PP film, and plastic mixes). It should be
noted that multilayer materials, which are gaining importance in the packaging
sector, will be included in the fraction of plastic mixes. The improvements will be
based on optical Near-Infrared-Hyperspectral-Imaging technology and specifically
on the adaptation of material feeding system, identification ranges and ejection
systems. Innovation in sorting will be focused on the improvement of the purity of
the six plastic fractions mentioned, and specially the elimination of PVC and bio-
plastics (increasing plastic fraction which has a negative influence in the
recyclability of conventional plastics). Tera-Hertz imaging and hyperspectral snap
shooting will be integrated with this aim.
Moreover, PlastiCircle will also focus on film sorting which currently present
technical problems on material detection and ejection (separation). Detection
problems come from a continuous increase of number of polymers used in the
packaging sector, whereas ejection problems come from the material feeding
based on conveyor belts (state-of-the-art). This drawback will overcome in
D8.1 Preliminary Market Analysis
PlastiCircle by an innovative system with a layout based on air-flow for material
feeding and therefore free of conveyor belts.
Recovery. The project will develop and validate innovative products based on
the fractions previously sorted. The products developed will be foam boards f or
wind turbines/roofing structures/sandwich panels (PET), automotive parts like
engine covers (PET), bumpers and dashboards (rigid PP/PP film), bituminous roofing
membranes (rigid PE/PE film), garbage bags (PE film), asphalt sheets/roofing felts
(rigid PP/PP film) and urban furniture like fences, benches and protection walls
(plastic mixes). The manufacturing of these products will be based on extrusion,
injection and compression moulding.
2.2 Project Expected Impact
The project work programme has defined a set of specific impacts that will need
to guarantee the success, the uniqueness and the sense of urgency of the project
rationale. In this sense the following indicators have been established in order to
assess both the impact of the project and the added value offered by the
Plasticircle system face other initiatives.
Impact Indicator Agents Involved
Plastic producers /converters, waste
Improvement of the EU 500-1400 new companies /
managers equipment firms, consumers,
plastic value chain 11.900 – 33.000 new jobs
public bodies
Reduction of 1.59MT of
landfilled and incinerated Local administration, plastic
Promotion of plastic
waste / Reduction of manufacturers, plastic converters,
packaging recovery
associated environmental citizens.
impact
Separation of plastic
waste into the optimal
fractions to be
subsequently recovered
(PET, rigid PE, PE film, rigid Plastic producers /converters, waste
Better plastic waste quality
PP, PP film, and plastic managers equipment firms, consumers,
mixes). The volume of
quality materials achieved
through the process will be
used as indicator.
D8.1 Preliminary Market Analysis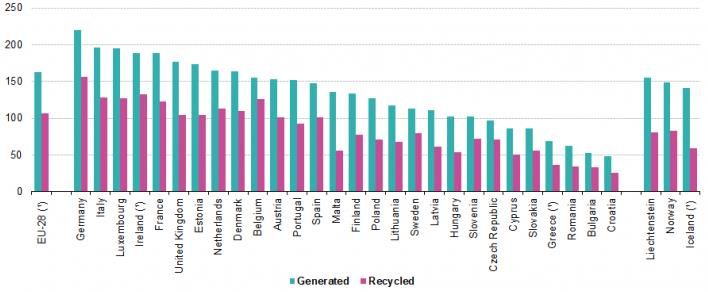
Sorts and typologies of
Optimised production of             secondary products
                                                                        Recycling firms and manufacturers,
recycled goods                      developed from recycled
                                    plastic

                                    Alignment with the waste
Encourage recovery over
                                    hierarchy established in            Waste managers, consumers / citizens,
plastic landfilling and
                                    the Waste Framework                 public administration representatives
incineration
                                    Directive 2008/98/EC

Creation of new business            Increased number of                 Producers, converters, waste
opportunities in the plastic        manufactured eco-                   management, equipment and software
sector                              innovative solutions
                                               Table 1 Project impact

   3. Plasticircle General Context
   3.1  Main concepts and definitions of plastic
     waste management
During the development and improvement of the project market of analysis a
specific glossary will be used of which a brief listing can be found below:
                          Material that contains as an essential ingredient a high polymer: polyethylene,

     PLASTIC                terephthalate, high density polyethylene, vinyl, low density polyethylene,
                                                            polypropylene.

 PLASTIC WASTE                                Discarded plastic after intended use is over

   WASTE                    The collection, transportation, reduction, recovery, recycling, composting
 MANAGEMENT                                                   disposal.

                          Person or unit or agency engaged in production of plastic raw material to be
 MANUFACTURER                                 used as raw material by the producer.

                             Person(s) engaged in manufacture or import of carry bags or multilayer
   PRODUCER                                      packaging or plastic sheets.

                          General term for devices that chop large items into flakes that are nominally
    GRINDER                                     fractional inches in dimension.

                           Type of machinery used to automate the process of identifying and sorting
 OPTICAL SORTER                   recyclable materials into their different categories for baling.

 NEAR INFRARED            Type of optical sorting machinery wherein the light used is near infrared (NIR)

                                                                                     D8.1 Preliminary Market Analysis
SORTER light and the detection made is of plastic type.
Type of equipment that uses pressure to densify and contain recyclable
COMPACTOR material.
Any material used or to be used for packaging and having at least one layer of
MULTI-LAYERED
plastic as the main ingredients with one or more layers of materials such as
PACKAGING paper.
Process of transforming segregated plastic waste into a new product or raw
RECYCLING material for producing new products.
REPROCESS Converting used materials into new materials that can be used.
WASTE Every person or group of persons or institution, residential and commercial
GENERATOR establishments.
WASTE Collection, storage, transportation reduction, re-uses recovery, recycling,
MANAGEMENT composting or disposal of plastic waste in an environmentally safe manner.
Party or parties that aggregate postconsumer, commercial and or post-
industrial materials from the public and sells to the reclaimers. Collectors can
COLLECTOR collect materials from the curbs of households or operate drop-off centres
where the public can bring recyclables.
Business that buy raw material and convert it into finished goods. In the case of
plastics, plastic pellets of specific polymers are melted and processed into items
CONVERTER such as fibres, films, sheets and rigid packaging, along with durable and semi-
durable goods.
The commercial entity that accepts aggregated and postconsumer material
RECLAIMER and perform a series of operations to allow them to return to commerce as
useful raw materials or used into new finished items.
Collection method whereby householders place specified used items in special
CURBSIDE
containers adjacent to containers of household waste for periodic collection by
RECYCLING others.
Form of collection of household recyclables wherein the householder takes the
DROP-OFF items to a central aggregation point.
DROP-OFF Facility, often serving rural areas, where the public can actively deliver
RECYCLING SITE recyclables into the recovery stream.
Any material used or to be used for packaging and having at least one layer of
MULTI-LAYERED plastic as the main ingredients with one or more layers of materials such as
D8.1 Preliminary Market AnalysisPACKAGING paper.
Process of transforming segregated plastic waste into a new product or raw
RECYCLING material for producing new products.
PLASTIC Industrial location that sorts nixed plastic items into streams of discrete plastic
RECYCLING resin types. A PRF can also conduct preliminary recycling operations such as size
FACILITY reduction to plastic fake.
Material that did not meet the quality requirements for fully acceptable
product. The scrap can be pellets that did not meet specifications of converted
PLASTIC SCRAP goods. The scrap can be ground to repro and used again or sold or disposed,
depending on levels of degradation and contamination.
The status after an item has been used for its intended use. This intended user
POSTCONSUMER may be at another industrial site or as transportation packaging or by
household consumers.
RESIN
IDENTIFICATION Coding system placed on plastics to identify the polymer
CODE
Table 2 Main Concepts
Material that contains as an essential ingredient a high polymer: polyethylene,
PLASTIC terephthalate, high density polyethylene, vinyl, low density polyethylene,
polypropylene.
PLASTIC WASTE Discarded plastic after intended use is over
WASTE The collection, transportation, reduction, recovery, recycling, composting
MANAGEMENT disposal.
Person or unit or agency engaged in production of plastic raw material to be
MANUFACTURER used as raw material by the producer.
Person(s) engaged in manufacture or import of carry bags or multilayer
PRODUCER
packaging or plastic sheets.
General term for devices that chop large items into flakes that are nominally
GRINDER fractional inches in dimension.
Type of machinery used to automate the process of identifying and sorting
OPTICAL SORTER recyclable materials into their different categories for baling.
NEAR INFRARED Type of optical sorting machinery wherein the light used is near infrared (NIR)
D8.1 Preliminary Market AnalysisSORTER light and the detection made is of plastic type.
Type of equipment that uses pressure to densify and contain recyclable
COMPACTOR material.
Any material used or to be used for packaging and having at least one layer of
MULTI-LAYERED
plastic as the main ingredients with one or more layers of materials such as
PACKAGING paper.
Process of transforming segregated plastic waste into a new product or raw
RECYCLING material for producing new products.
REPROCESS Converting used materials into new materials that can be used.
WASTE Every person or group of persons or institution, residential and commercial
GENERATOR establishments.
WASTE Collection, storage, transportation reduction, re-uses recovery, recycling,
MANAGEMENT composting or disposal of plastic waste in an environmentally safe manner.
Party or parties that aggregate postconsumer, commercial and or post-
industrial materials from the public and sells to the reclaimers. Collectors can
COLLECTOR collect materials from the curbs of households or operate drop-off centres
where the public can bring recyclables.
Business that buy raw material and convert it into finished goods. In the case of
plastics, plastic pellets of specific polymers are melted and processed into items
CONVERTER such as fibres, films, sheets and rigid packaging, along with durable and semi-
durable goods.
The commercial entity that accepts aggregated and postconsumer material
RECLAIMER and perform a series of operations to allow them to return to commerce as
useful raw materials or used into new finished items.
Collection method whereby householders place specified used items in special
CURBSIDE
containers adjacent to containers of household waste for periodic collection by
RECYCLING others.
Form of collection of household recyclables wherein the householder takes the
DROP-OFF items to a central aggregation point.
DROP-OFF Facility, often serving rural areas, where the public can actively deliver
RECYCLING SITE recyclables into the recovery stream.
Any material used or to be used for packaging and having at least one layer of
MULTI-LAYERED plastic as the main ingredients with one or more layers of materials such as
D8.1 Preliminary Market AnalysisPACKAGING paper.
Process of transforming segregated plastic waste into a new product or raw
RECYCLING material for producing new products.
PLASTIC Industrial location that sorts nixed plastic items into streams of discrete plastic
RECYCLING resin types. A PRF can also conduct preliminary recycling operations such as size
FACILITY reduction to plastic fake.
Material that did not meet the quality requirements for fully acceptable
product. The scrap can be pellets that did not meet specifications of converted
PLASTIC SCRAP goods. The scrap can be ground to repro and used again or sold or disposed,
depending on levels of degradation and contamination.
The status after an item has been used for its intended use. This intended user
POSTCONSUMER may be at another industrial site or as transportation packaging or by
household consumers.
RESIN
IDENTIFICATION Coding system placed on plastics to identify the polymer
CODE
3.2 Plastic waste generation
Data currently available show that distribution of plastic in Europe is increasing and it
is expected to increase in the following years. This will be reflected, therefore, in an
associated need for innovative and effective recycling and management industry to
provide an answer to all associated requirements3. Figure 3 shows the distribution of
global plastic materials production. China is the largest producer of plastic materials
with more than 27% of global production* (only thermoplastics and polyurethanes),
followed by Europe and NAFTA.
Figure 1 Source: Plastics Europe
3http://www.plasticseurope.org/documents/document/20161014113313-plastics_the_facts_2016_final_version.pdf
D8.1 Preliminary Market AnalysisAccording to IBISWorld the industry of virgin plastic grossed at about 109.9 billion dollars
in 2015, with an industry growth rate of 2.5% per year between 2010 and 2015 and is
expected to grow at an annualized rate of 1.1% per year between the year 2015 and
the year 2020. This industry is projected to see a revenue of 117.7 billion dollars per year
by the year 2021 (Witter, 2015). These figures advance that the production and
consumption of plastics, including those related with the packaging industry, will show
a steady increase despite the regular calls for consumption limitation. According to
the same study published by IBIS World IBISWorld six main industries are identified as
the primary industrial consumers of virgin plastic resins, namely:
Plastic Pipe and Parts Manufacturing: this plastic pipe industry primarily uses PVC
or plastics marked with the number three. This industry grosses about 17.9 billion
dollars per year and is expected to see an annualized growth rate of about 2.2%
per year through the year 2020 (Yucel, 2015).4
Plastic Film, Sheet and Bag Manufacturing - This industry is primarily fed by plastics
marked number two and four. The industry grosses 44.6 billion dollars per year and
is project to grow an annualized rate of 3.4% through 2020 (Blau, 2015).5
Polystyrene Foam Manufacturing - This industry is largely built around food
containers and uses entirely plastic marked number 6. The industry grosses 9.4
million dollars per year and has a projected annualized growth rate of -1.6%
through the year 2020 (Petrillo, 2014).6
Laminated Plastics Manufacturing - These plastics are primarily used in automobile
applications and other durable machinery so recycling is not as big of an issue for
them. This industry grosses 3.7 billion and has a projected growth rate of 2.7%
through the year 2019 (Morea, 2014).7
Urethane Foam Manufacturing - This industry is concerned with foam cushioning
in furniture and automobile applications. This material has traditionally been
landfilled and there is very little literature available on whether this material can
be recycled. This industry grosses 9.5 billion per year and has a projected
annualized growth of 2.6% through the year 2020 (McKitterick, 2015).8
What we can gather from these performance projections is that with the major
exception of polystyrene, products and packaging made from resins marked three
through seven will continue to be produced at a steadily increasing rate. Any action
taken should accelerate the expansion of the recycling manufacturing industry in
combination with a general trend of an increasing percentage of plastic being
4
Yucel, Ibraham. (2015, April). IBISWorld Industry Report 32612: Plastic Pipe and Parts Manufacturing in the US. IBIS World
5
Blau, Gavan. (2015, April). IBISWorld Industry Report 32611: Plastic Film, Sheet & Bag Manufacturing in the US. IBIS World
6
Petrillo, Nick. (2014, December). IBISWorld Industry Report 32614: Polystyrene Foam Manufacturing in the US. IBIS World
7
Morea, Stephen. (2014, August). IBISWorld Industry Report 32613: Laminated Plastics Manufacturing in the US. IBIS World
8
McKitterick, Will (2015, January). IBISWorld Industry Report 32615: Urethane Foam Manufacturing in the US. IBIS World
D8.1 Preliminary Market Analysisrecycled in an attempt to outpace the increase in plastic waste production.
Table 3 Source: Waste Market Efficiency
According to recent statistics more than more than 25.8 million tonnes of plastic waste
are produced per year in the EU289 (50 kg per EU citizen), with only 29.7% being
recycled (39.5% is energy recovery, 10.19 Mt; 30.8% is land filled, 7.95 Mt2).
Figure 2 Growth in plastic production 1950-2014
Source: http://www3.weforum.org/docs/WEF_The_New_Plastics_Economy.pdf
9 PlasticsEurope, 2015. Plastics – the Facts 2015 An analysis of European latest plastics production, demand and waste data
D8.1 Preliminary Market AnalysisPackaging will constitute the main area of plastic consumption in the following years,
with estimates considering that the total market size in billions of units will increase from
798 to 819 in Western Europe in the following five years. The same forecast show an
accumulated increase of 0.5% between 2014 and 2019 in plastic packaging
consumption.
In the next Figure 3, it can see that during 2012 – 2016 the generation of plastic
derivated from domestic use have been growing drastically since 2013 raising almost
16,5 millions of tonnes by year.
Figure 3 Domestic packaging plastic waste generated European Union10
Figure 4 Domestic packaging plastic generated by consortium countries in 2016 10
*Romania data 2015
In the Figure 4 Figure 4 Domestic packaging plastic generated by consortium
10 Source: Eurostat – own elaboratión – consulted 11/2018
D8.1 Preliminary Market Analysiscountries in 2016 10it
can see the domestic packaging plastic generated by
consortium countries around 11 MMtonnes which representd the 64,74 % of the plastics
generated in Europe.
According to the most recent studies plastic packaging represents the major part of
all plastic waste, approximately 60% of the total plastic waste generated.
Figure 5 Percentage of plastic waste generation
Source: Plastic ZERO – Public Private Cooperation for Avoiding Plastic Waste
In terms of the main types of plastic consumed by the packaging industry, data shows
that the main consumption is related to PE-LD, PE-LLD, PE-HD, PE-MD, PP and PET.
Figure 6 Plastics demand by polymer and market segment
Most of the plastic waste generated in Europe is generated in households. This fact is
very important for the Plasticircle approach; household and household owner need
to understand their co-responsibility in managing plastic packaging waste and to
D8.1 Preliminary Market Analysisactively perform their role as consumers and converters. For this reason, the incentive
based approach and the technological approach of the project aimed at
guaranteeing citizens privacy and involvement do play a major role.
By domestic packaging products the main use will continue to be plastic bottles,
followed by confectionary products and other consumables. PET bottles are expected
to maintain a growth rate of about 2.7% in the following years.
The environmental impact of this plastic waste generation is reflected in dramatic
figures that indicate the emission of 23.8 MT of CO2 and represents a clear wastage
of resources (€582/tonne of recovered plastic represent losses of €10.56 bn.).
The revenues from secondary materials (waste materials or recyclates) can pay for a
substantial part of the total cost of waste management schemes in EU Member States.
Therefore understanding how the price of recyclate changes over time is an important
aspect of waste management. In the figure 5, it can see how the price developments
and trade volume of plastic waste has evolutioned last fifthteen years.
However, even though collection and recycling of packaging waste (included
plastics) has been growing steadily, there still exist a significant gap between the
plastic produced and the plastic recovered.
Figure 7 Price Developments and Trade Volume of Plastic Waste11
3.3 Plastic waste recovery and collection
The increase mentioned in plastic packaging consumptions, has been coupled thanks
11 https://ec.europa.eu/eurostat/web/waste/prices-for-recyclates
D8.1 Preliminary Market Analysisto the important awareness raising efforts and the environmental concerns associated
to the problem in a significant increase of packaging waste recovery and collection.
These efforts have also been accompanied by an important legislative corpus such as
the Circular Economy Package Plan or the new regulatory arrangements at municipal,
regional and national level.
The mentioned data suggest that these efforts have resulted in a significant and
steady increase of packaging waste collection and recycling from 2005 (data
available for 2005). It is important to note that collection of plastic waste has been
followed, in parallel, with a steady growth of recycling initiatives, something that
highlights an important valorisation of plastic waste.
Figure 8 Percentage of domestic packaging plastic waste recovered European Union10
Figure 9 Domestic packaging plastic recovered by consortium countries in 2016 10
D8.1 Preliminary Market AnalysisIn the Figure 8 and Figure 12, it can see that Europe has a high percentage of
domestic packaging waste recovered, around 74 %, which it has been raising during
last years, highlighting that the average of consortium countries in 2016 was above of
European near to 81%.
Figure 10 Percentage of packaging plastic waste recycled European Union10
Figure 11 Domestic packaging plastic recovered by consortium countries in 2016 10
In the Figure 10 and Figure 11, it can see that Europe has a less than fifty percentage
in domestic packaging waste recycled, around 44 %, which it has been raising during
last years, almost 12 %, highlighting that the average of consortium countries in 2016
was just a little bit above of European, around 47 % and Slovenia has the highest with
a 62 %.
D8.1 Preliminary Market AnalysisFigure 12 Generation, recovery and recycling for packaging plastic tonnes (millions) , EU, 2010-201610
Figure 12 shows that the generation of domestic plastic packaging has been growing
in recent years, plus the ability to recover and recycle has been consistent with this
growth. It should be noted that the percentage recycled has increased from 33% to
47% between the period 2010 - 2016.
When analysing the figures segregated by countries, the common pattern of a still
significant gap between plastic waste generated and its actual recycling can be
observed. Although some countries show higher rates of recycling (i.e. Belgium or
Sweden), the average values shown by the figures demand for continued efforts and
developments.
Figure 13 Volume of overall plastic waste generated and recycled
Source: EUROSTAT
D8.1 Preliminary Market AnalysisOne of the reasons that explains the growth in plastic waste collection and recycling
is the development and implementation of more effective collection schemes. Our
attention will be focused on the most significant practices of plastic packaging waste
collection used in communities, namely curb-side collection, drop-off, buy-back and
deposit/refund programmes in order to increase the recycling rates.
Below is a description of these four models:
Curbside collection: Curbside collection is considered a low-risk method to reduce
waste volumes and increase recycling rates. In curbside collection materials are
collected in large bins, coloured bags or small open plastic tubs specifically designed
for content. Curbside collection uses co-mingled recyclables to maximise collection.
Curbside collection has been a very successful model to recover domestic plastic
bottle packaging.
Drop-off: In this method, containers for designated recyclable materials are placed at
a central collection location throughout the community. The containers are generally
marked as to which recyclable material should be placed in them. Residents are
requested to deliver their recyclables to the drop-off location, where recyclables are
separated by material type into their respective collection containers. Drop-off
recycling programs are more suitable when residents are taking their garbage to a
central waste collection facility or transfer station. The main problems with such
programmes are that they suffer from unpredictable throughput.
Buy-Back: Most buy-back recycling centres are operated by private companies and
pay consumers for recyclable materials that are brought to them. Buy-back centres
usually have purchasing specifications that require consumers to source separate
recyclable materials brought for sale. These purchase specifications can greatly
reduce contamination levels and allow the buy-back centre to immediately begin
processing the recyclables they purchase, while providing consumers with an
economic incentive to comply with the specifications. Buy-back centres are similar to
drop-off centres expect they pay waste generators for their items based on market
values.
Deposit / Refund Programmes: These programmes require collection of a monetary
deposit purchase of a plastic container. When container is returned to an authorized
redemption centre, or to the original seller, the deposit is partly or fully refunded to the
redeemer.
According to the 2016 state of curbside report12 in pilot locations of USA there was not
one individual attribute that indicates curbside program success, but several that
affect performance and trends became evident. The majority of the highest-
performing programs collect material single-stream, collect curbside recycling
automatically, use an automated cart-based system, and have public engagement
12https://recyclingpartnership.org/wp-content/uploads/2018/05/state-of-
recycling-report-Jan2017.pdf
D8.1 Preliminary Market Analysisthat influences curbside recycling to occur in their community.
Of the communities surveyed with over 400 lbs/hh/yr recovery averages, 93% provide
service to their residents automatically, meaning each single-family residential unit
located within a given jurisdiction is provided a collection receptacle and is included
in a regularly scheduled collection route without the need for the resident to take any
action.
The alternative “opt-in” style system where the resident must take action on their own
to receive service can be successful with additional policy provisions, such as making
recycling service mandatory when opting-into trash service, bundling garbage and
recycling together with a cost structure that stays the same if recycling is refused, or
changing to an “opt-out” method. Without those provisions, however, opt-
in/subscriptionstyle systems can create an undue burden on the average citizen of a
community.
83% of the top-performing communities collect recyclables using wheeled carts with
lids with the large majority being 95 gallons. These carts do not only provide more
capacity for those residents that are currently recycling to recycle more, but
convenience for those that do not recycle to start participating.
Figure 14 Profile of highest-performing cities surviyed12
The collection process mentioned above demand for a significant involvement of the
local communities and their citizens. As the worldwide population is moving towards a
more urban lifestyle, the amount of municipal household waste increases, and so does
the need for citizenship involvement. This is a significant point when we analyse the
world population data; ten years ago there were 2.9 billion urban residents who
generated about 0.64kg of municipal waste per person per day (0.68billion tonnes per
year). Nowadays it has been estimated that the amount has increased to about 3
billion residents generating 1.2 kg per person per day (1.3 billion tonnes per year). By
D8.1 Preliminary Market Analysis2025 this will likely increase to 4.3 billion urban residents generating about
1.42kg/capita/day of municipal waste13 (2.2 billion tonnes per year). (World Bank,
2013).
It is important to note, as well, that the changing nature of rural communities, with a
significant demographic, economic and social change in relation to how these rural
communities were 20 years ago (new population typologies, new economic activities,
residential areas, increasing growth of attraction for touristic and leisure-based
activities) demand for new and innovative methods in such areas.
One of the elements that needs to be taken into consideration is the importance that
overcoming anonymity can have for the development of such programmes.
Currently, citizens might fell that their efforts in relation to plastic collection and
recovery are not “recognised”. In this regard, the PlastiCircle collection system, based
on smart containers able to identify the quantity and quality of plastic packaging
generated by each family/citizen, will be a step forward in overcoming such
anonymity issue. For this, Containers will be provided with a user identification system
based on the reading of a “citizen card” (i.e. unique and smart identification system
based on RFID or QR). After reading, the container lid will be unlocked to allow the
citizen to deposit the garbage bag with the packaging waste inside. Citizens will stick
a label on the garbage bag before depositing it in the container, which will be
provided by the container. This label, which will also be designed in the project, will
identify the citizen. The system will be completed with regular assessment of the
composition of bags (characterization protocol; segregation quality).
Globally, ample opportunity exists for smart waste collection solutions that can
increase efficiency and improve the quality of these services. The commercialization
of related technologies represents a fertile ground for existing waste haulers and new
market entrants, particularly as city administrators face pressure to carry out waste
collection as efficiently and effectively as possible—often on a tight budget. 14
Within the waste and recycling industry, a few key categories have emerged where
objects connected to the internet are affecting operations and efficiencies. Radio-
frequency identification (RFID) technology on carts helps track those assets in the field
and can be used by haulers to confirm that addresses have been serviced. 14
The trend of putting a wider variety of devices online—the so-called Internet of
Things—continues to spread. Increasingly, household devices are now internet
enabled, allowing users to control them remotely or get alerts if something is amiss.
Devices increasingly collect new streams of data that can be analyzed to change
behaviors or purchasing decisions. The waste and recycling industry is also being
13 http://siteresources.worldbank.org/INTURBANDEVELOPMENT/Resources/336387-
1334852610766/What_a_Waste2012_Final.pdf
14 https://www.navigantresearch.com/news-and-views/the-global-smart-waste-collection-technology-market-is-expected-
to-exceed-$223-million-in-2025
D8.1 Preliminary Market Analysisaffected, with trucks, containers of all sizes and other pieces of equipment increasingly
becoming part of this Internet of Things. 14
The global smart waste market is forecast to grow at 16.82% CAGR over the period
2014-2019.The sensor-based container is a battery-powered wireless device that helps
reduce the overall collection and logistics cost of waste collection by approximately
50 percent. The decrease in cost of solid municipal waste collection thanks to smart
waste technologies is an important factor that will propel growth in the Global Smart
Waste Market in the coming years. 15
Some important companies in this sector are: Covanta Energy, Republic Services, Suez
Environment, Veolia North America, Waste Management, Bigbelly, BRE SMARTWaste,
Enerkem, Enevo, Harvest Power, RecycleSmart Solutions and ROS ROCA's.
According to Navigant Research, the global smart waste collection technology
market is expected to grow from $57.6 million in 2016 to more than $223.6 million in
2025. 14
Within the waste and recycling industry, a few key categories have emerged where
objects connected to the internet are affecting operations and efficiencies. Radio-
frequency identification (RFID) technology on carts helps track those assets in the field
and can be used by haulers to confirm that addresses have been serviced. 14
Sensors that detect fill levels of all types of containers are a second category. These
hardy devices let haulers know how full carts or cans are so that pickups can be
optimized. The aggregation of data on how fast certain carts fill can also be used to
predict future pickup schedules and make routes more efficient. 14
Garbage trucks themselves are increasingly wired. Dispatchers can track trucks in the
field. Advanced telematics systems can let maintenance shops know about issues as
they occur (or even before they become bigger problems), allowing for more
predictive maintenance and less downtime. 14
Lastly, when it comes to organics, small digesters installed in commercial operations
often include sensors that can analyze what’s being passed into them. Crunching the
numbers can inform generators how to reduce how much food they waste. 14
The Use of RFID14
RFID technology systems are being integrated into waste haulers’ and municipalities’
customer relationship management (CRM) and billing system to improve customer
service and billing accuracy.
15
https://www.prnewswire.com/news-releases/global-smart-waste-market-growing-at-16-cagr-to-
2019-292351141.html
D8.1 Preliminary Market AnalysisRFID technology uses electromagnetic fields to identify and track tags attached to
objects. The tags contain electronically stored information.
Many cart manufacturers, for example, use RFID technology on assets to confirm
delivery and track assets in the field.
Rehrig Pacific Co. developed the Container Asset Recovery Tracking System
(CARTS). The proprietary system enables a series of services. It allows users to conduct
residential surveys to gather feedback on services, determine interest in new programs
or select a container size. It allows tracking of container shipments and managing
inventory levels at distribution centers. Container deliveries are recorded in real time
by using handheld scanners in conjunction with CARTS. It can generate daily
distribution reports that include household address, container serial number, RFID tag
number, type, size, date and time of delivery.
Cascade Cart Solutions’ (CCS) offering includes the Xtreme Tag RFID tag and the
CartLogic asset management software. CCS’ CartLogic allows management of cart
services and location information using RFID technology, GPS systems and cloud
computing. Each time a delivery, swap, repair or removal is made the cart’s RFID tag
is scanned (or a serial number is entered) and the cart's location and type of service
provided is recorded, generating a service history log for each cart, whether in the
field or at the yard. This information synchronizes with CartLogic's cloud-managed
platform, storing all cart inventory data online.
Otto also offers a variety of container management solutions. It can confirm
delivery for carts. Then, real-time service verification allows orders to be updated and
closed—all while in the field using handheld devices.
SSI Schaefer’s waste technology division, meanwhile, developed WISTAR
Technology, which includes RFID tags on carts and proprietary software with a variety
of capabilities. The company’s RFID-enabled waste carts provide real-time managed
assembly and distribution, GPS location, revenue audits, online reports and inventory
management.
Toter has its ToterTrax system that includes the embedding of an RFID tag into the
handle of each Toter cart during the manufacturing process. As each cart is delivered
to a specific address, the crew scans the cart’s RFID tag with the ToterTrax mobile app
portion of the system to register that it’s been delivered. The ToterTrax app then
retrieves the RFID data, serial number, geo coordinates of location (where the cart
was scanned) and time stamp (when cart was scanned) and sends this data through
a Bluetooth connection to the ToterTrax web portal. This allows real-time monitoring of
cart delivery and rollout.
RFID codes on carts are also used by haulers to confirm when pickups have been
performed.
D8.1 Preliminary Market AnalysisIn typical industry applications, inexpensive RFID tags are affixed to residential carts
and commercial containers, while waste and/or recycling trucks are equipped with
RFID readers. When a cart or container is serviced, the RFID reader recognizes and
records the RFID tag. The RFID tag and the geo-coordinates for the location of the
service are then sent back to a central database.
Additionally, RFID is used to measure set-out rates by customers, and knowledge of
how many carts are serviced by each truck helps improve operational efficiency by
balancing the workload per truck.
Lakeshore Recycling Systems (LRS) in Morton Grove, Ill., for example, uses UHF RFID-
tagged waste and recycling carts that transmit information—including the resident’s
address, name and date—to a reader located on the arm that lifts the carts for
service. The cart’s chip also distinguishes whether it’s waste or recycling. When each
route is closed out at the end of the day, the information is collected, disseminated
and processed by LRS’ software for the sake of billing.
Most municipal waste collection operations focus on emptying containers according
to predefined schedules at a set frequency, creating the possibility of half-full bins
being emptied, poor use of city assets, and unnecessary fuel consumption. While the
smart waste collection market is still in its early phase, a wide availability of
commercially viable technologies and growing interest in connectivity and city IoT
networks are expected to drive growth in this market, reducing these issues.16
The implementation of these technologies related to intelligent collection of waste,
has also led to the development of smart containers, with the intention of knowing at
what moment the container is ready to be picked up during the route
One of the biggest areas of innovation is the development of devices that can
measure the fullness levels of various types of carts and cans. In some cases, these are
devices that can be placed into a cart, can or other receptacle and measure how
full it is and notify haulers when the container needs to be serviced. In other cases, the
technology is built right into the can itself.14
Finnish company Enevo has developed a wireless sensor that can be affixed to a full
range of refuse containers carrying all types of garbage. It is designed to tolerate harsh
weather and grueling conditions, track fill levels and monitor temperatures and
movement to detect fire or vandalism. Pertinent information is transmitted to haulers
via sonar technology so drivers can be more efficient, responsive and timely with
pickups. It’s mainly geared for the commercial and industrial sector. 14
16 https://www.navigantresearch.com/news-and-views/the-global-smart-waste-collection-technology-market-
is-expected-to-exceed-$223-million-in-2025
D8.1 Preliminary Market AnalysisSan Francisco-based Compology has developed rugged sensors for the insides of roll-
off and front-load containers to track fullness, GPS location and motion information.
The sensors feed real-time data to Compology's web-based software dashboard,
where haulers can make timely, data-driven decisions to improve operations and
customer service. Compology has a partnership with Wastequip, which allows
customers to get new roll-off containers delivered directly from the factory with the
technology preinstalled. 14
3.4 Incentive mechanisms
Also in today’s world, people are often too “lazy” to walk ten extra steps to the trash
can and they litter their surroundings with plastic bottles, cans and glass. An Intelligent
Trash can that will actually pay people for throwing recyclable trash like glass and
plastic in them.19
The trash can aims to achieve three fold benefits:
1. Reduce the plastic pollution in the environment.
2. Pay the people to clean up the society so they get motivated.
3. Manage the entire waste transportation smartly. The dustbins will communicate
when they are about to reach their capacity, a dumper can collect the waste and
deposit it to bid dumping areas. In this way the dustbins will be usable with out any
garbage falling outside of them.
4. Get a trash full of JUST recyclable materials — glass bottles and plastic! Segregation
of wastes into recyclable and non recyclable materials is one of the worst problems of
cleaning up huge dumping grounds, and here we get people to do it themselves!.
At this point, it is important to note that technological solution might need to be
supported by the implementation of incentive mechanisms. An incentive scheme is
here understood as any recycling system that is based on incentive motivation through
giving economic or other kind of incentives for recycling, that means, award the act
of recycling to motivate the people. For the implementation of a recycling incentive
plan, the laws and regulation that affect each community must be taken into account
because they will limit or enhance the implementation of any programme.
Currently, the main recycling incentive alternatives being used are the following:
- Pay as you throw (PAYT): is a strategy in which the consumer pays more to dispose
of more waste (the less waste you generate, the less you pay). The consumers that
recycle, reduce and compost save money in their bills, something that provides and
D8.1 Preliminary Market AnalysisYou can also read