PRIME LOGISTICS The definitive guide to the UK's distribution property market Spring 2018 - Tiger Eiendom
←
→
Page content transcription
If your browser does not render page correctly, please read the page content below
PRIME LOGISTICS
The definitive guide to the UK’s
distribution property market

Spring 2018

International Property Consultants

Spring 2018

CONTENTS
Introduction                4   Regions                                 28
2017 highlights             5   Avon & Somerset                         30
UK market overview          6   Berkshire & Wiltshire                   32
Occupier demand             7   Buckinghamshire & Bedfordshire          34
Supply                     10   Cambridgeshire                          36
Development                12   Gloucestershire & Worcestershire        38
Rents & incentives         14   Greater Manchester                      40
Gerald Eve market scores   16   Humberside                              42
Investment                 19   Kent                                    44
Technology & innovation    22   London East                             46
Outlook                    25   London North                            48
                                London South                            50
                                London West                             52
                                Merseyside & Cheshire                   54
                                North East                              56
                                Northern East Midlands                  58
                                Northern West Midlands                  60
                                Oxfordshire                             62
                                Scottish Central Belt                   64
                                South Coast                             66
                                South Wales                             68
                                South Yorkshire                         70
                                Southern East Midlands                  72
                                Southern West Midlands                  74
                                Suffolk & Essex                         76
                                Surrey & Hampshire                      78
                                West Yorkshire                          80
                                Glossary                                82
                                Gerald Eve regions                      84
                                Contacts                                85

                                                                             3
Prime Logistics 2018

INTRODUCTION
Now in its fourteenth year of production, Prime Logistics has become the hallmark for detailed
and impartial logistics property analysis. For the logistics property market over 50,000 sq ft in
size, we can now offer our clients detailed regional analysis for each of our 26 Gerald Eve regions
and have a long historic time series of data on which to draw. We have been helping to inform
the market through the good times and the bad and we hope this research will help you to
identify the threats and opportunities in this sector.

                                  Never before have we seen                                                  The availability of logistics
                                  such interest in the sector                                                accommodation remains in short
                                  from occupiers, developers and                                             supply across the country and we
                                  funds. The changing nature of                                              continue to see demand from a
                                  the way we shop, with growing                                              range of occupier sectors. Whilst
                                  internet retail sales and ever-                                            we saw occupier take-up fall from
                                  quicker delivery times, has had a                                          the record-breaking total achieved
                                  profound effect on the logistics                                           in 2016, taken in isolation, 2017
                                  property market. Retailers need                                            was another strong year and the
                                  the most efficient supply chains to                                         continuing imbalance between
                                  meet customer expectations and                                             supply and demand has placed
                                  logistics property is now a critical                                       considerable upward pressure on
    John Rodgers                                                          Mark Trowell
                                  part of the supply chain which can                                         rents. Indeed, 2017 was a record
    Capital Markets                                                       Occupier Agency
    Tel. +44 (0)20 3486 3467      make or break businesses.               Tel. +44 (0)20 7333 6323           year for prime rental growth.
    Mobile +44 (0)7810 307422                                             Mobile +44 (0)7768 987508
    jrodgers@geraldeve.com         As such, prime logistics property      mtrowell@geraldeve.com           The nature of the demand
                                   is a compelling investment                                              recorded in 2017 has been
proposition and investors from all over the world are attracted by       noticeably different to previous years. We have seen an increase
the strength of the asset’s underlying fundamentals. This weight         in activity from manufacturers, a relatively quiet year for take-
of capital has created strong competition and meant that new             up by dedicated internet retailers and an increase in occupier
yield benchmarks have been set in several locations. We expect           development land purchases. We have also seen technology play
that the sector will continue to attract capital, however, yields        an increasingly important role in operations within warehouses.
are at record lows in several markets and for many, the sector
is too competitive. Reports such as this, which provide you with         Logistics facilities are becoming more automated, with predictive
granular, market-specific intelligence, will be even more important       ordering and picking systems a necessity for modern retailers.
in helping you identify areas of potential outperformance.               The specification and design of warehouses to adapt to these new
                                                                         technologies is changing and we are seeing the increased adoption
Just as the market is evolving, so are we. Gerald Eve has                of multi-storey facilities and a greater need for a strong and reliable
welcomed several new faces to the team this year and we                  supply of power to new developments. The market is moving
can now offer a true ‘cradle-to-grave’ service to clients.               quickly and if you would like to talk to us about our views on any
From initial research, through to planning and development,              of these topics, or if you have a location in mind you would like to
agency, investment, building consultancy, lease consultancy              find out more about, please do not hesitate to get in touch.
and dilapidations advice, we have logistics property covered.

              We have invested heavily in our logistics business and
              can now offer clients the full range of advisory services.
              Our market-leading specialists can help you identify the
              threats and hunt out the pockets of value in this sector.

4
Spring 2018

2017 HIGHLIGHTS

  42.3m                 34%                     5.0%
  2017 take-up          of all take-up by       of all take-up by
  down 16% on 2016      manufacturers in 2017   dedicated internet
                        up on 25% of 2016       retailers in 2017, down
                        take-up                 21% of 2016 take-up

  23.0%                 6.3%                    6.8%
  of all development    UK availability         annual growth
  completions in 2017   rate (Q4 2017)          in prime rents in 2017
  were speculative      up on 6.2%              up on 2.9% in 2016
  down 46% on 2016      in Q4 2016

  2.6%                  4.0%                    £3.3bn
  forecast annual       Heathrow prime          of distribution warehouses
  growth in prime       yield (Q4 2017)         transacted in 2017
  rents 2018 - 2022     down on 4.35%           down on £2.5bn in 2016
                        in Q4 2016

Page 5                                                                        5
Prime Logistics 2018

UK MARKET OVERVIEW

In this section we provide a long term national
overview of the UK logistics market of buildings over
50,000 sq ft in size within our 26 Gerald Eve regions.
This includes a review of the following topics:

•   Occupier demand
•   Market supply
•   The development market
•   Rents & incentives
•   The investment market
•   A five year outlook for rents
•   Technology & innovation

6

Spring 2018
OCCUPIER DEMAND
Take-up
• 42.3 million sq ft of occupational space was transacted during • The continuing shortage of available space meant that during
2017, 16% down on the record-breaking 2016. 2017 we saw the take-up of new speculative and purpose-built
space account for 49% of all occupier activity.
• This ended the four year run of annual growth in the take-up
of logistics property, but, 2017 remained in excess of both • Occupiers continue to occupy space to maximum capacity and
the five year and ten year annual averages. activity is increasingly driven by letting activity of good quality or
new accommodation.
• Taken in isolation, 2017 was a good year for logistics,
with strong levels of pre-letting activity and healthy levels • It was only really the much reduced take-up of new speculatively
of take-up of secondhand space. Coming off 2016, which developed space which could be considered a negative in
was the most active year on record for demand, has to a 2017, however, this is perhaps more down to the limited
certain extent masked the underlying health of the sector. availability of such space.
• We continue to record healthy levels of demand for • To this end, pre-lets remain an important part of the market,
warehouse space and despite the annual reduction seen in particularly for larger buildings which are in short supply, but we
2017, the structural increase in volumes seen over the last also saw an increase in occupiers purchasing buildings for their
five years has continued. own occupation.
• Over the last two years we have also seen an increase in the
number of occupiers purchasing land on which tenants intend
Total annual occupier take-up, by property quality, 2005-2017
to develop their own warehouses. Key internet retailers such
Source: Gerald Eve
as Amazon and household name occupiers such as Lidl and
Million sq ft DHL have favoured this option to secure logistics space,
55
citing the supply shortage and the offer of more choice as
50
to location and building specification as the rationale.
45
40 • Such activity kept the volume of take-up of buildings over
35 500,000 sq ft in size at elevated levels, however, the
30 increased number of smaller lettings had a negative impact
25 on the average deal size, which fell to 131,700 sq ft in 2017
20 from 156,000 sq ft in 2016.
15
10 • In terms of building size, the reduction in space taken-up of
5 mid-sized buildings between 150,000 sq ft and 500,000 sq ft
0 was noticeable during 2017, reflective in many ways of the
2005
2006
2007
2008
2009
2010
2011
2012
2013
2014
2015
2016
2017
limited availability of such space which was on offer to occupiers.
Secondhand 5 year average
New speculative 10 year average
New purpose-built
Annual occupier take-up by unit size and annual average Total annual occupier take-up, by event, 2005-2017
unit size, 2005-2017 Source: Gerald Eve
Source: Gerald Eve
Million sq ft 000 sq ft Million sq ft
55 200 60
50 180
45 50
160
40
140
40
35
120
30
100 30
25
80
20
20
60
15
10 40
10
5 20
0 0 0
2005
2006
2007
2008
2009
2010
2011
2012
2013
2014
2015
2016
2017
2005
2006
2007
2008
2009
2010
2011
2012
2013
2014
2015
2016
2017
500,000+ sq ft 100-150,000 sq ft Letting Occupier freehold purchase
250-500,000 sq ft 50-100,000 sq ft Pre-let/pre-sale Development land purchase
150-250,000 sq ft Average unit size (sq ft) (RHS)
7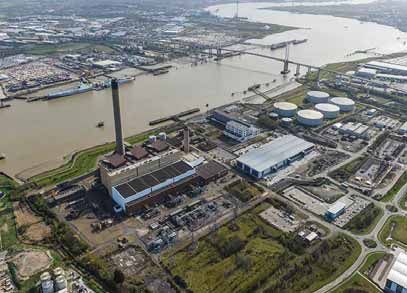
Prime Logistics 2018

OCCUPIER DEMAND
2017 take-up by occupier business sector
Source: Gerald Eve

        Services 5%

         Services 5%
                                                                                                                    17% Other Logistics
        Other retail 11%

                                                                                                                   22% Logistics
        Internet retail 5%
                                                                                                                      5% Parcel & Post

        Fashion retail 2%

                                                                                                                       10% Automotive
        Budget food 6%

         Retail & Wholesale 23%                                                                              34% Manufacturing

                                                                                                                              4% Food
         Other/unknown 16%

        Other/unknown 16%
                                                                                                               15% Other Manufacturing

                                                                                                                 3% Paper & Packaging

                                                                                                                    2% Pharmaceutical

•   At the smaller end of the spectrum, we recorded an increase          •   The continued rise of internet retailing (in the UK, internet
    in the volume and number of buildings taken-up in buildings              retail sales accounted for a peak 20% of all retail sales in
    between 50-100,000 sq ft during 2017. This was driven by                 November 2017) continues to feed through into demand for
    increased activity by manufacturers in this size category as well        warehouse space. However Amazon has been less acquisitive
    as an uptick in the amount of space taken-up by parcel and post          in 2017 compared to 2016, which has driven down the direct
    logistics companies within easy reach of major conurbations.             importance of the sector to 5% from 21% during 2016.

•   We have recorded a noticeable shift in the nature of occupier        •   Whilst we have seen this drop in dedicated internet retailers
    take-up during 2017. Where 2016 was driven by activity of                taking space during 2017, we have seen companies supplying
    retailers & wholesalers, particularly internet retailers, 2017 was       and distributing goods on behalf of such retailers continue to
    more defined by an increase in take-up from manufacturers and             be active during the year. Parcel and post delivery companies
    budget food retailers.                                                   have been particularly busy.

•   The manufacturing sector accounted for 34% of all take-up            •   Whilst the nature of the occupier base has shifted during 2017,
    during 2017, up from 26% in 2016. This has been across all               it continued to be the established locations which saw the
    manufacturing sectors, including automotive, but we have                 most growth in take-up. The West Midlands and North West in
    picked up on some new industries driving totals during the year          particular continued to see elevated volumes of space taken-up.
    too. Companies in the medical or pharmaceutical sphere took
    space, as did paper and cardboard manufacturers and even             •   In terms of annual growth, the regions which saw the strongest
    house builders who need space to construct modular homes.                jump in activity during 2017 were Buckingham & Bedfordshire,
                                                                             the South Coast and Cambridgeshire. Decisions by occupiers
•   It was budget food retailers rather than dedicated internet              such as H&M to pre-let space in Milton Keynes and the
    retailers, particularly Lidl and Aldi, who have been acquisitive         recording of several development purchases in Cambridgeshire
    during the year, by and large following the theme of purchasing          by the likes of Lidl and Smart Garden Products has raised the
    land to develop facilities. Not to be outdone, it was Amazon             profile of these regions.
    who committed to the largest warehouse of the year, with
    its purchase of 33.5 acres at Central Park in Avonmouth to           •   Given the supply shortage in many established markets, both of
    develop a 1.35 million sq ft warehouse.                                  up-and-built product and land, occupiers have instead looked
                                                                             to these locations to secure appropriate land for development.

8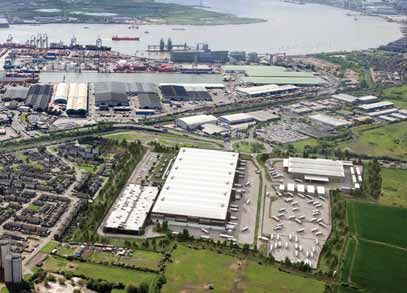
Spring 2018

Total occupier take-up by region 2017
Source: Gerald Eve

                                                                                           Over 3 million sq ft
                                        SCOTTISH
                                        CENTRAL BELT                                       2-3 million sq ft
                                                                                           1-2 million sq ft
                                                                                           Below 1 million sq ft

                                                             NORTH EAST

                                                                  WEST     HUMBERSIDE
                                                              YORKSHIRE

                                                       GREATER
                                                       MANCHESTER      SOUTH
                                                                       YORKSHIRE
                                              MERSEYSIDE
                                              & CHESHIRE
                                                                       NORTHERN EAST
                                                  NORTHERN             MIDLANDS
                                                  WEST MIDLANDS

                                                           SOUTHERN
                                                           WEST MIDLANDS               CAMBRIDGESHIRE
                                                                            SOUTHERN
                                                                            EAST MIDLANDS
                                                                                                      SUFFOLK
                                                 GLOUCESTERSHIRE                 BUCKINGHAMSHIRE      & ESSEX
                                                 & WORCESTERSHIRE                & BEDFORDSHIRE
                                                                                      LONDON
                                                                                      NORTH
                                         SOUTH                              OXFORDSHIRE       LONDON
                                         WALES                  BERKSHIRE       LONDON          EAST
                                                                & WILTSHIRE       WEST
                                                       AVON &                           LONDON
                                                       SOMERSET                         SOUTH        KENT
                                                                             SURREY &
                                                                SOUTH        HAMPSHIRE
                                                                COAST

                                                                                                                            9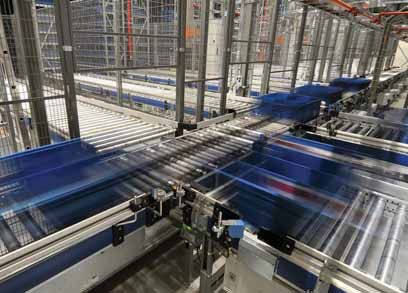
Prime Logistics 2018
SUPPLY
Availability Annual volumes of availability by building quality, 2007-2017
• By and large, the supply of available logistics floorspace has Source: Gerald Eve
been on a downward trajectory since 2009. Following the influx Million sq ft %
of speculatively developed space recorded in 2006-2009 we 120 18
have since reported on a steady erosion of such space and 16
100
have chalked-up commensurate falls in the annual availability 14
rate. This culminated in a record low availability rate of 5.9%
80 12
in Q1 2017.
10
60
• Throughout 2017, we have seen the addition of speculatively 8
developed buildings to our supply figures and the volume of 40 6
available space on the market has started to creep up. 2017
4
seems to have marked the natural low point of availability in 20
the current cycle. 2
0 0
• This is especially so given that the amount of speculatively
2007
2008
2009
2010
2011
2012
2013
2014
2015
2016
2017
developed space in the pipeline due to complete in 2018,
which, whilst it is expected to generate occupier interest, is New or modern
still likely to enter our availability figures throughout 2018. Secondhand
Availability rate
• The availability rate at the end of 2017 was 6.3%, which remains
low in the context of the last five years, but throughout 2017 was Availability rates by building quality, 2009-2017
increasingly driven by the return of secondhand stock. Source: Gerald Eve
• This increase in available secondhand stock has had a %
26
knock-on effect on the secondahnd availability rate, which 24
increased to over 8% at the end of 2017. 22
20
• To date, we have not seen the wholesale return of secondhand
18
stock to the market that could be expected in times of strong 16
pre-letting activity. Occupiers are occupying their existing 14
facilities to maximum capacity and the majority of demand has 10
been as a result of expansionary activity. Warehouse inventory 8
levels are high and efficiency of use of logistics buildings is a 4
crucial part of supply chain management. 6
2
• Regionally, it was those markets which had seen the 0
2009
2010
2011
2012
2013
2014
2015
2016
2017
combination of an increase in speculative activity and the return
of secondhand space which ended the year with the highest
Secondhand
availability rates, with regions in the North West seeing the
All qualities
effects of this the most. New or modern
• At the other end of the spectrum, key regions in the south
Indexed supply and demand, Q2 2007-Q4 2017
east, such as Kent, Suffolk & Essex and Surrey & Hampshire
Source: Gerald Eve
are particularly restricted in terms of supply, but do experience
below average levels of take-up. Index Q2 2007 = 100
160
• We have however seen a supply response from developers 150
and there are several speculative schemes under construction 140
which in turn is likely to affect the future profile of availability. 130
However, on a rolling basis, demand is still significantly 120
outpacing supply, despite showing some fall off from the highs 110
of 2016. This supply/demand gap is evident across most
100
regions and is conducive to further rental growth across
90
most markets.
80
70
60
Q2 2007
Q4 2007
Q2 2008
Q4 2008
Q2 2009
Q4 2009
Q2 2010
Q4 2010
Q2 2011
Q4 2011
Q2 2012
Q4 2012
Q2 2013
Q4 2013
Q2 2014
Q4 2014
Q2 2015
Q4 2015
Q2 2016
Q4 2016
Q2 2017
Q4 2017
Availability
Rolling four quarter total take-up
10Availability rates by Gerald Eve region, Q4 2017
Source: Gerald Eve
Greater Manchester
South Coast
London West
Merseyside & Cheshire
South Wales
Scottish Central Belt
Avon & Somerset
Southern East Midlands
Cambridgeshire
Buckinghamshire & Bedfordshire
London East
Northern West Midlands
South Yorkshire
London South
Southern West Midlands
Oxfordshire
Surrey & Hampshire
Northern East Midlands
Suffolk & Essex
West Yorkshire
North East
London North
Berkshire & Wiltshire
Humberside
Gloucestershire & Worcestershire
Kent
0 2 4 6 8 10 12
%DEVELOPMENT
• 2017 marked the fourth consecutive year of growth in the
volume of annual development completions. This was driven
by purpose-built developments, as over 20 million sq ft of such
completed in 2017, the most such space reaching practical
completion in one year since our records began in 2006.
• This record-breaking total was the result of the intrinsic
shortage of supply forcing occupiers to design-and-build
Stoford Developments completed on The Range’s 1.2 million sq ft RDC
at Central Park in Avonmouth in 2017 premises for themselves and is the end result of the significant
levels of pre-letting activity recorded in 2016.
Roxhill completed on Amazon’s 2.2 m sq ft multi-storey facility at London
Distribution Park at the end of 2017 • The volume of speculative development completions however,
fell by 45% in 2017, which is surprising given the supply/
demand dynamics and the increased levels of occupier demand
for modern accommodation.
• We saw a total of 46 buildings complete development
speculatively during 2017, totalling 5.7 million sq ft, the
average unit size of which was 127,000 sq ft. This is under a
third of the volume of space completing speculatively during
2007 and is a much smaller average unit size of speculative
developments in 2007 which was 166,000 sq ft.
• Developers have proved themselves willing to develop
speculatively but have been very measured and targeted in
their supply response. The larger developers have thoroughly
assessed local and regional demand profiles before commencing
any speculative development and despite the supply/demand
imbalance, have not flooded the market with speculative stock.
• By size of unit completing development, proportionately it
was purpose-built units over 500,000 sq ft in size which
drove overall completions. This is on the back of two large
developments for Amazon completing in Tilbury and Doncaster
and the Range completing on their RDC in Bristol, all of which
were over 1 million sq ft in size.
• The measured response of developers continued through
2017 and whilst we recorded a similar level of purpose-built
development starts, we also recorded a 40% reduction in the
amount of space getting underway speculatively. Again, this
is surprising, but such a judicious approach of developers has
Development completions, by type, 2007-2017
Source: Gerald Eve
Million sq ft
35
Stoford Developments completed the speculative development of Liberty 163,
30
at Worcester Six during 2017
Tritax Big Box REIT purchased 124 acres of development land at Littlebrook 25
in Dartford in 2017 and with partner Bericote Properties plans to deliver
20
facilities on a pre-let basis
15
10
5
0
2007
2008
2009
2010
2011
2012
2013
2014
2015
2016
2017
Purpose-built
SpeculativeSpring 2018
also helped to keep the market dynamics conducive to further Development starts, by type, 2006-2017
rental growth. Current levels of development activity suggest Source: Gerald Eve
that there is no prospect of oversupply and on an indexed
Million sq ft
rolling annual basis, speculative development activity is far 30
below the levels being developed at the end of 2007.
25
• The ten year period since 2007 has been a turbulent one for the
development market. We saw the overhang of speculative space 20
delivered early in the period remain on the market for several years
and developers have been reticent to repeat previous mistakes 15
in the current cycle. This goes some way to explaining why
purpose-builds are completing at more than double the rate they 10
were back in 2007, but speculative developers remain far below.
5
• There are also other concerns, such as the potential for a reduction
0
in occupier demand and labour supply post-Brexit and the
2006
2007
2008
2009
2010
2011
2012
2013
2014
2015
2016
2017
rising cost of construction which have weighed on developers’
minds. The overall cost of construction has risen year-on-year
New purpose-built
since 2009, and is forecast to rise at a similar rate over the next Speculative
five years to 2022. This will further pressure on the margins of
developers, especially when it is only really over the last few years
that we have seen prime rents grow at a similar rate. Indexed rolling four quarter development completions by type,
Q4 2007-Q4 2017
• Whilst we expect the volume of speculative development activity Source: Gerald Eve
to increase in 2018 as developers look to fill the gaps in supply
and well-capitalised new entrants to the market look to make a Index Q4 2007 = 100
300
statement, purpose-builds are likely to drive overall development
200
activity. Even accounting for the different rent and incentive
packages offered to occupiers of speculative and pre-let space, 100
which can make a difference to developers’ profits, the speed 0
with which modern logistics warehouses can be built, has meant
that aside from the most urgent of space requirements, a vast -100
majority can be satisfied through design-and-builds. -200
• This is likely to be more relevant in those markets which, -300
whilst availability may be low, the economics of speculative -400
development are not viable until rents increase. In these
-500
markets, such as Scotland and Wales, we will need to see
Q4 07
Q2 08
Q4 08
Q2 09
Q4 09
Q2 10
Q4 10
Q2 11
Q4 11
Q2 12
Q4 12
Q2 13
Q4 13
Q2 14
Q4 14
Q2 15
Q4 15
Q2 16
Q4 16
Q2 17
Q4 17
prime rents rise in order for such development to be viable on
a speculative basis as it is hard to make the economic case for
development work without prime rents growing. Speculative
Purpose-built
Development completions by unit size, 2007-2017 Annual indexed cost of construction, inflation and prime rents,
Source: Gerald Eve 2006-2022
Sources: Gerald Eve, BCIS, Oxford Economics
Milliion sq ft 000 sq ft Index 2006 = 100
35 300 160
30 150
250
140
25
200
130
20
150 120
15
110
100
10
100
5 50
90
0 0 80
2007
2008
2009
2010
2011
2012
2013
2014
2015
2016
2017
2006
2007
2008
2009
2010
2011
2012
2013
2014
2015
2016
2017
2018
2019
2020
2021
2022
500,000 sq ft 100-150,000 sq ft RPI
250-500,000 sq ft 50-100,000 sq ft BCIS all in tender price
150-250,000 sq ft Average unit size (RHS) Average UK prime headline rent
13Prime Logistics 2018
RENTS AND INCENTIVES
• The combination of a historically low level of availability and
above average levels of occupier demand has resulted in strong
levels of rental growth in the UK logistics market during 2017.
• We saw prime rents grow by an average of 7% during 2017,
the strongest annual growth in prime headline rents we have
recorded since our records began in 2006.
• Prime rents are now over 10% above where they were in
2006, having, on average, recovered all of the lost ground
of the recession by 2015.
• Annual growth of 7% is a meaningful level of growth for a
sector not known for its rental growth component and has been
driven by a step-change in rental profiles in certain markets.
• We recorded over 10% prime rental growth in several
regions during 2017. Those markets which have recorded
the strongest growth during 2017, such as London South,
Berkshire & Wiltshire and the South Coast, are all defined
by an environment of very restricted supply, strong levels of
occupier demand and the recent delivery of new space on
which these rents could be achieved.
14Spring 2018
• The markets which have seen strong levels of pre-lets and Indexed regional prime rental growth, Q1 2013-Q4 2017
take-up of speculative space, particularly in markets starved Source: Gerald Eve
of new accommodation, which often command a premium
Index Q1 2013 = 100
rent, have experienced the strongest increases in rents in 130
2017, although the supply/demand imbalance prevalent in
most markets has kept a general upward pressure on rents. 125
• Regionally, we have recorded the strongest growth in prime 120
rents in London, which on average grew by 12% during 2017.
The rental growth profile in such markets was much more driven 115
by market forces of supply and demand than other regions,
especially so given occupiers desire to take facilities with close 110
proximity to London.
105
• In regions which have not seen such positive movements
100
in rents, such as Scotland and Wales, rental profiles are
Q1 13
Q2 13
Q3 13
Q4 13
Q1 14
Q2 14
Q3 14
Q4 14
Q1 15
Q2 15
Q3 15
Q4 15
Q1 16
Q2 16
Q3 16
Q4 16
Q1 17
Q2 17
Q3 17
Q4 17
much more dependent on the economic viability of
development. Rising construction costs and the pressure
on developers’ margins has meant that we are unlikely to London West of England & Wales
see growth driven to such a degree by market forces, more West Midlands South East England
Northern England Scotland
by an occupier agreeing to pay the required rent for East Midlands
a development in that region.
Indexed average UK prime headline rent, 2006-2017
• Additionally, as prime headline rents have grown, we have seen
Source: Gerald Eve
tenant incentives fall to their lowest level on record. By the end
of 2017, the average level of incentives offered on a ten year Index Q4 2006 = 100
120
lease fell marginally to an average across the country of 7-10
months’ rent free period. 115
• This is a significant reduction on the average 14-20 months’ 110
rent free incentive offered to tenants five years ago at the end 105
of 2012 and in our opinion represents the low point for
100
occupier inducements.
95
• There are very few locations which currently offer occupiers a
90
choice of new accommodation, although based on the number
and volume of units under construction speculatively at the end 85
of 2017, we do expect an increase in the delivery of speculative 80
2006
2007
2008
2009
2010
2011
2012
2013
2014
2015
2016
2017
space in 2018. Given the locations, sizes and timing of delivery
of these units, this addition of new space is likely to drive rents
in several supply-starved markets, but, in others, such as in the
North West, it could offer an increased choice to occupiers.
Strongest growing regions during 2017
Region Centres Growth in regional prime rents 2017
London South Crawley & Croydon 49%
Berkshire & Wiltshire Reading & Swindon 15%
South Coast Southampton & Portsmouth 13%
Avon & Somerset Bristol 12%
Surrey & Hampshire Basingstoke 10%
15Prime Logistics 2018
GERALD EVE MARKET SCORES
Gerald Eve regional property market scores, prime rents and prime yields
Source: Gerald Eve
1 2
Southern West Midlands Greater Manchester
£5.95 - £6.75 £6.25
Birmingham & Coventry Manchester
4.75% 4.70%
6 7
London West Northern West Midlands
£12.50 - £15.00 £5.00 - £5.75
Heathrow, Park Royal & Slough Stoke/Stafford/Burton/Telford
4.00% 5.25%
11
Merseyside & Cheshire
£5.75 - £6.25
Warrington & Liverpool
21
4.75%
15
22
Oxfordshire
£5.85 - £8.10
Banbury & Wycombe
5.60%
17
25
11
2
10
7
5
1
14
3
9 26
24 15
8
18 12 4
6
20 23
13 19
3
16Spring 2018
3 4 5
Southern East Midlands London East Northern East Midlands Region
£5.00 - £6.50 £7.50 - £9.00 £5.60 - £6.00 Rent (£ per sq ft)
Northampton Basildon & West Thurrock Leicester, Nottingham & Derby Centres covered
4.75% 5.00% 5.00% Yield
8 9 10
London North Bucks & Beds South Yorkshire Region
£7.25 - £10.50 £7.15 £5.75 Rent (£ per sq ft)
Enfield, Hemel Hempstead, Luton Milton Keynes Sheffield, Doncaster Centres covered
4.25% 4.7% 5.15% Yield
12 13 14
Berkshire & Wiltshire London South Cambridgeshire Region
£6.25 - £11.25 £13.50 - £14.00 £4.75 Rent (£ per sq ft)
Reading & Swindon Crawley & Croydon Peterborough Centres covered
4.50% 4.25% 5.25% Yield
16 17 18
South Coast West Yorkshire South Wales Region
£7.00 - £9.00 £5.75 £5.25 Rent (£ per sq ft)
Southampton & Portsmouth Leeds, Bradford & Wakefield Cardiff & Newport Centres covered
5.50% 5.00% 6.00% Yield
19 20 21
Kent Avon & Somerset Scottish Central Belt Region
£5.95 - £7.25 £7.25 £6.00 Rent (£ per sq ft)
Ashford & Maidstone Bristol Glasgow & Edinburgh Centres covered
5.65% 4.75% 5.75% Yield
22 23 24
North East Surrey & Hampshire Gloucestershire & Worcestershire Region
£4.40 - £4.65 £8.25 £5.40 Rent (£ per sq ft)
Newcastle & Sunderland Basingstoke Gloucester Centres covered
5.50% 5.25% 5.75% Yield
25 26
Humberside Suffolk & Essex Region
£4.55 £4.25 - £5.50 Rent (£ per sq ft)
Hull Colchester & Ipswich Centres covered
6.15% 6.00% Yield
17Prime Logistics 2018 Tritax Big Box REIT purchased this Royal Mail facility in Daventry for £48.82 million, reflecting a net initial yield of 5.0% in October 2017.
Spring 2018

INVESTMENT
•        2017 was an exceptional year for industrial property investment,                                     2017 investment volumes by property type and Gerald Eve region
         both in terms of volumes traded and overall performance.                                             Sources: Gerald Eve, Property Data
         In an environment of low interest rates, political uncertainty
                                                                                                              £ million
         and devalued sterling, commercial property investors sought
         out stable, income-producing assets, and increasingly, as
         2017 progressed, with added asset management potential.                                              London West

•        The strong income component of industrial property’s total                                           London North
         return profile, allied to the positive occupational ‘story’, meant
         that there was a weight of domestic and overseas capital                                             Southern West Midlands
         targeted at the sector.
                                                                                                              Northern West Midlands
•        The ongoing occupational supply and demand imbalance and
         the resultant positive outlook for rental growth, together with                                      Greater Manchester
         the structural shift in the retail market to buying goods online,
         has significantly raised the profile of the industrial sector within                                   Scottish Central Belt
         the broader investment community.
                                                                                                              London East
•        We recorded the largest volume of investment into industrial
         property on record, with strong levels of investor interest in                                       Southern East Midlands
         portfolios, standard industrial and distribution warehouses.
         Even excluding portfolios from the total volume transacted,                                              Avon & Somerset
         more direct standard industrial and distribution warehouses
         were traded during 2017 than any other year on our records                                           London South

         and volumes grew by 55% in 2017.
                                                                                                              Surrey & Hampshire
•        Such levels of investor interest forced further prime yield
         compression and on average, across the country, we                                                   Merseyside & Cheshire

         recorded a 33 bps reduction in prime yields throughout 2017.
                                                                                                              West Yorkshire
         Certain locations, such as Heathrow and Park Royal, achieved
         prime yields of 4% on rack-rented, 15 year income profiles at
                                                                                                              Cambridgeshire
         the end of 2017 and there have been deals agreed during the
         year at yields lower than this.
                                                                                                              South Yorkshire

•        Prime locations, particularly in London and the West Midlands,
                                                                                                              Northern East Midlands
         were the focus of investor attention and in terms of volumes,
         we saw a significant amount traded in West and North London
                                                                                                              Buckinghamshire & Bedfordshire
         and both the North and South Midlands.
                                                                                                              Berkshire & Wiltshire

                                                                                                              Suffolk & Essex
Annual industrial investment volumes including portfolios
and Heathrow prime yield, 2005-2017                                                                           Gloucestershire & Worcestershire
Sources: Gerald Eve, Property Data
          £ billion                                                                                   %       Oxfordshire
    12                                                                                                    8

                                                                                                          7   South Wales
    10
                                                                                                          6
                                                                                                              Kent
     8
                                                                                                          5
                                                                                                              Humberside
     6                                                                                                    4

                                                                                                          3   South Coast
     4
                                                                                                          2
                                                                                                              North East
     2
                                                                                                          1

     0                                                                                                    0
                                                                                                              0            100          200      300   400   500   600      700
            2005

                      2006

                             2007

                                    2008

                                           2009

                                                  2010

                                                         2011

                                                                2012

                                                                       2013

                                                                              2014

                                                                                     2015

                                                                                            2016

                                                                                                   2017

               Distributiuon warehouse
               Industrial                                                                                           Standard industrial
               Portfolio                                                                                            Distribution warehouse
               Heathrow prime yield (RHS)

                                                                                                                                                                            19
Prime Logistics 2018
INVESTMENT
Distribution warehouse net investment by investor type, Annual distribution warehouse total return and components,
2005-2017 2005-2017
Sources: Gerald Eve, Property Data Sources: Gerald Eve, MSCI
£ billion % per year
3.0 30
2.0 20
1.0 10
0 0
-1.0 -10
-2.0 -20
-3.0 -30
2005
2006
2007
2008
2009
2010
2011
2012
2013
2014
2015
2016
2017
2005
2006
2007
2008
2009
2010
2011
2012
2013
2014
2015
2016
2017
Private investors Private property company Income return Market rental value growth
Overseas investors Occupiers Equivalent yield impact Total return
Quoted property company Others
UK institutions
• An assessment of net investment by investor type for • In terms of performance, 2017 showed a strong rebound
distribution warehouses during 2017 highlighted that on in total returns according to MSCI. According to the latest
balance, it was private property companies who were sellers quarterly figures, total returns for distribution warehouses
and a combination of REITS/quoted property companies and jumped from 6.1% in 2016, to 17% in 2017. Positive yield
overseas investors who were net purchasers. We saw a number impact and rental growth added to robust levels of income
of large platform deals involving either Asian or American capital return and culminated in industrial property delivering the
during the year and the likes of TRITAX Big Box REIT and best set of results of all asset classes in 2017.
LondonMetric continued to be acquisitive.
• Such has been the level of investor interest and competitive
• We also saw several high value corporate acquisitions bidding on stock that 2017 also produced some out of the
during 2017 – including Blackstone’s sale of Logicor to ordinary findings. For the first time, UK distribution warehouse
China’s Investment Corporation for £10.5 billion and Asia’s equivalent yields fell below that being achieved by UK standard
largest logistics investment group buying Brookfield’s IDI offices. Such is the pull of the sector to investors and the
Gazeley for £2.1 billion. perceived lack of investible stock – especially when several of the
more active developers are developing to hold, rather than to sell.
Tritax Big Box REIT purchased this Morrisons warehouse at Birch Coppice
Business Park for £92.33 million, reflecting a net initial yield of 5.25% in June 2017.
20Spring 2018
Annual equivalent yields by selected asset class, 2001-2017 Distribution warehouse equivalent yield, 10 year Government
Sources: Gerald Eve, MSCI bond and spread, 2005-2022
Sources: Gerald Eve, Oxford Economics, MSCI
% %
9.0 10
8.5 9
8.0 8
7.5 7
7.0 6
6.5 5
6.0 4
5.5 3
5.0 2
4.5 1
4.0 0
2001
2002
2003
2004
2005
2006
2007
2008
2009
2010
2011
2012
2013
2014
2015
2016
2017
2005
2006
2007
2008
2009
2010
2011
2012
2013
2014
2015
2016
2017
2018
2019
2020
2021
2022
Retail warehouse Spread
Standard office 10 year Government bonds
Distribution warehouse Distribution warehouse equivalent yields
• Also unusually, and perhaps reflective of the changing nature of • We expect that the sector will continue to be a draw to
consumers’ shopping patterns, we saw distribution warehouse investors through 2018, although it is hard to forecast much
yields fall below retail warehouse yields. Whilst internet retail in the way of further yield compression, given the current high
has been of significant benefit to the logistics market, fewer level of pricing (and the commensurate exit yields being priced
shoppers seem to be visiting retail warehouse destinations into transactions) and the uncertainty in terms of the outlook
and this is starting to filter through into the investment for interest and gilt rates.
performance of these buildings.
• Even if equivalent yields remain flat over the next five years, the
• Given the significant levels of yield compression seen in the forecast for 10-year Government bonds is for steady increases,
market during 2017, for many investors industrial is considered which could reduce the spread between the two and limit the
too keenly priced. Whilst the occupational conditions are attractiveness of property as an asset class.
conducive to further rental growth, it is difficult to predict the
path of future investment performance, and particularly what • Investors are going to have to continue to formulate innovative
will happen to capital values. strategies in this environment.
The strong income component of industrial property’s
total return profile, allied to the positive occupational
‘story’, has meant that there is a weight of domestic
and overseas capital targeted at the sector.
21Prime Logistics 2018
TECHNOLOGY AND INNOVATION IN LOGISTICS
Over the course of the last few years, we have seen significant advancements in both the use
of technology within the warehouse and the specification of buildings to try and accommodate
this changing use. From the more fanciful ideas, such as using drones resupplied by airships
to deliver goods to consumers, through to actual changes we are seeing in the market, such
as multi-storey logistics facilities, the way in which the market is adapting is never far from the
headlines. Indeed, technology and the impact of the increased use of automation in warehouses
has the potential to affect the labour market, the physical location of future logistics buildings
and the specification of building design. The increased capital expenditure needed on these
more technologically-advanced buildings could have knock-on effects on rates of obsolescence,
lease lengths and ultimately values.
In this section we look at some of the more prevalent uses of Electronic data interchange technology allows for the sharing of
technology in warehouses, investigate how some occupiers are documents with a shared format between two computer systems.
adapting existing buildings to suit modern occupation and examine This helps with purchase orders, shipping orders and inventory
some of the concepts which may have significant implications for advice. This system has proved to be more efficient, and helps
the future of logistics property. with visibility and collaboration between parties. Voice-tasking
technology is a hands-free technology that uses spoken commands
Autonomous mobile robots for picking, putting, receiving, replenishing and warehouse shipping
One way to speed up the picking and packing process is to functions is also being increasingly adopted.
reduce the number of miles walked by staff as they look for items
on shelves in the warehouse. Amazon purchased Kiva Systems Tracking software
in 2012 and rebranded it as Amazon Robotics. This is perhaps Development in consignment tracking technology now gives
the most widely-adopted use of technology in warehouses and businesses access to greater volumes of information at much
significantly helps with order fulfilment and productivity. Online deeper levels than they used to – be that distribution information
grocery retailer Ocado also uses autonomous mobile robots and or stock data. With state-of-art tracking systems, not only are
has created a system called the Ocado Smart Platform where organisations able to use this data for their own benefit but it’s
robots bring the shelf stacks to human workers, who pick out the becoming increasingly popular to allow their own customers to
right products and package them up to be sent out. These robots access certain information. With increased international trade, many
travel many miles a day at speeds faster than a human can walk. supply chains are growing and now feature more than just one or two
organisations. With tracking information available to all those involved,
There are several different strands of robotic technology communication channels open up and data can flow seamlessly
being adopted in warehouses besides autonomous mobile between parties. This means less time is wasted chasing information
robots, including control software, language perception, power because it’s all there, logged in the tracking system, allowing planning
management, computer vision, depth sensing, machine learning, to be carried out further in advance and more accurately.
object recognition and semantic understanding of commands.
22Spring 2018
Machine-learning software and predictive ordering Driverless and electric vehicles
Described as being more like a chessboard or a hive than a conveyor Another technology that many predict will affect the location and
belt, Ocado’s new software being used at its warehouse in Andover, design of warehousing facilities is the autonomous vehicle, which,
is a three dimensional cube where robots roam around on top and although some way from being fully commercialised, is the subject
under every square is a stack of ‘totes’ containing groceries which of significant investment both from business and government.
can be picked up and moved. The robots bring the totes to the
side of the grid, which is a picking station for the groceries to be In August 2017, driverless lorries on motorways came a step closer
placed into a customer order. These robots are communicated with to reality after the government announced £8.1m in funding for trials
regularly and have software which includes machine learning that of ‘platooning’, whereby a convoy of lorries accelerates, brakes and
choreographs the most efficient route for the robots to take and the steers in sync through the use of wireless technology. The trials will
best place to place the totes to optimise storage. involve up to three heavy-goods vehicles travelling in convoy with
acceleration and braking controlled by the lead vehicle. All lorries in
Ocado Technology aims to harness the power of technology across the platoon will always have a driver ready to take control at any time.
the whole supply chain. New applications in development include a
robot engineer that diagnoses problems with machinery and provides Whilst there are obvious safety concerns and the concept is still in its
assembly line engineers with the tools to fix them and a robot hand- testing phase, there are benefits to be had – including reduced fuel
designed to pick and pack groceries without damaging them. consumption and emissions as well as reduced traffic congestion.
As retailers consumer data becomes more accurate and more Nearly all the major car manufacturers are also working on the future
timely, the use of predictive ordering to calculate future inventory development of the electric car. Electric vehicles will be instrumental in
patterens is proving a useful tool for leading retailers. Predictive eliminating fuel cost and streamlining the supply chain. Electric vehicles
ordering is the ability to compile, suggest and execute purchase are growing increasingly more sophisticated, continually increasing
orders with a software application. The software uses data and the maximum range on a full charge, torque, and horsepower. There
trends based on previous sales history, consumption patterns and are two main types of electric vehicles that are vying for market
other inputs to make recommendations on product mix, quantities, dominance: traditional electrical vehicles, such as Tesla’s line of
pricing, delivery dates or other attributes of an order. The promise vehicles, and hydrogen-powered electric vehicles, backed by major
of predictive ordering is that it can complement human decision- vehicle manufacturers such as Honda, Hyundai, and General Motors.
making or even replace it entirely, allowing for greater automation
and more lean business processes. We expect that before driverless trucks are commonplace, we will
likely see the rise of electric trucks, which may cut fuel cost in half,
however, like the advances we are seeing in the automation within the
warehouse, this will put increased pressure on the power capacity
of buildings. Electric car charging points are now fitted as standard
on new build properties and the power supply required on new
builds can be as much as three times that required by a standard
building 10 years ago. This in turn affects the provision of significantly
enhanced power supplies to new build logistics facilities.
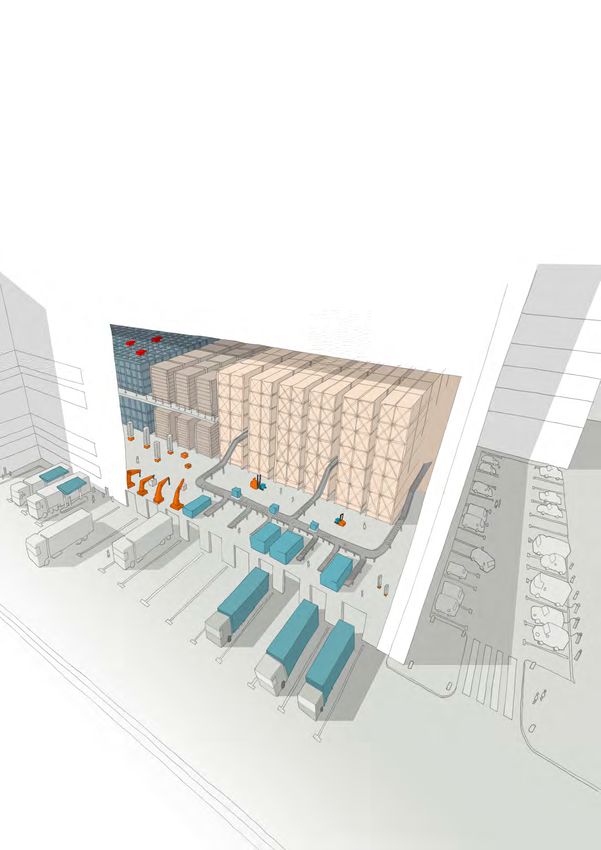
Mixed–use – industrial and residential
Industrial land, particularly in and around London is under
increasing pressure from other use classes, not least residential.
The sector needs to adapt to be able to maximise efficiency and
be able to keep up with increased occupier demand for logistics
space close to urban areas. This has brought the concept of
combining industrial uses with residential. Effective planning plays
a large part in the success of such schemes, but such innovative
design ideas are needed to balance the competing pressures of
delivering increased amount of housing and protecting traditional
employment land. Whilst this concept is perhaps more relevant
for smaller industrial buildings rather than large logistics facilities,
we have seen the development of such a scheme in Kings
Cross in London. Given the rates of population growth and the
3D printing / additive manufacturing commensurate increase in the need for logistics space that this
The concept of 3D printing has the potential to completely disrupt the growth brings with it, and this is a design idea that could become
traditional manufacturing sector. It might further reduce the demand more widely adopted in major urban areas.
for storage space given the potential to print stock on site and over
the longer term it could result in an increase in the distribution of raw
materials but a reduction in the number of deliveries to consumers.
This in turn could mean that the role and form of logistics companies
will have to continue to evolve and adapt to changing demand.
23Prime Logistics 2018
Potential impact on property
Over the long term, if we see more widespread use of automation
in warehouses, this has the potential to affect every facet of
warehouse use and design, from geographical location of buildings
through to the necessary labour supply to, and specification of,
those buildings. The adoption of driverless and electric lorries for
instance, could mean that warehouses no longer need to be in
such close proximity to large labour markets and could instead
be housed in locations where land and labour are cheaper.
This is unlikely to be too far out from the traditional logistics locations
however, given the motorway network and current infrastructure.
We do not think however that the increased use of automation will
lead to a mass reduction in the amount of labour needed to staff
warehouses. Instead, the requisite skills needed by staff and the
roles that they perform could change, but in our view this is unlikely
to lead to fewer staff being employed. It is perhaps more likely that
increased efficiency in warehouses will need a greater number of
staff to monitor activities and ultimately process and approve larger
numbers of orders. Modern warehouses, either multi-storey, or with
intended high levels of automation are actually being planned with
Multi-storey buildings an increased number of staff parking space than more traditional
Multi-storey facilities are commonplace in other countries such as warehouses, especially as more occupiers adopt round-the-clock
Japan. With the increased use of technology in UK warehouses, processing of orders.
we are seeing multi-storey warehouses – with up to 20m eaves
– and structural mezzanine structures that can accommodate In general terms, over the longer term, we expect to see further
increased use of automation. Occupiers to date have tended to intensification of use of warehouses driven by the profound changes
separate different uses to different floors, with more automation on in the nature of consumer shopping behaviour. We could see multi-
the upper floors, and more traditional warehouse operations on the storey buildings, an increase in shared user consolidation centres,
lower floors. Such structures need increased levels of floor loading rising demand for sites with multi-modal capability and even
capacity to accommodate the additional weight, and we are seeing underground warehouses become a reality. The way in which we
the increased specification of floor loading and the provision of purchase goods has changed and warehouses will need to adapt
power becoming important issues to developers – particularly to be able to accommodate the changes such a shift is having on
when trying to future-proof speculative schemes. occupiers supply chains and working practices.
Technology and the impact of the increased use of
automation in warehouses has the potential to affect the
labour market, the physical location of future logistics
buildings and the specification of building design.
24Spring 2018
OUTLOOK
• Taken in isolation, 2017 was a good year for take-up and Annual take-up and GDP growth, 2007-2022
ended up being in between the 5 and 10 year annual averages. Sources: Gerald Eve, Oxford Economics
Coming off the record-breaking 2016 has to some extent taken
the shine off what was otherwise a healthy year for demand. Million sq ft %
60 10
• Despite a reduction in demand from internet retailers, increased
Forecast
UK exits the EU
8
levels of activity from manufacturers and budget food retailers 50
6
has kept occupational activity elevated.
4
40
• Given the high levels of space under offer at the end of 2017, 2
and the general elevated levels of requirements in the market, 30 0
we expect that retailers will increase the amount of space -2
they occupy in 2018. Amazon, quiet during 2017 by their own 20
-4
acquisitive standards, is again plotting more facilities throughout -6
10
the country which, if completed, could significantly bolster
-8
annual demand levels.
0 -10
2007
2008
2009
2010
2011
2012
2013
2014
2015
2016
2017
2018
2019
2020
2021
2022
• The companies most likely to purchase land for development
of their own facilities are those that currently look set to be the
Take-up
most acquisitive in 2018. Amazon, Lidl, Aldi and DHL all have GDP (RHS)
a history of development purchases and could be key drivers
to both take-up and te volume of purpose-built development UK average prime headline rental growth and forecast,
activity in 2018. 2013-2022
• Over a five year forecast horizon, there are structural and Source: Gerald Eve
cyclical forces at work which could have an impact on levels %, per year
8
of demand – not least the potential impact of Brexit in 2019.
Forecast
Overall, the structural shift of consumer shopping patterns to 7
the internet and the critical importance of an effective supply 6
chain to retailers is likely to keep demand elevated through
5
2018, even taking into account downside risks within the
forecast horizon. 4
• Whilst we are likely to see supply increase throughout 2018 3
through a combination of the addition of new speculative space 2
and the return of secondhand space, we expect demand will
1
remain robust enough to continue to drive rents.
0
2013
2014
2015
2016
2017
2018
2019
2020
2021
2022
• Our baseline forecast for prime rents over the next five years
is for a UK average 2.7% growth per year, with the strongest
growth in rents, of 3.5%, expected in 2018. There are UK prime headline rental growth
competing pressures at work over such a long forecast period,
not least the cost pressures on occupiers to be able to afford
further increases in rents. Distribution warehouse forecast total return and components,
2012-2022
• However, even with these pressures, we forecast that all regions Sources: Gerald Eve, MSCI
will experience positive rental growth over the next five years. %, per year
In the current broader commercial property environment and 25
Forecast
the likely economic uncertainty the UK is going to experience
20
over the next few years, this in itself is a positive for the sector
and one which is not replicated in other commercial property 15
asset classes.
10
• Whilst in prime markets the forces of supply and demand
5
could push rents on substantially, especially in those locations
where there is an acute shortage of supply and land for future 0
development such as London West and Cambridgeshire.
-5
There are other markets, where the costs pressures on
occupiers are more acutely felt and whilst rents need to -10
2012
2013
2014
2015
2016
2017
2018
2019
2020
2021
2022
increase to make developments viable, occupiers may not be
in a position to pay them. In such markets, this could limit both
development activity and growth in prime rents.
Yield impact on capital values Rental growth
Income return Total return
25Prime Logistics 2018
OUTLOOK
Indexed distribution warehouse capital growth, 2004-2022 • Markets which have already seen step-changes in rents in
Source: Gerald Eve the current cycle, such as London South, are unlikely to grow
at the same high levels over the next five years, even though
Index 2004 = 100
upward pressure on rents remains. Those markets which have
200 not seen this significant growth can expect rents to move on
Forecast
180 in excess of the UK average.
160
Yield Impact • Those regions where there is little in the way of speculative
140
development and below average levels of demand are likely
120
Rental Growth to record below average levels of growth.
100
80 • We expect the total return profile to return to more ‘normal’
60 levels over the next five years. The outlook for capital values is
40
likely to be driven more by the impact of positive rental growth
rather than further positive yield impact. With yields as low as
20
they are, whilst it is feasible the current level of investor activity
0
could continue, it is unlikely that movements in yields are going
2004
2005
2006
2007
2008
2009
2010
2011
2012
2013
2014
2015
2016
2017
2018
2019
2020
2021
2022
to have the same impact on values as they did in 2017.
Indexed distribution warehouse capital growth
• The reliable income component of warehouse investment
performance will hold it in good stead as we go through times
Annual development completions, by type, 2007-2018, of potentially significant political and economic uncertainty over
(based on space under construction at end 2017) the next few years. Whilst we expect the health of the occupier
Source: Gerald Eve market to continue, there are competing pressures on the ability
of investors to pay the yields currently being achieved.
%
100
• Warehouses are an attractive investment proposition, but over
Forecast
90
a five year forecast horizon, there are other, wider, issues at play,
80 such as the prospects of rising bond yields and interest rates
70 which could negatively affect the impact of yield movements on
60 capital values.
50
• An unusual feature of the market during 2017 has been the
40
relatively limited amount of speculative development activity.
30
As a proportion of all development completions in 2017, 23%
20
completed development speculatively. Given the supply and
10 demand imbalance in the market, it is feasible to expect this
0 proportion to be higher, however, the judicious approaches of
2007
2008
2009
2010
2011
2012
2013
2014
2015
2016
2017
2018
developers has and will continue to help maintain the market
balance, which is so attractive to investors.
Purpose-built
Speculative
• Based on the amount of space under construction at the end
of 2017 and due to complete in 2018, we expect, proportionately,
that speculative developments will increase in importance to overall
developments. We are seeing developers move slightly up the
risk curve in terms of the sizes and locations of developments,
and speculative space is currently on target to account for an
increased 39% of all completions in 2018.
• This will feed the market with new accommodation, however, we
think it is important that purpose-built developments continue to
drive overall development activity and developers remain targeted
and measured. This will help regulate the market equilibrium
and justify our positive outlook for prime rents.
26You can also read