FOR A CHANGING WORLD - PROPERTY DEVELOPMENT TRANSACTION CONSULTING VALUATION PROPERTY MANAGEMENT INVESTMENT MANAGEMENT RESEARCH - BNP Paribas Real ...
←
→
Page content transcription
If your browser does not render page correctly, please read the page content below

REAL ESTATE
FOR A CHANGING WORLD

             2019 EDITION

                                 P R O P E RT Y D E V E LO P M E N
                                                   TRANSACTIO
                                                     C O N S U LT I N
                                                       VA L U AT I O
                                 P R O P E RT Y M A N A G E M E N
                             I N V E ST M E NR TE SME A NR AC GH E M E N

                                  Real Real
                                       Estate
                                            Estate
                              for a changing
                            for a changing world
                                       world
CONTENTS
                        20		   Edinburgh        37     Nicosia
  3 Editorial           21     Frankfurt        38     Oslo
  4 Offices in Europe   22     Geneva           39		   Central Paris
  6 Investment market   23     Glasgow          40     Prague
                        24     Hamburg          41     Riga
 8     Amsterdam        25		   Helsinki         42     Rome
 9     Athens           26     Lille            43     St Petersburg
10		   Barcelona        27     Lisbon           44     Stockholm
11		   Belgrade         28     Central London   45     Tallinn
12		   Berlin           29		   Luxembourg       46     Toulouse
13		   Birmingham       30		   Lyon             47     Vienna
14		   Bratislava       31     Madrid           48     Vilnius
15		   Brussels         32     Manchester       49		   Warsaw
16     Bucharest        33     Marseille
17		   Budapest         34     Milan            50     Key Figures: office
18     Copenhagen       35     Moscow           51     Glossary
19     Dublin           36     Munich           52     Contacts
EDITORIAL

    Towards levelling off
    in office property yields
    A global slowdown, but not a downturn,                 keep long-term interest rates at relatively low
    is taking place in most of the main global             levels, such as moderate growth, controlled
    economies.                                             inflation, abundant liquidity and risk aversion.
                                                           This is why the long-term bond yields of most
    The reasons for this slowdown have a strong            Eurozone member states, if they move, are only
    structural component among the usual cyclical          likely to rise very slightly by the end of 2019.
    factors. On the structural side, policy choice of      According to the consensus forecast, it is the
    a less open trade relationship with the US is          first time in over three years that expectations
    dampening export prospects everywhere.                 of an increase in long-term interest rates have
    To contain the slowdown here, the US bud-              been so low.
    get policy is also becoming expansionist, via a
    more generous tax regime and spending on in-           As far as European office markets are concerned,
    frastructure. This helped US economic growth           this macroeconomic scenario suggests prime
    reach 2.9% in 2018, underpinned by lower               yields should remain stable for most cities in
    taxes. US growth is set to decline in 2019, due        Europe in 2019. In a context of relatively stable
    to the slowdown in global trade and the tighte-        and low prime yields, several issues arise.
    ning of monetary and financial conditions.             Firstly, the competition between investors for
                                                           acquisitions could continue to exert pressure
    The Eurozone is also experiencing a slowdown           on the yields of lower quality assets, and the-
    in activity, caught in the backwash of the             refore the differences in value between assets
    US-China dispute, even though it is resilient          will diminish. Secondly, as yield compression
    overall. Meanwhile, the UK growth remains re-          slows overall, it will weigh on capital values.
    latively robust despite uncertainty. Clearly, the      Since 2015, yield compression created value
    highly uncertain nature of Brexit is still what        almost passively. From now on, more work
    will most determine the future economic per-           on the asset, its leases and its revenues will
    formances of the country.                              be required to create value. Promisingly, most
                                                           letting markets are healthy, vacancy rates are
    Signs of a slowdown in the economy will not            unlikely to change much despite forthcoming
    encourage the ECB to adopt a much tighter mo-          supply and there is still decent rental growth
    netary policy; ECB policy in 2019 will be a conti-     potential for flagship locations as well as those
    nuation of zero interest rates. It is more likely      in development. Lastly, the rental backdrop
    to carry out low-key operations like sticking to       and the quest for better performance should
    the discontinuation of quantitative easing an-         prompt investors to step up their diversifica-
    nounced at end 2018 and altering the depo-             tion and risk-taking strategies.
    sit rate. As such, short-term rates such as the
    3-month Euribor may edge up, in keeping with
    an increase in the ECB deposit rate, but they                                Richard Malle
    are still likely to remain in negative territory. In                         PhD, MRICS
    such a context, major factors will combine to                                Global Head of Research

                                                                                                               3
OFFICES
    IN EUROPE
    No letup in European office
    market activity in 2018                                                                        86,146
                                                                                                               GLASGOW
                                                                                                              9.5      394
                                                                                                                                                      EDINBURGH
                                                                                                                                                          65,447      7.5          413

    Take-up volume as high as in 2017
    The office market in Europe is flourishing,
    with 2018 total volumes at the same level as
    those of 2017, by far the most active year in                                              DUBLIN                                                 MANCHESTER
    the decade. At city level, Central London be-                             372,441    6.4      670                                                     163,649      11.7         425
    nefited from the return of activity from small
    and medium businesses and from the high
    demand from the Media Tech sector, reaching                                                                       BIRMINGHAM
    1.4m sq m (+19% over 1 year). The four main                                                              70,155         12.4         400                                                          AMSTERDAM
    German markets combined dropped 8% but                                                                                                                                            381,077                 7.2      425
                                                                                                                                   CENTRAL LONDON
    still represented 3.04m sq m, well above the
                                                                                                                             1,400,461         5.0       1,365
    long term average. Volumes in Central Paris
    diminished by 9%, notably due to the lack of
                                                                                                                                                                                          LILLE                               BRUSSELS
    very large deals (-30% in transactions over                         Take-up (m2)                                                                                                                                                361,423   7.9
                                                                                                                                                         280,216            -             240
    20,000 sq m). Very high results were achie-                       Vacancy Rate (%)
    ved in Vienna (+54%), Luxembourg, Lisbon                      Prime Rents (€/m2/year)                                                                                                                           LUXEMBOURG
    (+21%), Milan and Warsaw (+10%).
                                                                                                                                                                                                  247,882               3.7    600
                                                               Take-up in thousand m2
                                                                                                                                                                   CENTRAL PARIS
    Vacancy contraction in Europe
                                                                                         1,000                                                            2,159,027    5.5          857
    pushing up prime rental values
                                                                                            500
    The average vacancy rate shrunk again in Eu-
    rope in 2018 and probably attained its floor                                            250
    in several markets. The German markets still                                            100
    displayed the lowest vacancy rates, especial-
    ly Berlin (1.7%, representing only 327,000 sq                                                                                                                                                                      GENEVA *
                                                               * Net absorption
    m) and Munich (2.3%). Luxembourg (3.7% of                    instead of take-up		                                                                                                                 -               4.8     800
    vacancy) was close to the level of German
                                                                                                                                                                                                               LYON
    markets. Vacancy dropped the most in Ams-
                                                                                                                                                                                330,571         5.7             300
    terdam (-310 bps) and Warsaw (-340 bps).
    The share of empty premises fell in all the
    other markets, such as Central Paris (-100
    bps), Central London (-120 bps), Milan (-110                                                                                                TOULOUSE

    bps) and Dublin (-170 bps). Prime rental va-                                                                               177,888          4.9       220
    lues remained steady or increased in all the                                                                                                                                                              MARSEILLE
    main European markets, except in Central                                                                                                                                     368,288                  -             320
    London (-2% vs. the end of 2018) where
    prime rents reached £1,211/sq m/year. Ma-
    drid (+13%, €432/sq m/year) saw the most                                                                                                                BARCELONA
    significant growth in rental values.                                                                                                       378,337       8.9      312
    Other big increases were in Hamburg,                                                                MADRID
                                                                                                         538,465      9.6          420
    Berlin (+9%), Milan and Frankfurt
    (+7%).                                        LISBON
                                                     201,985    8.8     252

4
HELSINKI *
82,800 12 456
OSLO * TALLINN *
119,593 5.9 506 60,000 5.5 210
STOCKHOLM *
185,000 5.5 658
European Office
RIGA * Demand
25,000 6 187
Take-up * Employment growth **
(M m2) (%)
12,000 2
11,000 1
10,000 0
VILNIUS *
COPENHAGEN 9,000 -1
75,000 3.7 192
- 5.9 268 8,000 -2
12 13 14 15 16 17 18
---- 2017 ---- ---- 2018 ----
HAMBURG
563,000 4.5 348
WARSAW 12,908,832 13,016,528 +0.8%
648,000 8.6 270
BERLIN
Take-up (m2)
831,000 1.7 432
Office take-up in the main European
cities reached 13 million sq m, and
remained stable compared to 2017.
310 FRANKFURT PRAGUE * 30 cities - ** Eurozone
678,000 7.4 528 318,210 5.1 264
VIENNA BRATISLAVA European office
MUNICH
975,000 2.3 468
270,000 5.3 306 106,100 6 198 prime rent and vacancy
BUDAPEST (40 cities)
385,787 7.3 288 Vacancy Rate Prime Rents (€/m²/
ZURICH (%) year)
- 3.9 688
10 420
BELGRADE 9 400
- 4 - 8 380
MILAN 7 360
389,530 10.6 590 6 340
12 13 14 15 16 17 18
BUCHAREST
292,019 8.3 222
---- 2017 ---- ---- 2018 ----
7.7 6.8 -100bp
ROME
Vacancy Rate (%)
172,529 8.7 440
403 423 +5%
Prime Rents (€/m²/year)
ATHENS
70,000 8 240 The vacancy rate continued to diminish
on average in the main European cities,
supported by the combination
of growing take-up and low level
of completions.
5
INVESTMENT
MARKET
Another stunning year
for investment 897
GLASGOW
55 5.25
EDINBURGH
1,026 33 4.75
The total commercial real estate investment
volume in Europe reached €261bn in 2018**,
a similar level to 2017. Activity actually stren-
gthened in the sixteen largest city markets as DUBLIN MANCHESTER
with a 10% increase they broke the €100bn 3,125 45 4 1,694 19 4.75
bar; an absolute historic record.
Offices remained the most sought-after assets
on the market, sustained by record levels of BIRMINGHAM
office take-up. They represented 45% of in- 1,432 34 4.75 AMSTERDAM
vested volumes in Europe and were charac- 3,634 62 3.5
Investment volume (€ million) CENTRAL LONDON
terized by a large share of mega deals.
Office share of total 20,330 77 3.5
Thanks to an impressive growth of invested
investment volume (%)
volumes (+26% y.o.y.), Paris was back to being
Net Office Prime Yield (%) LILLE BRUSSELS
the leading European city market. This perfor- 2,976 66
600 89 4.15
mance was mainly driven by office mega deals Investment € bn
and American investment. London (-10%) (by city)
LUXEMBOURG
downgraded to second position but was host 10
1,973 94 4
to the top three largest single deals in Europe. 5
CENTRAL PARIS
German markets performed extraordinarily 2 22,987 82 3
well again as 2018 was an all-time high for 1
the country, passing 2007 result. Frankfurt
(+38%) was number one ahead of Berlin (-6%) Investment € bn
which was hampered by the lack of product (by country)
to buy. 2018 was a good year for Dublin mar- n > €20 n €5 - €20
ket (+81%) that concentrated almost 90% of n €2 - €5 n < €2 GENEVA
the Irish market. The Luxembourg market - - 2.9
* Total investment
reached its highest level since 2007 with of- In Slovakia (source RCA)
LYON
fices representing 94% of the turnover.
1,412 80 3.85
Office yields continued their downward trend
throughout Europe, reaching historic lows at
the end of 2018. Prime yields stood at 4.40%
in Q4 2018 on average among the 40 markets TOULOUSE
analyzed in this report, 26 bps down on Q4 434 79 5
2017. Among the largest markets, Berlin still MARSEILLE
had the lowest prime office yield (2.70%) fol- 675 39 4.7
lowed by Munich (2.80%), Frankfurt (2.95%)
and Paris (3.00%)
BARCELONA
1,212 51 3.5
MADRID
4,196 36 3.25
LISBON
2,771 27 4.25
** In the countries monitored in this report
6
HELSINKI
2,423 61 3.4
OSLO TALLINN
2,184 50 3.75 149 60 6.25
STOCKHOLM
4,580 46 3.4
Commercial real estate
RIGA
investment volume
188 45 6.5 in Europe
Office investment Retail investment
(€/m²/ Other investment
year )
250
200
VILNIUS
COPENHAGEN 150
286 49 6.25
1,100 58 4 100
50
0
12 13 14 15 16 17 18
HAMBURG
5,895 52 3.05
WARSAW ---- 2017 ---- ---- 2018 ----
2,249 77 4.75
7,429 57
BERLIN
2.7 261,923** 261 ,056** 0%
Total investment (countries)
118,702 126 ,343 +6%
4 FRANKFURT PRAGUE
10,229 82 2.95 1,187 86 4.75
Total investment (cities)
Full year volumes remained stable
in 2018 with €261bn invested across
VIENNA BRATISLAVA * Europe. Central Paris is back to being
MUNICH 265 - 6.25 the leading European city market,
2,731 39 3.5
6,667 64 2.8 followed by Central London.
BUDAPEST
1,057 68 5.75
ZURICH
1,853 33 2.2
BELGRADE
- - 8.25
MILAN
European Office prime
3,182 65 3.3 yield vs 10-year Bund
Office prime yield 10-year Bund
BUCHAREST (%)
818 70 7.25 8
6
4
2
0
ROME 12 13 14 15 16 17 18
2,169 55 4
---- 2017 ---- ---- 2018 ----
ATHENS 4.66 4.40 -26bp
- - 7.5
Prime yield (%)
Office prime yields continued their fall
during 2018 recording new lows.
7
AMSTERDAM
    Limited prime office availability in Amsterdam

    Limited prime office availability
    in Amsterdam
    Following several years of strongly increa-
    sing take-up, the office market in Ams-
    terdam stabilized in 2018 with take-up
    dropping back to around 380,000 sq m (-6%
    y-o-y). Stabilization of office take-up is oc-
    curring despite strong economic fundamen-
    tals as it stems from the absence of avai-
    lable high quality office space.
    Whereas the demand-supply mismatch was
    previously limited to the prime locations,
    the mismatch has spread to secondary lo-
    cations in Amsterdam. The current supply
    mainly consists of small sized spaces that
    are not suitable for large occupiers. In ad-                            Take-up                                                Vacancy rate
    dition, the vacancy rates have also dropped                         (thousand m2)                                                              (% )
    (-310 bps) due to the active redevelopment                                                  -6%
    policy of the municipality, which has led to            400                                                    14
    the redevelopment of 725,000 sq m of emp-
                                                            350                                                    12
    ty office space. As a result of the limited
    availability, office users are widening their           300                                                    10
    requirements scope towards other cities.
                                                                                                                                                                         -310bp
                                                            250                                                    8
    The continuous fall in the vacancy rate and
    the limited availability of office space re-            200                                                    6
    sulted in rental growth which is expected                          15       16        17     18                                      15        16          17           18
    to continue in the short term as the restric-
    ted development pipeline prevents suffi-                       Office investment
    cient expansion in supply to offer tenants a                            (€ million)                            Prime office: rents & yields
                                                                                                                   Prime office: rents & yields
    viable alternative choice.                                                                                  (€/m²/             Prime rent             Prime yield
                                                           3,000                                                 year )                                                          (%)
    Lack of large transactions reduces                                                         -33%             (€/m²/
                                                                                                                 year )                                                          (%)
                                                           2,500                                                   420                                                            6
    the investment volume
                                                                                                                   380                                                           5
    With a transaction volume of €3.6bn in                 2,000
    2018, the investment market in Amsterdam                                                                       340                                                           4
                                                           1,500
    is below its record volume of 2017 (€5.2bn).
                                                                                                                   300                                                           3
    With €2.2bn the office market remained the             1,000                                                            12      13        14    15    16        17     18
    main investment class (61.5% of total vo-                          15       16        17     18
    lume). The investment volume in 2017 was
                                                     Main office transactions - letting & sales
    boosted by several large transactions. In
    contrast, 2018 experienced a lack of assets        Occupier                                Space (m2)         Building-address                              Submarket
    of scale, resulting in only 3 office transac-      DNB                                      25,000                    Spaklerweg                                 Amstel
    tions above €100m.
                                                       APG                                      15,000(1)                  Basisweg                                 Sloterdijk
    The strong demand for investment product
    in Amsterdam is intensifying competition           ING                                      12,000             Hullenbergweg                                    Southeast
    for prime properties and is reflected in the
    continuous yield compression. Despite the        Main office transactions - investment
                                                                                                                                                                                       Source : BNP Paribas Real Estate

    decrease in investment volume in 2018, the
    prospects for the investment market remain         Buyer                                      Price (€ m)              Building-address                              Submarket
    positive for 2019.                                 Rubens Capital - Deutsche Bank                 228                        Rivierstaete                             Amstel
                                                       Meijer Realty Partners                         125(1)    World Fashion Centre 1-2-4                                 West
                                                       Barings Real Estate                            104                   Amstelgebouw                                  Amstel
                                                     (1)
                                                           Estimated

8
ATHENS
The office market is benefitting from economic recovery

Strong demand for modern offices
is encountering constraints
The office market in Athens is benefitting
from improvements in the Greek economy
and attracting more interest from local and
foreign tenants. The Greek Depression re-
sulted in a considerable contraction in size
and activity of the market, so much so that
few schemes were completed. There is now
little supply of high quality buildings in the
prime office areas and this has led to a
shortage of Grade A and B offices. As a
consequence, prime rental values have
been increasing over the last 3 years in the                       Take-up                                                       Vacancy rate
most sought-after areas, such as in the CBD                    (thousand m2)                                                               (% )
and in the areas of Kifissias and Syggrou
Avenues. On the other hand, the stock of
                                                                                         +19%
                                                    80                                                           12
Grade C and D office remains high while
the demand for such premises is almost              60                                                           10                                                  -150bp
nonexistent. The Athens City Centre is ex-          40                                                           8
pected to achieve higher rents in 2019,
as rental values are expected to increase           20                                                           6
together within the wider growth of the              0                                                           4
economy. Athens is no exception to the                        15        16          17        18                                 15        16             17           18
co-working and flexible workspace boom
in Europe as more than 20 buildings were                 Office investment
converted into co-working spaces in the                      (€ million)                 +96%                         Prime office: rents & yields
Greek capital city.
                                                                                                                (€/m²/           Prime rent           Prime yield
                                                   100                                                           year )                                                       (%)
Revitalised investment market
leads to a decrease in yields                      80                                                             300                                                         10
The improvement of the economy also                                                                                250                                                        9
                                                   60
boosted the interest of institutional inves-
                                                                                                                  200                                                         8
tors. Greek REICs and real estate investors         40
plus foreign private equity funds are loo-                                                                            150                                                     7
                                                   20                                                                       12   13   14        15   16         17      18
king at the market for properties with good
                                                              15       16           17        18
tenants.
High quality single assets or property port-     Main office transactions - letting & sales
folios are sought-after, which led to yield
contractions especially for properties in        Occupier                     Space (m2)                     Building-address                                  Submarket
prime office locations (to around 7% -           Value Touristiki (sale)           14,427            10-14, Minoos Str. & Ilia lliou Str.                      Neos Kosmos
7.75%), and also in secondary locations if
                                                 Civil Aviation                                    580, Vouliagmenis Ave. , Leontos Str. &
the property is leased to a good tenant (to                                         5,500                                                                      Argyroupoli
                                                 Authority (letting)                                           Eleftherias Str.
around 8%-8.5%).
                                                 Taxibeat (letting)                 5,200                     115, Kifisias Ave.                               Ampelokipoi

                                                 Main office transactions - investment
                                                                                                                                                                                    Source : BNP Paribas Real Estate

                                                 Buyer                 Price (€ m)                         Building-address                                     Submarket
                                                 Dromeus Capital             23.6                           66, Kifissias Ave.                                       Maroussi
                                                                                                                                                                     Center of
                                                 Ethniki Pangaia             7.2            66-68 ,Mitropoleos Str. & 5, Kapnikareas Str.                             Athens
                                                 Intercontinental            7.5                   18, Zekakou Str. & Karamanli Str.                                 Maroussi
                                                 International

                                                                                                                                                                                                        9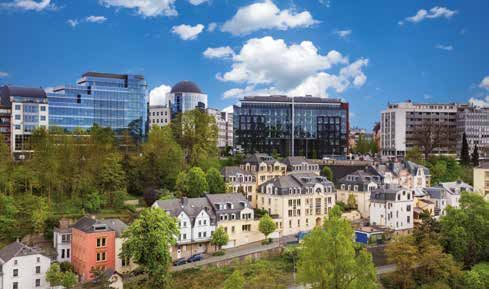
BARCELONA
     The market benefits from the upgrading of the office stock

     Prime and average rental values
     are on the rise in Barcelona
     The Barcelona office market was particular-
     ly dynamic in 2018, with annual take-up ex-
     ceeding 2017 by 24%. In total, 378,337 sq m
     of office floorspace was transacted in 2018,
     which was the second-best figure in the
     last ten years and was only surpassed in
     2015 (388,000 sq m). A total of 357 deals
     was closed in 2018, a 6% rise in compari-
     son with the previous year, and 24% above
     the yearly average for the last ten years.
     Prime rental growth in Barcelona was fue-
     led by the renovation of the stock and was
     up 11% in Q4 2018 compared to the end
     of 2017. As such, prime rent stands at
     €312/sq m/year. The average rent in Bar-                             Take-up                                               Vacancy rate
     celona is following the same trend, as it                        (thousand m2)                                                              (% )
     rose by nearly 15% to reach €208/sq m/
     year. The low level of availability and fur-
                                                                                              +21%
                                                        400                                                         16
     ther office refurbishment operations are ex-
     pected to drive the rents further up in the        300                                                         14
     next months.                                       200                                                         12
     2019 will see the delivery of around
                                                        100                                                         10
                                                                                                                                                                        -120bp
     130,000 sq m of new office floorspace in
     Barcelona, of which around 100,000 sq m              0                                                         8
     will be located in 22@ district. Available of-                  15       16        17       18                                  15          16           17          18
     fice floorspace in Barcelona continues to
     diminish; the vacancy rate now stands at                  Office investment
     8.8% and 2.3% in the CBD.                                            (€ million)                               Prime office: rents & yields
                                                                                                                 (€/m²/         Prime rent                Prime yield
     Slight decrease in office prime yield             1,000                                                      year )                                                       (%)
     The investment volume of 2018 in Barce-
     lona reached €695m, of which 36% was in-           800                                   -27%                  350                                                        6

     vested in the 22@ district. Due to scarcity        600                                                        300                                                         5
     of product and the high purchasing pres-                                                                       250                                                        4
     sure, yields remain at low levels in Barce-        400
     lona, with the prime yield standing at 3.5%                                                                   200                                                         3
                                                        200                                                                12   13        14      15     16        17    18
     (-25 bps vs. 2017).                                             15       16        17       18

                                                      Main office transactions - letting & sales
                                                      Occupier                     Space (m2)                Building-address                                      Submarket
                                                      Everis Spain                   25,000                     Badajoz, 5                                              22@
                                                      Indra Sistemas                 11,314                    Samontá, 21                                         Outskirts
                                                      CCC Holding                     9,026                    Diagonal, 211                                            22@

                                                      Main office transactions - investment
                                                                                                                                                                                     Source : BNP Paribas Real Estate

                                                      Buyer                        Price (€ m)        Building-address                                 Submarket
                                                      Blackstone                      210               Diagonal 662                             CBD - Les Corts
                                                      Hines                             94              Diagonal 177                                     22@
                                                      IGIS                              87            Paisos Catalans 51                       Outskirts - Esplugues

10
BELGRADE
An active construction pipeline is matching much stronger demand
Fall in vacancy but stability
in rental values
Current grade A and B office stock in Bel-
grade is close to 800,000 sq m with 90% of
the total located in Belgrade’s Central Bu-
siness District (CBD), while the Broad Centre
is comprised of about 10%.
Built stock still remains modest compared
to the cities of the similar size in the region
even though construction activity remained
strong during 2018. There is scope for consi-
derable increase in new buildings if politi-
cal conditions remain stable and the eco-
nomy grows.
Leasing activity was strong in 2018 and ac-
tivity is likely to stay this way in 2019. A
measure of how much the market has im-
proved is that the take up in the first half of
2018 was at the level of the whole of 2016.
The strongest demand came from IT, fol-
lowed by professional services, pharmaceu-
ticals and co-working operators.
The vacancy rate continues to fall although
this is not feeding through into rental in-
creases. During 2018 rental levels remained
stable in line with the previous period. Land-
lords continue to offer incentives including Vacancy rate
rent free periods, fit-out contributions and (% ) Prime office: rents & yields
additional free parking spots. Prime asking
(€/m²/ Prime rent Prime yield
rents for Grade A office buildings in CBD year ) (%)
8
zone vary from €15 to €17/sq m/month,
while Grade B rental levels are ranging 6 -200bp 200 9.5
between €9 and €12/sq m/month. 180 9
4
160 8.5
2
140 8
0 12 13 14 15 16 17 18
15 16 17 18
Office pipeline under construction
Project/Investor Space (m²) Building-address Submarket
Business Garden / AFI 16,000 Ruzveltova City center
Usce Tower 2 / MPC 22,000 Mihajla Pupina Blvd New Belgrade
N House 10,700 Mihajla Pupina Blvd New Belgrade
Milutina Milankovica
Green Heart / GTC 24,000 New Belgrade
Blvd
Source : BNP Paribas Real Estate
Skyline / AFI 30,000 Kneza Milosa Str City center
Immorent Sirius office Milutina Milankovica
12,500 New Belgrade
(2nd phase) Blvd
Milutina Milankovica
Navigator 2 / MPC 27,000 New Belgrade
Blvd
11BERLIN
Berlin’s popularity is unabated for occupiers and investors alike
Rental growth from the intensifying
shortage of space in Berlin
With a take-up of 831,000 sq m, the Berlin
office market mirrored the results of pre-
vious years by again breaking through the
800,000 sq m barrier in 2018. Even though
the record of 2017 could not be reached,
the result is clearly more than a quarter
above the ten-year average.
A look at the volume of vacant space shows
just how tight the supply situation is: at
327,000 sq m it reduced by a further 17%
within a year. Modern quality space is par-
ticularly scarce, with a decline of 33% to
81,000 sq m, only accounting for around a
quarter of total vacancies. The vacancy rate Take-up Vacancy rate
has fallen further accordingly and, at 1.7%, (thousand m2) (% )
is now well below the 2% mark.
As a result of the intensifying shortage of 900
-9% 5
space, the rapid rise in rents continued last
800 4
year. The prime rent climbed by around 9%
to €432/sq m/year. It is now achieved in
Topcity West instead of Potsdamer Platz /
700 3
-30bp
600 2
Leipziger Platz as before. The average rent
also continues to follow an upward trend 500 1
15 16 17 18 15 16 17 18
and has broken through the €240 mark al-
most everywhere.
Office investment
Lack of product prevents even (€ million) Prime office: rents & yields
better result for investment
The transaction volume of €7.43bn means 5 ,000 -17% (€/m²/
year )
Prime rent Prime yield
(%)
the Berlin investment market has gone (€/m²/
4 ,000 400)
year (%)
5
through the €7bn mark for the third time in
350 4
its history and achieved the third-best re- 3,000
sult ever. A reality, however, is that the in- 300 3
2,000
vestment volume could have been even hi- 250 2
gher in Berlin if a larger offering of product 1,000 12 13 14 15 16 17 18
15 16 17 18
was available.
As in previous years, office properties ac-
count for the bulk of turnover (57%), al- Main office transactions - letting & sales
though their dominance is much less pro-
Occupier Space (m2) Building-address Submarket
nounced than in Frankfurt (82%) or Munich
(64%). Strong demand led to a further de- Vattenfall 29,900 Sachsendamm 55-60 3.4 Tempelhof/Neukölln/Steglitz
cline in yields in the final quarter. The net BIMA 15,100 Englische Straße 27-30 2.6 Charlottenburg
prime yield for offices fell by a further 20 DIN e.V. 14,400 Saatwinkler Damm 42-43 4.5 Remaining Municipal Area
basis points to 2.7%, making Berlin the most
expensive location in Germany, ahead of
Munich (2.8%). Main office transactions - investment
Source : BNP Paribas Real Estate
Buyer Price (€ m) Building-address Submarket
Hines 235 zalando-Campus B | 3.2 Kreuzberg / Friedrichshain
RFR 135 Rosenthaler Höfe B | 2.3 Hackescher Markt
REInvest 110 Brain Box Berlin B | 4.1 Adlershof
12BIRMINGHAM
Improved infrastructure and quality developments
keep market conditions strong
Birmingham take-up falls back
in line with the 10 year average
Following the record take-up levels of
93,374 sq m achieved in 2017, it is perhaps
unsurprising that the market returned to
normalcy in 2018 with take-up for the year
falling back to 70,155 sq m. At this level
take-up was in line with the 10 year average.
The largest letting of the year concerned
Birmingham City University’s acquisition of
10,985 sq m at Belmont Works to establi-
sh a new school of computing. This was the
only letting over 5,000 sq m to complete
over the course of 2018, and it was this lack
of larger deals comparative to 2017 which
contributed to lower overall take-up.
Vacancy for the Birmingham market fell Take-up Vacancy rate
from 13.5% at Q4 2017 to 12.4% at Q4 2018. (thousand m2) (% )
This was despite the addition of the 36,576
sq m 3 Snowhill scheme, all of which has 100 16
been developed speculatively and is due to -25%
complete by Q2 2019. 80 14 -110bp
Looking ahead, 2019 is also scheduled to 60 12
see the speculative completion of Two
Chamberlain Square (15,475 sq m) and 40 10
Platform 21 (10,405 sq m).
20 8
Prime rental levels have remained static 15 16 17 18 15 16 17 18
on Q4 2017, standing at €400/sq m/year. At
this level prime rents are at a structural Office investment
high for the market, driven by the city’s im- (€ million) Prime office: rents & yields
proved infrastructure offer and targeted de-
liveries of new prime speculative schemes. (€/m²/ Prime rent Prime yield
1,000 year ) (%)
Prime yields see compression with 750 -27% 450 (%)
6
more interest from UK investors 400 5
500
Investment volumes reached €494m in
2018, a 27% decline on the total achieved 350 4
250
in 2017. Lower volume stems from a fall in 300 3
the number of larger transactions and less 0 12 13 14 15 16 17 18
15 16 17 18
interest from overseas investors. Positively,
UK Institutions increased their activity here
Main office transactions - letting & sales
in 2018, with investment rising 41% on
2017. The largest transaction of the year Occupier Space (sq ft) Building-address Submarket
comprised Nuveen Real Estate’s (then TH Birmingham City University 118,240 Belmont Works CBD
Real Estate) European Cities Fund’s acqui-
sition of 55 Colmore Row for £98m, reflec- WSP 46,100 The Mailbox CBD
ting a yield of 4.90%. Prime yields in Birmin- BE Group 38,162 Somerset House CBD
gham recorded compression over the course
of 2018 to stand at 4.75%, 25bps lower than Main office transactions - investment
Source : BNP Paribas Real Estate
in Q4 2017.
Buyer Price (£ m) Building-address Space (sq ft)
European Cities Fund 98 55 Colmore Row 157,562
Railways Pension Trustees 95 2 Colmore Square & Cannon House 299,990
Constant Exchange Rate Talisker Corporation 51 The Cube 175,000
(Q4 2018 average) €/£: 1.1273
13BRATISLAVA
Modern office development continues to transform Bratislava
and meet occupier needs
Preletting is dominating
transactional activity in Bratislava
Occupier demand remained solid in 2018
though recorded a slight annual decline
over last year. IT companies primarily drove
leasing activity followed by the financial
and professional services sectors. Prelea-
sing is a defining market feature of Bratis-
lava at the moment, tied to the steady
delivery of modern buildings that is incre-
mentally growing the total stock. The pre-
leasing dynamic is enough to ensure that
the vacancy rate fell to below 6% in 2018.
The incremental increase in new supply re-
duces some of the pressure that a reducing
Take-up Vacancy rate
(thousand m2) (% )
vacancy rate normally places on rents. Also
with the arrival of new offices, older space
is being released as occupiers relocate into 200 -9% 10
the pre-let. Nonetheless the prime rents 150 8 -20bp
have been rising slightly and may see fur-
ther growth also in 2019. 100 6
50 4
Stabilisation in office yields
expected for 2019 0 2
Around one third of total Slovak real estate 15 16 17 18 15 16 17 18
investment went to offices last year. Seve-
ral large transactions by Czech buyers
Total investment*
concluded last year such as Lakeside Park,
(€ million) Prime office: rents & yields
Aupark Tower and BBC V all acquired by the (€/m²/ Prime rent Prime yield
400 year ) (%)
investment company Wood & Co. The li- +70%
mited amount of quality product on offer 300 200 7.5
was enough to see yields remaining un-
200 190 7
changed over 2018. Although there is still
some scope for yield compression because 100
180 6.5
of investor interest, yields are likely to re- 170 6
main broadly stable in line with the wider 0
12 13 14 15 16 17 18
15 16 17 18
situation in the CEE region.
Major completions in 2018
Space (m²) Building-address Developer
35,000 Twin City Tower HB Reavis
21,000 Einsteinova Business Centrum S Immo
10,200 Blumental Offices II Corwin
Main office transactions - investment
Source : BNP Paribas Real Estate
Buyer Building-address Space (m²)
Wood & Company BBC V 36,700
Wood & Company Lakeside Park 24,700
Wood & Company Aupark Tower 32,500
*Total investment In Slovakia (source: RCA)
14BRUSSELS
Low vacancy is encouraging the largest occupiers to jump
ahead by pre-letting developments
The market is being driven by flexible
office providers and pre-let deals
Take-up over 2018 in Brussels amounted to
361,500 sq m and mainly fueled by the high
demand from flexible office operators,
which accounted for almost 20% of annual
take-up. Last year was also characterized
by the increase in pre-lets because of the
shortage of available prime offices. Moreo-
ver, an important goal of the real estate
strategy followed by the vast majority of oc- Take-up Vacancy rate
cupiers in Brussels is to accommodate em- (thousand m2) (% )
ployees in space that facilitates the best
working environment. These are sustai- 450 11
nable buildings that maximize social inte-
raction and employee happiness, which are 400
-10% 10
in the shortest supply because they tend to
be the most modern buildings.
350 9
-40 bp
The immediate supply in December reached 300 8
1,027,500 sq m, a decrease of 7% compared 250 7
with the end of 2017. The vacancy rate 15 16 17 18 15 16 17 18
reached 7.7% in Brussels as a whole. Howe-
ver, the share of empty premises reached Office investment
its lowest level ever recorded in the CBD (€ million) Prime office: rents & yields
with 3.5% of vacant offices. Despite the ex- +32% (€/m²/ Office primePrime
Prime rent rent yield
pected completion of several development 2,000 year ) (%)
projects in 2019 and 2020, no increase in (€/m²/
Office prime yield
vacancy is anticipated due to the high level 1,500 300)
year 6(%)
of pre-let deals. In 2019, some 207,200 sq 1,000 280 5
m are due for completion, of which 45%
260 4
have already been rented. Headline prime 500
rents remained unchanged, at €310/sq m/ 240 3
0 12 13 14 15 16 17 18
year. Average rents increased to €173/sq m/ 15 16 17 18
year in 2018 (vs. €156/sq m/year a year
earlier). Main office transactions - letting & sales
Occupier Space (m2) Building-address Submarket
Asian investors boost office
Espace Orban - Rue de la Science
investment volumes EEAS (1) 18,000 27,1040 (2) Leopold district
In 2018, €1.96bn was invested in the Brus-
Mercure Center I - Rue de la Fusée Decentralised North
sels office market, 32% more than last year. Plastic Omnium 12,000 100,1130 (2) East
Korean investors represented a large part
Quatuor - Boulevard Baudouin
of the market. One of the largest transac- SilverSquare 10,500 North District
30,1000 (2)
tions of the year was the acquisition of Eg-
mont I & II, bought by a South Korean fund Main office transactions - investment
for €370m. The office prime yield for stan-
Buyer Price (€ m) Building-address Submarket
dard lease lengths (3/6/9 years) recorded a
Source : BNP Paribas Real Estate
60 bps compression in 2018 and now stands Egmont I & II - Rue des Petits
L'Etoile Property 369 City Centre
Carmes 15 (2)
at 4.00% vs. 3.50% for long term leases.
The One - Rue de La Loi Leopold
Deka Immobilien 200 107-109 ,1040 (2) district
Samsung Asset Pole Star / North Light - North
152
Management JV Hyundai AM Boulevard Simon Bolivar 34, 1000 (2) District
(1)
European External Action Services - (2) Brussels
15BUCHAREST
Office supply is increasing in Bucharest as development continues
Pre-leasing activity gaining momentum
Approximately 290,000 sq m was taken-up
in 2018 in Bucharest, representing a 9% de-
crease compared to 2017, a year boosted by
exceptionally large pre-leases. Pre-leasing
activity stayed lively last year as it repre-
sented more than 60% of H2 2018 take-up,
mostly for projects due in 2019. The largest
office transaction was closed by Microsoft in
Campus 6.2 developed by Skanska, followed
by various lease transactions signed in Ore-
gon Park Building C such as Oracle and BNP
Paribas Group. The most active industries re-
mained IT&C and services sectors accoun- Take-up Vacancy rate
ting for over 63% of H2 2018 take-up activity. (thousand m2) (% )
The remaining take-up was transacted by
companies acting in media, pharma or pu- 350 -9% 14
blic companies. The overall annual office
300 12
completion minus the pre-leasing activity
generated a slight increase in the vacancy 250 10 -60bp
rate to around 8.3%. This trend will continue
200 8
in 2019 as the announced pipeline is around
300,000 sq m out of which 30% is already 150 6
pre-let. 15 16 17 18 15 16 17 18
Good economic performance leads Office investment
to increased investment activity (€ million) Prime office: rents & yields
Investor confidence was boosted by strong
(€/m²/ Prime rent Prime yield
economic growth in 2018, which resulted in
a high investment volume in Romania of
800
+513% year ) (%)
600 225 10
close to €1bn, of which offices represented
approximately 50%. The most significant 400 200 9
deals were the two large office deals re- 175 8
200
corded in Bucharest: The Bridge sold by Ro-
150 7
manian developer Forte Partners to Dede- 0
12 13 14 15 16 17 18
man, and Oregon Park sold by Portland 15 16 17 18
Trust/Ares Management Corporation to Lion’s
Head Investments. Main office transactions - letting & sales
The Bridge transaction represented a miles-
Occupier Space (m2) Building-address Submarket
tone, as it involved Romanian capital and will
be the largest investment transaction re- Microsoft Romania 23,500 Campus 6.2 West, Bucharest
corded in Romania in 2018 when the pur- ENEL 11,500 Day Tower Center, Bucharest
chase of the third building is completed. Deloitte 8,500 The Mark CBD, Bucharest
Prime office yields contracted by 25 bps over
one year to 7.25% at the end of 2018.
Main office transactions - investment
Buyer Price (€ m) Building-address Submarket
Source : BNP Paribas Real Estate
Lion's Head Oregon Park (Bldgs A-B-C),
170* North, Bucharest
Investment 44 Sos Pipera
The Bridge (Bldgs A-B)
Dedeman Group 140* West, Bucharest
15 Orhideelor Street
The Landmark, 4 Vasile Alecsandri
Revetas & Cerberus 95* CBD, Bucharest
Street
* estimated
16BUDAPEST
Pre-letting office space is becoming a normal situation
for tenants in the market
Pre-let transactions create best
take-up volumes in ten years
Office take-up totalled 385,790 sq m in 2018,
the highest volume seen in the last ten
years. The outstandingly good result was
boosted by large pre-lease agreements,
which accounted for 25% of the annual take
up. The average transaction size increased
with 13 lease agreements over 5,000 sq m.
The most active tenants were the financial
and governmental companies. Completions
totalled 230,575 sq m in 2018, which is the
highest volume since 2009, however 78% of
the new office areas were pre-let before the
handover of the buildings. This meant that Take-up Vacancy rate
the vacancy rate was declining and stood at (thousand m2) +39% (% )
7.3% at the end of 2018, one of the lowest
rates ever recorded. The availability of prime 350 20
office space in Váci Corridor and in the CBD
300 15
submarkets continued to drastically reduce.
Approximately 126,000 sq m of office sche- 250 10
-20bp
mes are under construction for 2019, and
200 5
further 191,000 sq m are expected for 2020.
Based on the current trends the ratio of pre- 150 0
lease agreements is going to remain high in 15 16 17 18 15 16 17 18
the next few years, therefore we do not ex-
pect vacancy increase. By the beginning of Office investment
2018 rents went above the pre-crisis’ peak (€ million) Prime office: rents & yields
levels. The rent differences are increasing
(€/m²/ Prime rent Prime yield
between grade ‘A’ and ‘B’ building. On ave-
rage, the rents of grade ‘B’ offices are 30%
1,000
+2% year ) (%)
750 300 8
lower.
500 250 7
Domestic investors helped keep 200 6
250
Budapest at record investment levels
150 5
Due to high activity in the second half of the 0
11 12 13 14 15 16 17
year, the annual investment volume reached 15 16 17 18
the level recorded in 2017 indicating steady
interest, and outstandingly good results 3 Main office transactions - letting & sales
years in a row. The office sector is still the
leading segment in the investment market, Occupier Space (m2) Building-address Submarket
accounting for almost 50% of the total in- evosoft 20,400 Univerzum Office Building South Buda
vestment volume. The majority of the tran- Raiffeisen 19,300 Agora Tower Váci Corridor
sactions were concluded by Hungarian pro-
Ministry of Agriculture 14,900 Vigadó Palace CBD
perty funds and private investors. The largest
transaction of the year was closed by OTP
Property Fund who bought six existing office Main office transactions - investment
buildings and two new projects under deve-
Source : BNP Paribas Real Estate
lopment from Futureal. After local investors Buyer Price (€ m) Building-address Submarket
are Asian purchasers who have entered the OTP Property Fund Corvin Offices (1)
Central Pest
market buying core office properties in key
locations. A significant compression was re- Erste Property Fund 100 Mill Park Central Pest
gistered in prime office yields that dropped Erste Property Fund Promenade Gardens Váci Corridor
to 5.75% by the end of 2018. (1)
6 buildings and 2 projects
17COPENHAGEN
Co-working space is making an impact on Copenhagen’s office market
Demand from mid-sized companies
is driving flexible space take-up
Historically high demand, low vacancy
rates and innovative solutions defined the
Copenhagen office market in 2018. The de-
cline in unemployment in the strong Dani-
sh economy has driven vacancy rates
down, which currently stands at 5.9% for
Copenhagen’s office market. Development
continues to go forward in renovated of-
fices and new buildings but in Denmark, the
trend for co-working space started to ac-
celerate over 2018. It is in that segment
that Copenhagen is seeing new develop-
ments going forward as international in-
vestors and developers started building
co-working spaces and office hotels.
Concept developers look primarily at the Net absorption Vacancy rate
(thousand m2) (% )
best locations in Copenhagen, which is cru-
cial for co-working spaces. It is essential
that the property is located close to great 200 10
infrastructure, public transport, as well as
near other high-growth companies.
100 8 +20bp
Demand continues to be generated by 0 6
small and medium sized businesses who -100 4
are increasingly choosing flexible office fa-
cilities where they can expand quickly. -200 2
Large corporations are either actively buil- 15 16 17 18 15 16 17 18
ding their own headquarters to accommo-
date staff or pre-letting space. Diminished Office investment
supply plus ongoing space requirements (€ million) Prime office: rents & yields
resulted in pressure being maintained on (€/m²/ Prime rent Prime yield
2,000 year ) (%)
rents that stood at DKK 2,200/sq m/year
(€295/sq m/year) in the most central dis- 1,500 275 5
tricts of Copenhagen.
1,000 -29% 250 4.5
Investment in logistics property 500
225 4
almost doubled in 2018 200 3.5
Office investment volume was approxima- 0 12 13 14 15 16 17 18
15 16 17 18
tely €2bn for Denmark and what was par-
ticularly striking about 2018 is that invest-
ment in industrial and logistics properties Main office transactions - letting & sales
almost doubled from 4.5% to 8%. There are Occupier Space (m²) Building-address
positive prospects for the investment mar-
ket in 2019, as buyers still wish to acquire Visma E-conomic A/S 20,055 Gærtorvet 1-5
core prime properties even with a shortage Accenture A/S 6,690 Bohrsgade 35
of product. This dynamic is expected to Spaces (Regus) 5,544 Ny Carlsberg Vej 78
keep prime office yields low over 2019.
Main office transactions - investment
Source : BNP Paribas Real Estate
Buyer Price (€ m) Building-address
Klovern AB 193.5 Gammel Kongevej 60
Klövern 98.2 Fairway house, G4S HQ, IBM HQ, Sundhedshus Vanløse
Investment : source RCA
Constant Exchange Rate GLL 42.3 Købkes Plads / Constantin Hansens Gade
€/DKK (Q4 2018): 0.1340
18DUBLIN
Dublin’s thriving office market is expanding in size
and the quality of buildings on offer
Highest ever letting activity is seeing
CBD supply shortages emerge
The 2018 take up levels of 372,441 sq m in
the Dublin office market broke the 2017 re-
cord with an increase of 5.1%. The office
landscape is now unrecognisable when
considering 7 years ago take up levels were
as low as 120,000 sq m. The market conti-
nues to be dominated by the TMT sector
accounting for 51% of take-up. A large pro-
portion was Facebook’s decision to pre-let
more than 80,000 sq m at the former AIB
Bankcentre in Ballsbridge, the largest single
letting in the State’s history. Google were
particularly active taking more than
35,000 sq m of office space in Dublin across Take-up Vacancy rate
(thousand m2) (% )
five properties. Development generated more
than 130,000 sq m of new/refurbished office +5%
space in 2018 that was 84% pre-let. 400 10
A further 230,000 sq m of offices, 50% pre-
350 8 -170bp
let, is due for delivery over 2019. Prime ren-
tal growth moderated in 2018 with supply 300 6
increase in CBD locations. The high pre-let-
250 4
ting activity will see a significant tightening
of supply in city centre locations. Supply 200 2
shortages will push occupiers with large size 15 16 17 18 15 16 17 18
requirements to city fringe or prime subur-
ban locations this year. We expect rent le- Office investment
vels for prime suburban office developments (€ million) Prime office: rents & yields
to increase in 2019 for this reason.
(€/m²/ Prime rent Prime yield
Megadeals: a big component
2,000
+73% year ) (%)
1,500 600 6
of Dublin’s above average
investment volumes 1,000 500 5
The Irish market exceeded expectations in 400 4
2018 with €3.6bn invested, an annual in- 500
crease of 43%. This marked the fifth conse- 300 3
0 11 12 13 14 15 16 17
cutive year of growth exceeding the 10-year 15 16 17 18
average. Offices remain the dominant asset
class in Dublin with €1.4bn invested in 2018
Main office transactions - letting & sales
representing 45% of total turnover. 2018 saw
the growth of so-called ‘mega-deals’ Occupier Space (m2) Building-address Submarket
(€100m+) with 11 high value asset sales ac- Facebook 80,826 Former AIB Bankcentre, Ballsbridge, Dublin 4 City Centre
counting for 48% of the total turnover. Five of
these mega-deals involved prime office buil- Hubspot 10,501 1SJRQ, 1-6 Sir John Rogerson's Quay, Dublin 2 City Centre
dings. This compares with just 4 such deals IDA 10,405 Three Park Place, Hatch Street, Dublin 2 City Centre
in 2017 and reflects developers responding
to requirements by delivering buildings that
are to global standards and therefore attrac- Main office transactions - investment
Source : BNP Paribas Real Estate
tive to major international occupiers and in-
vestors alike. The prospects remain very po- Buyer Price (€ m) Building-address Submarket
sitive for 2019, with a number of large Confidential 175 Heuston South Quarter, Dublin 8 City Fringe
transactions already in progress expected to Triuva 164 No. 1 Dublin Landings, Dublin 1 City Centre
boost the share of office investment in ove-
JR AMC 106.5 No. 2 Dublin Landings, Dublin 1 City Centre
rall investment market turnover.
19EDINBURGH
Tightening supply levels and limited development place
upward pressure on prime rents
Edinburgh prime rents
hit new record peak
Over 2018, take-up levels reached
65,447 sq m, a 30% fall on the record le-
vels of 93,898 sq m recorded the previous
year. Whilst 2017 was characterised by a
number of large-scale deals from the fi-
nancial and public sectors, the average
deal size in 2018 fell with the largest
deal of the year being investment mana-
gement firm Baillie Gifford’s 5,789 sq m
letting at the recently completed grade A
The Mint Building. Despite a slight
Take-up Vacancy rate
slowing in demand, vacancy levels fell (thousand m2) (% )
from 8.8% at Q4 2017 to 7.5% at Q4 2018.
Grade A vacancy in particular is at extre-
mely low levels. 100
-30%
10
-130bp
The market recorded a very limited spe- 75 8
culative development cycle in recent
years. Only a few schemes have pro- 50 6
gressed speculatively, and a number of 25 4
the larger development sites have now
been built out or, as with the GPU letting 0 2
15 16 17 18 15 16 17 18
in 2017, pre-let to an occupier ahead of
construction. The speculative schemes
which have progressed, however, have Office investment
seen significant occupier interest: The
(€ million) Prime office: rents & yields
Mint Building is now fully let and Brodies (€/m²/ Prime rent Prime yield
acquired 3,955 sq m in 2018 at the 11,390 600 year ) (%)
sq m Capital Square scheme due for de- 450
-17% 450 6
livery in 2020. Prime rents rose by 3%
400 5.5
over the course of 2018 to stand at €413/ 300
sq m/year. At this level, prime rents are 350 5
150
at a new structural high. Further prime
300 4.5
rental growth could potentially be re- 0
12 13 14 15 16 17 18
corded over 2019 given the tight grade. 15 16 17 18
A supply market within the city.
Main office transactions - letting & sales
Overseas investors drive over 50% Occupier Space (sq ft) Building-address Submarket
of investment activity
Investment levels fell by 17% on 2017, Baillie Gifford 62,300 The Mint Building CBD
with annual volumes reaching €334m in Royal London 46,826 22 Haymarket Yards CBD
2018. Overseas investors accounted for Brodies 42,571 Capital Square CBD
over 50% of volumes. The largest sale of
the year comprised MAS Real Estate’s ac-
Main office transactions - investment
Source : BNP Paribas Real Estate
quisition of New Uberior House, leased to
Bank of Scotland, for £71m reflecting a Buyer Price (£ m) Building-address Space (sq ft)
yield of 5.81%. Prime yields moved in si-
MAS Real Estate 71 New Uberior House 158,423
gnificantly over the course of the year to
stand at 4.75%, now standing in line with Greenridge Regional UK 66 1 Tanfield 190,995
Birmingham and Manchester. PATRIZIA Immobilien AG 28 99 Haymarket Terrace 89,997
Constant Exchange Rate (Q4 2018 average) €/£: 1.1273
20FRANKFURT
The Frankfurt office market moves up a gear
Second-best take-up volume
of the last 15 years
The Frankfurt office market is still on an
upswing. Take-up of 678,000 sq m is the
second best result of the last 15 years and
it is 15% below the extraordinary result of
2017. Strength of demand is such that
take-up exceeded the ten year average by
an impressive 25%. Vacancy continued to
fall noticeably. At 1.14 million sq m, it is
almost 18% lower than a year ago. The de-
cline in vacancy for building with modern
space quality was even more pronounced,
with only 497,000 sq m left free, a 27%
drop on last year. As a result, the vacancy Take-up Vacancy rate
rate fell further and stands at 7.4% for the (thousand m2) (% )
overall market. This means that the
Frankfurt market has had the lowest va- 1,000 10
cancy rate since 2002, both in absolute
800
-15% 9
space in sq m and relatively as a propor-
tion of the stock. The very good demand, 600 8
-150bp
combined with a noticeably lower supply,
is causing rents to rise. In the past twelve 400 7
months, the top rent rose by 7 % to €528/ 200 6
sq m/year, the highest level since 2001. 15 16 17 18 15 16 17 18
Investment turnover reaches Office investment
new dimension (€ million) +50% Prime office: rents & yields
With a transaction volume of €10.23bn, the
Frankfurt investment market not only set (€/m²/ Office primePrime
Prime rent rent yield
8,000 year ) (%)
a new all-time high, it also broke through (€/m²/
Office prime yield
a barrier never before achieved: an annual 7,000 550)
year 5(%)
turnover in the double-digit billions range 500 4
6,000
for a German city.
450 3
In Frankfurt traditionally more is invested 5,000
in offices than in any other German city and 400 2
4,000 12 13 14 15 16 17 18
2018 is no exception. More than €8.4bn of 15 16 17 18
the transaction volume flowed into office
buildings, which corresponds to a share of
over 82%. This figure is exceptional even by Main office transactions - letting & sales
Frankfurt standards and is around 13%
Occupier Space (m2) Building-address Submarket
above the ten-year average.
The good market performance in conjunc- Commerzbank 38,500 Cielo 2.3 Centre West
tion with the positive outlook for Frankfurt Frankfurter 24,000 Europa-Allee 92 1.3 Inner City
led to a further decline in net prime yields Allgemeine Zeitung
for some asset classes. For office proper- Siemens 20,000 Gateway Gardens 4.7 Airport
ties, they fell below the 3% mark for the
first time in the last quarter of 2018 and
Main office transactions - investment
Source : BNP Paribas Real Estate
currently stand at 2.95%.
Buyer Price (€ m) Building-address Submarket
Commerz Real 690 OmniTurm F | 1.1 Banking District
Igis/Hana Financial Investment 670 Trianon F | 1.1 Banking District
Fubon Life 530 Eurotower F | 1.1 Banking District
21GENEVA
Expanding office stock and flourishing investment market in Geneva
New submarkets created
by development in Geneva
Office space vacancies increased significant-
ly between 2017 and 2018. According to
OCSTAT, the new stock of vacancies is
226,000 sq m. The vacancy rate is stable
around 5% according to cantonal statistics,
while other specialists speak of a rate clo-
ser to 9%, taking into account leases not
placed on the market and the departure of
tenants with current leases. Although the
vacancy rate has risen sharply since 2015,
with deliveries of new projects, this The investment market in the prime yield to less than 3% (confirmed
situation is improved because of higher is healthy with yields below 3% by the capitalization rate used by the Tax
demand. New projects in the urban periphe- The investment market continues to flourish Administration at 2.88%). Institutional and fo-
ry (Plan-les-Ouates, Meyrin-Satigny, in the Geneva region with commercial buil- reign investors have liquidity to invest, but
Praille-Acacias-Vernets, the South Airport ding transactions of CHF 1,126bn in 2017 and they are becoming more attentive to the struc-
area, Vernier) supplied the stock with tens is expected to be in the same order of magni- ture and quality of tenants and lease terms
of thousands of sq m of space. The develop- tude for 2018 when final date is collected. because of the possibilities of relocation
ments represent a new submarket to the ol- Several transactions worth more than CHF created by the new developments. New pro-
der city centre buildings that mostly do not 100m occurred in the city in 2018. The balance jects without pre-leasing are therefore more
meet modern workplace needs. The histo- is still favourable to the seller with a decrease difficult to market.
ric user base (banks and financial compa-
nies) is reducing the space footprint and be- Net absorption Vacancy rate
coming more flexible and modular in usage; (thousand m2) (% )
that favours new buildings.
The older buildings are more difficult to
+140 bp
200 5
convert and costly as rents are generally 40
to 60% more expensive (sometimes even 100 4
much more) than in the outskirts. They are
0 3
also smaller with very few units over 1,000
sq m available. And yet the city center re- -100 2
mains highly sought-after by high profile
-200 1
companies. The feeling of security and pres- 15 16 17 18 15 16 17 18
tige of the location is still present in the
minds of companies that do not currently
know the peripheral regions as well. 2019 Main office transactions - letting & sales
may start to see relocations occurring to
Buyer Space m² Building-address
take advantage of rent differentials putting
downward pressure on pricing. Many new tenants > 15,000 m2 Esplanade 1 et 2, Pont Rouge
COFCO 9000 m2 Route de Malagnou 101-105
Main office transactions - investment
Buyer Price (million CHF) Building-address
Prime office: rents & yields Swiss Life 197 Esplanade 1, Pont-Rouge
(€/m²/ Prime rent Prime yield Bâloise 143 Esplanade 2, Pont-Rouge
Source : BNP Paribas Real Estate
year ) (%)
MSC 160 Eugène-Pittard 14-16, Genève
900 3
Axa Vie SA 81 Avenue des Morgines 2-4-6, Petit-Lancy
850 2.5
Axa Vie SA 218 Several buildings
800 2
PSP Real Estate AG 143 Several buildings
750 1.5
15 16 17 18
Constant Exchange Rate (Q4 2018 average) €/CHF: 0.8800
22GLASGOW
Investment market excels as occupier activity hits record high
Public sector demand helps propel
Glasgow take-up to historic high
Annual take-up levels for Glasgow hit a re-
cord high in 2018, reaching 86,146 sq m, up
87% on the subdued levels recorded in 2017.
The largest deal of the year comprised
HMRC’s pre-let of 18,395 sq m at the 1 At-
lantic Square development. This pre-let
forms part of the current Government Pro-
perty Unit’s consolidation programme to
create HMRC super-hubs across the UK, re-
placing smaller office locations. The public
sector also drove another large deal for the
city with the Department for Work and Pen-
sions acquiring 7,726 sq m at 1 Atlantic
Quay. However, the finance sector was also Take-up Vacancy rate
active across the year with incumbent (thousand m2) (% )
occupier Clydesdale Bank taking a pre-let
of 10,308 sq m at the Bothwell Exchange 100
+87% 12
scheme. These strong levels of take-up led
to a 150 bps fall in vacancy, with levels now 75 11
standing at 9.5%, substantially below the
-150 bp
50 10
city’s long term average and the post-finan-
cial crisis peak of 16.8% in 2012. Looking 25 9
ahead, speculative development activity re- 0 8
mains constrained with just 3 schemes due 15 16 17 18 15 16 17 18
to complete by end-2020. Following the let-
ting of 1 Atlantic Square to HMRC, 2 Atlan- Office investment
tic Square (8,979 sq m) is progressing spe- (€ million) Prime office: rents & yields
culatively, whilst the 8,733 sq m Cadworks +68%
(€/m²/ Prime rent Prime yield
is underway alongside the remainder of Bo- 500 year ) (%)
thwell Exchange. Further falls in vacancy
400 380 6.5
could therefore occur over 2019 if take-up
levels remain steady. Following a few years 300 360 6
of static rental levels, 2018 saw prime rents 340 5.5
200
move on to €394/sq m/year, a rise of 5% on
300 5
2017. This growth has been driven by fal- 100 12 13 14 15 16 17 18
ling vacancy and strong demand. 15 16 17 18
Investment activity bounces Main office transactions - letting & sales
back as UK institutions return
Following a couple of years of relatively sub- Occupier Space (sq ft) Building-address Submarket
dued activity, investment volumes over 2018 HMRC 198,000 1 Atlantic Square CBD
reached €492m, a 68% rise on 2017. This was Clydesdale Bank 110,955 Bothwell Exchange CBD
driven by the return of UK Institutions, which
accounted for over 50% of total investment. Department for Work and Pensions 83,156 1 Atlantic Quay CBD
The largest investment of the year com-
prised Legal & General Retire’s agreement to Main office transactions - investment
Source : BNP Paribas Real Estate
forward fund the new 1 Atlantic Square
Buyer Price (£ m) Building-address Space (sq ft)
scheme pre-let to HMRC for £100m. With re-
gards to prime yields, 2018 recorded some Legal & General Retire 100 Atlantic Square 187,195
compression with prime yields moving in to Hermes REIM 78 Skypark, Elliot Place 508,131
stand at 5.25%, in from 5.35% in 2017. At this
BLME Investment Solutions 55 1 Atlantic Quay 121,729
level, Glasgow prime yields remain above
Birmingham, Edinburgh and Manchester. Constant Exchange Rate (Q4 2018 average) €/£: 1.1273
23HAMBURG
Historically excellent results for the hanseatic city
Low vacancy is fostering rental
increases in almost all submarkets
The Hamburg office market remains extre-
mely dynamic with take-up in 2018 total-
ling around 563,000 sq m. Although the re-
sult is around 8% below the record level of
the previous year, it is 11 % above the long-
term average and marks the third best re-
sult of all time.
For eight years now, declining vacancy le-
vels have been observed in the Hamburg
office market. At just 635,000 sq m, this
was down by more than 10% on the pre-
vious year and represents the lowest figure
since 2001. At 4.5%, the vacancy rate is at Take-up Vacancy rate
its lowest level in the last 20 years. (thousand m2) (% )
The continuous reduction in vacancy and
the increasingly tightening relationship 600 -8% 6
between supply and demand are leading to
a noticeable rise in rents in almost all sub- 550 5.5
markets. The prime rent rose by around 9%
to €348/sq m/year over the past twelve
500 5 -60 bp
months, which is the highest value ever re- 450 4.5
corded for the Hamburg office market. 400 4
A similarly positive development can also 15 16 17 18 15 16 17 18
be seen in average rents. They rose by 7 %
to €192/sq m/year across all markets in the Office investment
course of the year. (€ million) Prime office: rents & yields
+88%
(€/m²/ Prime rent Prime yield
A historic high created 3,000 year ) (%)
from single property deals (€/m²/
The Hamburg investment market achieved 2,500 350)
year 5
a record volume in 2018 with €5.90bn, 2,000 300 4
more investment than ever seen before.
250 3
Compared with the previous year, this re- 1,500
presents an increase of 66 %, and the ten- 200 2
1,000 12 13 14 15 16 17 18
year average exceeded by an impressive 83 15 16 17 18
%. Only in the boom year of 2007 has the
€5bn mark been surpassed before. Invest- Main office transactions - letting & sales
ment consisted of primarily of individual
deals whilst the proportion of portfolio Occupier Space (m2) Building-address Submarket
sales only reached 16%. This is in direct Beiersdorf 45,000 Unnastraße 2.5 Extended Inner City
contrast to 2007 when portfolio deals made
Deutsche Postbank 13,800 Ü30 - Ipanema 3.5 Centre North
63% of the volume. Office buildings account
for more than half of the investment vo- akquinet 12,000 Bramfelder Spitze 3.7 Remaining Municipal Area
lume at 52% and thus remain the most po-
pular asset class. The net prime yield for Main office transactions - investment
office buildings was stabilised for most of
Buyer Price (€ m) Building-address Submarket
Source : BNP Paribas Real Estate
2018 before falling again by 10 basis points
at the end of the year to stand at 3.05%. Consortium of medical 400 Springer Quartier HH | 1.1 City Centre
pension funds
Ärzteversorgung Westfalen-Lippe 270 Olympus HH | 2.1 Centre South
(ÄVWL) and Hines
Real I.S. 180 Sumatra Kontor HH | 1.3 HafenCity
24You can also read


