FRESHWATER AQUACULTURE IN THE EU - EUMOFA
←
→
Page content transcription
If your browser does not render page correctly, please read the page content below
FRESHWATER AQUACULTURE IN THE
                       EU

                                 APRIL 2021

                            WWW.EUMOFA.EU

    Maritime affairs
     and Fisheries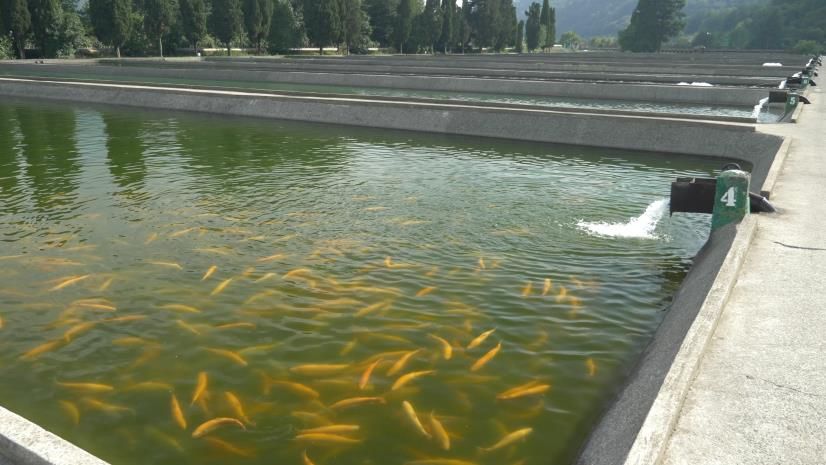
Manuscript completed in April 2021.

The European Commission is not liable for any consequence stemming from the reuse of this publication.

Luxembourg: Publications Office of the European Union, 2021
© European Union, 2021

The reuse policy of European Commission documents is implemented based on Commission Decision
2011/833/EU of 12 December 2011 on the reuse of Commission documents (OJ L 330, 14.12.2011, p. 39).

Except otherwise noted, the reuse of this document is authorised under a Creative Commons Attribution 4.0
International (CC-BY 4.0) licence (https://creativecommons.org/licenses/by/4.0/). This means that reuse is
allowed provided appropriate credit is given and any changes are indicated.

For any use or reproduction of elements that are not owned by the European Union, permission may need to
be sought directly from the respective rightholders. The European Union does not own the copyright in relation
to the following element:

cover photos: Kopytin Georgy, source: Shutterstock; Fehmiu Roffytavare, source: Shutterstock.

PDF            ISBN 978-92-76-38492-2             doi:10.2771/594002           KL-09-21-210-EN-N

FOR MORE INFORMATION AND COMMENTS:
Directorate-General for Maritime Affairs and Fisheries

B-1049 Brussels

Tel: +32 229-50101

E-mail: contact-us@eumofa.eu
EUMOFA - European Market Observatory for Fisheries and Aquaculture Products
Freshwater aquaculture in the EU
Table of contents
1. CONTEXT AND OBJECTIVES ................................................................................................................ 2
1.1. Context ........................................................................................................................................2
1.2. Objective......................................................................................................................................3
1.3. Methodology ...............................................................................................................................3
2. DATA COLLECTION SYSTEMS ON FRESHWATER AQUACULTURE IN THE EU ...................................... 4
3. OVERVIEW OF FRESHWATER AQUACULTURE PRODUCTION ............................................................. 9
3.1. General overview.........................................................................................................................9
3.1.1. Market for human consumption.............................................................................................................................9
3.1.2. Market for restocking ................................................................................................................................................11
3.1.3. Sport/leisure fisheries ...............................................................................................................................................13
3.1.4. Ornamental fish production ...................................................................................................................................13
3.2. Main reared freshwater species in the EU ............................................................................... 14
3.2.1. Trout production ...........................................................................................................................................................15
3.2.2. Carp production.............................................................................................................................................................16
3.2.3. Other freshwater species ........................................................................................................................................18
3.3. Main production methods in the EU freshwater aquaculture sector ...................................... 21
3.3.1. Extensive production in ponds ..............................................................................................................................21
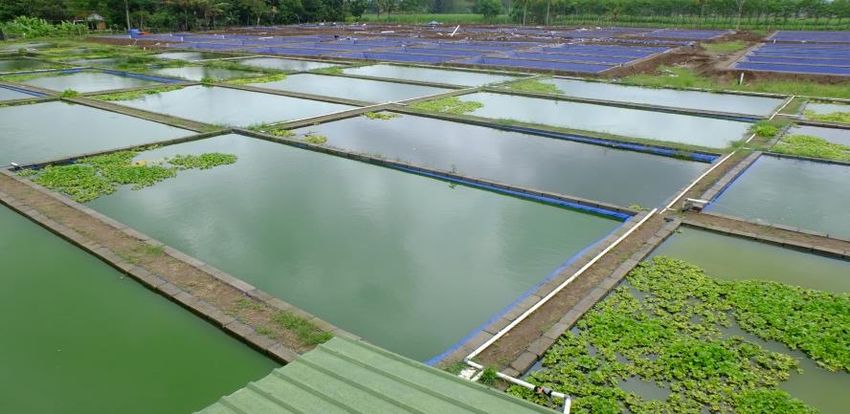
3.3.2. Intensive freshwater aquaculture production in tanks and raceways ...........................................22
3.3.3. Intensive aquaculture production in recirculation systems .................................................................23
3.4. Socio-economic and environmental importance of freshwater aquaculture in the EU .......... 26
3.4.1. Socio-economic importance of freshwater aquaculture .......................................................................26
3.4.2. Environmental benefits of freshwater aquaculture .................................................................................29
3.5. Supply chains for freshwater aquaculture products ................................................................ 33
3.5.1. Carp supply chain ........................................................................................................................................................33
3.5.2. Trout supply chain .......................................................................................................................................................35
3.5.3. Trade of selected species in the EU ..................................................................................................................36
3.6. Freshwater aquaculture fish markets and consumption ......................................................... 37
3.6.1. Carp market and consumption .............................................................................................................................37
3.6.2. Trout market and consumption ...........................................................................................................................39
4. ASSESSMENT OF THE ECONOMIC PERFORMANCE OF FRESHWATER AQUACULTURE AND ITS LEVEL
OF INNOVATION ............................................................................................................................... 42
4.1. Economic performance ............................................................................................................ 42
4.1.1. Economic performance of the trout segment .............................................................................................42
4.1.2. Economic performance of the carp segment ..............................................................................................44
4.2. Assessment of the level of innovation in the sector ................................................................ 45
i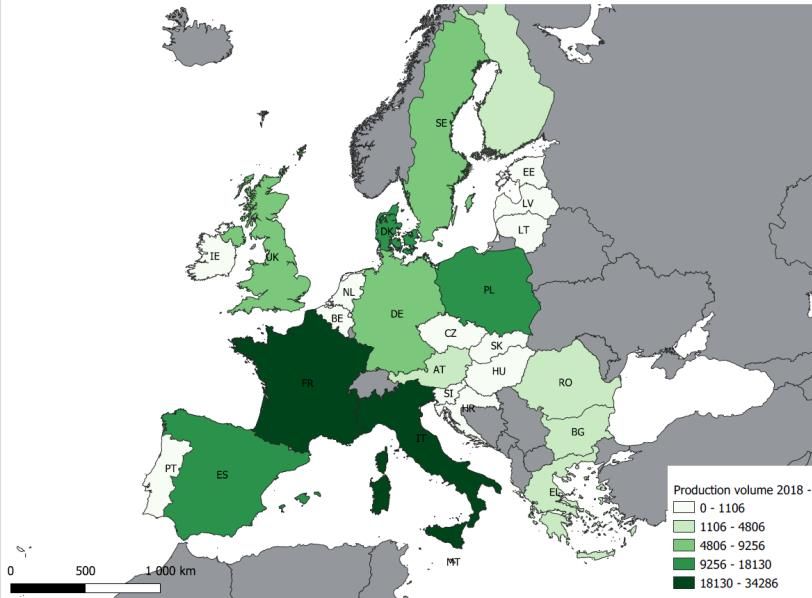
EUMOFA - European Market Observatory for Fisheries and Aquaculture Products
                                                                                                                                             Freshwater aquaculture in the EU

       4.2.1. Development of environmentally sustainable fish production ..........................................................46
       4.2.2. Development and promotion of pond aquaculture system .................................................................48
       4.2.3. Development of the production of new species ........................................................................................49
       4.2.4. Prevention and treatment of fish diseases ..................................................................................................50
       4.2.5. New, efficient fish feeds based on novel ingredients.............................................................................51
       4.2.7. Summary of innovation strategies identified in the EU freshwater aquaculture sector and
              of lessons learned .......................................................................................................................................................54
5. EU SUPPORT TO THE FRESHWATER AQUACULTURE SECTOR .......................................................... 57
5.1.        EU governance of freshwater aquaculture .............................................................................. 57
5.2.        EU funding support to freshwater aquaculture ....................................................................... 58
6. ASSESSMENT OF THE POTENTIALITIES FOR THE DEVELOPMENT .................................................... 61
6.1. Growth drivers and barriers ........................................................................................................... 61
6.2.        Conclusion on the potential for growth ................................................................................... 64
6.3.        Recommendations.................................................................................................................... 66
7. ANNEXES .......................................................................................................................................... 68

List of tables

                                                                                                                                                                                       ii
EUMOFA - European Market Observatory for Fisheries and Aquaculture Products
                                                                                                                                    Freshwater aquaculture in the EU

Table 1 – List of sources used, regulatory framework, description and shortcomings and gaps ......................... 7
Table 2 – Freshwater aquaculture production in the EU member states – tonnes ............................................. 10
Table 3 – Production of eggs for human consumption in the EU ........................................................................ 10
Table 4 – Rainbow trout production in the EU (with production > 5.000 tonnes) –Tonnes ................................ 16
Table 5 – Common carp production in EU MS (with production > 1.000 tonnes) ............................................... 17
Table 6 – Mapping of the RAS production within the EU ..................................................................................... 24
Table 7 - Production volume in RAS by Member State - Tonnes ......................................................................... 25
Table 8 – Number of enterprises and employees involved in the EU freshwater aquaculture – 2018 ............. 28
Table 9 – Fishpond areas for some EU MS and coverage of Natura 2000 sites (Natura 2000 hosting
aquaculture activities) .......................................................................................................................................... 31
Table 10 - EU carp markets in 2018 (Tonnes, Live weight equivalent) .............................................................. 34
Table 11 – The EU main markets for trout in 2018 (tonnes, Live weight equivalent) ........................................ 36
Table 12 – Economic performance for the EU trout aquaculture in 2017 and 2018 ......................................... 43
Table 13 – Economic performance by production system................................................................................... 44
Table 14 - Extra cost and price premium of organic carp and trout in selected MS .......................................... 54
Table 15 – Share of pond aquaculture production in MS’ production (freshwater and total) and choices of MS
to ask for EMFF support to aquaculture providing environmental services (art. 54 – EMFF 2014-20) ............. 59

List of figures
Figure 1 – EU (28 MS) aquaculture production by type of environment (brackish water, freshwater and marine)
– Volume in tonnes ................................................................................................................................................. 2
Figure 2 – Breakdown of EU production of fish eggs for human consumption in 2018 in volume (left) and in
value (right) ........................................................................................................................................................... 11
Figure 3 – Breakdown of EU production for human consumption (fish and fish eggs) in 2018 in value .......... 11
Figure 4 - EU production of freshwater fish juveniles in 2018 (million) ............................................................. 12
Figure 5– Production volume of Salmonids (left) and of Cyprinids (right) of EU MS in 2018 (tonnes) .............. 14
Figure 6 – Main farmed species in the EU member states in 2018 in volume (left) and in value (right) .......... 14
Figure 7 – World production of rainbow trout – Tonnes ...................................................................................... 15
Figure 8 - EU production of catfish, eel and sturgeon - Tonnes .......................................................................... 18
Figure 9 – Main catfish EU producers – 2018 ..................................................................................................... 19
Figure 10 – Main EU producers of European eel - 2018 ..................................................................................... 20
Figure 11 - Sturgeons main EU producers - 2018 ............................................................................................... 20
Figure 12– Pond production of cyprinids (Common carp, Silver carp, Bighead carp, etc.) – Tonnes .................. 22
Figure 13 – Rainbow trout production in tanks and raceways – Tonnes ............................................................. 23
Figure 14 – Share of freshwater aquaculture in apparent fish consumption at EU and MS levels ................... 27
Figure 15 – Average wages from freshwater aquaculture and comparison with the EU mean equivalised net
income in 2018 – (1.000 EUR) ............................................................................................................................. 29
Figure 16 –Intra-EU trade by preservation types in the main importing and exporting MS – 2018 .................. 34
Figure 17 – Extra-EU imports of trout from Turkey (in its different preservation forms) – Tonnes .................. 35
Figure 18 – Extra-EU trade of selected freshwater species (tonnes, live Weight Equivalent) ............................ 36
Figure 19 – Household consumption of fresh carp in Germany and Poland – Tonnes/month ........................... 38
Figure 20 - Retail price of fresh carp consumed by households in Germany and Poland - EUR/kg ................... 38
Figure 21 - Retail prices of whole fresh trout consumed by households in selected MS ................................... 40
Figure 22 - Monthly purchase of fresh salmon and fresh trout in France and Germany (tonnes/month) – 2015-
2020 ...................................................................................................................................................................... 41
Figure 23 – Economic indicators for trout aquaculture – 2008-2018 ................................................................ 43
Figure 24 – Summary of innovation strategies identified in the freshwater aquaculture sector in the EU ....... 54
Figure 25 - Current achievements of the EU target on aquaculture production ................................................. 64

List of abbreviations

                                                                                                                                                                           iii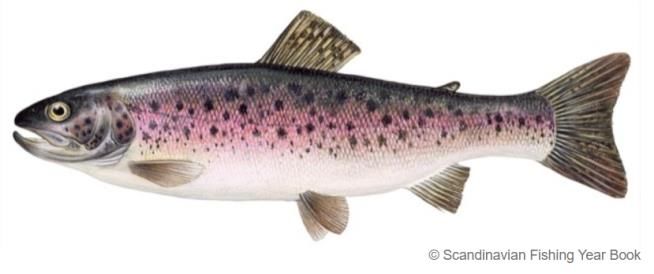
EUMOFA - European Market Observatory for Fisheries and Aquaculture Products
                                                                                     Freshwater aquaculture in the EU

 Acronyms/ Abbreviations                   Definition
 CIE                                       Combined Intensive-Extensive
 EBIT                                      Earnings Before Interests and Taxes
 EMFF                                      European Maritime Fisheries Fund
 EMFAF                                     European Maritime Fisheries and Aquaculture Fund
 EU                                        European Union
 EUMOFA                                    European Market Observatory for Fisheries and Aquaculture sector
 FAO                                       Food and Agriculture Organization
 FAP                                       Fisheries and Aquaculture Products
 FEAP                                      Federation of European Aquaculture Producers
 FET                                       Full-Equivalent Time
 DCF                                       Data Collection Framework
 DCF/EU-MAP                                Data Collection Framework/ European-Multi-Annual Programme
 GVA                                       Gross Value Added
 IMTA                                      Integrated Multi-Trophic Aquaculture
 LWE                                       Live Weight Equivalent
 MANP                                      Multi-Annual National Plan for the development of aquaculture
 MS                                        Member State
 NA                                        National Authority
 PDO                                       Protected Designation of Origin
 PGI                                       Protected Geographical Indication
 RAS                                       Recirculating Aquaculture System
 ROI                                       Return On Investment
 TSG                                       Traditional Speciality Guaranteed

                                                                                                                  iv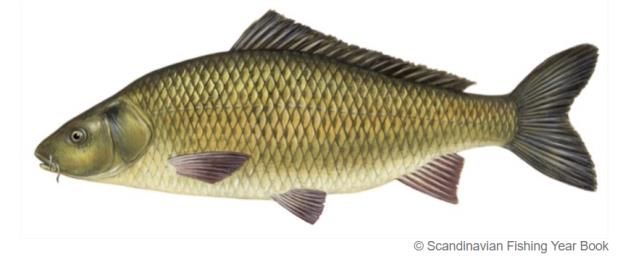
EUMOFA - European Market Observatory for Fisheries and Aquaculture Products
                                                                                            Freshwater aquaculture in the EU

EXECUTIVE SUMMARY
In the last 20 years the freshwater aquaculture sector in the EU has faced several constraints
including lack of investment and innovation, low diversity of products in the market (e.g. mainly live
and fresh products for carp), a high degree of seasonality (related to traditional carp dishes), strict
environmental regulations and increasing bureaucracy, climate change, etc.
The importance of the freshwater aquaculture sector is underestimated in Europe. This is due to the
low coverage of the data collection systems and the low understanding of the role played by the
freshwater aquaculture in providing food and employment opportunities while maintaining European
landscapes and cultural heritage.
This study provides an overview of the freshwater aquaculture sector, its role and its specificities
across the European Union and highlights the main challenges and opportunities to its growth.
Although freshwater aquaculture contributes to 20%1 of aquaculture volume in the EU, there is still
considerable potential for sustainable growth of production and improvement of food security.
In Europe, the freshwater aquaculture sector is represented through a wide range of production
methods ranging from the most extensive ones (i.e. pond farming) to the high technological intensive
methods. While the extensive methods provide socio-economic services to local communities,
maintain areas of environmental importance and conserve traditions and cultural heritage of
producing and consuming fish, innovative intensive methods bring higher production yields while
managing environmental impacts (i.e. energy-efficient recirculating aquaculture systems).
Rainbow trout and common carp are the most important produced species in freshwater within the
EU (60% and 23% of the EU production volume respectively in 2018). While trout is reared in intensive
systems, carp is produced through more extensive and traditional techniques. Although carp
production has stagnated in the last decade, the fish continues to play an important role in Eastern
Europe where religious holidays are hardly conceivable without carp. During these periods (mainly
Christmas and Easter), demand for carp is important where the fish is bought fresh or even live, which
reinforce the image of a festive product (i.e. seasonal consumption), inconvenient for everyday
consumption. Unlike carp, trout has a strong image of convenient product. The differentiation
strategies allow to offer new products to consumers and to sell at higher prices.
The future growth of the freshwater aquaculture sector is linked to the ability of the sector to manage
to sustainably increase production through tailored and innovative solutions. This could concern, for
example, the development of environmentally sustainable fish production (i.e. energy-efficient
recirculating aquaculture systems, integrated-multitrophic aquaculture, the development of
production of new species, etc.). Innovation in freshwater aquaculture sector remains at early stages
and should be further encouraged and reinforced. The adoption of innovative solutions within the
sector should be driven by appropriate regulations, simplified procedures and improved access to
funding.
The future growth is also linked to improved processing and marketing strategies to provide
diversified products which could promote sales outside the typical marketing season for carp, to
increase the demand of freshwater fish and to promote the consumption of new species.
The recognition of the role of the aquaculture sector in Europe should go through an accurate
monitoring of the freshwater aquaculture sector (i.e. an adapted data collection framework) and an
accurate understanding of the specificities and the benefits associated to fish pond farming.

1
  Average of the share of freshwater aquaculture production in the total EU aquaculture production in terms of volume in
the last ten years.

                                                                                                                          1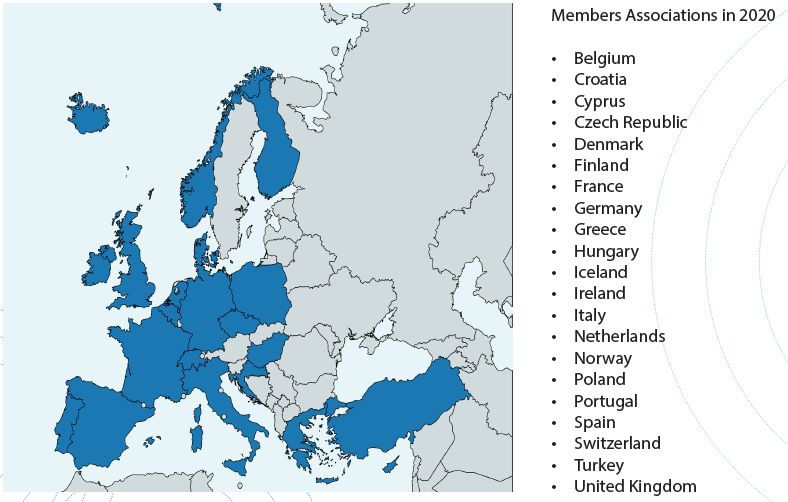
EUMOFA - European Market Observatory for Fisheries and Aquaculture Products
                                                                                             Freshwater aquaculture in the EU

1. CONTEXT AND OBJECTIVES

1.1. Context
The freshwater aquaculture production has decreased since the beginning of the 21st century.
However, there are significant growth opportunities due to the increasing gap between supply and
demand for fish products resulting from the stagnation or decline of marine catches and increased
demand. In addition, some types of freshwater aquaculture (especially pond aquaculture) provide
environmental services (biodiversity conservation, water and landscape management, climate change
regulation, etc.) and have a link to cultural heritage and culinary traditions of local communities.

    Figure 1 – EU (28 MS) aquaculture production by type of environment (brackish water,
                         freshwater and marine) – Volume in tonnes

                                         Source: EUMOFA based on FAO Fish Stat
According to FAO, there is an estimated need to increase the global protein supplies from meat and
seafood by about 200 million tonnes to nearly 500 million tonnes by 2050. Seafood, particularly from
aquaculture, is expected to contribute significantly to meeting this need. Considering FAO estimates
of average annual seafood consumption, the predicted demand of fish for human consumption would
almost double to at least 220 million tonnes in 2050, with aquaculture expected to provide over 70%
of the volume.
Considering the potential for growth of the sector and its benefits, an alliance of 11 Member States
(MS) called in 2018 for strengthening the support to freshwater aquaculture after 20202. They
propose a strategic approach based on multi-annual development plans focusing on nine priorities
related to innovation, support to investment and growth, compensation for environmental services,
promotion and marketing, data collection, control, and organization of producers.

2
 Joint declaration of Austria, Croatia, Czech Republic, France, Germany, Hungary, Poland, Romania, Slovakia, Slovenia and
Spain on the future development of freshwater aquaculture in the EU after 2020
https://www.consilium.europa.eu/register/en/content/out?&typ=ENTRY&i=LD&DOC_ID=ST-6883-2018-REV-1

                                                                                                                           2
EUMOFA - European Market Observatory for Fisheries and Aquaculture Products
                                                                                               Freshwater aquaculture in the EU

    1.2. Objective
    The objective of this study is to have a better understanding of the specificities of freshwater
    aquaculture, and in particular its market dimension. The study covers the following themes:
              -       Socio-economic importance and market dimension of freshwater aquaculture in the EU
                          •   Contribution in terms of food supply, growth and jobs;
                          •   Markets for freshwater aquaculture products (per MS and segments of the
                              sector);
                          •   Trade flows in freshwater aquaculture products (both intra- and extra-EU);
                          •   Market share of freshwater aquaculture products on the market.

              -       Benefits of freshwater aquaculture
                          • Social and economic benefits;
                          • Environmental benefits.
              -       Innovation potential and trends (technical, products, marketing)
                          •   Assessment of the level of innovation in the sector (identification of the main
                              drivers);
                          •   Existence and importance of initiatives to add value to freshwater aquaculture
                              products.
              -       Perspectives: assessment of growth potential for freshwater aquaculture in the EU.

    1.3. Methodology
    The implemented methodology is based on two complementary approaches:
-       Desk research Different complementary statistical sources have been used to gather data on
        fisheries and aquaculture production, processing and trade (e.g. EUROSTAT, FAO FISHSTAT J,
        DCF/EUMAP, EUMOFA, COMEXT, PRODCOM, etc.). The use of these sources is explained in section
        2 (“Data collection systems”).

-       Stakeholders consultation: two types of consultations have been conducted during the study:
                  •     National authorities survey: a questionnaire was addressed by e-mail to the National
                        Authorities (NA) in the MS with significant freshwater aquaculture production.
                  •     Interviews3 with the main professional organisations in 13 MS. The list of stakeholders
                        consulted is provided in annex 1.

    3
     Interviews were initially planned to be conducted face to face. However, due to the COVID-19 pandemic, they were
    conducted by phone or videoconference.

                                                                                                                             3
EUMOFA - European Market Observatory for Fisheries and Aquaculture Products
                                                                                   Freshwater aquaculture in the EU

2. DATA   COLLECTION     SYSTEMS                                              ON      FRESHWATER
   AQUACULTURE IN THE EU
This section provides an overview of data sources used in this study which constitutes the data
collection systems of the freshwater aquaculture sector in the EU. The following table provides the
list of these sources, their regulatory framework, a description of their content (i.e. variables and
units), their updating frequency, the last available year (by 31st November 2020), their geographical
coverage and a comment on gaps identified. These sources include:

     -    European Fisheries Statistics – EUROSTAT
     -    Data Collection Framework (DCF)/ European Union-Multi-Annual Programme (EU-
          MAP)
     -    Fish Stat of the Food and Agriculture Organisation (FAO) of the United Nations
     -    Aquaculture production reports of the Federation of European Aquaculture
          Producers (FEAP).

The analysis of these different sources from the three following perspectives: 1) data coverage,
2) data availability and 3) data quality, has resulted on the following conclusions:

     -    Data coverage:
             o The first evidence is that EUROSTAT and DCF/EU-AMP cover EU Member States (in
                 addition to Iceland, Norway, Montenegro, Serbia and Turkey in the case of EUROSTAT)
                 while FAO provides global statistics on aquaculture production. FEAP statistics only
                 cover MS with national aquaculture organizations being members of the federation.
             o The second is the low coverage of socio-economic data of the freshwater aquaculture
                sector provided by DCF/EU-MAP in relation to i) the voluntary basis of the submission
                of inland freshwater aquaculture data under DCF/EU-MAP (see following table and
                annex 2 for more details about the DCF/EU-MAP coverage); ii) the threshold set in EU-
                MAP regulation below which it is not mandatory for Member States to collect data
                (1% of the EU production and 10% of national production).
     -    Data availability: data for freshwater aquaculture sector are published once a year for the
          three data sources. The latest year available at the time of writing this report was 2018 for
          EUROSTAT, FAO and DCF/EU-MAP. FEAP 2019 statistics were published in December 2020
          and partly integrated when providing relevant information (data in Annex 3).
     -    Data quality: significant discrepancies have been identified on production data from
          DCF/EU-MAP and EUROSTAT. The Scientific, technical and Economic Committee for Fisheries
          (STECF) studied these discrepancies for each Member State and concluded that they relate
          to different scopes and data collection methods between both sources. Reasons for
          discrepancies could concern the fact that:
               o     the DCF/EU-MAP system considers an aquaculture firm only if the main activity of
                     that firm is aquaculture, leaving secondary aquaculture out of scope.
               o     the DCF/EU-MAP does not distinguish the component sold for consumption to that
                     sold to other aquaculture enterprises for fattening. EUROSTAT distinguishes
                     production for human consumption from production of juveniles used for further
                     production phases (raising on farms).

                                                                                                                 4
EUMOFA - European Market Observatory for Fisheries and Aquaculture Products
Freshwater aquaculture in the EU
Considering these elements, it was decided to use:
- EUROSTAT data to study the freshwater aquaculture production. In fact, EUROSTAT
distinguishes the production for human consumption, the production of eggs for human
consumption (e.g. trout eggs, caviar) and the production of juveniles to be released to the wild
or to be used for further raising phases.
- FEAP statistics, as they provide complementary information to EUROSTAT (for example:
distinction between portion size and large rainbow trout) and more recent information: 2019
data were available in December 2020.
- FAO Fish Stat long time-series data from 1950 onwards, to compare EU production with non-
EU production.
- DCF/EU-MAP to study the socio-economic situation of the freshwater aquaculture sector, even
though several data gaps have been identified for the most important producing countries
(particularly the landlocked countries which are not requested to provide economic data under
DCF/EU-MAP).
- National statistics (publicly available or provided in the context of this study) have been used
in cases when data from the other sources were not available or when NA considers for
several reasons that national statistics as more reliable (case of German and Danish
statistics).
5EUMOFA - European Market Observatory for Fisheries and Aquaculture Products
Freshwater aquaculture in the EU
Table 1 – List of sources used, regulatory framework, description and shortcomings and gaps
Latest
EU/ Data source - Regulatory Update Geographical
Description: Variables and units available Data shortcomings and gaps
Non-EU Data holder framework frequency coverage
year
EU European Regulation (EC) 1- Aquaculture production at first sale for Annual, 2018 All the Fish_aq5 which gathers statistics on
Fisheries No 762/2008 human consumption (fish_aq2a), by species, by available at aquaculture the structure of the aquaculture
Statistics - on the submission FAO major area, by cultivation method, by aquatic Eurostat activities sector (every three years) is not
EUROSTAT by Member States environment in TLW (tonnes live weight), in Euro and webpages from conducted in published for the moment.
of statistics on Euro/TLW. Non-commercial aquaculture is thus not 2008 onwards freshwater and
aquaculture and accounted for. Moreover, aquaculture production of saltwater on
repealing Council aquarium and ornamental species is excluded, as the territory of
Regulation (EC) No well as production for research purposes. the Member
788/96 2- Production of fish eggs (roe) at first sale for States.
human consumption (fish_aq2b) by species, by
major area, by aquatic environment in TLW, Euro
and Euro/TLW. This dataset has not been used in the
context of this study.
3- Input to capture-based aquaculture
(fish_aq3), i.e. wild stock by species in TLW, Euro
and Euro/TLW.
4- Production of hatcheries and nurseries at
eggs stage at first sale (fish_aq4a), by species
in millions and by destination and use (released to
the wild, used for raising on farms).
5- Production of hatcheries and nurseries at
juveniles stage (fish_aq4b), by species, in
millions of juveniles and by destination and use
(released to the wild, used for raising on farms).
7EUMOFA - European Market Observatory for Fisheries and Aquaculture Products
Freshwater aquaculture in the EU
Latest
EU/ Data source - Regulatory Update Geographical
Description: Variables and units available Data shortcomings and gaps
Non-EU Data holder framework frequency coverage
year
DCF/EU-MAP - Regulation (EU) 1 - Production data volume and value of sales by Annual, 2018 Submission of inland freshwater
European 2017/1004 and species. available at aquaculture data is voluntary.
Commission Commission 2- Socio-economic data, by aquaculture type JRC website Aquaculture data is not requested
Joint Research Implementing and by segment (following the EU-MAP from 2008 from landlocked countries: Austria,
Centre (JRC) Decision (EU) typology): Income, Personnel costs, Energy costs, onwards Czech Republic, Hungary and
2016/1251 Raw material costs, Repair and maintenance costs, Slovakia.
Other operational costs, Capital costs, Financial Belgium and Lithuania only produce
income and Financial expenses, Capital value, Net aquaculture products in freshwater.
Investments, Subsidies in investments, Debt, Raw Thus they do not carry out any data
material volume (livestock and feed), Volume of collection within the DCF and EU-
sales, Employment (Number of persons employed MAP frameworks.
their FTE national, number of unpaid labour and their Estonia, Poland, Slovenia and the
FTE, etc.) and number of enterprises. Netherlands did not submit data
under the EU-MAP data call and
Hungary and Slovakia submitted
partial data.
Non-EU FishStat - Food Pursuant to its Production volume and value by species, country or Annual, 2018 Global
and Agriculture membership to the area, fishing area and culture aquatic environment available at
Organisation FAO, the EU FAO website
(FAO) of the Member States from 1950
United Nations has the duty to onwards
transmit certain
statistics to FAO’s
statistics service.
EU Federation of None - voluntary Production volume by country and main species. 2018, 2020 2019 17 MS plus The Data gaps due to confidentiality
European UK, Norway, rules and/or unavailability for some
Aquaculture Iceland, Faroe country and species.
Producers Islands and
(FEAP Turkey
Source: EUMOFA elaboration
8EUMOFA - European Market Observatory for Fisheries and Aquaculture Products
Freshwater aquaculture in the EU
3. OVERVIEW OF FRESHWATER AQUACULTURE PRODUCTION
Main findings:
❖ In 2018, 275.000 tonnes were produced in freshwater aquaculture facilities for a value of circa
910 million EUR, dominated by cyprinids and trout production. The largest producers were France (14% of
EU production in volume), Poland (13%), Italy (13%), Denmark (9%), Czechia (8%).
❖ Egg production for human consumption (trout eggs and caviar) reached 307 tonnes and 78,7 million EUR
in 2018, with Italy, France, Spain and Poland being the main producers (87% of egg production).
❖ Freshwater aquaculture production has been facing serious constraints and has decreased since the
beginning of the 21st century. Both EU trout and carp production have decreased in terms of volume by
-15% and -10%, respectively, between 2009 and 2018.
❖ Rainbow trout is farmed in nearly all EU MS. 156.000 tonnes were produced in the EU in 2018, with more
than two thirds in tanks and raceways, but Recirculating Aquaculture System (RAS) facilities have increased
in recent years (mainly in Denmark). The main EU producers are Italy (21% of EU production), France (21%),
Denmark (12%), Spain (10%) and Poland (10%).
❖ Carp is mainly produced in ponds. The EU produces around 70.000 tonnes of common carp annually. The
majority of production is concentrated in Central and Eastern Europe. Czechia, Poland and Hungary are the
top three EU producers (71% of EU production in 2018).
❖ Other species are farmed but in lower volumes. 9.000 tonnes of catfish species (mainly in Hungary and
Netherlands) are produced annually in the EU, 5.000 tonnes of European eel (mainly in Netherlands in RAS
and Germany) and sturgeons are produced but mainly for their eggs.
❖ Freshwater aquaculture products are sold in four main markets, namely the human consumption market
restocking, production of ornamental fish and sport/leisure fisheries.
3.1. General overview
In the EU there are four clear markets for freshwater aquaculture products, namely the human
consumption market, restocking, production of ornamental fish and sport/leisure fisheries.
3.1.1. Market for human consumption
The market for human consumption is the predominant outlet for freshwater aquaculture whether for
immediate local consumption or for distribution on a wider scale (e.g. through supermarkets, or for export)4.
EUROSTAT data have been used to draw an overview of the freshwater aquaculture production for the food
market in the EU. Where data gaps and issues were identified, national statistics were used as alternative
source.
In 2018, the freshwater aquaculture production for human consumption was estimated to be circa 275.000
tonnes5, generating a value of circa 910 million EUR. The freshwater aquaculture production contributed to
23% of the EU aquaculture production in 2018.
France, Poland and Italy are the main producers of freshwater aquaculture products. They contributed to
circa 40% of the EU freshwater aquaculture production in terms of volume and value. The other major
producers are Denmark, Czechia, Germany and Hungary.
4
Source: http://www.fao.org/3/y2792e/y2792e03.htm#TopOfPage
5
This figure was based on Eurostat production completed by national statistics when issues have been identified, namely for
Denmark, Germany, Greece and Ireland.
9EUMOFA - European Market Observatory for Fisheries and Aquaculture Products
Freshwater aquaculture in the EU
Table 2 – Freshwater aquaculture production in the EU member states – tonnes
MS 2009 2010 2011 2012 2013 2014 2015 2016 2017 2018
France 44.258 44.005 41.004 40.380 40.513 39.851 33.870 44.874 44.237 37.807
Poland 36.503 36.503 34.246 33.226 31.258 36.336 33.560 35.452 35.419 36.806
Italy 39.339 41.105 38.804 38.966 39.015 34.857 34.717 39.067 39.628 36.736
Denmark
22.291 17.739 19.048 19.024 19.678 19.529 20.405 19.058 19.010 25.120
*
Czechia 20.071 20.420 21.010 20.763 19.360 20.163 20.200 20.950 21.685 21.750
Germany
37.886 37.788 37.046 20.064 21.434 22.229 21.005 20.414 20.596 18.765
*
Hungary 14.171 13.637 15.509 14.558 14.383 15.366 17.337 16.520 18.258 17.900
Spain 18.960 17.929 17.088 16.775 16.216 15.513 16.589 17.627 17.257 16.456
Romania 13.131 8.781 8.352 9.996 10.130 10.640 10.981 12.561 12.798 12.298
Bulgaria 7.100 7.222 6.345 6.062 6.292 6.883 7.539 9.069 9.796 9.232
UK 13.524 12.994 11.858 13.345 11.159 11.127 10.540 10.424 9.848 8.742
Sweden 3.984 6.978 8.716 9.398 8.548 8.668 8.833 11.006 9.923 6.815
Others 28.534 25.410 24.960 22.946 25.590 24.642 27.035 27.096 25.827 26.361
EU 299.75 290.51 283.98 265.50 263.57 265.80 262.61 284.11 284.28 274.79
2 1 6 2 7 4 0 8 1 1
Source: EUROSTAT and *National statistics. The change in the German production since 2012 is related to a
modification in survey methodology in 2012
There are major differences in the species farmed between EU MS. For instance, in Eastern Europe the
production of cyprinids6 has traditionally dominate the market, while that for salmonids remains limited
even though in the last decade production of trout has increased.
The EU freshwater aquaculture sector also supplies fish eggs for human consumption. In 2018, 307
tonnes were produced representing a total value of 78,7 million EUR. The main producers of fish roe are
Italy, France, Spain and Poland that accounted for 87% of the total production volume and over 95% of the
production value in 2018.
Table 3 – Production of eggs for human consumption in the EU
MS Volume (Tonnes) Value (1.000 EUR)
2017 2018 2017 2018
France 119 147 23.040 25.520
Italy 46 61 23.948 38.446
Spain 30 36 1.755 1.827
Poland 23 22 9.284 9.110
Denmark - 17 - 505
Germany 11 10 4.557 2.978
Finland 7 9 103 145
Estonia 4 3 115 101
Cyprus - 0 - 50
Hungary 1 - - -
Total 241 307 62.802 78.683
Source: EUROSTAT
The production of fish eggs for human consumption in the EU concerns two groups of species: trout eggs
(62% of the total volume in 2018) and sturgeon eggs (caviar, representing 38%). This production has
significantly increased in the last ten years. The production volume increased by 63%, while the production
value has increased fourfold, mainly thanks to the development of caviar production that is highly valuable7.
The price of caviar ranges between 300 and 500 EUR/Kg, depending on the species, origin and volume8.
6
Cyprinids are the family of freshwater fish (Cyprinidae) that includes mainly carps.
7
Source: Economic Report of the EU Aquaculture sector (STECF-18-19).
8
Source: EUMOFA. The caviar market: production, trade and consumption in and outside the EU.
https://www.eumofa.eu/documents/20178/84590/The+caviar+market_EU.pdf
10EUMOFA - European Market Observatory for Fisheries and Aquaculture Products
Freshwater aquaculture in the EU
Caviar accounted for 38% of the EU production of eggs in volume but was up to 95% of the value of eggs
production in 2018.
Figure 2 – Breakdown of EU production of fish eggs for human consumption in 2018 in volume
(left) and in value (right)
Source: EUROSTAT
Although very small (generally concentrated in a few companies), the sector of fish eggs contributes
significantly to the turnover of freshwater aquaculture, due to the high retail prices of fish eggs9 (figure
below).
Figure 3 – Breakdown of EU production for human consumption (fish and fish eggs) in 2018 in
value
Source: EUROSTAT
3.1.2. Market for restocking
The market for restocking fish into rivers, lakes and reservoirs is of interest in the context of growing
environmental pressures on specific habitats and habitat restoration. Important wild freshwater fish species
are under threat from human activities in Europe. In this context, the release of farmed juveniles into wild
9
Source: https://agriculture.gouv.fr/la-pisciculture-production-et-consommation
11EUMOFA - European Market Observatory for Fisheries and Aquaculture Products
Freshwater aquaculture in the EU
population(s) to restore severely depleted spawning biomass to a level where it can once again provide
regular, substantial yields, called “restocking”, is being conducted10. In Europe, the Atlantic salmon (Salmo
salar), the European eel (Anguilla anguilla) and Sturgeons (different species) are diadromous migratory
fish that have seen massive population declines in the latter part of the 20th century. Restocking operations
take place in the context of the following legal frameworks:
✓ The Pan-European Action Plan for Sturgeons adopted in November 2018 (and implemented until
2029) aims at saving endemic European species from extinction. It covers eight European sturgeon
species (seven of which are critically endangered in the International Union for Conservation of Nature’s
Red List of Threatened Species while one is classified as vulnerable to extinction). It includes the
establishment of ex situ facilities to save living gene banks for each species, to develop brood stock of
sturgeons, to reproduce and rear juveniles and to release offspring in order to recover the historic
population in Europe11.
✓ Atlantic salmon stock rebuilding programmes are implemented under the framework of the
Convention for the Conservation of Salmon in the North Atlantic Ocean (established in 1984). Rebuilding
programmes include the constitution of gene banks and the production of smolt to be released. The aim
is the conservation of wild salmon stocks in the North of Atlantic Ocean12.
✓ Council Regulation No 1100/2007 of 18 September 2007 establishing measures for the
recovery of the stock of European eel, even though restocking European eel is mainly based on
transferring glass eels captured by professional fishing from estuaries to suitable areas rather than
restocking of adults (after cultivation).
✓ National programmes for restocking different non migratory species (e.g. the National Fish resources
restocking program in Latvia supports fish and crayfish restocking in public waters13).
Eurostat provides data on juvenile fish production14. This database distinguishes the production of juveniles
for further on-growing or for release to the wild, but due to confidentiality issues, some MS do not provide
this distinction. Consequently, it is not possible to distinguish the volumes destined to the different markets.
The figure below provides a picture of the production at EU level: 2.109 million of juvenile fish were produced
in the EU in 2018, with common carp and rainbow trout (mainly for further grow-out purposes) contributing
to almost 50% of the total production.
There are also restocking operations with adult fish. However, due to lack of data it was not possible to
consolidate a figure at EU level.
Figure 4 - EU production of freshwater fish juveniles in 2018 (million)
10
Source: A New Era for Restocking, stock enhancement and Sea Ranching of Coastal Fisheries Resources. Available at:
https://www.researchgate.net/publication/228357922_A_New_Era_for_Restocking_Stock_Enhancement_and_Sea_Ranching_of_C
oastal_Fisheries_Resources
11
Pan-European action plan for sturgeons, Convention on the Conservation of European Wildlife and Natural Habitats. Available
at: https://rm.coe.int/pan-european-action-plan-for-sturgeons/16808e84f3
12
Report of the 2017 Theme-based Special Session: Understanding the risks and benefits of hatchery and stocking activities to
wild Atlantic salmon populations (CNL(17)61), NASCO. Available at: https://nasco.int/wp-
content/uploads/2020/02/2017ThemeBasedSession.pdf
13
Economic Report of the EU Aquaculture sector (STECF-18-19).
14
The table is named “production of hatcheries and nurseries at juveniles stage in life cycle (fish_aq4b)”.
12EUMOFA - European Market Observatory for Fisheries and Aquaculture Products
Freshwater aquaculture in the EU
Source: EUROSTAT
3.1.3. Sport/leisure fisheries
Although hatcheries mainly serve the restocking and supply of on-growing production phases, many also
cultivate fish species for recreational fishing and sport fisheries that offer an attractive diversification
opportunity for some freshwater fish farms. Juvenile production for this purpose is not specifically identified
in the EUROSTAT data, but are combined with data on juveniles produced to release to the wild.
A significant share of adult fish grown by land-based farms is sold to fishing clubs for angling purposes.
This concerns both salmonids (brown and rainbow trout) and different species from extensive pond farms,
among these common carp (Cyprinus carpio), pike (Esox Lucius) and pikeperch (Sander lucioperca).
Due to a lack of data and unclear coverage of this segment15, it was not possible to consolidate a figure at
EU level.
The particularities of freshwater aquaculture markets are not considered in EU databases on production
and the various freshwater aquaculture markets are not clearly identified. However, it is possible to provide
some examples where these markets are clearly identified in National statistics. For instance, France reports
every year to EUROSTAT and FAO production data concerning adult fish sold for human consumption and
for river restocking or recreational fishing, according to which 26% of pond production are sold to angler’s
clubs and 22% are used for restocking16.
3.1.4. Ornamental fish production
Ornamental fish production for aquariums and garden ponds, may constitute another valuable
diversification activity for some land-based fish farms, especially Koi carp farming, which however is
considered partly out of the scope for this study.
Although the freshwater aquaculture sector contributes to these different markets, the present study
focuses on the contribution of freshwater aquaculture production to the supply of EU food markets.
15
It is unclear whether the statistics provided by MS to EUROSTAT and FAO include or not volumes on restocking (adult) and on
sport fishing.
16
Source: Agreste. 2020. Available at: https://www.agreste.agriculture.gouv.fr/agreste-
web/download/publication/publie/ChdAgri2003/C&D%202020_Aquaculture-2018V3.pdf
13EUMOFA - European Market Observatory for Fisheries and Aquaculture Products
Freshwater aquaculture in the EU
3.2. Main reared freshwater species in the EU
The freshwater aquaculture sector is dominated by two main groups of species: salmonids and cyprinids.
The geographic distribution of these two productions within the EU principally reflects different hydro-
climatic conditions, rainbow trout being more suitable for temperate environments, while carp being better
adapted to the more extreme continental conditions of Central Europe (hot summers, cold winters)17.
Figure 5– Production volume of Salmonids (left) and of Cyprinids (right) of EU MS in 2018
(tonnes)
Source: EUMOFA elaboration, based on EUROSTAT data
Rainbow trout and common carp production represents 83% (respectively 60% and 23%) of the EU
freshwater aquaculture production volume and 80% of its value (respectively 62% and 18%). These two
species require different aquaculture production techniques. While trout is mostly reared in intensive
systems, carps are produced through more extensive and traditional techniques. Other important species
are North-African catfish, herbivorous carp species (bighead carp, silver carp, grass carp, etc.), European eel,
sturgeons, and sea trout.
Figure 6 – Main farmed species in the EU member states in 2018 in volume (left) and in value
(right)
Source: EUROSTAT
17
Source: https://link.springer.com/article/10.1007/s10499-016-9992-1
14EUMOFA - European Market Observatory for Fisheries and Aquaculture Products
Freshwater aquaculture in the EU
3.2.1. Trout production
According to FAO, circa 680.000 tonnes of trout species were farmed in the world in 2018, the rainbow
trout (Oncorhynchus mykiss) being the dominant species with 97% of the volume. The other main salmonid
species reared in freshwater are brown trout (Salmo trutta) and brook trout (Salvelinus fontinalis). The main
producers are Iran (164.000 tonnes), the EU (138.00 tonnes), Turkey (103.000 tonnes) and Peru
(55.000 tonnes). The world production of rainbow trout reached circa 659.000 tonnes in 2018, which marks
an increase of 50% in 10 years, while the EU production decreased by 14% during the same period.
Figure 7 – World production of rainbow trout – Tonnes
Source : FAO
Rainbow trout (Oncorhynchus mykiss)
Rainbow trout is native to the Pacific coast of North
America. It was brought to Europe at the end of the
19th century and is today farmed in nearly all European
countries. Rainbow trout tolerates a wide range of
environments and handling.
The rainbow trout is the leading freshwater farmed species in Europe. Almost all rainbow trout on the EU
market comes from aquaculture (it does not reproduce naturally in most of European waters). Rainbow trout
can be farmed in both fresh and saltwater. The European production of farmed rainbow trout is influenced
mainly by portion-size fish (portion sizes of 200-300 gr). More than two thirds (68%) of the trout freshwater
production is still grown in tanks and raceways, but recirculation aquaculture facilities have increased in
recent years. About 10% of rainbow trout is produced in recirculating aquaculture system (RAS), mainly in
Denmark, while larger trout is produced in marine areas farmed using more traditional technology18.
EU production of rainbow trout reached over 156.000 tonnes in 201819. Italy, France (circa 33.000 tonnes
each), Denmark (19.010 tonnes), Spain (16.002 tonnes) and Poland (14.902 tonnes) are the major
18
Source: http://www.fao.org/fishery/culturedspecies/Oncorhynchus_mykiss/en
19
The EUROSTAT figure on rainbow trout production is above the FAO figure provided earlier in this report.
15EUMOFA - European Market Observatory for Fisheries and Aquaculture Products
Freshwater aquaculture in the EU
producers. Rainbow trout is the third most-reared species in France in terms of volume (19% of the marine
and freshwater aquaculture production in volume) and the second in terms of value (18% of the aquaculture
production value). France is also the world’s leading producer of trout eggs. Trout is the second most
important farmed species in Poland after carp, where trout is produced in inland raceways in northern Poland
and only few farms are using partly recirculating aquaculture systems.
Table 4 – Rainbow trout production in the EU (with production > 5.000 tonnes) –Tonnes
Evol.
MS 2009 2010 2011 2012 2013 2014 2015 2016 2017 2018 2018/0
8
Italy 35.802 35.697 34.366 35.261 35.004 31.300 30.503 34.307 34.407 32.826 -8%
France 35.152 34.545 30.806 30.627 30.818 29.347 23.489 35.674 34.906 32.593 -7%
Denmark -24%
25.120 22.291 17.739 19.048 19.024 19.678 19.529 20.405 19.058 19.010
*
Spain 18.429 17.382 16.546 16.302 15.797 15.104 16.154 17.209 16.829 16.002 -13%
Poland 14.872 14.872 10.398 10.724 10.251 13.449 12.727 13.730 13.808 14.902 0%
UK 12.309 11.988 10.996 12.515 10.502 10.798 10.161 10.092 9.559 8.496 -31%
Germany -65%
22.568 22.230 20.561 9.378 9.601 9.937 8.527 8.533 8.397 7.852
*
Sweden 3.982 5.576 7.490 7.448 6.641 6.951 7.048 9.123 8.505 6.716 69%
Others 14.761 15.624 15.368 12.154 12.327 12.451 12.939 13.709 14.195 17.666 20%
182.99 180.20 164.27 153.45 149.96 149.01 141.07 162.78 159.66 156.06 -15%
Total EU
5 4 1 7 4 4 6 2 4 4
Source: EUROSTAT / National statistics for Denmark and Germany. *) the decrease of the German production is
related to a modification in survey methodology in 2012.
FEAP statistics provide a slightly different figure, with circa 190.000 tonnes of rainbow trout produced within
the EU in 2018 and 2019 (which represents 22% more than EUROSTAT data). This difference is due to the
integration of fish produced for leisure fishing. FEAP data distinguish the production of portion size rainbow
trout, which represented 128.840 tonnes in 2019 (68% of the total EU production, with a reduction of
volume by 23% from 2008 to 2019) and the production of large trout, supplying the processing industry
(in majority for smoking) which reached 67.000 tonnes in 2019 (+ 66% from 2008). Detailed FEAP statistics
of rainbow trout by MS are available in Annex 3.
3.2.2. Carp production
50 million tonnes of Cyprinids were produced in the world in 2018. The carp species commonly produced in
the EU include common carp (Cyprinus carpio), bighead carp (Hypophthalmichthys nobilis), silver carp
(Hypophthalmichthys molitrix) and grass carp (Ctenopharyngodon idellus). The common carp is of particular
importance in the EU, where it constituted 96% of the EU carp production. The EU contributes only to 2% of
the world common carp production (circa 4,2 million tonnes in 2018), which is dominated by China (71%)
and other Asian countries (Indonesia, Myanmar, Vietnam, etc.).
16EUMOFA - European Market Observatory for Fisheries and Aquaculture Products
Freshwater aquaculture in the EU
Common carp (Cyprinus carpio)
The common carp is native to Asia and Eastern Europe.
Tolerant to variations in water quality and temperature, its
ecological spectrum is broad. It was introduced to Central
Europe about 2.000 years ago and today it is found all over
Europe, apart from Scandinavia. Carp particularly likes
slow-flowing or standing waters, such as the middle and
lower reaches of rivers, but also ponds and lakes20.
While carp is often grown in polyculture in Asia, monoculture systems are clearly preferred in Europe where
the carp is reared in natural or semi-natural ponds with high trophic capacity. Additional feeding with grain
or feed pellets is commonly provided to maximize growth potential during the warm season. Nowadays, the
spectrum of carp farming methods ranges from extensive natural ponds to net pens (in Poland) and flow-
through systems (mainly in Bulgaria). However, pond farming remains by far the dominant aquaculture
method for carps in Europe. Thus, in Europe, pond farming is associated/dominated with carp production.
The EU produces around 70.000 tonnes of common carp annually. Most of the production is concentrated
in Central and Eastern Europe. Czechia, Poland and Hungary are the top three EU producers responsible for
71% of the total EU common carp production in 2018. Germany and Romania produced over 4.000 tonnes
each. The German production has halved in the past ten years mainly since the interest of the pond owners
in the breeding of other fish species in warm water ponds has increased. The decrease observed in the
French carp production between 2017 and 2018 is related to the correction of statistics provided to
EUROSTAT.
Table 5 – Common carp production in EU MS (with production > 1.000 tonnes)
Evol.
MS 2009 2010 2011 2012 2013 2014 2015 2016 2017 2018
2018/09
Czechia 17.258 17.746 18.198 17.972 16.809 17.833 17.860 18.354 18.460 18.429 7%
Poland 18.133 17.491 18.317 16.778 18.368 16.223 17.400 16.851 16.478 -9%
-
Hungary 9.931 9.927 10.807 9.985 9.632 10.291 10.725 10.321 12.240 11.462 15%
Germany 9.887 9.634 5.058 5.508 5.684 5.261 4.907 5.230 4.944 4.736 -52%
Romania 4.142 2.888 2.652 3.266 3.395 3.737 4.349 4.841 4.539 4.357 5%
Lithuania 3.222 2.951 2.703 2.968 3.457 2.900 3.401 3.252 2.710 2.701 -16%
Bulgaria 2.488 1.906 1.805 1.584 .165 1.885 2.142 2.508 2.303 2.363 -5%
Croatia 2.058 1.816 2.891 2.484 2.100 2.284 3.401 2.698 2.039 1.959 -5%
France* 4.200 4.200 4.200 4.200 4.200 4.200 4.200 4.200 4.200 1.488 -65%
Others 1.500 1.625 1.843 1.976 1.800 1.604 1.769 1.728 2.040 1.743 16%
Total EU 72.819 52.693 67.648 68.259 64.020 68.364 68.978 70.530 70.327 65.715 -10%
Source: Eurostat *) In France, carp production was based on estimates until 2017. The 2018’s production is the
accurate figure
20
Source: https://eurofishmagazine.com/sections/species/item/440-europe-s-carp-farming-needs-new-marketing-ideas and
https://ec.europa.eu/fisheries/sites/fisheries/files/docs/body/carp_en.pdf
17You can also read