ON THE APPLICATION TO ENVIRONMENT AUSTRALIA SHARK BAY SNAPPER MANAGED FISHERY
←
→
Page content transcription
If your browser does not render page correctly, please read the page content below
APPLICATION TO ENVIRONMENT AUSTRALIA
                ON THE
 SHARK BAY SNAPPER MANAGED FISHERY

  Against the Commonwealth Guidelines for the
Ecologically Sustainable Management of Fisheries

 For Continued Listing on Section 303DB of the
    Environment Protection and Biodiversity
            Conservation Act 1999

                DECEMBER 2002

     DEPARTMENT OF FISHERIES, WESTERN AUSTRALIA
          LOCKED BAG 39, CLOISTERS SQUARE
                       WA 6850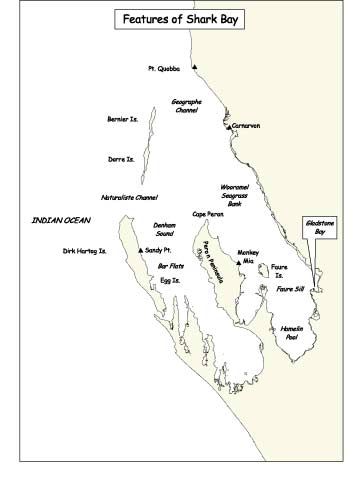
Application to Environment Australia for the Shark Bay Snapper Fishery

                                     TABLE OF CONTENTS
     TABLE OF FIGURES...........................................................................................4
     TABLES ................................................................................................................5
  1. INTRODUCTION TO THE APPLICATION ..................................................6
     1.1 DESCRIPTION OF INFORMATION PROVIDED .......................................6
     1.2 OVERVIEW OF APPLICATION...................................................................7
  2. BACKGROUND INFORMATION ...................................................................8
     2.1 DESCRIPTION OF THE FISHERY ...............................................................8
     2.2 BIOLOGY OF PINK SNAPPER...................................................................19
     2.3 MAJOR ENVIRONMENTS .........................................................................22
        2.3.1 Physical Environment .............................................................................22
        2.3.1 Economic Environment ..........................................................................22
        2.3.2 Social Environment.................................................................................23
  3. METHODOLOGY ............................................................................................24
     3.1 SCOPE ...........................................................................................................24
     3.2 OVERVIEW ..................................................................................................24
     3.3 ISSUE IDENTIFICATION (component trees) .............................................25
     3.4 RISK ASSESSMENT/PRIORITISATION PROCESS.................................26
     3.5 COMPONENT REPORTS ............................................................................27
  4. ASSESSMENT OF THE SHARK BAY SNAPPER MANAGEMENT
  REGIME AGAINST THE COMMONWEALTH (EA) GUIDELINES FOR
  ASSESSING THE ECOLOGICALLY SUSTAINABLE MANAGEMENT OF
  FISHERIES ............................................................................................................29
  GENERAL REQUIREMENTS OF THE EA GUIDELINES ...........................29
  PRINCIPLE 1 OF THE COMMONWEALTH GUIDELINES........................32
    OBJECTIVE 1. MAINTAIN VIABLE STOCK LEVEL OF TARGET SPECIES
    ..............................................................................................................................32
    OBJECTIVE 2. RECOVERY OF STOCKS .......................................................39
  PRINCIPLE 2 OF THE COMMONWEALTH GUIDELINES........................39
    OBJECTIVE 1. BYCATCH ................................................................................39
    OBJECTIVE 2. PROTECTED/LISTED SPECIES.............................................41
    OBJECTIVE 3. GENERAL ECOSYSTEM........................................................43
  5. PERFORMANCE REPORTS ..........................................................................47
     5.1 RETAINED SPECIES ...................................................................................47
           COMPONENT TREE FOR RETAINED SPECIES OF THE SBS
           FISHERY.....................................................................................................47
        5.1.1 PRIMARY SPECIES..............................................................................47
           5.1.1.1 PINK SNAPPER..............................................................................47
        5.1.2 BY-PRODUCT SPECIES ......................................................................54
     5.2 NON-RETAINED..........................................................................................55
           COMPONENT TREE FOR NON-RETAINED SPECIES .........................55
        5.2.1 CAPTURED BY LINE...........................................................................55
           5.2.1.1. PROTECTED/LISTED SPECIES POTATO COD........................55
           5.2.1.2. PROTECTED/LISTED SHARK SPECIES ...................................56
           5.2.1.3. CATCHING BLUDGER TREVALLY..........................................56

DECEMBER 2002                                                 -2-
Application to Environment Australia for the Shark Bay Snapper Fishery
5.2.1.4 CATCHING NORTH-WEST BLOWFISH ....................................56
5.3 GENERAL ENVIRONMENT.......................................................................58
COMPONENT TREE FOR THE GENERAL ENVIRONMENT ..............58
5.3.1 IMPACTS FROM REMOVAL OR DAMAGE TO ENVIRONMENT 58
5.3.1.1 REMOVAL OF ALL SPECIES (INCLUDING SNAPPER)..........58
5.3.1.1 TAKING ALL BY-PRODUCT SPECIES ......................................59
5.3.2 ADDITION OF MATERIAL TO the ENVIRONMENT.......................59
5.3.2.1 TRANSLOCATION OF ORGANISMS ON VESSEL HULLS .....59
5.3.2.2 TRANSLOCATION OF BAIT........................................................59
5.3.2.3. DISCARDING DEBRIS FROM BAIT PACKAGING .................60
5.3.2.4 DISCARDING LINES AND HOOKS ............................................60
5.3.3 DAMAGE TO HABITATS....................................................................61
5.3.3.1 ANCHORING..................................................................................61
5.4 GOVERNANCE...............................................................................................62
COMPONENT TREE FOR THE GOVERNANCE OF THE SHARK BAY
SNAPPER FISHERY ..................................................................................62
5.4.1 DEPARTMENT OF FISHERIES – MANAGEMENT..........................62
5.4.1.1 MANAGEMENT EFFECTIVENESS (OUTCOMES) ...................62
5.4.1.2 MANAGEMENT ARRANGEMENTS...........................................65
5.4.1.3 COMPLIANCE................................................................................69
5.4.1.4 ALLOCATION AMONG USERS ..................................................71
5.4.2 DEPARTMENT OF FISHERIES - LEGAL ARRANGEMENTS ........74
5.4.2.1 OCS ARRANGEMENTS................................................................74
5.4.3 DEPARTMENT OF FISHERIES- CONSULTATION..........................77
5.4.3.1 CONSULTATION...........................................................................77
5.4.4 DEPARTMENT OF FISHERIES- REPORTING ..................................79
5.4.4.1 ASSESSMENTS AND REVIEWS .................................................79
6. REFERENCES...................................................................................................83
Appendix 1 Attendees at Risk Assessment Workshop .......................................84
Appendix 2 Acronyms ...........................................................................................85
Appendix 3 Details of Consequence Tables .........................................................86
Appendix 4 Figures ................................................................................................88
Appendix 4.1 Principal Fishing Areas for the Shark Bay Scallop Managed
Fishery and Shark Bay Snapper Managed Fishery ..............................................88
Appendix 4.2 Principal Fishing Areas for the Shark Bay Prawn Managed Fishery
and the Shark Bay Snapper Managed Fishery .....................................................89
Appendix 5 Commercial Research Summary for the Snapper Fishery (1982 –
2002) ........................................................................................................................90
DECEMBER 2002 -3-Application to Environment Australia for the Shark Bay Snapper Fishery
TABLE OF FIGURES
Figure 1. The Snapper fishery locality map...................................................................8
Figure 2. Snapper fishery major features.......................................................................9
Figure 3. Features of Shark Bay. .................................................................................10
Figure 4. Snapper fishery principal fishing areas and World Heritage Property
boundaries. ...........................................................................................................11
Figure 5. Annual catch (t) of snapper in the Snapper fishery since 1975....................13
Figure 6. Catch per unit effort (CPUE) by year from 1988 to 2000 for the Snapper
fishery. .................................................................................................................16
Figure 7. Distributional range of pink snapper (Pagrus auratus) in Western Australian
waters. ..................................................................................................................20
Figure 8. Summary of the ESD reporting framework processes. ................................25
Figure 9. Example of a component tree structure. .......................................................26
Figure 10. CPUE for the Snapper fishery, 1988-2000.................................................35
Figure 11. Component tree for the retained species. ...................................................47
Figure 13. Component tree for non-retained species. ..................................................55
Figure 14. Component tree for the general environment.............................................58
Figure 15. Component tree for governance. ................................................................62
Figure 16. Map of the Snapper fishery licence area detailing the WA State waters and
Commonwealth waters.........................................................................................75
DECEMBER 2002 -4-Application to Environment Australia for the Shark Bay Snapper Fishery
TABLES
Table 1. National ESD reporting framework components...........................................24
Table 2. Risk ranking definitions.................................................................................27
Table 3. The National ESD reporting framework headings used in this report...........28
Table 4. Summary of risk assessment outcomes for environmental issues related to the
Snapper fishery. ...................................................................................................44
Table 5. Catches in 2000 by the Snapper Fishery licensed boats, in the area between
23° S and 26° S, of species other than pink snapper (excluding mackerels). ......54
DECEMBER 2002 -5-Application to Environment Australia for the Shark Bay Snapper Fishery
1. INTRODUCTION TO THE APPLICATION
1.1 DESCRIPTION OF INFORMATION PROVIDED
This is an application to Environment Australia (EA) to assess the Shark Bay Snapper
Managed Fishery (Snapper fishery) against the Commonwealth guidelines for
sustainable fisheries. The submission of a successful application against these
guidelines is now needed to meet the requirements under Part 13A of the Environment
Protection and Biodiversity Conservation Act, 1999 (EPBC) to enable pink snapper
(Pagrus auratus) and other relevant by-products of this fishery to remain on the
section 303DB list of species exempt from export regulations (previously Schedule 4
of the Wildlife Protection (Regulation of Exports and Imports) Act, 1982) past
December 2003.
The information provided in this application covers all the elements specified in the
Guidelines for the Ecologically Sustainable Management of Fisheries (located on the
EA website www.ea.gov.au/coasts/fisheries/assessment/guidelines.html) along with
other information (at a variety of levels of complexity) considered relevant to those
who wish to gain an understanding of the management of this fishery. The application
includes:
• Comprehensive background information on the biology of pink snapper, the
history of the Snapper fishery in Shark Bay and a description of the management
arrangements, which provides the context for assessing this application (see
Section 2 for details).
• A description of the National Ecological Sustainable Development (ESD)
reporting framework and methodology used to generate the information
presented in the application (see Section 3 for details).
• Specific supporting statements relevant to each of the criteria within the
Commonwealth Guidelines. These criteria include the “General Requirements”,
which covers many of the governance aspects related to the management of the
Snapper fishery, plus each of the objectives listed under “Principle 1” (target
species issues) and “Principle 2” (broader ecosystem issues) of the Guidelines
(see Section 4).
• Section 4 also has, where appropriate, specific links and reference to the detailed
ESD component reports contained in Section 5. Referral to this additional
information is facilitated by the incorporation of appropriately placed hyperlinks
(electronic version only).
• At the end of Section 4 there is an OVERVIEW TABLE that for each issue,
outlines which EA Guidelines are relevant; if there is an operational objective,
the availability of suitable data for the indicators, whether the current
performance against the limit/measure chosen is acceptable, and a summary of
what (if any) future actions are required.
• Section 5 includes a comprehensive account of the risk assessment outcomes and
current performance of the Snapper fishery, presented in the ESD format,
covering each of the environmental and governance issues relevant to this
application for the Snapper fishery. These reports cover each of the issues in a
comprehensive manner and include either; the explicit objectives, indicators,
DECEMBER 2002 -6-Application to Environment Australia for the Shark Bay Snapper Fishery
performance measures, current and future management responses and
justification for each major component; or a full justification for why specific
management of this issue within the Snapper fishery is not required.
1.2 OVERVIEW OF APPLICATION
The pink snapper (Pagrus auratus) is the major species targeted by this fishery. In
2000, the Snapper fishery landed 488 tonnes of snapper from the oceanic stock, which
had a value of around $2.24 million. In addition, a further $0.46 million of other
scalefish were caught by operators in the Snapper fishery in 2000. Since the inception
of the fishery in the late 1980s, it has been managed using a mix of input and output
controls. In 2001, new management arrangements were introduced into this fishery
and now the fishery is quota-managed on a year-round basis.
The Fisheries Resources Management Act, 1994 (FRMA) provides the legislative
framework to implement the management arrangements for this fishery. The FRMA
and the specific management plan for the Snapper fishery, adheres to arrangements
established under relevant Australian laws with reference to international agreements
as documented in Section 5.4.2.
The maintenance of the snapper stocks as well as the successful continuation of the
fishery has been achieved through the combination of:
• past research projects to improve the relevancy and accuracy of information on
the biology of Pagrus auratus and improve the management for the fishery;
• the sophisticated suite of management arrangements in place;
• the proactive management used in the Snapper fishery; and
• will be sustained in the future by research and the continued application of
effective, proactive management.
While this fishery has minimal wider ecosystem interactions it has still taken steps to
minimise the wider ecosystem impacts it does have. The fishery operates over only
1% of the total license area, has minimal contact with the seabottom substrate and
includes permanent closures in the inner gulfs of Shark Bay to protect separate stocks
and other species taken by other fisheries operating in the Snapper fishery licence
area.
Consequently, the management regime for the Snapper fishery should meet the
Guidelines for the Ecologically Sustainable Management of Fisheries. Detailed
justification for this conclusion is documented within the remainder of this
application.
DECEMBER 2002 -7-Application to Environment Australia for the Shark Bay Snapper Fishery 2. BACKGROUND INFORMATION 2.1 DESCRIPTION OF THE FISHERY The Snapper fishery is a line based fishery that operates in the waters of Shark Bay and the Indian Ocean between latitudes 23°34’S and 26°30’S (Figure 1). There is an area within Shark Bay that has been closed to fishing by this fishery since the 1960’s, which is inshore of Bernier and Dorre Islands and south of Cape Inscription (Figure 2). Figure 1. The Snapper fishery locality map. Within this overall area, only a relatively small portion of the licence area forms the functional fishery due to fishers targeting the higher yield fishing grounds (Figure 2). DECEMBER 2002 -8-
Application to Environment Australia for the Shark Bay Snapper Fishery

Most of the peak season fishing (from May through August) takes place within a 10
km radius of Koks Island at the northern tip of Bernier Island and in a 5 km radius of
Cape Inscription (Figure 3). However, there are also numerous patches over the
latitudinal range of the fishery that have harder bottom substrates where snapper
aggregations occur, and hence are targeted to a lesser degree as part of the commercial
fishery. The off-peak season fishing is more dispersed than that conducted during the
peak season.

Figure 2. Snapper fishery major features.

In 1991, Shark Bay was placed on the World Heritage list. All the waters of the Shark
Bay World Heritage Property lie within the bounds of the licence area for the Snapper
fishery but closures in the inner gulfs limit the area of activity of the operators in the
fishery. Furthermore, a substantial amount of the catch comes from areas outside
(beyond Bernier and Dorre Islands) the Shark Bay World Heritage Property (Figure
4). In conclusion, less than 10% of the Shark Bay World Heritage Property is actually
fished by the Snapper fishery. In addition to the Snapper fishery operating within this
area, the Shark Bay Prawn Managed fishery and the Shark Bay Scallop Managed
fishery are also located in the area. Appendix 4 shows the overlap of fishing area
between the Snapper fishery and the Shark Bay Prawn Managed fishery and the Shark
Bay Scallop Managed fishery.

Whilst there are currently 65 licences in the managed fishery, 41 of these are attached
to Shark Bay prawn and scallop trawlers. At the commencement of the managed
fishery (in the mid 1980s) these trawl licences were allowed to catch one tonne of
snapper by line in this region. Following the recent amendment to the snapper
management plan (2000), each of these trawlers was allocated transferable quota units
that had an initial value of one tonne. Since this time, there has been some

DECEMBER 2002                                  -9-
Application to Environment Australia for the Shark Bay Snapper Fishery

aggregation of these units and this is likely to continue, reducing the number of
relevant licences but maintaining the total number of quota units.

Figure 3. Features of Shark Bay.

The peak season catch in 2000 (prior to the current quota arrangements) was 393
tonnes and the off-peak catch was 95 tonnes. As a result, catches of snapper from the
oceanic stock in 2000 were slightly higher than the previous year, at 488 tonnes
compared with 450 tonnes in 1999.

Commencing in 2001 the whole year’s catch has been subject to transferable units of
entitlement (quota). The value of the pink snapper taken by the fishery in 2000 was
$2.24 million, while other scalefish species added a further $0.45 million.

DECEMBER 2002                                  - 10 -
Application to Environment Australia for the Shark Bay Snapper Fishery
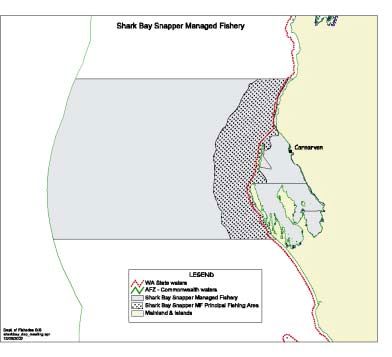
Shark BaySnapper ManagedFishery
&WorldHeritageProperty
N
LEGEND
WorldHeritage Property Snapper ManagedFishery
MainlandandIslands Extent of Fishery
Closed to Fishing
Permanent Closure-
Class AMarineReserve Principal FishingArea 40 0 40 80 Kilometers
Figure 4. Snapper fishery principal fishing areas and World Heritage Property
boundaries.
Fishing Operations
The target species for this fishery is pink snapper (Pagrus auratus) and the main
fishing method used is mechanised handline. Apart from the trawlers, the snapper
boats are a mostly a mixture of ex-rock lobster boats and purpose-built hand line
vessels. In the peak season, when a large part of the fleet consists of boats from other
ports, crew of the visiting boats generally live on-board. In the off-season, crews are
generally residents of Carnarvon or Denham and live ashore (Figure 3).
The gear used by the dedicated snapper boats consists of a number of mechanically
powered winches each with one “hand-line”. The bottom of the line is weighted and a
number of short (~40cm) leaders each with one hook attached are clipped to the line
with shark clips. The average number of hooks per line is normally 15; however,
DECEMBER 2002 - 11 -Application to Environment Australia for the Shark Bay Snapper Fishery when a large school is being fished, the fishers will clip on more hooks per line. The preferred bait is pilchards, cut in small pieces, but other clupeoid fish, squid and cuttlefish are used when pilchards are not available. During the peak season, when catch rates are high, most of the fishing trips are around one day duration. This maximises the freshness of the fish reaching the factories and eventually the consumers. In the off-season, the economies of boat operation make multi-day trips necessary to be profitable because of the lower catch rates. Snapper are mostly found around patches of hard bottom. In the peak season, they form spawning aggregations on inshore patches whilst in the off-season they are dispersed in smaller schools on patches over the continental shelf and upper slope. Each dedicated snapper fisher has the location of a number of these patches recorded on their global positioning systems (GPS). Boats are generally anchored so that they remain over a patch while the crew fish with the lines. There are usually many hours each day when the snapper are not biting and most of the crew may rest at these times while one continues to fish. When the fish come back on the bite, all lines are fished until enough are caught for the trip or the snapper go off the bite again. When fish are caught, they are landed onto a foam mattress to prevent bruising. They are unclipped from the line and spiked in the hind-brain from the right side of the head to kill them instantly. As well as being humane, this improves the eating quality of the fish. The dead fish are placed in an ice-slurry to rapidly cool them to around zero degrees Celsius, and then packed upright in plastic bins with some ice on top to keep them cold. The fish are separated from the ice by a layer of plastic, which prevents the flesh from being burnt during transport to shore and trucking to the factory. History Pink snapper have been fished commercially in the Shark Bay region since the turn of the twentieth century. However, data on catches are only available from the 1950s onwards. During the 1950s a fleet of mainly rock lobster vessels travelled to the Shark Bay region each winter to take advantage of the spawning aggregations. There was also a small contingent of locally-based fishing vessels. During this time, fishers used hand-lines as the sole means of taking pink snapper. The vessels would drift, in convoy, over the spawning aggregation and once a vessel had moved over the fishing ground it would steam back to the end of the queue and wait its turn. This method of fishing ensured that all vessels had the opportunity to fish all viable patches. However, given the nature of the operation it also meant that each vessel spent less than four hours a day physically fishing. In 1959, trap fishing for pink snapper was first introduced and used extensively in the fishery until 1987. The traps altered traditional fishing patterns and initially caused conflict between line and trap fishers. Traps quickly became the principle method of capture although some fishers continued to hand-line whilst their traps were soaking. However, drift fishing with hand-lines whilst trapping proved difficult given the logistical problems associated with drifting between trap buoys and lines. DECEMBER 2002 - 12 -
Application to Environment Australia for the Shark Bay Snapper Fishery

The major difference between the two primary methods was that traps allowed the
fisher to target the aggregations more effectively. Consequently, the fisher with the
greatest knowledge of where the aggregations occurred caught the most snapper. This
situation differed from the original hand-lining method, which gave all fishers a
reasonable chance of drifting over an aggregation. Furthermore, the trap fisher could
fish the aggregation patch for an extended period. Consequently, the storage capacity
of the vessel became the limiting factor as to how long a vessel may stay at sea and
continue fishing.

When the limited –entry fishery began in 1987, only those boats, which had used traps
in the past, could continue to use them. The trap endorsements were not transferable
and in the end only 4 of the trap boats remained. Unfortunately, the pink snapper
tended to sustain significant scale and skin damage as a result of trap capture. Market
prices reflected this decline in quality and traps were subsequently replaced by hand-
lines. Only one of the boats using traps continued past this time until around 1991.

                               Snapper Catch

                1500
    Catch (t)

                1000

                 500

                   0
                   1975   1980       1985        1990        1995        2000
                                             Year

Figure 5. Annual catch (t) of snapper in the Snapper fishery since 1975.

Pink snapper catches peaked at around 600 tonnes in 1959 and again in 1960. The
catch then declined over the following decade until interest was revived in the late
1970’s. In 1986, the collective pink snapper catch in the Shark Bay region reached at
an all-time high of 1 300 tonnes (Figure 5). At this time, the issue of stock over-
exploitation was raised and a Ministerial Working Group was appointed to consider
management options for the fishery.

Following the increase in catch and effort in the Snapper fishery in the early 1980s
culminating in the peak 1300 tonne catch in 1985, a limited entry fishery was
proposed and a closed season in July was implemented in 1986. Although the limited
entry fishery was not legislated for another year, fishers who did not meet the entry
criteria tended not to work the fishery in 1986.

Increases in fishing efficiency occurred quickly, which negated the benefits of the
temporal closure in July. A minimum size limit of 38 centimetres total length was also
introduced to the fishery at this time.

DECEMBER 2002                                  - 13 -
Application to Environment Australia for the Shark Bay Snapper Fishery The Shark Bay Snapper Limited Entry Fishery was officially declared in 1987, following the finalisation of the Offshore Constitutional Settlement (OCS) between the State and the Commonwealth, which gave WA control of line and trap fishing in Commonwealth waters. The waters of the Fishery were considered to be those of the outer bay and ocean lying between 23°34’S and 26°30’S. However, pink snapper stocks in the inner gulfs of Shark Bay could only be fished by licensees in the Shark Bay Beach Seine and Mesh Net Managed Fishery (this arrangement continues currently). The level of access to the Snapper fishery at this time was determined based on the following selection criteria. Firstly, those fishers who had taken at least eight tonnes of pink snapper per annum over four of the five years included in the period 1980 to 1984 were given an ‘A’ class level of access. Those fishers who had taken four tonnes of pink snapper per year and four tonnes of other species over two of the four years included in the period 1982 to 1985 were given a ‘B’ class level of access to the Snapper fishery. ‘A’ class entitlement holders were permitted to fish the core fishing zones whereas ‘B’ class holders were restricted to fishing the outer perimeters. A total of 13 ‘A’ class and 14 ‘B’ class access entitlements were initially distributed. However, following an appeals process a further 5 ‘B’ class entitlements and 16 supplementary access endorsements were granted. These original class licences (A and B) only had area restrictions attached to them and it wasn’t until 1989 that catch restrictions were also attached to the licences. In 1988, research advice suggested that the collective catch of pink snapper was still too high. Consequently, industry agreed to trial a split season fishing year, with the peak season being quota managed. In 1988, as a trial of the quota system that began in 1989 catch restrictions were placed on the licences. An ‘A’ class entitlement attracted a quota allocation of 20 units whereas a ‘B’ class entitlement carried 10 units. The rules governing the purchase and transfer of licenses was designed to reduce the number of vessels in the Snapper fishery over the long-term. This heralded a shift from strictly input control management to a management regime based on a combination of input and output controls. The peak season at this time ran over the period 1 June to 15 August. Along with an increase in the minimum legal size from 38 centimetres to 41 centimetres, researchers were satisfied that the quota measures had reduced the commercial catch to sustainable levels. The new length restriction was determined based on the average length at which pink snapper in the Shark Bay area become sexually mature. Considering the success of the split season trial it was decided that an individually transferable quota (ITQ) system be introduced on a permanent basis. Consequently, in 1989, licensees were required to nominate whether they would fish the peak season under quota or the off-peak season without quota restrictions. The peak season was also extended to cover the period 16 May to 15 August. Vessels choosing to fish the off-peak were limited to five lines and five hooks per line with most operators choosing to retrieve their lines with hydraulic winches. DECEMBER 2002 - 14 -
Application to Environment Australia for the Shark Bay Snapper Fishery

In 1991, a quota carry-over system of 500 kilograms was introduced and standard
containers were required to weigh the catch during the peak season (so that individual
quota could be tallied).

In 1993, the peak season was further extended to cover the period from 1 May to 31
August. At this time fishers were also given the option to fish during both the peak
and off-peak seasons. This measure was introduced to increase the scope of marketing
flexibility for fishers. However, if a fisher chose to fish for pink snapper on a year
round basis the license would forfeit ten units of quota during the peak season.

In 1994, the Shark Bay Snapper Management Plan 1994 was introduced. The
principal tools used under these management arrangements were seasonal quota and
size limits but there were also a range of other controls employed in the Snapper
fishery as summarised below.

By this time there were 13 ‘A’ class endorsements, 11 ‘B’ class entitlement holders,
five supplementary licence holders and 41 trawl vessels entitled to take one unit of
pink snapper during the peak season. An ‘A’ class entitlement provided 20 quota
units, a ‘B’ class holder was given a base quota of ten units and supplementary
licensees attracted a unit holding of four. Additional non-transferable units were
distributed at the beginning of each year to compensate fishers who had a history of
large catches.

Quota restrictions applied to those fishing the peak season, which coincided with the
pink snapper spawning period. The official peak season ran from 1 May through to 31
August. Fishers fishing in the off-season did not have any quota restrictions, but were
restricted to a maximum of five hand-lines or five drop-lines with five hooks per line.

Licensees were required to nominate the period they wanted to fish at the beginning
of each year. However, fishers retained the option to fish both the peak and off-peak
season provided they surrendered ten quota units during the peak. Fishing both the
peak and off-peak seasons provided greater marketing flexibility but with the
advances in fish finding technology fishers also found it easier to locate resident pink
snapper populations during the off-peak season. This had the potential to offset the
benefit of quota managed peak season.

The total allowable catch (TAC) for the peak season was set at around 550 tonnes,
with physical catches generally ranging between 500 and 530 tonnes. This equated to
one unit being worth approximately one tonne of pink snapper.

Impacts on Assessment Techniques

Prior to 1986, there had been a large turnover of fishers, resulting in a significant
number of inexperienced fishers entering the fishery. From 1986 onwards, the
Snapper fishery consisted of experienced snapper fishers and the reduction in fishing
time with the July closure stimulated a search for more efficient fishing methods.
Changes that have increased fishing time and/or efficiency include:

DECEMBER 2002                                  - 15 -
Application to Environment Australia for the Shark Bay Snapper Fishery

    •   a change from gutted to whole fish which gave the crew more fishing time as
        less time was needed to handle the catch;
    •   changes in hook types and bait;
    •   the phasing out of hand-powered winches to the use of mechanical winches;
    •   increases in the number of crew to fish the maximum permitted five lines per
        boat; and
    •   extra staff onshore were employed for unloading so that the crew could spend
        more time fishing.
When it became clear that there was still more than enough fishing capacity in the
fleet to overfish the stock, a change was made from fishing effort controls in the peak
season to individual quotas in 1988. The methods used in the Snapper fishery
stabilised following a few years of dramatically increasing efficiency. Because of
these various changes, comparisons of catch per unit effort pre and post 1988 when
individual quotas were introduced would be misleading and they are only presented
from 1988.

                                        Shark Bay Snapper Fishery CPUE

                               800

                               700
        kg/standard boat-day

                               600

                               500

                               400

                               300

                               200

                               100

                                0
                                 1988   1990    1992    1994       1996    1998        2000

                                                        Year

Figure 6. Catch per unit effort (CPUE) by year from 1988 to 2000 for the
       Snapper fishery.
Units are kg whole weight of pink snapper per standard boat day. As catchability varies markedly throughout the
year, peaking in June and July, the CPUE for line fishing in June and July is used as the index of abundance.

Management Objectives and Issues

The Minister and the Department of Fisheries have a statutory obligation under
section 3 of the Fisheries Resources Management Act, 1994 (FRMA) to conserve,
develop and share fish resources of the State for the benefit of present and future
generations. These objectives are further amplified through the vision and mission
statements and objectives as specified in various Strategic and Business plans for the
Department.

The Shark Bay Snapper Managed Fishery Working Group, which first met in 1995,
was formed to discuss all the issues pertaining to fishing in the Shire of Shark Bay

DECEMBER 2002                                             - 16 -
Application to Environment Australia for the Shark Bay Snapper Fishery incorporating commercial and recreational aspects to establish regulations and guidelines for sustainable resource sharing with in Shark Bay. The group adopted three guiding principles to develop the revised management arrangement for this fishery, and these still apply to the Department’s management approach: 1. The maintenance of pink snapper stocks at sustainable levels for the present and future benefit of industry and the community. 2. That any proposed management arrangement for the Snapper fishery should be applied equally to all unit holders in the Snapper fishery. 3. That any proposed management arrangements should be simple and easy to understand, thus resulting in administration efficiencies and cost effective management for both industry and the Department. Current Management Arrangements The Shark Bay Snapper Managed Fishery has been in operation since the late 1980s, and has been managed using a mix of input and output controls. Following a lengthy consultation period, new management arrangements were introduced at the beginning of 2001 under the provisions of the Shark Bay Snapper Fishery Management Plan Amendment 2000. The Snapper fishery is now quota-managed on a year-round basis (whereas before only the peak season was quota managed), and a minimum holding of 100 quota units applies. Although the units are transferable, a number of governing policies and principles exist. The amendment simplifies the complex management and administrative arrangements previously in place while providing more flexibility for both industry and the Department of Fisheries. The current management plan for the Snapper fishery is a formal statutory document that provides the framework for the management measures for the fishery. Management of the fishery is based on quota management, gear controls and minimum legal size. Quota management. Since the beginning of 2001 the Snapper fishery began operating under an annualised quota system within a TAC of 563.75 tonnes of pink snapper. Licensees’ entitlement of pink snapper may be taken at any time of the year. Strict controls exist regarding the notification of landing snapper, weighing of the catch and transporting of catch. Masters of the snapper vessels must notify the Department of Fisheries immediately before or upon landing of any snapper. Any snapper landed must be accurately weighed within 240 minutes of being landed. Prior to the fish being moved once on shore the weight must be recorded and entered into a Catch and Disposal Record (CDR) book, and a copy that information must be provided to the Department of Fisheries within 24 hours of the landing. A minimum unit holding principle is also embodied within the management plan for this fishery. The aim of the minimum unit holding requirement is to set a maximum number of participants in the Snapper fishery, each with a significant level of commitment to this fishery, which improve compliance effectiveness. The minimum number of units is 100 units, where one unit currently equates to 110 kg of snapper. Therefore the minimum unit holding of 100 unites equates to 11 tonnes. Although DECEMBER 2002 - 17 -
Application to Environment Australia for the Shark Bay Snapper Fishery

prawn and scallop licencees have a minimum of 10 units (1.1 tonnes of snapper). In
total, there are 5125 units of entitlement in the Snapper fishery.

Gear Restrictions. The only permitted means of taking pink snapper is by line and
hook.

Minimum Legal Size. There is a minimum size of 41 cm total length for snapper that
applies across both the commercial and recreational sectors. At a length of 41 cm, it
is estimated that approximately 90% of pink snapper have had the opportunity to
spawn at least once before being available for capture.

Spatial Closures. Commercial snapper fishing by the Shark Bay Snapper licensees is
not permitted within the eastern and western inner gulfs of Shark Bay and in an area
adjacent to the eastern side of Bernier and Dorre islands (Figure 2).

Additional Management –“Wetline” fishery.                   The additional governing
legislation/fishing authority relevant to the Snapper fishery is the open access Western
Australian Fishing Boat Licence (FBL). These “wetline” licences continue to have
access within the waters of the snapper fishery to target species other than pink
snapper. In effect, the two types of fishing rights co-exist within the same area. Of the
other non-snapper species, mackerel will come under formal management in the near
future; however, the remaining species (e.g. Black snapper, baldchin, cods etc) will
continue to be available to holders of FBLs until all scalefish species are formally
managed.

This ‘open access’ FBL issue is also currently under consideration through a separate
management review, the Wetline Review. The extent of this type of fishing activity,
the associated mortality of pink snapper caused by these vessels on return to the water
is the subject of on-going discussions with industry and consideration by the
Department of Fisheries.

The level of interaction between the Shark Bay prawn and scallop trawl fleets and the
snapper stocks is also under examination by the Department of Fisheries. Issues relate
mainly to the separate inner gulf pink snapper stocks, which are not the subject in this
document.

Compliance

Pink snapper are a valuable commodity and coupled with their biological
characteristics (see below) require a strong Government commitment to ensure
compliance with the management arrangements.           The compliance activities
undertaken by the Department of Fisheries used to uphold the integrity of the
management arrangements for the Snapper fishery cover three main areas of:

    •   The potential for non-reporting, under-reporting or false reporting of catch
        landed by commercial operators.
    •   Over runs on quota and non-compliance with minimum sizes.
    •   Unlicenced commercial activities.

DECEMBER 2002                                  - 18 -
Application to Environment Australia for the Shark Bay Snapper Fishery
These result in the following compliance activities:
• Inspections of commercial catches at the point of landing.
• Catch inspections at processing factories.
• At sea inspections of snapper boats and non-snapper boats.
• Monitoring of snapper quota system to detect unlawful “over quota” take.
• Random checks of Snapper fishery and other commercial fishing boats to
check unlawful take and landing of pink snapper.
Inspections of snapper boats at the point of landing carried out by Fisheries Officers
in Denham and Carnarvon enable checks of the size of snapper taken and the
quantities landed. Licence checks are also conducted during these inspections.
Notification requirements are contained in the management plan to ensure adequate
notice of snapper landings are provided to the Department of Fisheries. The quota
management system is also maintained to track the take and landing of snapper
throughout the season.
Markets and the Commercial Sector
Domestically pink snapper are sold both whole and in fillet form, with a major market
in recent years being the Sydney Fish Market. For the export market, pink snapper
are primarily sold as whole fish and are exported to Japan, Taiwan, Italy and the USA.
The demand for pink snapper has varied between years and during periods when the
price per kilo has been relatively low, the quota has often not been taken (eg the mid
1990s).
Research
Detailed research on the oceanic stock caught by the Snapper fishery was undertaken
during the 1980s and provides the scientific knowledge base for management. A new
FRDC funded project, which commenced in July 2000 will utilise data collected since
the 1980s to assess and model the snapper stock. In addition, sampling of the catch
will be undertaken every second or third year to provide up-to-date age composition
data. The periodicity of this catch sampling will remain under review to ensure that it
is adequate for input to the model to provide adequate scientific advice. Until the
results from this research become available, monitoring of the fishery will continue to
be undertaken annually using catch and effort statistics (CAES) data. Appendix 5
provides a summary of the research, which has been conducted for the Snapper
fishery since 1982.
2.2 BIOLOGY OF PINK SNAPPER
Distribution and Stock Structure
In Western Australia, pink snapper are found from the South Australian border
through to Barrow Island in the northwest (Figure 7). The species is found along the
continental shelf as well as in marine embayments and estuaries. Pink snapper are
DECEMBER 2002 - 19 -Application to Environment Australia for the Shark Bay Snapper Fishery
demersal or bottom-dwelling and can occur to depths of up to 200m. Depth-
distribution appears to be a function of individual size/age, with juvenile pink snapper
tending to be more abundant in shallow waters, whereas larger individuals seem to
prefer deeper waters with a rocky substrate.
Research has shown that there are three (3) distinct stocks of pink snapper within the
Shark Bay region (e.g. Edmonds et al., 1995). The three populations have significant
differences in their genetics, which implies no inter-breeding. There are two
populations within the inner gulfs of Shark Bay and one that inhabits the rest of the
bay and outer ocean adjacent to it. Each population appears to have evolved to a
different set of optimal environmental conditions (for example, salinity concentration
and range). New evidence indicates that the snapper population inhabiting the
Denham Sound part of the outer bay has only limited mixing with the ocean stock (M.
Moran1, pers. comm.). As a result, Denham sound is treated as a distinct inner bay
stock for management purposes.
Tagging studies have shown that pink snapper within the inner gulfs are highly site-
attached whereas those living in the mouth of the bay and outer ocean may travel up
to 300 kilometres.
Figure 7. Distributional range of pink snapper (Pagrus auratus) in Western
Australian waters.
1
Mike Moran, Department of Fisheries – Research Division.
DECEMBER 2002 - 20 -Application to Environment Australia for the Shark Bay Snapper Fishery Life History Age & Growth Pink snapper are a relatively long-lived species with a moderate rate of growth. Individuals may reach 35 years of age but generally recruit to the Snapper fishery (that is, when they reach the minimum size limit of 41 cm in total length) at around four (4) years old. Growth rates and maximum sizes vary throughout the distributional range of the species, so while pink snapper can grow to a length of around 100 centimetres and 16 kilograms in weight, oceanic stock pink snapper in the Shark Bay region rarely exceed 85 centimetres. Reproduction and Recruitment Shark Bay pink snapper tend to spawn over the winter months from late May through till August. During this time, sexually mature individuals move inshore to form large spawning aggregations. Even though the stock is effectively from a wide area, they are temporarily concentrated therefore the fishing power on the stocks is increased. These spawning aggregations form the basis of the peak fishing season and make pink snapper particularly vulnerable to localised depletion due to overfishing and recruitment overfishing. Female pink snapper may spawn over a million eggs per season. The eggs are released in discrete batches throughout the spawning period, which is referred to as serial spawning. The courting process between males and females is not fully understood, although the males are believed to use their large fleshy nose bumps to encourage females to release their eggs. Like most fish species, the larger and/or older females in the population produce eggs disproportionately, in terms of both quantity and quality, than their younger counterparts. Once fertilised, eggs drift for a couple of days before hatching and are greatly influenced by the prevailing currents. Some larvae will settle in the vicinity of the spawning grounds whereas others will be dispersed further afield. The seasonal variability of the currents results in variability in the precise locality and level of larval settlement each year. Good larval recruitment years, which imply a high larval survival rate, generally result in good recruitment into the fishery four or more years later. Strong larval recruitments can usually be tracked as pulses of recruits to the commercial fishery. In the Shark Bay region, whilst there are variations in the recruitment levels amongst years, these variations are not as pronounced as seen in some locations (eg Victoria, New Zealand) where the relative recruitment levels can vary by approximately 20 times amongst years (Francis, 1993). DECEMBER 2002 - 21 -
Application to Environment Australia for the Shark Bay Snapper Fishery

Diet

Pink snapper are opportunistic carnivores, consuming a wide variety of mainly
benthic organisms depending on availability. The range of foods includes: fish,
crustaceans, molluscs and other invertebrates.

2.3 MAJOR ENVIRONMENTS

2.3.1 PHYSICAL ENVIRONMENT

Shark Bay has a semi-arid to arid climate with hot, generally dry summers and mild
winters. The waters of Shark Bay cover an area of 13, 000 km2. It is for the most part
a shallow embayment with an average depth of around 9 m and a maximum of 29 m.
The large seagrass beds in the bay influence the hydrology of the area, slowing water
currents as they pass over the beds and allowing increased deposition of suspended
sediments. This has led to the development of large sedimentary banks. The
restrictions on water flow imposed by these seagrass beds has resulted in an unusual
hydrologic structure in Shark Bay characterised by salinoclines and three major water
types – namely oceanic (salinity 35-40 ppt), metahaline (40-56 ppt) and hypersaline
(56-70 ppt). This distinct salinity pattern influences the distribution of marine flora
and fauna (including pink snapper) within the bay, leading to three biotic zones.

The managed Snapper fishery occurs on deeper patches of hard bottom around the
entrances to Shark Bay and in the adjacent ocean. Underwater video work has shown
that the habitat is dominated by sponges, soft corals and gorgonians. Fishing does not
normally occur over the seagrass or hard coral areas as part of the managed Snapper
fishery. However, wetline fishers in the region may target coral areas for other reef
species such as baldchin groper (Choerodon rubescens).

2.3.1 ECONOMIC ENVIRONMENT

In recent years, the Japanese demand for snapper has been declining and efforts have
been made to explore other overseas and Eastern States markets. The value of the
Snapper fishery contributes significantly to the Gascoyne regional economy and
economy of WA in general.

The fishery has an annual value to fishers in excess of $2 million depending on
variable catch levels and composition (noting by-product species), market price and
exchange rate. In 1999 the value of the snapper catch at approximately $4.60/kg was
estimated at $2.06 million. In 2000, the value of the pink snapper taken by this fishery
was $2.24 million. In addition, the value for other species caught by the fishery in
1999 totalled $0.6 million and $0.45 million in 2000.

DECEMBER 2002                                  - 22 -
Application to Environment Australia for the Shark Bay Snapper Fishery

2.3.2 SOCIAL ENVIRONMENT

The fishery has had considerable impact on regional WA. In 2000, seven boats fished
both peak and off-peak seasons (about nine months) with an average crew of three.
This rose during the peak season (four months) to a total of 13 boats with an average
crew of five. The fishery also provides significant employment for fish processing
and transport staff in this region.

DECEMBER 2002                                  - 23 -
Application to Environment Australia for the Shark Bay Snapper Fishery

3. METHODOLOGY

3.1 SCOPE
This application is based upon the ESD report for the Snapper fishery. The ESD
report was generated by assessing “the contribution of the Snapper fishery to
ESD”. This assessment examined the benefits and the costs of the Snapper fishery
across the major components of ESD (see Table 1). In doing so, it will eventually
provide a report on the performance of the fishery for each of the relevant ecological,
economic, social and governance issues associated with this fishery. Given the
timeframes involved, only the criteria required for the “Guidelines for the
Ecologically Sustainable Management of Fisheries”, which cover mainly the
environmental elements of ESD (outlined below in Table 1) were generated for this
application.

Table 1. National ESD reporting framework components.
Nb: Only those ESD components in bold* are reported in this application.

National ESD Framework – ESD COMPONENTS

Contribution to Ecological Wellbeing
        Retained Species*
        Non-Retained Species*
        General Ecosystem*
Contribution to Human Wellbeing
        Indigenous Community Issues
        Community Issues
        National Social and economic Issues
Ability to Achieve
        Governance*
        Impact of the environment on the fishery

3.2 OVERVIEW
There were four steps involved in completing the ESD report for the Snapper fishery.
It was based upon using the National ESD Reporting Framework, which is outlined in
detail in the WA ESD policy paper (Fletcher, 2002) and in the “How to Guide”
(Fletcher et. al., 2002) located on the website (http://www.fisheries-esd.com/):

•   The issues that needed to be addressed for this fishery were determined at a
    stakeholder workshop. This process was facilitated by adapting the set of
    “Generic ESD Component Trees” into a set of trees specific to the Snapper
    fishery.
•   A risk assessment/prioritisation process was completed that objectively
    determined, which of these identified issues was of sufficient significance to
    warrant specific management actions and hence a report on performance. The
    justifications for assigning low priority or low risk were, however, also recorded.

DECEMBER 2002                                  - 24 -
Application to Environment Australia for the Shark Bay Snapper Fishery
• An assessment of the performance for each of the issues of sufficient risk to
require specific management actions was completed using a standard set of report
headings where operational objectives, indicators and performance measures,
management responses etc were specified.
• An overview assessment of the fishery was completed including an action plan for
activities that will need to be undertaken to enable acceptable levels of
performance to continue or, where necessary, improve the performance of the
fishery.
ESD Component
Trees
(issues identified) Use Data for
PLUS other
Risk Assessment GENERAL purposes
BACKGROUND
Low Risk/Priority > Low Risk/Priority INFORMATION For
example,
Report on Develop Objectives = Applications
Justification for Risk Indicators
Rating Only Performance limits to EA
Report Current Status ESD REPORT
Figure 8. Summary of the ESD reporting framework processes.
3.3 ISSUE IDENTIFICATION (COMPONENT TREES)
The National ESD Reporting Framework has eight major components, which fall into
three categories of the “contributions to ecological wellbeing”, “contributions to
human wellbeing” and the “ability to achieve the objectives” (Table 1). Each of the
major components is broken down into more specific sub-components for which
ultimately operational objectives can be developed.
To maximize the consistency of the approach amongst different fisheries, common
issues within each of the components were identified by the Standing Committee for
Fisheries and Agriculture (SCFA) and ESD reference groups within each of the major
component areas and arranged into a series of “generic” component trees (See
Fletcher (2002) and the www.fisheries-esd.com web site for a full description). These
generic trees were used as the starting point for identifying the issues. These trees
were subsequently adapted into trees specific to the Snapper fishery during an open
consultative process involving all stakeholder groups. This was achieved by
expanding (splitting) or contracting (removing/lumping) the number of sub-
components as required (Figure 9).
DECEMBER 2002 - 25 -Application to Environment Australia for the Shark Bay Snapper Fishery
Component
Sub-Component 1 Sub-Component 2 Sub-Component 3
Sub-Sub-Component Sub-Sub-Component
Sub-sub-sub Sub-sub-sub
Component Component
Figure 9. Example of a component tree structure.
The trees for the Snapper fishery were developed at a meeting held in August 2001.
The stakeholders present during this meeting covered the commercial industry,
recreational fishers, environmental groups, local government, Environment Australia,
Department of Environmental Protection, Department of Fisheries staff and an
independent facilitator (full attendance list in Appendix 1).
3.4 RISK ASSESSMENT/PRIORITISATION PROCESS
After the components/issues were identified, a process to prioritise each of these
needs was completed using a formal risk assessment process. The risk assessment
framework that was applied at the workshop was consistent with the Australian
Standard AS/NZS 4360:1999 Risk Management, concentrating on the risk assessment
components. The general Risk Assessment process is well documented but in
summary, it considers the range of potential consequences of an issue/activity and
how likely those consequences are to occur. The combination of the level of
consequence and the likelihood is used to produce an estimated level of risk
associated with the particular hazardous event/issue in question.
A realistic estimate of the consequence level for each issue was made by the group at
the workshop. This level was from 0-5, with 0 being negligible and 5 being
catastrophic/irreversible (see Appendix 2 for details of consequence tables). This
assessment was based upon the combined judgement of the participants at the
workshop, who collectively had considerable expertise in the areas examined.
The level of consequence was determined at the appropriate scale for the issue. Thus
for target species the consequence of the Snapper fishery was based at the population
not at the individual level. Obviously catching one fish is always catastrophic for the
individual but not always for the population. Similarly, when assessing possible
ecosystem impacts this was done at the level of the whole ecosystem or at least in
terms of the entire extent of the habitat, not at the level of an individual patch or
individuals of non-target species.
The likelihood of a consequence occurring was assigned to one of six levels from
remote to likely. In doing so, the workshop group again considered the likelihood of
the “hazardous” event (consequence) actually occurring based upon their collective
wisdom, which included an understanding of the scale of impact required.
DECEMBER 2002 - 26 -You can also read