WASTE MANAGEMENT IN ASEAN COUNTRIES - SUMMARY REPORT
←
→
Page content transcription
If your browser does not render page correctly, please read the page content below
SUMMARY
REPORT

   WASTE MANAGEMENT
   IN ASEAN COUNTRIES
© United Nations Environment Programme, 2017

Printed in Thailand

This publication may be reproduced in whole or
in part and in any form for educational or non-
profit purposes without special permission from
the copyright holder, provided acknowledgement
of the source is made. The United Nations
Environment Programme would appreciate
receiving a copy of any publication that uses this
publication as a source.

No use of this publication may be made for resale
or for any other commercial purpose whatsoever
without prior permission in writing from the
United Nations Environment Programme.

Disclaimer
The designations employed and the presentation
of the material in this publication do not imply
the expression of any opinion whatsoever on
the part of the United Nations Environment
Programme concerning the legal status of any
country, territory, city or area or of its authorities,
or concerning delimitation of its frontiers or
boundaries. Moreover, the views expressed do
not necessarily represent the decision or the
stated policy of the United Nations Environment
Programme, nor does citing of trade names or
commercial processes constitute endorsement.
Acknowledgement
Author
Amit Jain
(Consultant)

Project Team – AIT RRC.AP
Guilberto Borongan
(Programme Specialist and Coordinator)

Prakriti Kashyap
(Senior Programme Officer)

Nang Sian Thawn
(Programme Officer)

Supervision – UN Environment IETC
Shunichi Honda
(Programme Officer)

Mushtaq Memon
(Programme Officer)

Peer Reviewers and Contributors from ASEAN Member States and Experts
Mohammad Shah Rezza Nassaruddin, Rithirak Long,
Vanhxay Phiomanyvone, Nur Akmal, Ni Ni Thin,
Anuphan Ittharatana, Pornpimon Chareonsong, Vuttichai
Kaewkrajang, Pattanan Tarin, Chalalai Rungruang, Nguyen
Anh Tuan, Sunee Thapinta, Ridwan Tamin, Darren Koh,
Masnellyarti Hilman, Yulisa Djaja, Supawan Tantayanon,
Saroj Srisai, Rocky Pairunanasean, Mushtaq Memon, Prakriti
Kashyap, Shunichi Honda, and Guilberto Borongan

Cover Illustration, infographics, and layout
Lowil Fred Espada
Professional Independent Graphic Design

                                               Regional Resource Centre for Asia and the Pacific

                                                                                                   i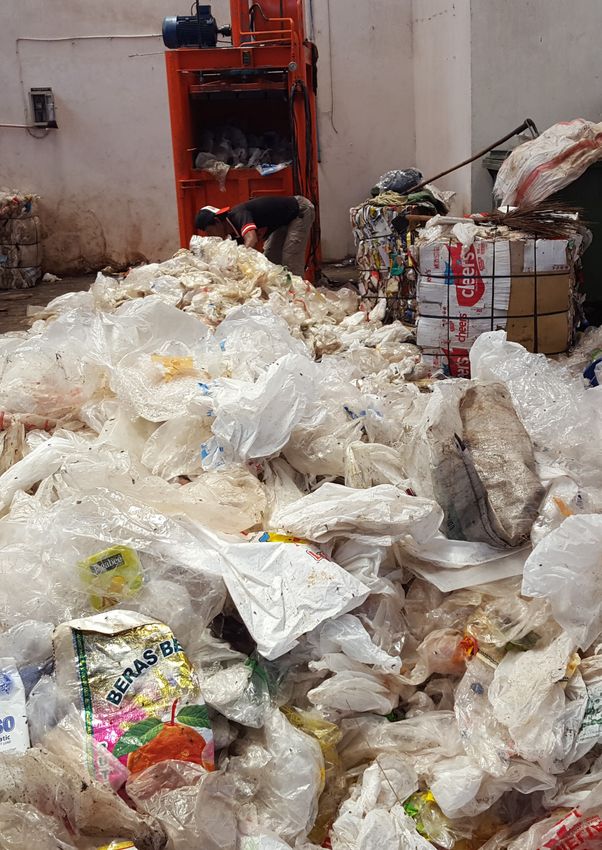
Abbreviation

       ASEAN     The Association of Southeast Asian Nations
         ASCC    ASEAN Socio Cultural Community
          BAT    Best Available Technologies
        BLNG     Brunei Liquefied Natural and Gad
          BMC    Brunei Methanol Company
           BSP   Brunei Shell Petroleum
       CCQMD     Composting, Compost Quality and Market Development
      COMPED     Cambodia Education and waste Management Organization
       CSARO     Community Sanitation and Recycling Organization
         DEPC    Department of Environmental Pollution Control
         DEPR    Department of Environment, Park and Recreation
           DfE   Design for Environment
          ECD    Environment Conservation Department
           EEE   Electrical and Electronic Equipment
           EPR   Extended Producer Responsibility
          ESM    Environmentally Sound Management
         ESMS    Environmental and Social Management Systems
          GDP    Gross Domestic Product
          GHG    Green House Gas
          GHS    Global Harmonized System
        GWCs     General Waste Collectors
        HOAs     Home Owners Association
            HR   Human Resources
        ISWM     Integrated Solid Waste Management
           ITA   Investment Tax Allowance
          IWS    Informal Waste Sector
          JICA   Japan International Cooperation Agency
          KPIs   Key Performance Indicators
         KSTP    Keppel Seghers Tuas Plant
          LGU    Local Government Unit
        MASG     Multi-Agency Sub-Group
        MCDC     Mandalay City Development Committee
        MDGs     Millennium Development Goals
         MEPS    Minimum Energy Performance Standard
          MoE    Ministry of Environment
           MoI   Ministry of Industry
       MONRE     Ministry of Natural Resources and Environment
          MRF    Material Recycling Facilities

ii

                                           SUMMARY REPORT: WASTE MANAGEMENT IN ASEAN COUNTRIES
MSW     Municipal Solid Waste
       MT    Metric Tons
   NAMA      Nationally Appropriate Mitigation Actions
      NEA    Non-Environmentally Acceptable
      NEA    National Environment Agency
NELP-GCP     National Eco-Labeling Programme- Green Choice Philippines
     NGO     Non Government Organization
  NPT DC     Naypyitaw Development Committee
 NSWMD       National Solid Waste Management Department
    OECD     Organization for Economic Co-operation and Development
  PADETC     Participatory Development Training Center
      PCD    Pollution Control Department
     PEPP    Philippine Environmental Partnership Programme
      PPP    Public Private Partnership
    PWCs     Public Waste Collectors
    RECP     Resource Efficiency and Cleaner Production
    ROHS     Restriction of Hazardous Substances
      SDG    Sustainable Development Goals
       SIH   Green Industry Standard
       SLF   Secured Landfill
   SLORC     State Law and Order Restoration Council
      SME    Small and Medium Scale Enterprises
       SNI   Indonesian National Standard
     SWM     Solid Waste Management
   SWOT      Strength, Weakness, Opportunities and Threat
    TEST     Transfer of Environmental Sound Technologies
    TMTS     Tuas Marine Transfer Station
      ULB    Urban Local Bodies
  UNCRD      United Nations Centre for Regional Development
UNESCAP      United Nations Economic and Social Commission for Asia and the
             Pacific
     UNU     United Nations University
     WAB     Waste Agriculture Biomass
    WACS     Waste Analysis and Characterization Study
    WHO      World Health Organization
      WM     Waste Management
     WTE     Waste to Energy
    YCDC     Yangon City Development Committee

                                                                              iii
/01 /02 /03
     1\   Introduction   11\ Waste Management             49\ Recommendation
                             and Technology
                             Profile                      59\ References
                           11\   Municipal Solid Waste
                                 (MSW) Generation
                                 and Composition
                           17\   Industrial and
                                 Hazardous Waste
                           22\   Policy, Regulatory and
                                 Institutional Profile
                           27\   Municipal Solid Waste
                                 (MSW)
                           36\   Industrial Waste
                                 including Hazardous
                                 Waste
                           42\   Emerging Waste
                                 Streams (Plastic,
                                 Healthcare and
                                 E-waste)

iv

                                 SUMMARY REPORT: WASTE MANAGEMENT IN ASEAN COUNTRIES
List of Figures and Tables
Figure 1 ASEAN Population Projection and Urbanisation Rate 2
Figure 2 Annual GDP Growth (%) 3
Figure 3 ASEAN Economic Sector’s Average Share in Real GDP (%) 4
Figure 4 CO2 emissions Per Capita for ASEAN Countries 8
Figure 5 Projected Urban Waste Generation in some ASEAN Countries 10
Figure 6 MSW Generation in ASEAN Countries 14
Figure 7 Waste generated per capita in ASEAN Countries 14
Figure 8 Composition of MSW in ASEAN Countries 15
Figure 9 Total amount of hazardous waste generated in ASEAN Countries 17
Figure 10 Annual E-Waste Generated in ASEAN Countries 18
Figure 11 Per Inhabitant E-waste Generation 19
Figure 12 ISWM Framework 54
Figure 13 Dimensions of ISWM Framework 55
Table 1 Amount of Waste Generation and Composition of MSW in ASEAN Countries 12
Table 2 Amount of E-Waste Generated in ASEAN Countries 18
Table 3 Technology – Municipal Solid Waste (MSW) 20
Table 4 Technology – Industrial Waste Including Hazardous Waste 21
Table 5 Technology - Emerging Waste Streams (Plastic, Healthcare and E-waste) 22
Table 6 National ASEAN environment strategies vary in their focus on green growth 23
Table 7 Regulatory Framework 24
Table 8 National ASEAN environment strategies vary in their focus on green growth 25
Table 9 Industrial and Hazardous Waste 25
Table 10 Emerging Waste Streams 26
Table 11 Dimensions of ISWM Framework 54
vKey Highlights
This summary report examines the waste management landscape in 10 Association of Southeast Asian Nations
(ASEAN) Member States.This report begins with the statistics on the trends of population growth, urbanization, and
economic growth in each of the ASEAN countries, which is then followed by an overview of the waste generation,
collection, treatment & recovery, and disposal statistics, and associated environmental, technical, and governance
(institutions, policy, regulations) factors in the waste sector.The report also identifies the existing waste management
challenges and gaps therein, and sets out recommendations.
Some of the key highlights of the ASEAN waste management landscape are summarized here, while the country
specific data are detailed in the main report:
ASEAN is experiencing an increasing trend in population growth and urbanization rate
ASEAN countries have a combined population of approximately 625 million people, which account for 8.8%
of the world’s population.The population is projected to be increased to 650 million by 2020, more than half
of this total population will be living in urban areas.
Waste generation is increasing (both in volume and composition)
The per capita Municipal Solid Waste (MSW) generation in ASEAN is 1.14 kg/capita/day. In terms of total
annual MSW generation, the order is as follows: Indonesia generates the highest quantity of municipal waste
with 64 million tonnes/year, followed by Thailand (26.77 million tonnes/year), Viet Nam (22 million tonnes),
Philippines (14.66 million tonnes), Malaysia (12.84 million tonnes), Singapore (7.5 million tonnes), Myanmar
(0.84 million tonnes), and Lao PDR generating the lowest quantity of MSW at 0.07 million tonnes/year.
Predominantly, organic waste (about or more than 50%) is the highest fraction of MSW in all ASEAN countries,
except for Singapore, where organic waste accounts for only 10.5% of the total MSW. Other waste streams
such as plastic, paper, and metals are also the common sight in MSW piles. Apart from MSW, Healthcare
waste, E-waste, Industrial waste, and Construction and Demolition Waste are the emerging waste streams
in ASEAN countries.
Waste Management Practices (Technology and Infrastructure)
Open dumping and open burning of waste is prevalent in the majority of ASEAN countries. Composting
and anaerobic digestion of organic wastes, and recovery of valuable recyclables such as plastic, metal and
paper are common in ASEAN. Recycling, however, is more at the hands of the informal sector. Nevertheless,
Singapore stands as an exception to other ASEAN countries, as it has a sound and well-structured waste
management system in place. Singapore opts for waste to energy (WTE) through incineration as the major
waste management option, due to its limited land resources.
vi
SUMMARY REPORT: WASTE MANAGEMENT IN ASEAN COUNTRIESWaste Governance (Institution, Policy and Regulatory Profile)
Most of the ASEAN countries have already established national strategies to address challenges related to
waste management broadly through Environmental Act, and other Green Growth, Sustainable Development
and Climate Change policy, regulatory framework, and strategies. Countries like Indonesia, Malaysia, Philippines,
and Thailand have specific Acts/laws on waste management. From the institutional aspect, waste management
policy making at the national level, is under the jurisdiction of the Ministry of Environment, while many other
line-ministries also have roles in regulating specific waste streams (for instance, Ministry of Health, and Ministry
of Industry for healthcare waste and industrial waste, respectively). Sometimes, a disharmony and lack of
coordination among these institutions and stakeholders (for example, overlapping of the responsibilities and the
authority) become a prominent cause of mismanagement of waste. At the local level, provincial government,
urban local bodies (ULBs) namely, municipality are directly responsible for handling waste management services.
In addition to ULBs, non-governmental sector such as private sector, NGOs, and community participation
has also been progressing as public-private-partnerships in waste sector.
Identification of the gaps and the opportunities
Among numerous environmental challenges in the ASEAN region, the rapid growth of volumes of waste, and
a complex waste composition with new and emerging waste streams is one of the prominent challenges.
ASEAN countries have put efforts towards waste management, but, are challenged by various technology,
infrastructure, financing, policy, and stakeholder participation issues.These challenges, on the other hand, could
be opportunities, if ASEAN countries shift from understanding the ‘waste’ as ‘resource.’ While augmenting
the waste recycling rate and WTE technology and approaches, attention must be given to the front-end
solutions as well, i.e., mechanisms for waste reduction/prevention through sustainable consumptions resources
management. In addition, generating co-benefits such as GHG emission reduction, enabling the achievement
of SDGs etc. from the waste sector is a progressive approach that ASEAN countries should continue to
explore. From the partnership angle, encouraging private sector (and small-and-medium sized enterprises)
into waste value chains will help pool resources and gather shared responsibilities for waste management.
From technology point of view, selection and adoption of the environmentally sound technologies (ESTs) that
suit the local waste characteristics, and other social, cultural, economic and environmental concerns is very
crucial. Similarly, for industrial waste, promoting industrial symbiosis, waste exchange activities are encouraged.
For hazardous waste, ASEAN countries need to develop a harmonized definition and codes, and prepare an
inventory as a prerequisite towards sound management of hazardous waste.
viiRecommendations
The recommendations are categorized into three important aspects of sound waste management; i) Policy
and Regulatory, ii) Institutional, Technical and Performance, and iii) Funding/Financing/Economics aspects of
sustainable waste management – while addressing the entire value chain elements of waste management
(inclusive of waste generation, segregation, collection, transfer, treatment and disposal, resource recovery
through 3Rs). Making waste management a priority issue at all levels of governance – regional (ASEAN),
national, and local level (and the priority of the political and local community) through the development of a
harmonized regional, national and local waste management policy framework as per 3Rs is critical to success.
In addition, design and implementation of the right combination of regulatory, economic and social instruments
with incentives for strong monitoring for compliance by all relevant stakeholders is equally important in
the ASEAN context. From the institutional aspect, improving organizational efficiency, and promoting inter-
departmental/agency cooperation is important. ULBs need to explore other innovative financing mechanisms
like public private partnership (PPP), investment by development finance investors, application of polluters
pays principle and extended producer’s responsibility to strengthen the existing revenue sources from waste
generators. Synergizing, encouraging and ensuring the co-responsibilities among different stakeholders in waste
management together with the ULBs is the key to sustainable waste management.
These recommendations are also expected to be useful in embarking the economic integration and sustainable
development as identified in the ASEAN Economic, and Socio-culture Community Blueprint 2025.
viii
SUMMARY REPORT: WASTE MANAGEMENT IN ASEAN COUNTRIES01
Introduction
The Association of Southeast Asian Nations (ASEAN) is a regional
organisation comprising ten Southeast Asian states, which promotes
intergovernmental cooperation and facilitates economic integration amongst
its members. It was formed in August 8, 1967 and includes Indonesia, Malaysia,
the Philippines, Singapore, Thailand, Brunei Darussalam, Cambodia, Laos, Myanmar,
and Viet Nam. Its principal aims include accelerating economic growth, social progress,
and socio-cultural evolution among its members. ASEAN covers a land area of 4.4 million
square kilometres, 3% of the total land area of Earth. ASEAN territorial waters cover
an area about three times larger than its land counterpart. Member countries have a
combined population of approximately 625 million people, which account 8.8% of the
world’s population. In 2015, the organisation’s combined nominal GDP had grown to more
than US$2.8 trillion. As a single entity, it ranks as the seventh largest economy in the world,
behind the USA, China, Japan, Germany, the United Kingdom and France. Geographically ASEAN
shares land borders with India, China, Bangladesh, East Timor, and Papua New Guinea, and maritime
borders with India, China, and Australia.
Figure 1 indicates that the region’s population is projected to rise to 650 million by 2020, with more
than half living in urban areas. Rising population in major cities is largely attributed to the rural-urban
migration. The urban population in the region has been steadily increasing for the last two decades,
from only 31.6% of the total population in 1990 to about 44% in 2005, with the biggest decrease of rural
population occurring in Indonesia and the Philippines. It has been proven that, rapid urbanisation, if not
managed well, could lead to proliferation of environmental and health issues.
ASEAN’s economic performance since 2007 to 2014 is shown in Figure 2. It can be seen that the real growth grew
to 4.6 % in 2014 and, based on OECD estimates, was expected to reach 4.9% in 2016 in the region is expectedFigure 1
ASEAN Population Projection and Urbanisation Rate
900,000 100
Total population
% of urban population
90
800,000
80
700,000
70
600,000
60
500,000
50
400,000
40
300,000
30
200,000
20
100,000
10
0 1990 1995 2000 2005 2010 2015 2020 2025 2030 2035 2040 2045 2050 0
Urban Rural % of population in urban areas
Source: Fourth ASEAN State of the Environment Report 2009.
2
SUMMARY REPORT: WASTE MANAGEMENT IN ASEAN COUNTRIESFigure 2
Annual GDP Growth (%)
80
Percentage
70
60
50
40
30
20
10
0.0
-10.00
-20.0
Brunei Cambodia Indonesia Lao PDR Malaysia Myanmar Philippines Singapore Thailand Viet Nam ASEAN
Darussalam
2007 2008 2009 2010 2011 2012 2013 2014
Source: he ASEAN Secretariat, Jakarta 2015. ASEAN Integration Report.
to reach 5.5% in 2017. Strong domestic demand, Literature cites that, the overall structure of
especially private consumption and investment, will economies in ASEAN has changed, since 2007.
drive economic growth while exports will play a Figure 3 indicates that, the services sector share
less important role. Indonesia is projected to reach a steadily increased to about 50.2% in 2014 while
growth rate of 6.4% over the period. Projected growth the agriculture sector share declined to 11.0%.The
in Singapore is 3.1%, Malaysia 5.1%, the Philippines share representing the industry sector, including
5.5% and Thailand 5.1%. Growth in other parts of the mining and quarrying, manufacturing, utilities and
region is projected to be more robust, with Cambodia construction, broadly remained unchanged at 38.0%.
reaching 6.9%, Lao PDR 7.4%, Myanmar 6.3% and In this context, brief geographical, socio economic
Viet Nam 5.6%.
3
IntroductionFigure 3
ASEAN Economic Sector’s Average Share
in Real GDP (%)
2014 11.0 38.0 50.2
2013 11.2 38.2 49.8
2012 11.4 38.4 49.1
2011 11.9 38.9 48.5
2010 12.0 39.5 47.7
2009 12.7 39.0 47.6
2008 12.7 39.7 46.9
0 10 20 30 40 50 60 70 80 90 100%
Agriculture Industry Services
Source: The ASEAN Secretariat, Jakarta 2015. ASEAN Integration Report.
and environmental profile of each ASEAN country of Brunei Darussalam’s GDP. In 2014, the industrial
has been described in Figure 3. sector (mining, manufacturing, construction, and
electricity and water) was the largest contributor
Brunei Darussalam (Brunei), is located on the accounting for BND 11,790 million (63%) of the GDP.
northwest coast of the island of Borneo in South This was followed by the services sector (transport
East Asia between latitude 4°30’N and longitude and communication, trade, finance, real estate, and
114°40’E. It has a total land area of 5,765 square other services in the private sector and government
kilometres with a coastline of 168 kilometres. It is services), which contributed BND 7084 million (37.9%)
bounded by the South China Sea on the north and to the GDP.The primary sector (agriculture, forestry
the East Malaysian states of Sarawak and Sabah on the and fishery) contributed BND 149 million (0.8%) to
east and west respectively. The population of Brunei the GDP. Most of the manufacturing companies are
Darussalam was estimated at 4,11,900 in 2014. In small and medium enterprises. These manufacturing
2010, Brunei Darussalam’s Gross Domestic Product companies produced roof products, cement, electrical
(GDP) at current prices was valued at BND 18,670 switch-board and electrical cable. There are nine
million and per capita income stood at BND 52,594. industrial sites located throughout the country with
4 Oil and natural gas accounts as the largest share a wide variety of manufacturing, services and storage
SUMMARY REPORT: WASTE MANAGEMENT IN ASEAN COUNTRIESactivities. Brunei Darussalam is a net importer of food. more people than any other sectors, accounting
In 2009 the country embarked on initiatives intended for 47.9% of the total labour force, followed by
to move it closer to self-sufficiency in food supply.The agriculture (38.9%) and industry (13.2%). Indonesia
government targeted to achieve 20% self-sufficiency has forested area accounting for 51.4% of total land
in rice production by 2010. Although the country area. Indonesia has reported net GHG emissions of
was largely self-reliant in terms of poultry and egg about 1377.97 million metric tonnes in 2000 and
production, much of the other primary staples of 1791.37 million metric tonnes in 2005. The country
grains, rice and livestock had to be imported. Domestic has extensive natural resources, including crude oil,
rice production which stood at 1,072 tonnes in 2010, natural gas, tin, copper, and gold, and major imports
represented only 3.31% of the total demand while the include machinery and equipment, chemicals, fuels, and
rest was supplied by imports. Brunei Darussalam’s net foodstuffs. Indonesia is one of the largest producer
GHG emissions for 2010 totaled 6.6 million metric and consumer of palm oil providing about half the
tonnes CO2 equivalent. world supply.The country’s major export commodities
include oil and gas, electrical appliances, plywood,
Cambodia is one of the fastest growing countries rubber, and textiles. The tourism sector is ranked as
in ASEAN. It has a population base of 15.33 million the 4th largest among goods and services export
(2014) with a surface area of 181035 sq.km. About sectors. Indonesia has a sizeable automotive industry,
80% of the population live in rural areas, however, the ranking as the 15th largest producer in the world.
average annual urban population growth rate (2.7%) Indonesia’s GDP growth has been slowing since 2012.
is higher than the average annual rural population It faces a number of development challenges, including
growth rate 1.5%. As per 2014 estimates, the country’s weak public service delivery management of land and
GDP was US$ 16.78 billion with an annual growth of natural resources and environmental sustainability due
above 7% at constant 2005 prices. Although agriculture to rapid urbanization and economic development.
is the backbone of the economy providing 51% of Growing economy, though sluggish with expected
total employment, the garment sector, together with increase in commodity demand, ineffective land and
construction and services sectors are the main drivers natural resources management and environmental
of the economy. Cambodia is rich in natural resources sustainability may lead to increased waste generation.
with forested area accounting for 55.7% of total
land area. Cambodia has reported a total net GHG Lao PDR is a landlocked country bordered by
emissions of -0.456 million tonnes of CO2 equivalent in Myanmar (Burma) and China to the northwest, Viet
year 2000. Growing economy and continued poverty Nam to the east, Cambodia to the south, and Thailand
reduction with ineffective land and natural resources to the west. It has a surface area of 236800 sq.km
management and environmental sustainability will lead with a population of 6689000, which is growing at
to increased waste generation. an average annual rate of 1.9%. Urban and rural
population accounts for 37.6% and 62.4% of total
Indonesia is one of the largest economies in Southeast population in Lao PDR. Average annual urban growth
Asia. It has a population base of 254.5 million (2014) rate is much higher (4.9%) than an annual rural growth
with a surface area of 1910931 sq.km. About 53% of rate (0.2%). Lao PDR’s economy is one of the fastest
the population live in urban areas with an average growing economies in the East Asia and Pacific region
annual urban population growth rate (2.7%) which is with an estimated GDP of $12.0 billion (2014). Its
higher than average annual rural population growth GDP growth averaged 7% over the last decade and
rate (-0.4%). As per 2014 estimates, the country’s GDP is projected at 7% in 2016. Subsistence agriculture
was US$ 888.5 billion with an annual growth of above accounts for nearly half of the GDP and provides
5% at constant 2005 prices.The industry sector is the 80% of employment. Lao PDRs natural resources are
economy’s largest and accounts for 46.4% of GDP mostly water, minerals and forests, which contribute
(2012), followed by services (38.6%) and agriculture 30% to its economic growth. More than 540 mineral
(14.4%). Since 2012, the service sector has employed deposits of gold, copper, zinc, lead and other minerals
5
Introductionhave been identified, explored and mined in Lao PDR. although it is threatened by the air and water pollution
Some fiscal expansion (with the deficit increasing along with deforestation affecting tourism. Malaysia is
to 3.9% of GDP) and investments add to domestic rich in natural resources with forested area accounting
demand, triggering economic growth in future. for 61.7% of total land area. It has reported GHG
Continued growth has resulted in lowering poverty emissions of -32.864 million metric tonnes of CO2
from 33.5% to 23.2% during the last decade. About equivalent in 2000 and 27.28 million metric tonnes of
72% of population has access to improved drinking CO2 equivalent in 2011. Malaysia has also succeeded
water sources, while 72% population uses improved in nearly eradicating poverty.The share of households
sanitation facilities. Lao PDR has abundant natural living below the national poverty line (USD 8.50 per
resources with 67.6% of the total land area as forest day in 2012) have currently fallen from over 50% in the
area. Its reported net GHG emission estimates are 1960s to less than 1%. About 100% of the population
about 41.76 million metric tonnes of CO2 equivalent uses improved drinking water sources, while 96% of
in 2000. Increasing commodity demand, triggering population uses improved sanitation facilities. In spite
greater consumption, coupled with increased mining of these achievements, Malaysia still faces a number
activity and expanding service sector may lead to an of development challenges.These include broadening
increase in waste generation. energy mix through enhancement of renewable
energy, energy efficiency, land transportation, waste
Malaysia is one of the open states that is oriented management and protection of forest carbon pools.
and industrialized, and is considered an upper-
middle income country in ASEAN. It has a population Myanmar is the largest country in mainland
of 29.90 million (2014) with a surface area of 330290 Southeast Asia. It has a surface area of 676577 sq.
sq.km. About 74% of the population live in urban areas. km. with a population of 53.44 million (2014). It has
Average annual urban population growth rate (2.7%) one of the lowest population densities in the region
is much higher than average annual rural population with 33.6% and 66.4% as urban and rural population,
growth rate (-1.2%). As per 2014 estimates, the respectively. Myanmar is endowed with fertile lands,
country’s GDP is US$ 338.1 billion with an annual significant untapped agricultural potential, and a rich
growth of above 4.7% at constant 2005 prices. In endowment of natural resources. Its geographic
2014, Malaysia’s economy grew 6%, the second highest location at the intersection of China and India, makes
growth behind the Philippines. About 28.4% of the it well positioned to resume it as a regional trading
total employed are in the industrial sector, while hub and a key supplier of minerals, natural gas and
only 12.6% are employed in the agricultural sector. agricultural produce. Its GDP is $64.33 billion with a
Malaysia has a diversified economy and has become growth rate of 8.5%. Economic growth in Myanmar
a leading exporter of electrical appliances, electronic fell to 7% in 2015/16 due to the floods in July 2015,
parts and components, palm oil, and natural gas. China, however its medium-term growth is projected to
Singapore and Japan are its major trading partners. average at 8.2% per year. Its major trading partners
Since the 1980s, the industrial sector, with a high are Thailand, China, India, Hong Kong SAR and
level of investment, has led the country’s growth. Singapore. Myanmar has a rich natural resources
International trade and manufacturing are the key base. It has 44.7% of total land area as forested area.
sectors of the economy, while manufacturing also has Myanmar has reported net GHG emissions of -67.8
a large influence in the country’s economy, eventhough million metric tones of CO2 equivalent in the year
Malaysia’s economic structure has been moving away 2000. Recently, growth has accelerated, buoyed by
from it.The country remains one of the world’s largest improved macroeconomic management, increased gas
producers of palm oil. In an effort to diversify the production and exports, and stronger performance
economy and make it less dependent on export in non-gas sectors as the economy opened up. With
goods, the government has promoted the service the increased economic activity, consumption pattern
sector e.g. tourism. As a result, tourism has become is expected to increase, leading to increased waste
6 Malaysia’s third largest source of foreign exchange,
SUMMARY REPORT: WASTE MANAGEMENT IN ASEAN COUNTRIESgeneration, which needs to be managed in a scientific (2014), with a growth rate of 2.9%. GDP grew with
manner. an average of 7.7% since the country’s independence
in 1965. In the first 25 years, growth topped 9.2%,
The Philippines is one of the most dynamic while per capita GDP, over the same period, grew by
economies in the East Asian region with a surface area 5.4% and 7.2%. Presently, the strong manufacturing
of 300,000 sq.km. a population of 99.14 million (2014), and services sectors have become the twin pillars of
and an annual growth rate of 1.7%. Urban population the Singapore economy. Financial sector, manufacturing
is 44.5% of total population with an annual urban and oil refining are the major contributors to its GDP.
population growth rate of 1.3%, while annual rural Its major exports are refined petroleum, integrated
population growth rate is 2.0%.The country has sound circuits and computers. Further, tourism is also the
economic fundamentals, with a GDP of $284.8 billion major contributor to its economy. Social indicators
and an average growth rate of above 5% in the past show that the country has a 98% employment rate
decade, significantly higher than in previous decades. with 100% population covered by improved drinking
The agricultural sector employs 30% of the labor force, water and sanitation facilities. Environmental indicators
and accounts for 14% of GDP. The industrial sector show that the total forested area is 3.3% of the total
employs around 14% of the workforce and accounts land area, while GHG emission estimates are about
for 30% of GDP. Meanwhile, the 47% of workers 46.83 million metric tonnes (2010). Considering
involved in the services sector are responsible for 56% its economic base, population projections waste
of the GDP. Industries such as tourism and business generation is expected to increase.
process outsourcing have been identified as areas
with some of the best opportunities for growth for Thailand is located at the centre of the indo-chinese
the country. Social indicators indicate that extreme peninsula, in mainland South East Asia. It has a total area
poverty decreased gradually from 10.6% in 2012 to of 513120 sq. km. with a population of 67.73 million.
9% in 2014. However, high rates of structural poverty Its urban population is 49.2% with an annual growth
remain, especially among households depending rate of 3%, which is much higher than the annual rural
on agriculture. About 92% of the population use growth rate of -2%.Thailand became an upper-middle
improved drinking water sources, while 74% has access income economy in 2011, as its economy grew at
to improved sanitation facilities. The Philippines has an average annual rate of 7.5% in the late 1980s
rich natural resources, with 26.1% as forested area and early 1990s, creating millions of jobs that helped
of the total land area. Its net GHG estimates are reduce the poverty rate. GDP of Thailand is $404.8
about 21.76 million metric tonnes of CO2 equivalent billion (2014) with a modest growth rate of 2.5%
in 2000. Increasing commodity demand triggering in 2015. Thailand’s economy is export- dependent,
greater consumption, coupled with increased growth contributing about 60% to GDP. Major exports include
and expanding service sector will lead to increase in rice, textiles, footwear, fishery products, rubber, jewelry,
waste generation. cars, computer and electrical appliances. Agriculture
and tourism are the other sectors, which contribute
Singapore is a sovereign state located in Southeast to the economy of the country. Households that
Asia, south to the southernmost tip of continental have access to clean drinking water and sanitation
Asia and peninsular Malaysia. It has a surface area facilities are about 95% and 93%, respectively. About
of 716 sq.km., with a population of 5.5 million. Its 37.2% of the total land area of Thailand is forested
total population is urban population, with an annual area, while net GHG emission estimates for the year
average growth rate of 2%. Singapore is a high-income 2000 were 157.86 million tonnes of CO2 equivalent.
economy with a gross national income of $55,150 per Expanding trade through enhanced integration with
capita, as of 2014. The country provides the world’s the global economy, implementing transformative
most business-friendly regulatory environments for public investments through private capital, enhanced
local entrepreneurs and is ranked among the world’s domestic consumption, and improving quality of public
most competitive economies. Its GDP is $307.9 billion services across the entire country is expected to revive
7
IntroductionFigure 4
CO2 emissions Per Capita for ASEAN Countries
30
CO2 emissions (metric tonnes per capita)
25
20
15
10
5
Brunei Malaysia Thailand Singapore Indonesia Viet Nam Philippines Lao PDR Cambodia Myanmar China Latin South Asia
Darussalam America
1990 2000 2012
Source: Report of ASEAN Regional Assessment of MDG Achievement & Post – 2015. Development
Priorities.
economy growth of Thailand. Enhanced production the total population, with an annual growth rate of 3%.
and consumption is expected to lead to higher waste Viet Nam’s GDP is 171222 million US$ with an annual
generation. growth rate of 5.4% at constant 2005 prices.Viet Nam has
transformed its economy from one of the poorest in the
Viet Nam is the easternmost country on the world, with per capita income around US $100, to lower-
Indochina peninsula in South East Asia. It has a surface middle income status, within a quarter of a century, with
8 area of 330972 sq. km. Urban population is 33% of per capita income of around US$2,100 by the end of
SUMMARY REPORT: WASTE MANAGEMENT IN ASEAN COUNTRIES2015. Agriculture is the major contributor to the consumption patterns have not become more CO2
economy accounting for 47% of employment, followed intensive but are the result of rapid economic growth.
by the manufacturing sector and service industry. Deforestation is progressing rapidly in most countries
Manufacturing, information technology and high tech (except for Viet Nam and the Philippines), especially
industries now form a large and fastest growing part in Myanmar, Indonesia and Cambodia, contributing
of the national economy. Agriculture products, oil and to soil erosion, impaired water cycles, and increased
gas, IT hardware are the major items for export. Social greenhouse effects. OECD estimates also indicate
indicators indicate that the fraction of people living that ASEAN countries natural capital accounts for
in extreme poverty dropped from more than 50% more than 20% of total wealth, well above the 2%
in the early 1990s to 3% in the present time. Access average in OECD countries. Since 2000, ASEAN
to clean water and modern sanitation has risen to countries have experienced a substantial rise in
95% and 75% households, respectively.Total forested material consumption and dramatic changes in
area is about 45.4% of the total land area. It has two material use profiles. Construction materials and
world natural heritage sites, six biosphere reserves and fossil fuels have been the fastest growing components
126 conservation areas, including 28 national parks. of material consumption, closely linked to growing
In year 2000, the country generated 150.9 million GDP. Large amounts of sand, gravel and other bulk
metric tons of CO2 equivalent.Viet Nam has boosted construction materials have been used to build urban
its international economic integration, however the transport infrastructure and manufacturing plants. Use
benefits are constrained by the absence of linkages of biomass for energy has also increased, although at
with domestic firms. Considering environmental a slower speed, as it is, closely linked to population
sustainability infrastructure development as one of growth. As a result of these trends, natural capital is
the key areas of its development strategy, a country being depleted at an increasing rate in most ASEAN
report on the waste management sector has been countries, especially in Brunei Darussalam, Indonesia,
prepared. Thailand and Viet Nam. Furthermore, waste generated
by households and businesses poses a serious
The CO2 emissions per capita for ASEAN countries environmental challenge in many ASEAN countries.
are shown in Figure 4. Global emissions of carbon Figure 5 indicates that while low and middle-income
dioxide (CO2) have increased, and in ASEAN, CO2 ASEAN countries produce considerably less waste
consumption, measured per capita, has increased in than more developed countries in the region (e.g.
all countries except for Singapore. These emissions, Singapore), the rapid urbanisation, industrialisation
when measured in relation to GDP indicate that, they and strong economic growth are likely to see the
have stagnated or fallen, reflecting that production and amount of waste increase rapidly.
9
IntroductionFigure 5
Projected Urban Waste Generation in
some ASEAN Countries
1..80
Kg per capita per day
1.60
1.40
1.20
1.00
0.80
0.60
0.40
0.20
Myanmar Philippines Viet Nam Lao PDR Indonesia Malaysia Thailand Singapore
1995 Predicted by 2025
Source: Report of ASEAN Regional Assessment of MDG Achievement & Post – 2015. Development
10 Priorities.
SUMMARY REPORT: WASTE MANAGEMENT IN ASEAN COUNTRIES02
Waste Management
and Technology
Profile
Waste management systems in ASEAN countries have been described as per three
waste streams i.e. Municipal Solid Waste (MSW), Hazardous waste/Industrial Waste,
and E-waste/Emerging Waste streams. Current status of waste generation for different
waste streams in ASEAN is summarized in Table 1.
Municipal Solid Waste (MSW) Generation
and Composition
Municipal solid waste has become a major concern in the present time, as the amount of waste
generation has increased tremendously due to rapid urbanization and industrialization, population
growth and improved life-styles. MSW primarily comes from households, but also includes wastes
from offices, hotels, shopping complexes/shops, schools, institutions, and from municipal services such
as street cleaning and maintenance of recreational areas. Indonesia is generating the highest quantity
of municipal waste with 64000000 tonnes per year, followed by Thailand (26770000 tonnes),Viet Nam
(22020000 tonnes), Philippines (14660000 tonnes), Malaysia (12840000 tonnes) and Myanmar (841508),
while Lao PDR is generating the lowest quantity of municipal solid waste (77380 tonnes). MSW generated
annually in ASEAN countries is given in Table 1 and Figure 6. Also, per capita generation of municipal waste in
ASEAN countries is given in Figure 7. On per capita basis, Singapore and Brunei Darussalam are the highest
MSW generators, followed by Malaysia, Thailand, Viet Nam, Indonesia, Lao PDR, Cambodia, Myanmar and the
Philippines.Table 1 Amount of Waste Generation and Composition of MSW in ASEAN Countries
Waste Generation
Per Capita MSW Annual Hazardous Annual E-waste
Generation (kg/capita/ Annual MSW Waste Generation (In Generation (In Metric
No. Countries day) Generation (In ton) MT) Kiloton ton)
1 Brunei Darussalam 1.4 210480
2 Cambodia 0.55 1089429
3 Indonesia 0.70 64000000
4 Lao PDR 0.69 77380 8.00
6 Malaysia 1.17 12840000 1517434.06
5 Myanmar 0.53 841508
7 Philippines 0.69 14660000 1693856.72 39000
8 Singapore 3.763 7514500 411180 110
9 Thailand 1.05 26770000 3300000 368.314
10 Viet Nam 0.84 22020000 1609.775
Source: Fourth ASEAN State of Environment Report 2009, available from: www.environment.asian.org (accessed 7 August
2016); AIT/UNEP, Municipal Waste Management Report: Status-quo and issues in Southeast and East Asia
Countries, 2010; Regional 3R Forum in Asia and the Pacific: Country Report; Baldé, C.P., Wang, F., Kuehr, R., and
Huisman, J., The Global E-waste Monitor, 2014, United Nations University; Country Presentation for 3R Meeting of
the Regional 3R Forum; and Basel Convention National Reports -Year 2014, available from: http://www.basel.int/
Countries/NationalReporting (accessed 7 August 2016); Ocean Conservancy and Trash Free Seas Alliance (2017),
the Next Wave: Investment Strategies for Plastic free Seas, p. 69, available from: http://www.oceanconservancy.org/
our-work/marine-debris/the-next-wave.pdf (accessed 20 March 2017).
12
SUMMARY REPORT: WASTE MANAGEMENT IN ASEAN COUNTRIESMSW Composition (%)
Food/
Organic Grass/Wood etc. Construction
Waste Paper Plastic Metal Glass Textile Rubber waste Debris Others
36 18 16 4 3
60 9 15 3 1 1
60 9 14 4.3 1.7 3.5 5.5 2.4
64 7 12 1 7 5 3
45 8.2 13.2 3.3 27.3
73 2.24 17.75 0.45 1.14 5.15
52 8.70 10.55 4.22 2.34 1.61
10.5 16.5 11.6 20.8 1.1 2.1 8.6 16.9 11.9
64 8 17.62 2 3 1.4 1 1
55 5 10 5 3 4
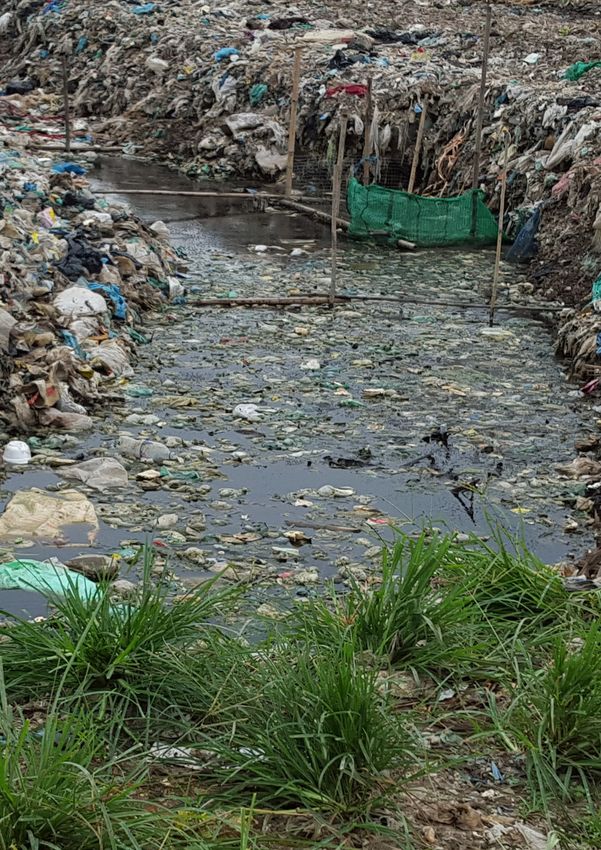
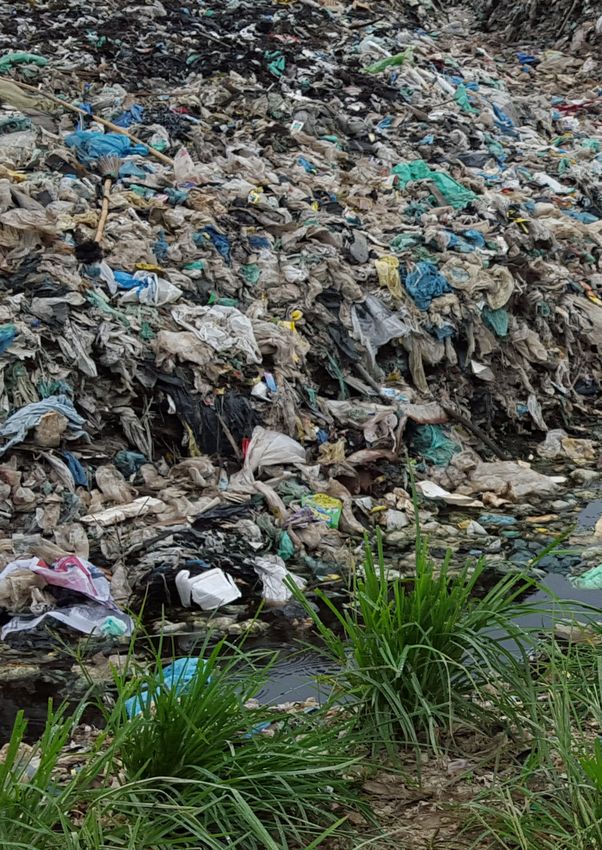
© Guilberto Borongan
13
Waste Management and Technology ProfileFigure 6
MSW Generation in ASEAN Countries
70,000,000
Tonnes per year
60,000,000
50,000,000
40,000,000
30,000,000
20,000,000
10,000,000
0 Brunei Cambodia Indonesia Lao PDR Malaysia Myanmar Philippines Singapore Thailand Viet Nam
Darussalam
Source: Jain Amit (2016).
Figure 7
Waste generated per capita in ASEAN Countries
4
Kg per person per day
3
2
1
0 Brunei Cambodia Indonesia Lao PDR Malaysia Myanmar Philippines Singapore Thailand Viet Nam
14 Darussalam
SUMMARY REPORT: WASTE MANAGEMENT IN ASEAN COUNTRIESThe MSW generated in the ASEAN countries is Myanmar, 73% of the MSW is organic waste, followed
composed mainly of organic waste, plastic, paper, by plastic (17.75%) and paper (2.24%); In Phillippines,
glass and metal. It has been found that 36% of the 52% of the MSW is organic waste, followed by Plastic
MSW generated in Brunei Darussalam is organic (10.55%) and Paper (8.70%). In Singapore, 10.5% of
waste, followed by paper (18%) and plastic (16%); the MSW is organic waste, followed by metal (20.8%),
In Cambodia, 60% of the MSW is organic waste, construction Debris (16.9%) and plastic (16.5%). In
followed by plastic (15%), paper (9%) and glass (3%); In Thailand, 64% of the MSW is organic waste, followed
Indonesia, 60% of the MSW is organic waste, followed by plastic (17.62%) and paper (8%). In Viet Nam, 55%
by plastic (14%) and paper (9%). In Lao PDR, 64% of of the MSW generated in the country is organic
the MSW is organic waste, followed by plastic (12%) waste, followed by Plastic (10%), Paper (5%) and Metal
and paper (7%); In Malaysia 45% of the MSW is organic (5%). Furthermore, the composition of MSW in the
waste, followed by plastic (13.2%) and paper (8.2%); In ASEAN countries is presented in Figure 8. Table 1 also
Figure 8
Composition of MSW in ASEAN Countries
MSW composition (%) in Brunei Darussalam MSW composition (%) in Cambodia
36% Fppt/organic waste 60% Fppt/organic waste
18% Paper 9% Paper
16% Plastic 15% Plastic
4% Metal 0% Metal
3% Glass 3% Glass
0% Textile 1% Textile
0% Rubber 1% Rubber
0% Grass/wood, etc waste 0% Grass/wood, etc waste
0% Construction debris 0% Construction debris
0% Others 0% Others
MSW composition (%) in Indonesia MSW composition (%) in Lao PDR
60% Food/organic waste 64% Food/organic waste
9% Paper 7% Paper
14% Plastic 12% Plastic
4.3% Metal 1% Metal
1.7% Glass 7% Glass
3.5% Textile 5% Textile
6% Rubber 3% Rubber
0% Grass/wood, etc waste 0% Grass/wood, etc waste
0% Construction debris 0% Construction debris
2.4% Others 0% Others
15
Waste Management and Technology ProfileMSW composition (%) in Malaysia MSW composition (%) in Myanmae
45% Food/organic waste 73% Food/organic waste
8.2% Paper 2.24% Paper
13.2% Plastic 17.75% Plastic
0% Metal 0% Metal
3.3% Glass 0.45% Glass
0% Textile 1.14% Textile
0% Rubber 0% Rubber
0% Grass/wood, etc waste 0% Grass/wood, etc waste
0% Construction debris 0% Construction debris
27.3% Others 5.15% Others
MSW composition (%) in Philippines MSW composition (%) in Singapore
52% Food/organic waste 10.5% Food/organic waste
8.7% Paper 16.5% Paper
10.55% Plastic 11.6% Plastic
14.6% Metal 20.8% Metal
2.34% Glass 1.1% Glass
1.61% Textile 2.1% Textile
0% Rubber 0% Rubber
0% Grass/wood, etc waste 8.6% Grass/wood, etc waste
0% Construction debris 17% Construction debris
0% Others 11.9% Others
MSW composition (%) in Thailand MSW composition (%) in Viet Nam
64% Food/organic waste 55% Food/organic waste
8% Paper 5% Paper
17.62% Plastic 10% Plastic
2% Metal 5% Metal
3% Glass 3% Glass
1.4% Textile 0% Textile
1% Rubber 4% Rubber
1% Grass/wood, etc waste 0% Grass/wood, etc waste
0% Construction debris 0% Construction debris
0% Others 0% Others
16
SUMMARY REPORT: WASTE MANAGEMENT IN ASEAN COUNTRIESFigure 9
Total amount of hazardous waste generated
in ASEAN Countries
3,500,000
Tonnes per year
3,000,000
2,500,000
2,000,000
1,500,000
1,000,000
500,000
0 Brunei Cambodia Indonesia Lao PDR Malaysia Myanmar Philippines Singapore Thailand Viet Nam
Darussalam
indicates that data on waste streams like construction Updated hazardous waste inventory data gaps exist
debris and rubber are not available, leading to an for Cambodia, Indonesia, Lao PDR, Myanmar, Viet
information gap. Organic waste constitutes a bulk Nam and Brunei Darussalam.
of MSW, offering opportunity for waste reduction.
Emerging Waste Streams (Plastic, Healthcare and
E-waste)
Industrial and
As per UNU’s Global E-waste monitor 2014, Indonesia
Hazardous Waste is generating the highest quantity of E-waste, with 745
metric kilotons per year, followed by Thailand (419
Industrial and hazardous waste data has been tabulated metric kilotonnes), Malaysia (232 metric kilotonnes),
based on country’s reporting to the secretariat of and Philippines (127 metric kilotonnes), while Brunei
the Basel convention. Hazardous waste generated Darussalem is generating the lowest quantity of
annually in ASEAN countries is given in Table 1 in electronic waste (7). E-waste generated annually by
Figure 9. Among the four ASEAN countries with ASEAN countries is given in Table 2 and shown in
updated hazardous waste inventory, Thailand is the Figure 10, while E-waste generated per inhabitant is
highest generator followed by The Philippines, Malaysia given in Figure 11. Plastic waste stream has already
and Singapore. been addressed in MSW, while hazardous waste also
includes healthcare waste.
17
Waste Management and Technology ProfileTable 2 Amount of E-Waste Generated in ASEAN Countries
Amount of E-Waste generated annually (In Metric
Country Per Inhabitant Generation (In Kg/Inh.) Kilotons)
Brunei Darussalam 18.1 7.00
Cambodia 1 16.00
Indonesia 3 745.00
Lao PDR 1.2 8.00
Malaysia 7.6 232.00
Myanmar 0.4 29.00
Philippines 1.3 127.00
Singapore 19.6 110.00
Thailand 6.4 419.00
Viet Nam 1.3 116.00
Source: UNU-IAS, 2014.
Figure 10
Annual E-Waste Generated in ASEAN Countries
800
Metric kilotonne
700
600
500
400
300
200
100
0 Brunei Cambodia Indonesia Lao PDR Malaysia Myanmar Philippines Singapore Thailand Viet Nam
Darussalam
18
SUMMARY REPORT: WASTE MANAGEMENT IN ASEAN COUNTRIESFigure 11
Per Inhabitant E-waste Generation
25
Kg/Inh.
20
15
10
5
0 Brunei Cambodia Indonesia Lao PDR Malaysia Myanmar Philippines Singapore Thailand Viet Nam
Darussalam
Technology profile for MSW in ASEAN countries is form of waste management, especially in the least
shown in Table 3. developed countries, although there are large
differences across countries. Open dumps are the
Table 3 indicates that practices like open dumping most hazardous waste disposal methods as they can
and open burning of MSW are practiced in countries, easily pollute air and ground water. Some countries
where recycling rate is less than 50%. Sanitary landfill have been taking decisive actions to limit urban waste
sites are the most common way for MSW disposal. production and dispose of it properly.
Composting is practiced in a limited manner. This
further indicates gaps in recycling infrastructure, as Technology profile related to industrial and hazardous
well as gaps in technology usage for MSW volume waste is summarized in Table 4.
reduction. ASEAN countries have limited experience
of composting and incineration. Table 4 indicates that majority of ASEAN countries,
except for Brunei Darussalam, Cambodia, Lao
Waste prevention and recycling rates are very low. PDR and Myanmar, have facilities for transport and
Sanitary landfills and open dumps are the predominant disposal of industrial and hazardous waste. Disposal
19
Waste Management and Technology ProfileTable 3 Technology – Municipal Solid Waste (MSW)
Technology Technology Gap
Treatment/Disposal
Sanitary Landfill
Open Burning
Open Dump
Composting
Incineration
Source Collection Rate
Country Segregation (Urban) Recycling Rate
Brunei DarussalamTable 4 Technology – Industrial Waste Including Hazardous Waste
Country Transportation Recycling/Recovery Disposal
Brunei Darussalam - +
Cambodia - -
Indonesia + +
Lao PDR - -
Malaysia + +
Myanmar - +
Philippines + +
Singapore + +
Thailand + +
Viet Nam + +
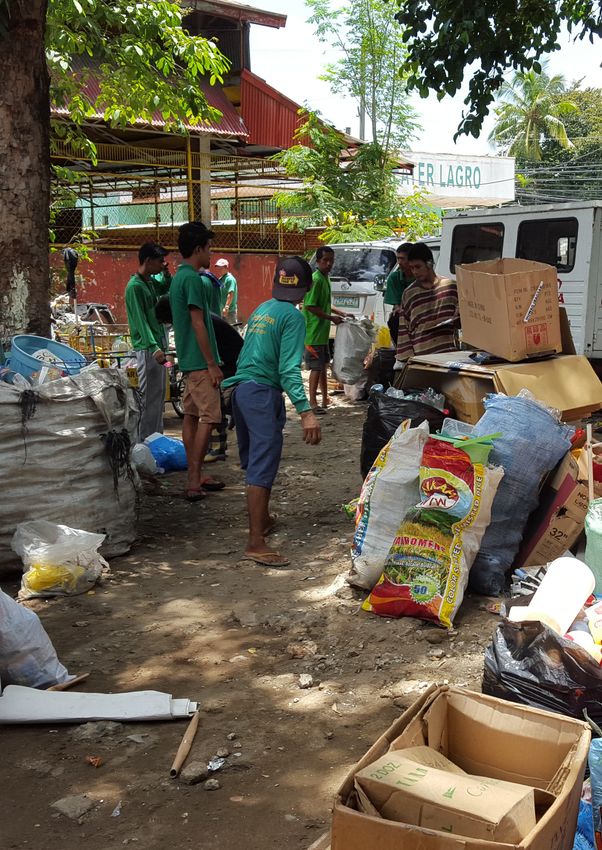
Incineration Sanitary landfill
© Guilberto Borongan
21
Waste Management and Technology ProfileTable 5 Technology - Emerging Waste Streams (Plastic, Healthcare and E-waste)
Recycling Treatment/Disposal
Country Plastic Healthcare E-waste Plastic Healthcare E-waste
Brunei Darussalam - - √ - - -
Cambodia - - - - √ -
Indonesia √ - √ √ √ √
Lao PDR - - - - - -
Malaysia √ - √ √ √ √
Myanmar √ - - - - -
Philippines √ - √ √ √ √
Singapore √ - √ √ √ √
Thailand √ - √ √ √ √
Viet Nam √ - √ √ √ √
√ Yes - No
high-end, though there is a need to augment recycling Regulatory framework indicates that MSW, industrial
rate to reduce pressure on disposal options. and hazardous waste have been broadly covered under
the regulatory framework. However, emerging waste
streams like E-waste are not specifically addressed.
Policy, Regulatory and Institutional responsibility related to each waste
stream for policy, programme, plan/strategy project,
Institutional Profile regulations, standards for ASEAN countries has been
described in Table 8, 9 and 10.
Countries across ASEAN have already established
national strategies to address challenges related to Table 8,Table 9 and Table 10 indicate that in all ASEAN
waste and environmental management. These get countries, MSW (except for Brunei Darussalam)
addressed broadly in their policy and regulatory and emerging waste streams is being regulated both
framework and strategies like green growth, sustainable at national and local level. Industrial and hazardous
development and climate change. A summary related waste is being regulated at national level in all ASEAN
to them has been presented in Table 6 and 7. Only two countries. All other countries have participation of
countries, Cambodia and Viet Nam focus specifically informal sector for all the waste streams. Analysis
on green growth. Other countries have designed also indicates issues related to implementation,
strategies, which pursue sustainable development more coordination, capacity (Technical, Financial, Human
broadly and address climate change. Other ASEAN Resources) and awareness of stakeholders across
countries have adopted a more limited approach, by the waste management chain. Gap analysis has also
integrating green growth considerations into other been carried out with respect to each waste stream
national plans, rather than preparing separate green in ASEAN countries.
growth strategies.
22
SUMMARY REPORT: WASTE MANAGEMENT IN ASEAN COUNTRIESTable 6 National ASEAN environment strategies vary in their focus on green growth
National green growth National sustainable
Countries strategy development strategy National climate change strategy
Brunei Darussalam National Vision, the
Wawasan Brunei
Darussalam 2035
Cambodia The National Green Growth Climate Change Strategic Plan
Roadmap (2009) (CCCSP) 2014-23
Indonesia • National Action Plan
Addressing Climate Change
(RAN MAPI) (2007)
• Indonesia Climate Change
Sectoral Roadmap (2009)
• The National Action Plan for
Greenhouse Gas Emissions
Reduction (RAN GRK)
(2011)
Lao PDR Strategy on Climate Change of
the Lao PDR (2010)
Malaysia National Green Technology
Policy (2009)
Myanmar National Sustainable
Development Strategy for
Myanmar (2009)
Philippines Philippine Agenda 21:
• National Framework Strategy
A National Agenda for
on Climate Change 2010-22
Sustainable Development
• National Climate Change
for the 21st Century
Action Plan 2011-28
(1996)
Singapore Sustainable Singapore National Climate Change
Blueprint (2015) Strategy (2012)
Thailand Draft Green Growth Twenty Years Country • National Strategy on Climate
Strategies (2015-2020) Strategies (2017-2036) Change 2008-12
National Master Plan on 11th National Social and • Thailand Climate Change
Cleaner Production (2008- Economic Development Master Plan 2012-50
2016) Plan (2012-2016) • National Strategy on Climate
Energy Efficiency Change 2013-17
Development Plan (2011-
2030)
National Industrial
Development Master Plan
(2012-2031)
Environmental Quality
Management Plan (2012-
2016)
Viet Nam National Green Growth Sustainable Development National Strategy on Climate
Strategy for the period Strategy for 2011-20 Change for 2011-20
2011-20 with a vision to
2050 • National Action Plan
on Green Growth for Period
2014-20
Source: OECD Green Growth Studies (2013). Towards Green Growth Southeast Asia.
23
Waste Management and Technology ProfileTable 7 Regulatory Framework
Countries Basic Act/Definitions
Brunei Darussalam As of date, Brunei Darussalam does not have a basic Act on Environment, although it is at
the draft stage. It has regulations and guidelines on waste and air pollution and regulations on
Hazardous Waste. As per the current regulations, various definitions of waste streams for waste
and hazardous waste have been defined.
Cambodia Cambodia has a basic Act on Environment, as well as regulations on air, water and waste
management. Regulation on waste management, “Sub Decree on Solid Waste Management 1999
amended in 2015” defines solid waste, household waste and hazardous waste.
Indonesia Indonesia has a basic Act on Environment, as well as regulations on air, water and waste
management. This act defines Waste, Hazardous and toxic material and Hazardous
and toxic waste.
Lao PDR Lao PDR has a basic Act on Environment as well as regulations on water and industrial waste
discharge. It has guidelines on “Environment Ambient Standards” and “Pollution Emission
Standards”. “Pollution from Waste” has been identified as a pollution under the basic act.
Industrial Waste Discharge regulation defines waste as sewage, wastewater, air pollution, toxic
waste, and hazardous waste, including sludge in form of solid, liquid or gas.
Malaysia Malaysia has a basic Act on Environment “Environmental Quality Act, 1974”, as well as regulations
on air, water and waste management. Regulations on waste management include “Solid Waste
and Public Cleansing Management Act 2007” and “Environment Quality (Schedule Wastes
Regulations 2005. These regulations define solid waste, household waste and hazardous waste.
As per the current regulations, various definitions of waste streams for waste, Municipal waste,
Hazardous waste, industrial effluent, sludge and sewage have been defined.
Myanmar Myanmar has a basic Act on Environment as well as regulations on water and Environmental
Conservation. Specific regulations on waste management do not exist. Hazardous waste
Management is covered in Environmental Conservation Rules 2014. As per the current
regulations, various definitions of waste streams for Pollutant and Waste have been defined.
Philippines Philippines has a basic Act on Environment as well as regulations on air, water and waste
management (Solid Waste and Hazardous Waste). Regulations on waste management, the
“Ecological Solid Waste Management, Act 2000”, defines solid waste, municipal waste, hazardous
waste, agriculture waste, bulky wastes, special wastes and yard waste. Philippine Toxic Substances,
Hazardous and Nuclear Waste Act 1990 covers hazardous waste. Other regulations covering
waste include Philippine Clean Water Act of 2004 and Philippine Clean Air Act of 1999.
Singapore Singapore has a basic act on Environment, “Environmental Protection and Management Act,
2002” as well as regulations on air, water and waste management. Regulations on waste
management include the “Environmental Public Health Act, 2002” and its subsidiary legislations.
As per its regulatory profile, definitions of waste streams for Waste, Municipal Waste and
Hazardous waste have been covered.
Thailand Thailand has a basic Act on Environment, “Environment and Conservation of National
Environmental Quality Act B.E. 2535 AD 1992” as well as regulations on air, water and waste
management. Regulations on waste management includes Public Health Act 1992 and Hazardous
Waste and Substances B.E. 2546 (2003), B.E. 2549 (2006), B.E. 2535 (1992) and B.E. 2548 (2005).
As per its regulatory profile, definitions of waste streams for Waste, Solid waste and Hazardous
Substance have been covered.
Viet Nam Viet Nam has a basic Act on Environment “Law on Environmental Protection 1993 amended in
2005”, as well as regulations on water and hazardous waste management. Law on Environmental
Protection defines waste, hazardous waste and hazardous materials. As per its regulatory profile,
definitions of waste streams for Waste, Hazardous waste, Municipal Solid Waste and Waste
24 materials have been covered.
SUMMARY REPORT: WASTE MANAGEMENT IN ASEAN COUNTRIESYou can also read