Pharmaceutical Expenditure And Policies - OECD Health Working Papers No. 87
←
→
Page content transcription
If your browser does not render page correctly, please read the page content below
Please cite this paper as:

 Belloni, A., D. Morgan and V. Paris (2016), “Pharmaceutical
 Expenditure And Policies: Past Trends And Future
 Challenges”, OECD Health Working Papers, No. 87, OECD
 Publishing, Paris.
 http://dx.doi.org/10.1787/5jm0q1f4cdq7-en

 OECD Health Working Papers No. 87

Pharmaceutical Expenditure
And Policies
PAST TRENDS AND FUTURE CHALLENGES

Annalisa Belloni, David Morgan,
Valérie Paris

JEL Classification: I18
Unclassified                                                                                 DELSA/HEA/WD/HWP(2016)10
                                              Organisation de Coopération et de Développement Économiques
                                              Organisation for Economic Co-operation and Development                          19-Apr-2016
                                              ___________________________________________________________________________________________
                                              _____________                                                            English - Or. English
                                              DIRECTORATE FOR EMPLOYMENT, LABOUR AND SOCIAL AFFAIRS
                                              HEALTH COMMITTEE
Unclassified
DELSA/HEA/WD/HWP(2016)10

                                              Health Working Papers

                                              OECD Health Working Paper No.87
                                              PHARMACEUTICAL EXPENDITURE AND POLICIES: PAST TRENDS AND FUTURE
                                              CHALLENGES

                                              Annalisa Belloni, David Morgan, Valérie Paris

                                              JEL Classification: I18 (Government Policy, Regulation, Public Health)

                                              Authorized for publication by Stefano Scarpetta, Director, Directorate for Employment, Labour and Social
                                              Affairs

                                              All Health Working Papers are now available through the OECD's Internet Website at
                                              http://www.oecd.org/els/health-systems/health-working-papers.htm
                      English - Or. English

                                              JT03394302
                                              Complete document available on OLIS in its original format
                                              This document and any map included herein are without prejudice to the status of or sovereignty over any territory, to the delimitation of
                                              international frontiers and boundaries and to the name of any territory, city or area.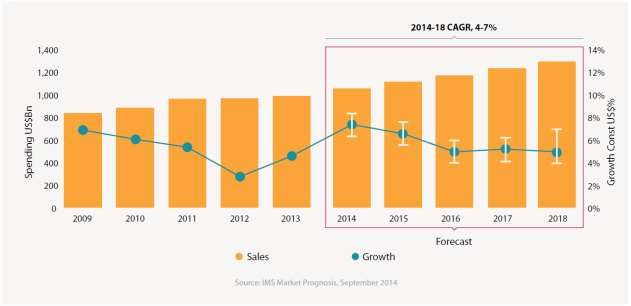
DELSA/HEA/WD/HWP(2016)10

     DIRECTORATE FOR EMPLOYMENT, LABOUR AND SOCIAL AFFAIRS

                                              www.oecd.org/els

                      OECD HEALTH WORKING PAPERS
                    http://www.oecd.org/els/health-systems/health-working-papers.htm

   OECD Working Papers should not be reported as representing the official views of the OECD or of its
member countries. The opinions expressed and arguments employed are those of the author(s).

     Working Papers describe preliminary results or research in progress by the author(s) and are
published to stimulate discussion on a broad range of issues on which the OECD works. Comments on
Working Papers are welcomed, and may be sent to the Directorate for Employment, Labour and Social
Affairs OECD, 2 rue André-Pascal, 75775 Paris Cedex 16, France.

     This series is designed to make available to a wider readership selected health studies prepared for use
within the OECD. Authorship is usually collective, but principal writers are named. The papers are
generally available only in their original language – English or French – with a summary in the other.

     The statistical data for Israel are supplied by and under the responsibility of the relevant Israeli
authorities. The use of such data by the OECD is without prejudice to the status of the Golan Heights, East
Jerusalem and Israeli settlements in the West Bank under the terms of international law.

      This document and any map included herein are without prejudice to the status of or sovereignty over
any territory, to the delimitation of international frontiers and boundaries and to the name of any territory,
city or area.

                         Applications for permission to reproduce or translate
                            all or part of this material should be made to:

                                       Head of Publications Service
                                                  OECD
                                           2, rue André-Pascal
                                         75775 Paris, CEDEX 16
                                                  France

                                          Copyright OECD 2016

                                                      2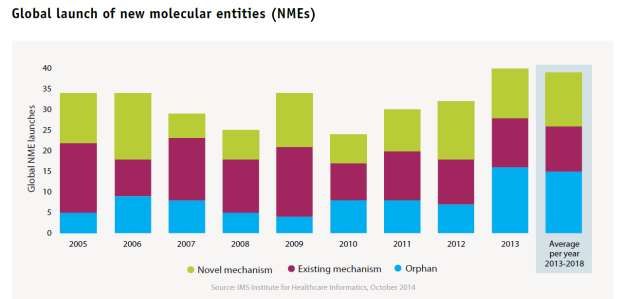
DELSA/HEA/WD/HWP(2016)10

                                  ACKNOWLEDGEMENTS

     The authors would like to thank Francesca Colombo, Mark Pearson and Stefano Scarpetta (OECD
Directorate for Employment, Labour and Social Affairs) as well as Dirk Pilat and Hermann Garden
(OECD Directorate for Science, Technology and Industry) for their comments.

                                               3
DELSA/HEA/WD/HWP(2016)10
ABSTRACT
Across OECD countries, pharmaceutical spending reached around USD 800 billion in 2013,
accounting for about 20% of total health spending on average when pharmaceutical consumption in
hospital is added to the purchase of pharmaceutical drugs in the retail sector. This paper looks at recent
trends in pharmaceutical spending across OECD countries. It examines the drivers of recent spending
trends, highlighting differences across therapeutic classes. While the consumption of medicines continues
to increase and to push pharmaceutical spending up, cost-containment policies and patent expiries of a
number of top-selling products have exerted downward pressure on pharmaceutical expenditures in recent
years. This resulted in a slower pace of growth over the past decade.
The paper then looks at emerging challenges for policy makers in the management of pharmaceutical
spending. The proliferation of high-cost specialty medicines will be a major driver of health spending
growth in the coming years. While some of these medicines bring great benefits to patients, others provide
only marginal improvements. This challenges the efficiency of pharmaceutical spending.
RÉSUMÉ
Les dépenses pharmaceutiques ont atteint environ 800 milliards USD en 2013 dans les pays de
l’OCDE, soit environ 20 % en moyenne des dépenses de santé totales lorsque l’on ajoute la consommation
hospitalière de produits pharmaceutiques à l’achat de médicaments au détail. Ce document examine les
tendances récentes en matière de dépenses pharmaceutiques dans les pays de l’OCDE. Il examine les
déterminants de l’évolution récente des dépenses, en soulignant les différences entre les classes de
médicaments. Alors que la consommation de médicaments continue d’augmenter et de pousser à la hausse
les dépenses pharmaceutiques, les politiques de maîtrise des coûts et l'expiration des brevets d'un certain
nombre de produits les plus vendus ont exercé une pression à la baisse sur ces dépenses au cours des
dernières années. Cela a entraîné un ralentissement de la croissance au cours de la dernière décennie.
Le document se penche ensuite sur les défis émergents pour les décideurs politiques en ce qui
concerne la gestion des dépenses pharmaceutiques. La prolifération de médicaments de spécialité à coût
élevé sera un moteur important de la croissance des dépenses de santé dans les années à venir. Alors que
certains de ces médicaments apportent de grands avantages aux patients, d'autres ne fournissent que des
améliorations marginales. Cela remet en question l'efficacité des dépenses pharmaceutiques.
4DELSA/HEA/WD/HWP(2016)10
TABLE OF CONTENTS
ACKNOWLEDGEMENTS ............................................................................................................................3
ABSTRACT ....................................................................................................................................................4
RÉSUMÉ .........................................................................................................................................................4
PHARMACEUTICAL EXPENDITURE AND POLICIES: PAST TRENDS AND FUTURE
CHALLENGES ...............................................................................................................................................8
Executive Summary .....................................................................................................................................8
INTRODUCTION .........................................................................................................................................10
LEVELS AND TRENDS IN PHARMACEUTICAL EXPENDITURE.......................................................11
One in every five health dollars is spent on pharmaceuticals across OECD countries ..............................11
Hospital spending on pharmaceuticals should be added to get a full picture .........................................14
Pharmaceutical spending has been increasing at a slower pace since the mid-2000s................................15
Pharmaceutical spending in hospitals has increased over time ..............................................................17
Private spending has not been subject to the same falls as public spending in recent years ......................18
CHANGES IN HEALTH NEEDS, MARKET DYNAMICS, AND COST-CONTAINMENT POLICIES
DRIVE SPENDING GROWTH....................................................................................................................20
Pharmaceutical spending growth results from changes in prices, quantity and therapeutic mix ...............20
The prices of medicines most often remain stable or decline after market entry ...................................21
The quantity of drugs used tends to increase .........................................................................................22
Changes in the therapeutic mix is a key component of spending growth but varies across therapeutic
areas........................................................................................................................................................24
Changes in health needs and clinical practice explain the continuous growth in consumption .................25
Demographic and epidemiologic changes tend to increase pharmaceutical consumption .....................25
Changes in practice guidelines affect volumes consumed .....................................................................26
Pharmaceutical market dynamics mainly affect prices and therapeutic mix .............................................26
New and innovative drugs expand treatment options and increase treatment costs ...............................27
Patent losses have contributed to the slower pace of growth .................................................................27
Pharmaceutical policies have recently focused on cost containment.........................................................28
Price cuts have been very common ........................................................................................................29
Cost-sharing requirements led to a shift from public to private spending..............................................29
HTA and Managed Entry Agreements are increasingly used to inform coverage decisions .................30
Strengthened generic policies have reduced prices ................................................................................30
Coverage expansion contributed to spending growth only in a few countries .......................................32
5DELSA/HEA/WD/HWP(2016)10
FUTURE SPENDING TRENDS AND KEY POLICY CHALLENGES .....................................................33
Pharmaceutical spending is expected to grow in some countries but growth in European markets is
expected to be slower .............................................................................................................................34
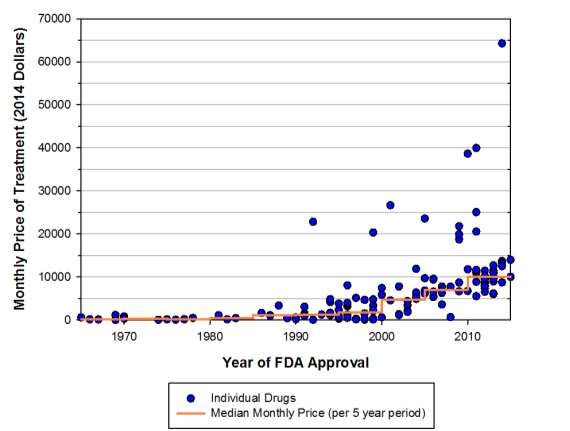
The number of high-cost drugs and their prices will continue to grow ..................................................34
High prices are an important barrier to access .......................................................................................37
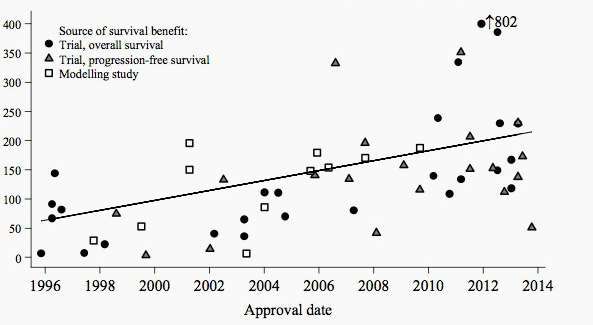
High prices are not always justified by high benefits.............................................................................37
Barriers to biosimilars’ uptake delay potential savings ..........................................................................38
CONCLUSIONS AND DISCUSSION .........................................................................................................40
REFERENCES ..............................................................................................................................................42
ANNEX 1: REAL PER CAPITA PHARMACEUTICAL EXPENDITURE GROWTH 2005-2013 ...........47
ANNEX 2. TRENDS IN CONSUMPTION AND TREATMENT COSTS ACROSS THERAPEUTIC
CLASSES ......................................................................................................................................................51
Changes in market structure by therapeutic class...................................................................................51
Antidiabetic drugs ..................................................................................................................................52
Hypertension drugs ................................................................................................................................54
Cholesterol-lowering drugs ....................................................................................................................55
Antibacterials .........................................................................................................................................56
Antidepressants ......................................................................................................................................56
ANNEX 3: PHARMACEUTICAL COST CONTAINMENT POLICIES INTRODUCED IN OECD
COUNTRIES AFTER 2008 ..........................................................................................................................57
ANNEX 4: METHODS TO FORECAST PHARMACEUTICAL SPENDING...........................................73
Tables
Table 1. The drivers of health spending growth and their impact on each component of growth .............20
Table 2. Pharmaceutical cost-containment policies ...................................................................................28
Table A1. Pricing Policies .........................................................................................................................58
Table A2: Reimbursement policies ............................................................................................................64
Table A3: Policies to boost the use of generics .........................................................................................68
6DELSA/HEA/WD/HWP(2016)10
Figures
Figure 1. Per capita spending on retail pharmaceuticals in USD PPP, 2013 .............................................11
Figure 2. Spending on retail pharmaceuticals as a share of GDP, 2013 ....................................................13
Figure 3. Total (retail and hospital) pharmaceutical spending, per capita USD PPP, 2013 or latest year
available .....................................................................................................................................................14
Figure 4. Average annual growth in health and retail pharmaceutical expenditure, OECD average, 1990-
2013 ...........................................................................................................................................................15
Figure 5. Annual real growth in retail pharmaceutical and health spending, 2005-2013 ..........................16
Figure 6. Retail pharmaceutical spending growth before and after 2009 (real terms) ...............................17
Figure 7. Pharmaceutical expenditure in hospitals as a share of total pharmaceutical expenditure
(retail+hospital), 2005 and 2013 ................................................................................................................18
Figure 8. Annual growth in public and total retail pharmaceutical spending, OECD countries, 2005-201319
Figure 9. Pharmaceutical price indices, Finland, France and the United States, 2002-2012 .....................22
Figure 10. Trends in pharmaceutical consumption ....................................................................................23
Figure 11. Annual growth in sales and consumption of antidiabetic drugs, Denmark, 2005-2013 ...........24
Figure 12. Annual growth in sales and consumption of lipid-lowering drugs, Germany, 2005-2013 .......25
Figure 13. Per capita spending on retail pharmaceuticals by age, Korea (won) and the Netherlands
(euros), 2011 ..............................................................................................................................................26
Figure 14.Trends in generic market shares in volume and in value in OECD countries between 2003 and
2013 ...........................................................................................................................................................31
Figure 15. Trend in global drug sales and growth, 2009-2018 ..................................................................33
Figure 16. Monthly and median costs of cancer drugs at the time of FDA approval 1965-2015 in the
United States ..............................................................................................................................................35
Figure 17. Global launches of new molecular entities ...............................................................................37
Figure 18. Price per life-year gained and approval date of oncology medicines, United States, 1996-201438
Figure A1. Composition of pharmaceutical sales by ATC group, 2005 and 2013 ....................................52
Figure A2. Annual growth in sales and consumption of antidiabetic drugs, Finland, 2005-2013 .............54
Figure A3. Annual growth in sales and consumption of hypertension drugs, Sweden, 2003-2012 ..........55
Figure A4. Annual growth in sales and consumption of lipid-lowering drugs, Portugal, 2005-2013 .......56
Figure A5. Annual growth in sales and consumption antidepressants, Germany, 2005-2013 ..................57
Boxes
Box 1. Pharmaceuticals: understanding the terms .....................................................................................12
Box 2. OECD data on sales and consumption by therapeutic classes .......................................................51
7DELSA/HEA/WD/HWP(2016)10
PHARMACEUTICAL EXPENDITURE AND POLICIES: PAST TRENDS AND FUTURE
CHALLENGES
Executive Summary
1. Pharmaceuticals account for a significant share of overall health care spending across OECD
countries. On average, when hospital use is included, one out of every five health dollars goes on
purchasing pharmaceuticals. As such, trends in pharmaceutical spending contribute largely in determining
overall health spending patterns.
2. From the 1980s onwards, the growth in the use of new drugs resulted in rapidly increasing
pharmaceutical spending. This helped to drive the share of health spending in the economy from less than
7% in the 1980s to more than 9% in the early 2000s, as health spending growth outpaced economic growth
in many OECD countries. However, since the mid-2000s, the pace of pharmaceutical spending has
generally slowed compared with other areas of health care expenditure, such as in the hospital and
outpatient sectors. The global financial and economic crisis, which led to widespread reductions in public
spending and the introduction of cost-containment policies, coinciding with patent losses of several top
selling drugs put further downward pressures on pharmaceutical spending. While the extent of the
slowdown varies widely across OECD countries, nearly all have seen a reduction in pharmaceutical
spending growth since the onset of the crisis, and a number of European countries have seen more dramatic
reductions. At the same time, the majority of OECD countries have seen private spending account for a
bigger share of total pharmaceutical expenditure over the last decade.
3. Trends in pharmaceutical spending result from a combination of changes in the prices of existing
drugs; changes in the volume consumed; and changes in the therapeutic mix of medicines used. In turn,
these components are driven by a range of factors related to demographic and epidemiologic trends,
pharmaceutical markets’ own dynamics (entry of new medicines and patent expiries), changes in medical
practice and pharmaceutical policies. All these factors can interact differently across countries and across
therapeutic areas.
4. The analysis of pharmaceutical spending patterns (including detailed therapeutic classes), in
conjunction with a study of the development of high-cost speciality drugs, has led to the following key
findings:
Retail pharmaceutical spending (excluding hospital consumption) accounts for 15% of health
spending on average across OECD countries, equivalent to more than USD 500 per capita in
2013. To get a full picture, spending on pharmaceuticals in hospitals can add another USD 50-
100 per head, depending on the country.
While retail pharmaceutical spending grew at a slower pace or even declined since the onset of
the recent crisis, hospital pharmaceutical spending has tended to expand in a number of countries.
Over the past few years, the consumption of pharmaceuticals has increased dramatically due to
population ageing, the growing prevalence of chronic diseases and changes in clinical practices.
8DELSA/HEA/WD/HWP(2016)10
The prices of existing drugs have been stable or even declining in a number of OECD countries –
but not all- due to regulation and generic competition.
Changes in the therapeutic mix have been an important driver of spending growth, driving
treatment costs upward, especially in therapeutic classes where new and more expensive products
have entered the market (e.g. antidiabetics). In other classes, such as cholesterol-lowering
products and anti-hypertensive drugs, treatment costs have remained stable or declined in the
recent period due to patent expiries of important products.
The patterns of pharmaceutical spending growth (components of growth and underlying drivers)
differ widely across therapeutic classes and across countries and the respective roles of individual
factors in overall spending drugs are not easy to disentangle. However, the most important
determinants of spending in recent years seem to be: increase in demand for pharmaceuticals;
patent expiries of very important products; and cost-containment policies in many OECD
countries.
Expensive speciality drugs, mainly in oncologic and immuno-modulating, now account for one
third of retail pharmaceutical spending, at least in the United States, and their share in spending is
expected to increase. They are expected to account for half of future spending growth in North
America between 2013 and 2018 and to explain the totality of growth in European countries over
the same period.
The number of biologics and other speciality drugs is increasing, providing treatment to a
growing number of patients. The prices of these drugs are skyrocketing in some therapeutic areas,
such as oncology, multiple sclerosis and rare diseases.
Reviewed evidence suggests that such high prices may not always be proportionate to the
benefits for patients, as measured in terms of additional years of life. This questions the value of
these drugs for health systems.
Finally, predicted trends raise questions in terms of efficiency of pharmaceutical spending, i.e. do
we get the highest possible value for the money we spend today?
These trends also raise questions in terms of affordability and access for all patients who need
these treatments.
9DELSA/HEA/WD/HWP(2016)10
INTRODUCTION
5. Spending on pharmaceuticals is a major component of health care expenditure. The importance
of the sector means that the amount of resources allocated to purchasing pharmaceuticals can have a
significant impact on overall growth trends. For a long period, the rapid increase in pharmaceutical
spending had been one of the major contributors to overall growth in health expenditure and consequently
the growing importance of health in the economy. In more recent years, pharmaceutical spending growth
has tended to lag behind other spending areas such as in the hospital and outpatient sectors. Furthermore,
since the onset of the global economic crisis in 2008, many OECD countries have seen spending on
pharmaceuticals drop in real terms.
6. The level and trend in pharmaceutical spending is influenced by a whole range of drivers
affecting both the supply and demand for medicines. In addition to the demographic factors, such as the
overall size and ageing of the population - that is, pharmaceutical use increases with age - changes
affecting the volume, structure of consumption and pricing of pharmaceuticals can have a greater effect.
7. This paper first examines the current levels and recent trends in pharmaceutical spending across
OECD countries broken down by type of pharmaceutical products and by financing at an aggregate level.
It then analyses the determinants of pharmaceutical spending growth over recent years, looking at: the
components of growth (volumes, prices and “quality”) as well at drivers of growth, such as increasing
demand for pharmaceutical, pharmaceutical markets dynamic and pharmaceutical policies implemented.
Finally, the challenges countries are facing due to the increasing use and availability of high-cost drugs are
discussed.
10DELSA/HEA/WD/HWP(2016)10
LEVELS AND TRENDS IN PHARMACEUTICAL EXPENDITURE
One in every five health dollars is spent on pharmaceuticals across OECD countries
8. Latest comparative figures show that average retail pharmaceutical spending, that is excluding
hospital use, across OECD countries amounted to over 500 USD per capita in 2013.1 This equates to an
average of around 15% of current health spending. Compared with overall health expenditure there tends
to be less variation in pharmaceutical spending with more than two-thirds of OECD countries spending
within 30% of the OECD average. That said, the United States still stands out as the highest spending
country at 1 026 USD per capita - twice the OECD average – with the next highest spending countries
being Japan, Greece and Canada at over 700 USD. By contrast, Denmark spent less than half the OECD
average on retail pharmaceuticals in 2013.
Figure 1. Per capita spending on retail pharmaceuticals in USD PPP, 2013
Prescribed medicines Over-the-counter medicines Total (no breakdown)
United States 858 168 1026
Japan 641 111 752
Greece 721 721
Canada 647 66 713
Germany 598 80 678
Switzerland 538 128 666
Ireland 653 653
Belgium 524 79 603
France 493 104 596
Australia 404 186 590
Italy 572 572
Austria 426 110 536
Slovak Republic 533 533
Spain 358 167 526
OECD 404 111 515
Hungary 503 503
Slovenia 367 114 481
Finland 395 64 459
Sweden 334 125 459
Korea 353 84 436
Netherlands 397 397
Iceland 304 92 397
Portugal 392 392
Czech Republic 298 83 381
Norway 367 367
Luxembourg 364 364
Poland 157 169 326
Israel 287 287
Estonia 210 63 273
Denmark 191 49 240
0 200 400 600 800 1000
Note: Greece, Ireland, Italy, Netherlands, Portugal and Slovak Republic include non-durable medical goods.
Source: OECD Health Statistics 2015
1
Expenditures are converted to dollars using Purchasing Power Parities (PPPs) to take account of exchange
rates and differences in general price levels between countries (See Box1).
11DELSA/HEA/WD/HWP(2016)10
9. Figure 1 also shows the split between spending on prescribed medicines and over-the-counter
(OTC) medicines (See Box 1 for definitions). Spending on prescribed medicines, at around 400 USD on
average, is typically around 4 times that of OTC medicines. There is a high degree of variation between
countries: Spain, Australia and Poland report a high share of OTC in the overall total of pharmaceutical
spending, while Canada, Germany and Belgium report a much lower proportion. This can be explained to
an extent by differences in the boundaries applied to OTC goods. Some countries may include a number of
non-health goods, which are difficult to separate out from the sales of health goods. On the other hand,
OTC expenditures may be underestimated if, for example, all pharmaceutical sales channels (e.g.
supermarkets, online pharmacies, etc.) are not sufficiently covered.
Box 1. Pharmaceuticals: understanding the terms
Pharmaceuticals (and other non-durable medical goods) form part of the International Classification of Health Accounts
of Health Care Functions (ICHA-HC) which defines health care goods and services. This is subdivided into Prescribed
medicines, Over the counter (OTC) medicines and Other non-durables.
Prescribed medicines are medicines supplied only in licensed pharmacies on the presentation of signed prescriptions issued
by a licensed and registered medical practitioner, licensed and/or registered dentist (for dental treatment only) and the supply and
dispensing of these medicines must be carried out by a pharmacist or under the supervision of a pharmacist. Over-the-counter
(OTC) drugs may be dispensed without a prescription. In some countries they are available via self-service in pharmacies and/or
other retail outlets (e.g. drugstores or supermarkets). This separation is different from reimbursed versus non-reimbursed
medicines. Reimbursed drugs are medicines whose cost is covered by a third party payer (e.g. Social Health Insurance/National
Health Service) However, the overlap can be substantial and some countries may report figures according to the reimbursement
rather than the prescribing criterion. Selected OTC medicines may also be reimbursed for certain indications in some countries.
Finally, other non-durable goods include bandages, plasters, syringes, etc. but account for only a minor share of the overall
pharmaceutical and non-durable medical goods total – typically around 5-10%.
The categories of pharmaceuticals above refer to retail pharmaceuticals, delivered to patients via pharmacies and other
retail outlets. Pharmaceuticals are also consumed in other care settings – primarily the hospital inpatient sector – where by
convention the pharmaceuticals used are considered as an input to the overall service treatment and not separately accounted. That
said, health accounts do allow for an additional reporting item to report a total pharmaceutical spending estimate covering all
modes of provision. Currently only a handful of countries are able to submit such figures.
For international comparisons, Purchasing Power Parities (PPPs) are spatial deflators and currency converters that take
into account and eliminate the effect of different price levels thus allowing comparisons of spending in a common currency - in
this case US dollars. To measure temporal changes in volume, relevant price indices are used to deflate national spending. Both
measure the changes in price for a basket of comparable and representative goods either over time or between countries.
A further set of definitions are provided for various groups of pharmaceuticals:
Generic drugs are pharmaceutical products which have the same qualitative and quantitative composition in active
substances and the same pharmaceutical form as a reference medicinal product, and whose bioequivalence with the reference
medicinal product has been demonstrated by appropriate bioavailability studies. The different salts, esters, ethers, isomers,
mixtures of isomers, complexes or derivatives of an active substance shall be considered to be the same active substance, unless
they differ significantly in properties with regard to safety and/or efficacy. In such cases, additional information providing proof of
the safety and/or efficacy of the various salts, esters or derivatives of an authorised active substance must be supplied by the
applicant. Generics can be further classified into branded generics (generics with a specific trade name) and unbranded generics
(which use the international non-proprietary name and the name of the company).
The above definition refers to European legislation. However, it should be noted that there is a variety of different,
sometimes overlapping, definitions of the term ‘generics’ due to differences in the requirements for registration of generics
between countries, especially related to the degree and proof of therapeutic equivalence and the fact that they can be sold under
brand (branded generics) or International Nonproprietary Name (unbranded generics). The World Health Organization (WHO)
defines generics as multi-source pharmaceutical products that are therapeutically equivalent are interchangeable, not taking into
consideration of whether or not the ‘originator’ molecule is, or was, under patent protection.
Biological medicines are medicines that are made by or derived from a biological source, such as a bacterium or yeast. They
can consist of relatively small molecules, such as human insulin or erythropoietin, or complex molecules, such as monoclonal
12DELSA/HEA/WD/HWP(2016)10
antibodies. A biosimilar is a biological medicine that is similar to another biological medicine that has already been authorized for
use.
Specialty medicines do not have a unique definition. They usually include injectable and biologic agents used to treat
complex conditions such as rheumatoid arthritis, multiple sclerosis and cancer and often require special handling or delivery
mechanisms.
Orphan drugs refer to medicines developed for rare conditions. Countries use different thresholds to consider that a disease
is rare: “rare conditions” are those which affect less than one in 1 500 people in the United States, less than one in 2 000 people in
the European Union and less than one in 2 500 people in Japan. The United States and the European Union have implemented
policies to encourage private investments in R&D for rare diseases (e.g. increased market exclusivity) and have consequently
defined criteria to be met by a medicine to be granted an “orphan drug status”. In the European Union, those criteria are: the
severity of the disease; the fact that it serves an unmet need; and either prevalence below one in 2 000 or a negative expected return
on investment.
Sources: OECD health Statistics, Source and methods; PPRI glossary
10. In terms of share of GDP, OECD countries spent, on average, around 1.4% of GDP in 2013 on
retail pharmaceuticals (Figure 2). Again, there is considerable variation with Greece spending twice that
level as a share of GDP, whereas Denmark and Norway spent less than half.
Figure 2. Spending on retail pharmaceuticals as a share of GDP, 2013
Public Private
Greece 1.9 0.9 2.8
Hungary 0.9 1.3 2.2
Japan 1.5 0.6 2.1
Slovak Republic 1.3 0.7 2.0
United States 0.6 1.3 1.9
Slovenia 0.8 0.9 1.7
Canada 0.6 1.1 1.7
Spain 1.0 0.6 1.6
Italy 0.8 0.8 1.6
Germany 1.2 0.4 1.6
France 1.1 0.5 1.6
Belgium 1.0 0.5 1.5
Ireland 1.1 0.3 1.4
OECD 0.8 0.6 1.4
Portugal 0.8 0.6 1.4
Australia 0.7 0.7 1.4
Czech Republic 0.8 0.5 1.3
Poland 0.4 0.9 1.3
Finland 0.6 0.6 1.2
Korea 0.7 0.5 1.2
Switzerland 0.8 0.3 1.1
Estonia 0.6 0.5 1.1
Austria 0.8 0.3 1.1
Sweden 0.5 0.5 1.0
Iceland 0.4 0.5 0.9
Netherlands 0.2 0.9
Denmark 0.3 0.3 0.6
Luxembourg 0.5 0.1 0.6
Norway 0.3 0.2 0.5
0.0 0.5 1.0 1.5 2.0 2.5 3.0
Note: Greece, Ireland, Italy, Netherlands, Portugal and Slovak Republic include non-durable medical goods.
Source: OECD Health Statistics 2015
11. Figure 2 also shows the financing split of retail pharmaceutical expenditure. Public financing
includes government programmes or spending covered by public health insurance, whereas the private
component is primarily the share of pharmaceutical spending covered by private health insurance as well
13DELSA/HEA/WD/HWP(2016)10
as households’ direct out of pocket spending.2 In the case of reimbursed (or rather part-reimbursed)
medicines under public coverage, the part under cost-sharing arrangements – whether fixed co-payments,
deductions or co-insurance – should be allocated and accounted under the private component.
12. Less than 60% of pharmaceutical spending is covered by public sources on average in OECD
countries. This compares with an average of around 75% for all health spending. This lower share reflects
the greater degree to which various cost-sharing arrangements apply to pharmaceutical spending in
comparison to the inpatient and outpatient health care sector. In addition, self-diagnosis and auto-
medication, which helps define OTC goods, is more extensive in the pharmaceutical sector.
13. Germany and the Netherlands report a public share of pharmaceutical spending at 75% or more
of the total pharmaceutical spending whereas the United States and Canada (both countries where private
health insurance plays a large role in financing pharmaceutical spending), as well as Poland and Hungary
where less than 40% of the pharmaceutical bill is covered by public funds.
Hospital spending on pharmaceuticals should be added to get a full picture
14. The discussion above focuses on retail drug expenditures. However, pharmaceuticals can also be
distributed to inpatients in hospitals and other institutions. The additional pharmaceutical expenditure in
the hospital sector (see Figure 3) ranges from less than 10% on top of retail spending in Canada and Korea
to more than 40% in Portugal. On average, this raises the overall pharmaceutical bill by around 20%,
resulting in more than one health dollar in five going towards purchasing pharmaceuticals.
Figure 3. Total (retail and hospital) pharmaceutical spending, per capita USD PPP, 2013 or latest year available
USD PPP Retail pharmaceuticals Hospital pharmaceuticals
1000
800 +9%
+10%
+27% +10%
600
+44%
+9%
+33%
400
+19%
200
0
Canada Germany Spain Portugal Australia Czech Republic Korea Estonia (2011)
(2011) (2010)
Note: Secretariat calculations for Portugal exclude some other medical products and agents from reported hospital spending.
Source: OECD Health Statistics 2015
2
It also may include other drug programmes such as those funded by NGOs, charities and private
corporations. These typically cover only a small proportion of the total.
14DELSA/HEA/WD/HWP(2016)10
Pharmaceutical spending has been increasing at a slower pace since the mid-2000s
15. Prior to 2000, increased spending on retail pharmaceuticals acted a major contributor in driving
up overall health expenditure and, as a consequence, the health sector share of GDP. Particularly during the
1990s and early 2000s, average real annual growth in pharmaceutical spending outpaced overall health
spending growth - more than 5% on average each year between 1990 and 2004, compared with average
health spending growth of less than 4% per year (Figure 4). However, during the 2000s there was a notable
shift with a significant drop in average pharmaceutical growth during the second half of the decade which
intensified through the global economic crisis.
16. Focusing on the most recent period, retail pharmaceutical spending across the OECD has, on
average, grown more slowly than overall health spending. Over the period from 2005 to 2013, annual
average growth in pharmaceutical expenditure was 0.7% on average (in real terms) compared with 2.4%
for health care expenditure growth. Up until 2009, pharmaceutical spending growth was around 1½
percentage points lower than overall growth in health spending. From 2010, in the face of reduced
spending in many OECD countries, pharmaceutical expenditure turned negative with an average 2.5% drop
in 2012. By contrast, overall health spending saw a return to low positive growth after seeing near zero
growth in 2010.
Figure 4. Average annual growth in health and retail pharmaceutical expenditure, OECD average, 1990-2013
Health expenditure (including pharmaceutical spending) Pharmaceutical expenditure
8%
6%
4%
2%
0%
1990 1995 2000 2005 2010 2013
-2%
-4%
Note: Excludes Greece, Israel, Mexico, New Zealand, Turkey and United Kingdom.
Source: OECD Health Statistics 2015
17. The majority of countries saw retail pharmaceutical expenditure growing on average more slowly
than that of health expenditure since 2005 (on the upper side of the 45° line in Figure 5). Even countries
where spending on health grew strongly over the period, such as some central European countries and
Korea, pharmaceutical spending did not grow at the same pace as other health spending categories, such as
in the hospital or outpatient sectors3.
3
Annex 1 shows real per capita pharmaceutical expenditure growth, 2005-2013 in OECD countries.
15DELSA/HEA/WD/HWP(2016)10
Figure 5. Annual real growth in retail pharmaceutical and health spending, 2005-2013
8%
Korea
Poland Slovak Republic
Average annual real growth in health spending
4% Estonia Japan
Netherlands Czech Republic Germany Australia
Belgium OECD United States Canada Switzerland
Norway Finland Slovenia
Denmark Austria
Ireland
Spain France Sweden
Iceland
0%
-4% Italy 0% 4% 8%
Hungary
Portugal
Luxembourg
-4%
Annual average real growth in pharmaceutical spending
Source: OECD Health Statistics 2015
18. The economic crisis had a significant effect on pharmaceutical spending in many OECD
countries. A number of European countries, in particular, experienced a dramatic reversal in
pharmaceutical spending trends pre- and post-crisis (Figure 6). In Greece, pharmaceutical expenditure per
capita decreased by close to 10% per year since 2009. This compares with growth of over 11% each year
between the period 2005 and 2008. In Ireland, the exceptional annual growth in pharmaceutical spending
prior to the economic crisis was only partially offset by cuts in spending growth in the subsequent years.
19. Other countries reporting large reversals in pharmaceutical spending growth post-2009 include
Portugal, Denmark and Iceland.
16DELSA/HEA/WD/HWP(2016)10
Figure 6. Retail pharmaceutical spending growth before and after 2009 (real terms)
% 2005-2009 2009-2013
15
11.6
10.3
10.3
8.5
10
7.8
5.5
5.4
5.4
5.0
4.9
3.8
3.8
3.4
3.4
5
2.8
2.7
2.7
2.2
2.1
1.6
1.2
1.1
0.8
0.8
0.5
0.1
0.1
0
-0.3
-0.3
-0.5
-0.6
-0.7
-1.1
-1.1
-1.2
-1.4
-1.5
-1.9
-2.1
-2.1
-2.5
-2.9
-5
-3.2
-3.2
-3.6
-3.9
-4.2
-5.3
-5.7
-5.8
-6.4
-6.4
-6.6
-7.7
-10
-9.6
-9.9
-11.1
-10.4
-15
Note: Data refer to prescription +OTC spending except for Greece, Ireland, Italy, Netherlands, Portugal and Slovak Republic for which medical
non-durable are included. Data for Luxembourg refers to prescription medicines only.
Source: OECD Health Statistics 2015
Pharmaceutical spending in hospitals has increased over time
20. The share of the overall pharmaceutical bill accounted for by hospitals has seen a rising trend in
many countries (Figure 7). This is partly explained by the proliferation of specialty drugs, which are often
delivered in a hospital setting (including in an outpatient department) rather than dispensed via pharmacies
(Hirsch et al., 2014). In the Netherlands, for instance, costs related to immuno-suppressants, which
includes the TNF-α inhibitors used to treat rheumatoid-arthritis and bowel diseases, were transferred to the
hospital budget and away from the pharmacy budget from 2012 onwards. Since this group alone was
accounting for more than 6% of the total pharmaceutical budget, the shift had an important effect on
overall spending patterns.
21. Another explanation for the growing share of hospital drugs in total pharmaceutical spending is
that in some countries cost-containment measures in the post-crisis period tended to focus on the retail
pharmaceutical sector, whereas hospital pharmaceutical spending remained more stable or continued to rise
(Barros, 2012).
17DELSA/HEA/WD/HWP(2016)10
Figure 7. Pharmaceutical expenditure in hospitals as a share of total pharmaceutical expenditure
(retail+hospital), 2005 and 2013
Retail pharmaceuticals Hospital pharmaceuticals
12.0%
10.1%
6.0% 4.7%
3.0%
2.2% 2.2% 2.1%
1.5% 1.5%
0.0%
-0.2%
-0.8%
-1.8%
-6.0% -5.1%
Czech Korea Spain Germany Canada Portugal
Republic
Source: OECD Health Statistics 2015
Private spending has not been subject to the same falls as public spending in recent years
22. In a majority of OECD countries, growth in private spending on pharmaceuticals has remained
higher than public spending over the last decade (Figure 8). In particular, since 2008, private spending did
not experience the same drops as public spending on pharmaceuticals. As a result, in some countries (e.g.
Czech Republic, Hungary and Poland) overall growth in public spending on pharmaceuticals has been low
(less than around 2% per year) or negative as some of the cost-burden has shifted to households. The
opposite is observed when public spending remained high; public spending has driven overall
pharmaceutical spending and private spending growth has generally seen slower growth (e.g. Japan and
Korea).
23. These trends are partly explained by a range of policy measures adopted by countries to contain
pharmaceutical costs, such as increases in cost-sharing (see Table 2 in Annex 3). Another reason for the
growth in private spending is the increasing use of OTC drugs (usually not reimbursed) compared with
prescription drugs (usually reimbursed) in several countries. In Slovenia, Iceland, Poland and Denmark
there have been significant increases in the OTC share of pharmaceutical spending while the opposite has
been observed in Korea and Estonia.
18DELSA/HEA/WD/HWP(2016)10
Figure 8. Annual growth in public and total retail pharmaceutical spending, OECD countries, 2005-2013
Total expenditure on pharmaceuticals, annual average growth rate
2005-2009 2009-2013
0.15 0.15
Private spending GRC Private spending
0.10 0.10
growth higher growth higher
EST KOR
than public SVK than public CHE JPN
JPN
0.05 IRL 0.05
KOR
USA
HUN NLD NOR
0.00 ESP 0.00 USA
-0.15 -0.10 -0.05 0.00 0.05 0.10 0.15 -0.15 -0.10 -0.05 0.00 0.05 0.10 0.15
NOR EST
ISL
DNK
-0.05 -0.05
LUX
Private spending PRT
GRC Private spending
-0.10 growth lower -0.10 growth lower
than public than public
-0.15 -0.15
Public expenditure on pharmaceuticals, annual average growth rate
Source: OECD Health Statistics 2015
19DELSA/HEA/WD/HWP(2016)10
CHANGES IN HEALTH NEEDS, MARKET DYNAMICS, AND COST-CONTAINMENT
POLICIES DRIVE SPENDING GROWTH
Pharmaceutical spending growth results from changes in prices, quantity and therapeutic mix
24. Pharmaceutical spending growth can be decomposed into three components: changes in prices
(by which we usually refer to changes in the price of existing drugs), changes in quantity and changes in
the therapeutic mix. The latter corresponds to changes in the types of drugs used for a given condition
(often within the same therapeutic class). These components, in turn, are influenced by a range of factors,
which can be classified into three categories: the demand for health care and medicines (e.g. due to
demographic and epidemiologic changes or to changes in medical practice); pharmaceutical markets’ own
dynamics (new drugs and patent expiries), and pharmaceutical policies (Table 1). The sections below
describe recent trends in prices, quantities and therapeutic mix and analyse the contributions of each driver
on observed trends. They show that market dynamics have a great impact on spending growth in a context
of ever-growing demand and consumption, and that policies have a role to play in containing or exploiting
these dynamics.
Table1. The drivers of health spending growth and their impact on each component of growth
Quantity Prices (of existing drugs) Therapeutic mix (and
treatment costs)
Demand for Population size and Changes in practice
pharmaceuticals demographic guidelines and/or
(Changes in health composition physicians’ practices
needs and clinical
practice) Emergence of new
diseases
Disease prevalence and
severity
Changes in practice
guidelines and/or
physicians’ practices
Pharmaceutical Introduction of new drugs Introduction of new drugs Introduction of new
market dynamics -if price competition drugs
Patent expiries, generic Patent expiries -if shift
competition of prescription to other
off-patent products
Pharmaceutical Coverage expansion Price cuts, changes in Promotion of appropriate
policies distribution mark-ups, in use
VAT
Reference price policies
Note: upward pressure on pharmaceutical spending; downward pressure on pharmaceutical spending
Source: compilation by authors
20DELSA/HEA/WD/HWP(2016)10
25. Disentangling the respective effects of all the factors on pharmaceutical spending growth is
challenging. Modelling can be used to estimate the effect of a number of parameters, such as time to entry
for a new medication, the impact of generic entry depending on entry price, volumes, generic penetration
(see for instance Toumi and Remuzat, 2012) or the effect of one-off reductions. These techniques are
indeed used for pharmaceutical spending projections. A review of these approaches is beyond the scope of
this report.
26. Only a few countries, such as Australia, Canada, Italy and Germany, regularly monitor the
components of growth in pharmaceutical spending. This monitoring process is very useful at the national
level to understand how money allocated to pharmaceuticals is being spent. However, they use different
methodologies to decompose growth and measure the impact of each component, which makes
international comparisons difficult. Therefore, the sections below describe in a more “qualitative way” the
trends observed in OECD countries for each component of growth.
The prices of medicines most often remain stable or decline after market entry
27. Changes in drug prices refer to changes in the prices of existing drugs. They are measured by
constructing price indices to track the price change of a given basket of drugs over a certain period of time.
Different methods are used for the calculation of those indexes; the most common ones being the
Laspeyres price index and the Paasche price index. Only a handful of countries regularly publish specific
pharmaceutical price indices using a chained-Laspeyres index to regularly update the basket. By definition,
these indexes do not take into account changes in the mix of drugs used (“quality” or “therapeutic effect”).
Though the basket of drugs is regularly updated to include new drugs, the measurement of variations in
drug prices from one year to the next only takes into account changes in the prices of drugs which are
included in the basket in both years.
28. In many countries, the prices of retail medicines are regulated and, once set, are not allowed to
increase except in exceptional circumstances. Therefore, retail pharmaceutical price curves are generally
flat and often show a decline in real terms (that is, growth of pharmaceutical prices inferior to that of
consumer price indexes). Figure 9 shows the evolution of the pharmaceutical price indexes for a subset of
countries. In Finland and France price indexes show a drop in prices year on year, while in the United
States, where medicine prices are generally not regulated, the pharmaceutical price index showed an
average annual growth rate of around 3% between 2003 and 2013 compared with overall inflation of
around 2%.
21DELSA/HEA/WD/HWP(2016)10
Figure 9. Pharmaceutical price indices, Finland, France and the United States, 2002-2012
(Preceding year=100)
110 FINLAND FRANCE USA
105
100
95
90
2002 2003 2004 2005 2006 2007 2008 2009 2010 2011 2012
Source: France - Comptes nationaux de la santé 2012, DREES (2013) - retail pharmaceuticals; Finland - Health Expenditure and
Financing 2012, THL (2014) - retail pharmaceuticals and other medical non-durables; United States - National Health Expenditure
Accounts 2013, CMS (2014) - prescription drugs.
The quantity of drugs used tends to increase
29. Changes in the quantity or volume of drugs consumed are easier to measure. Countries often
measure the changes in the number of prescriptions or quantities of drugs used. For international
comparison, the preferred unit to measure quantity is the defined daily dose (see Box in Annex 2).
30. The quantity of drugs used tends to increase over time in most therapeutic classes. Between 2000
and 2013, among countries for which data are available, the use of antihypertensive, antidiabetic and anti-
depressant medications nearly doubled, while the use of cholesterol-lowering drugs tripled (Figure 10). A
range of factors explain the increase in medicine use: population ageing, the rise in the prevalence of
chronic diseases such as cancer, diabetes and mental health illness, the availability of new drug treatments
for previously unmet needs or changes in the physicians' prescribing practices. Their respective influence is
analysed in the following sections.
22DELSA/HEA/WD/HWP(2016)10
Figure 10. Trends in pharmaceutical consumption
Hypertension drugs consumption, 2000 and Anticholesterols consumption, 2000 and 2013
2013 (or nearest year) (or nearest year)
2000 2013 2000 2013
Turkey 124 Chile 10
Korea 141 Turkey 26
Austria 184 Estonia 44
Greece 194 Korea 45
Israel 217 Austria 69
Luxembourg 223 Germany 73
Australia 239 Italy 83
Portugal 250
Sweden 86
France Iceland 91
266
Spain France 92
269
Iceland OECD27 95
274
Norway Spain 96
279 Canada
Netherlands 99
303 Portugal
Canada 102
311 Finland
OECD26 102
318 Greece 103
Estonia 323 Czech Republic 103
Belgium 328 Hungary 105
Sweden 368 Israel 109
United Kingdom 380 Slovenia 110
Denmark 398 Netherlands 112
Italy 399 Luxembourg 117
Slovak Republic 410 Norway 120
Slovenia 414 Denmark 126
Finland 427 Belgium 130
Czech Republic 442 Australia 134
Hungary 543 United Kingdom 135
Germany 575
Slovak Republic 153
0 100 200 300 400 500 600 0 30 60 90 120 150 180
Defined daily dose, per 1 000 people per day Defined daily dose, per 1 000 people per day
Antidiabetics consumption, 2000 and 2013 (or Antidepressants consumption, 2000 and 2013 (or
nearest year) nearest year)
2000 2013 2000 2013
Chile 9 Chile 13
Austria 40 Korea 20
Iceland 43 Estonia 21
Norway 49 Hungary 28
Denmark 52
Turkey 35
Estonia Slovak Republic 35
55
Israel Israel 42
55
Sweden Italy 43
56
Turkey Netherlands 43
56 Greece
Canada 44
58 Czech Republic
OECD27 49
62 France
Australia 50
62 Germany
Portugal 53
63 Slovenia 53
Luxembourg 64 Luxembourg 54
Belgium 65 Norway 56
Korea 65 OECD28 58
Slovak Republic 66 Austria 59
France 66 Spain 65
Greece 66 Finland 69
Spain 67 Belgium 72
Italy 67 New Zealand 73
Slovenia 73 Denmark 80
Netherlands 75 United Kingdom 82
Hungary 78 Sweden 84
Czech Republic 80 Canada 85
United Kingdom 82 Portugal 88
Germany 83
Australia 96
Finland 86
Iceland 118
0 20 40 60 80 100 0 20 40 60 80 100
Defined daily dose, per 1 000 people per day Defined daily dose, per 1 000 people per day
Note: Excludes hospital consumption in Australia, Belgium, Canada, Chile, Germany, Hungary, Israel, Luxembourg, Netherlands,
Portugal, Slovenia, Spain and United Kingdom.
Source: OECD Health Statistics 2013
23DELSA/HEA/WD/HWP(2016)10
Changes in the therapeutic mix is a key component of spending growth but varies across therapeutic
areas
31. Changes in the therapeutic mix explain the part of spending growth which does not result from
changes in quantity or prices. This component is affected by two opposing factors. On one hand, the
introduction of new and generally more expensive drugs - including new formulations of existing
medicines (e.g. new strengths, forms and presentations of existing drugs), pushes spending up. These
medicines are deemed to improve the quality of care and are actively promoted by pharmaceutical
companies to physicians – and consumers where possible. On the other hand, the introduction of generics
can lead to a switch of prescription from other molecules to one which is off-patent, offering savings. The
“therapeutic mix” component measures the net effect of these two opposite effects.
32. In the case of antidiabetic medicines for instance, where use has been steadily increasing due to
increasing prevalence of type-2 diabetes, the existence of long-standing treatments with generic versions
resulted in a ‘cost of treatment’ which remained relatively stable over a number of years. However, the
arrival of new and more expensive treatments in recent years significantly increased the average daily
treatment cost. The shift from existing medications to new drugs has therefore been the main contributor to
pharmaceutical spending growth in this therapeutic class in the recent period (as shown in Figure 11 for
Denmark). The extent to which the use of these new medicines improves outcomes or avoids the use of
more costly health care services is beyond the scope of this report.
Figure 11. Annual growth in sales and consumption of antidiabetic drugs, Denmark, 2005-2013
Volume (DDD per 1000/day) Cost per DDD Sales (per capita)
16.0%
12.0%
8.0%
4.0%
0.0%
-4.0%
2005 2006 2007 2008 2009 2010 2011 2012 2013
Source: OECD Health Statistics 2015
33. By contrast, in the class of lipid-lowering medications, the expiry of the patent for some of the
top selling statins in the mid-2000s and the introduction of generics has led to a pattern of decreasing
treatment costs in many countries over recent years. For example, costs per defined daily dose (DDD)
typically fell by more than 10% each year, on average, since 2005 in countries, such as Germany (Figure
12 and Annex 2).
24You can also read