Tackling Childhood Obesity in Southampton
←
→
Page content transcription
If your browser does not render page correctly, please read the page content below

Tackling Childhood Obesity in Southampton
      Southampton Children in Year 6 2016/17 to 2018/19

                   PANEL MEMBERSHIP – 2019/20
                    Councillor McEwing (Chair)
                  Councillor Houghton (Vice-Chair)
                        Councillor Coombs
                       Councillor Harwood
                   Councillor Professor Margetts
                        Councillor Thomas
                       Councillor Vaughan
                  Scrutiny Manager – Mark Pirnie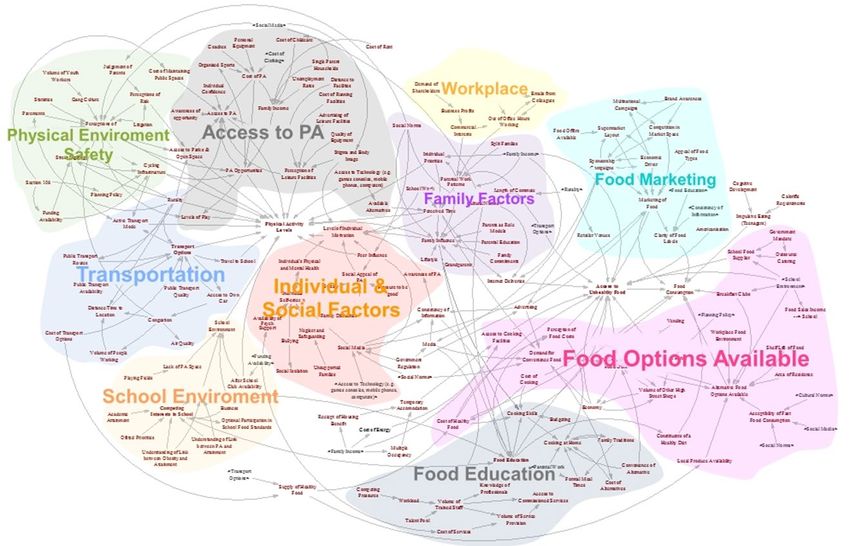
Contents

Contents                                                       Page

Chair’s Introduction                                              3

The Aim of the Inquiry                                            4

Introduction, Background                                          6

Tackling the causes of childhood obesity – Where are we now?     16

Place – Understanding the food environment in Southampton        16

Place – Understanding the active environment in Southampton      23

Settings – Promoting a healthy culture                           31

Targeted prevention and treatment                                36

Strategic approaches to tackling childhood obesity               39

Conclusions and Recommendations                                  43

Appendices

Appendix 1 – Terms of Reference

Appendix 2 – Inquiry Plan

Appendix 3 – Summary of Key Evidence

                                          2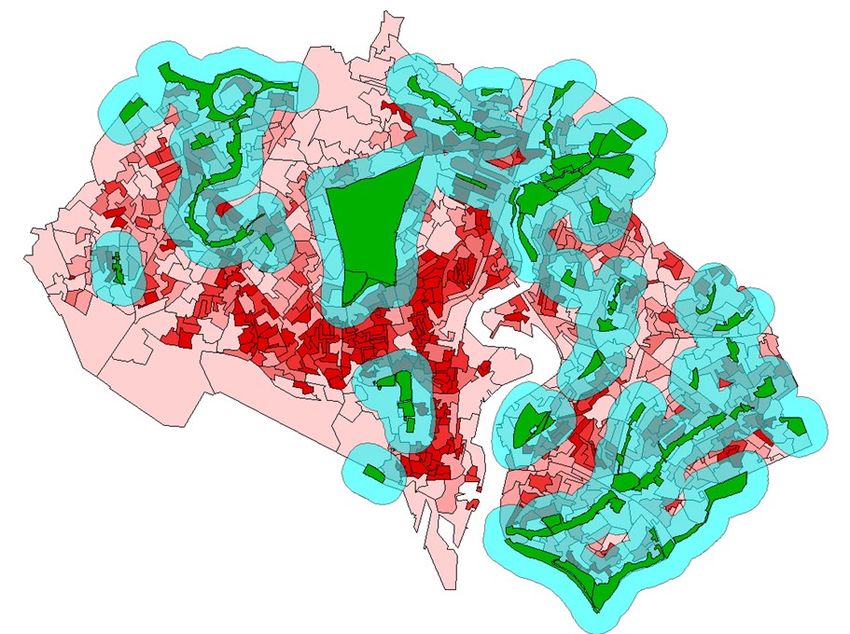
Chair’s Introduction

                   Councillor McEwing - Chair of the Tackling Childhood Obesity in
                   Southampton Inquiry Panel (2019/20)
                   “one of the most serious public health challenges of the 21st century”
                   – World Health Organisation, Childhood overweight and obesity

                   At the inaugural meeting of the Inquiry Panel we were informed of the
                   scale of the problem in Southampton, with between 13,000 and
                   13,700 children aged between 2 and 17 years old estimated to be
                   either overweight or obese in the city.

The negative consequences of childhood obesity on health can affect the quality of our
children’s lives, their education and their life chances. In later life, these obesity related
health conditions can reduce their productivity, earnings and shorten their lives.

The impact of obesity on health has been tragically emphasized in recent months as
evidence emerges of the link between obesity and risk factors that can worsen the
effect of Covid-19. The pandemic has galvanised support nationally for the need to
tackle obesity, however, the lockdown, instigated to help prevent the spread of the
virus, may have made the challenge harder as there is an expectation that obesity
levels, including levels of childhood obesity, will have increased, particularly amongst
our most deprived communities where obesity rates are highest.

The last evidence session for the inquiry was on 25th February 2020, preceding the
Coronavirus pandemic. The report has not been retrospectively changed to reflect
events following the February meeting of the Panel. I am confident however, that the
report, and its conclusions and recommendations, remain relevant, reflect best practice
and represent a significant opportunity to help address the causes of childhood obesity
in Southampton.

In recognition of the complexity of the challenge, individual recommendations taken in
isolation are unlikely to have an impact, but collectively, over the long-term, these
actions will help to tackle childhood obesity, particularly by changing the environment to
enable children to eat healthily and be regularly active.

I recognise that the pandemic has placed significant pressure on Council finances, and
on the resources of our Public Health team, however, tackling childhood obesity
deserves to be at the forefront of the priorities for the City of Southampton. Now is the
time to act to reverse the rise in childhood obesity. As a society, we owe it to all
our children.

I would like to thank all those who provided evidence to the inquiry and ensured that the
Panel were well informed. I would also like to thank members of the Panel for their
patience in waiting for the final report to be produced following the hiatus caused by the
pandemic; the way in which the inquiry was conducted; and their willingness to listen to
detailed and complex evidence to help further the work of the Panel.

                                               3
Tackling Childhood Obesity in Southampton

     The Aim of the Inquiry

1.   The 2018 Government report, ‘Childhood obesity: a plan for action, chapter 2’,
     identified that childhood obesity is one of the biggest health problems this
     country faces. Nearly a quarter of children in England are obese or overweight
     by the time they start primary school aged five and this rises to over one third by
     the time they leave aged 11.
2.   As outlined in more detail within this report, overweight or obese children are
     more likely experience a range of health problems and are far more likely to go
     on to become obese adults. Childhood obesity also places significant financial
     costs on the nation. Reflecting the above issues the Government has set a
     challenging target of reducing childhood obesity by 50% by 2030.
3.   In Southampton rates of childhood obesity exceed the national average and
     the burden of childhood obesity is being felt the hardest in the most deprived
     areas of the city.
4.   Given the importance of the issue and the long term impact that childhood
     obesity could have on Southampton, the Overview and Scrutiny Management
     Committee recommended tackling childhood obesity in Southampton as an
     appropriate subject for a scrutiny inquiry at the August 2019 meeting.
5.   The set objectives of the inquiry were:
        a. To develop understanding of childhood obesity levels in Southampton
           and the factors that influence childhood obesity.
        b. To review local plans and progress being made in Southampton to
           reduce levels of childhood obesity.
        c. To consider national guidance and examples of good practice that are
           being delivered elsewhere to reduce childhood obesity.
        d. To identify what approaches and initiatives could be introduced in
           Southampton to reduce levels of childhood obesity.

6.   The full terms of reference for the inquiry, agreed by the Overview and Scrutiny
     Management Committee, are shown in Appendix 1.

     How the inquiry was conducted
7.   The Scrutiny Inquiry Panel undertook the inquiry over 5 evidence gathering
     meetings and received information from a wide variety of organisations. This
     included the Leader of the Council, Public Health England, academics from the
     Universities of Southampton, Cambridge and City – University of London,
     Energise Me, Solent NHS Trust, City Catering, Bristol City Council, Leeds City
     Council, Testlands as well as Southampton City Council officers. A list of
     witnesses that provided evidence to the inquiry is detailed in Appendix 2.
8.   The key findings, conclusions and recommendations from the inquiry are
     detailed succinctly later in this report.

                                               4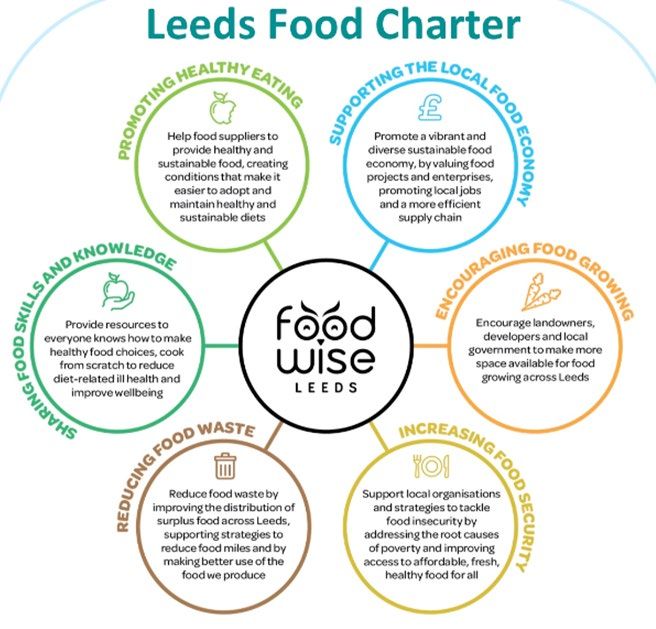
9.   Members of the Panel would like to thank all those who have assisted with the
     development of this review, in particular the following who have provided the
     Panel with invaluable advice throughout the inquiry:
        •   Debbie Chase, Interim Director of Public Health, Southampton City
            Council;
        •   Ravita Taheem, Senior Public Health Practitioner, Southampton City
            Council.

                                           5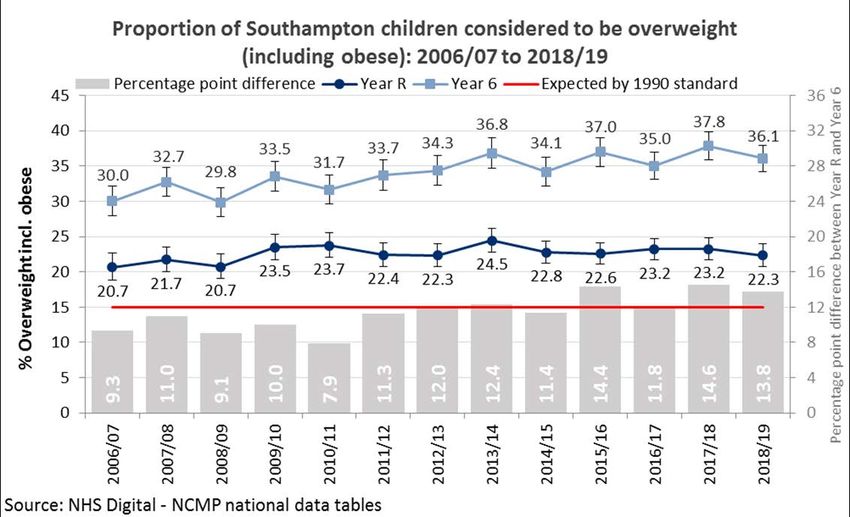
Introduction and Background

10. The World Health Organisation defines childhood obesity as “abnormal or
    excessive fat accumulation that presents a risk to health” 1.
         Levels of childhood obesity - National
11. The primary source of information comes from the National Child Measurement
    Programme (NCMP) introduced in 2005/6. Children are measured when they start
    primary school (Year R – aged 4/5) and when they leave primary school (Year 6 –
    aged 10/11).
12. Height and weight is measured by Public Health School Nurses. Body Mass Index
    (BMI) is recorded and is standardised for their age and sex and then converted to
    centiles. The measurements are then classified as follows:
             •    Underweight: 2nd centile or below
             •    Healthy weight: 2nd to 85th centile
             •    Overweight: 85th centile and above
             •    Obese: 95th centile and above
13. NCMP data for 2018/19 identified that nationally more than 1 in 5 children in Year
    R is overweight or obese (boys 23.0%, girls 22.2%, all children 22.6%). Around 1
    in 10 children in Year R is obese (boys 10.0%, girls 9.4%, all children 9.7%).
14. The national figures for Year 6 children in 2018/19 is considerably higher than for
    Year R. More than 1 in 3 children in Year 6 is overweight or obese (boys 36.7%,
    girls 31.8%, all children 34.3%) with around 1 in 5 children in Year 6 being
    classified as obese (boys 22.5%, girls 17.8%, all children 20.2%).
15. Therefore, at the start of primary school, in a typical class of 30 pupils, three pupils
    have obesity. At the end of primary school, this has doubled to six children.
16. Analysis of trends using NCMP data from 2006/07 to 2018/19 shows a downward
    trend in excess weight (overweight including obesity) prevalence among boys in
    Year R, while the trend among girls of this age is showing a very small, but
    statistically significant, increase. Excess weight prevalence among boys and girls
    in Year 6 shows an upward trend.
17. Child obesity prevalence is closely associated with socioeconomic status. More
    deprived populations tend to have higher obesity prevalence. Obesity prevalence
    in the most deprived areas in England is more than twice the prevalence in the
    least deprived. 2
         Levels of childhood obesity - Southampton
18. 2018/19 NCMP data identified that 22.3% of Year R children in Southampton were
    overweight or obese. Lower but not significantly than England (22.6%). The
    prevalence of obesity was 10.1%. Higher but not significantly than England (9.7%).
19. For Year 6 in 2018/19, 36.1% of the Southampton cohort were overweight or
    obese. Higher, but not significantly than England (34.3%). The prevalence of
    obesity was 22.9%. This is significantly higher than the national average (20.2%).

1
    World Health Organization. Childhood overweight and obesity. http://www.who.int/dietphysicalactivity/childhood/en/
2
    Public Health England, Patterns and trends in childhood obesity, Feb 2020
                                                           6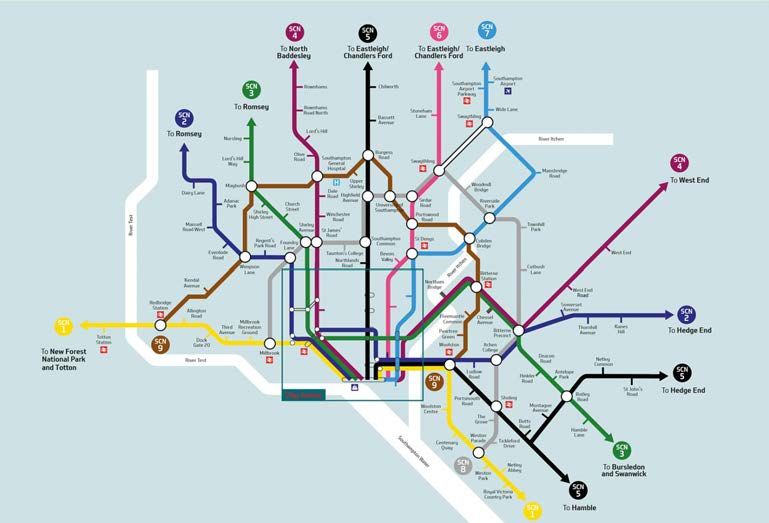
20. Using the NCMP data collected in our schools, the adult national Active People
    Survey and all age Health Survey for England; we can estimate in Southampton
    there are:
        •   Between 13,000 and 13,700 overweight/obese children aged 2 - 17 years old
        •   With over half – between 6,700 and 7,900 estimated to be obese.

21. As demonstrated by the chart below, trends for children considered to be
    overweight or obese in Southampton have remained relatively stable for Year R
    over time. There has however been a statistically significant increase in levels of
    overweight or obese children in Year 6 since 2006/7.
     Figure 1:

22. To have the same percentage as 2006/07, 153 overweight/obese Year 6 pupils in
    this year group would need to be a healthy weight.
     Gender differences

23. Analysis of pooled NCMP data on Southampton children from 2016/17 to 2018/19
    identifies that there is a significant difference between prevalence of overweight,
    including obesity, by gender for Year 6. Trends over time show Year R prevalence
    becoming statistical similar, however the Year 6 gap has increased with males
    significantly higher than females (5%).
     Ward differences

24. Analysis of the above pooled data also identified significant variations in levels of
    children overweight, including obese, between wards in the city. Figures 2 and 3
    show the differences across the city for both Year R and Year 6 and the variations
    that exist between the 2 sets of statistics.

                                            7
Figure 2:

Figure 3:

            8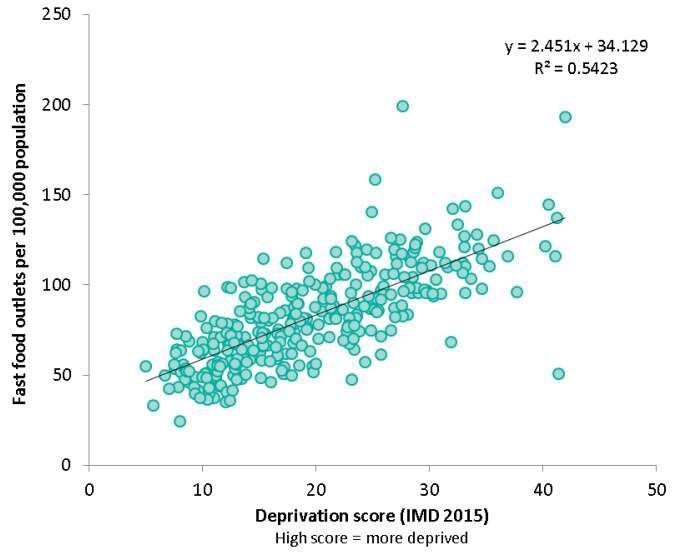
25. Reflecting the variations between the different ages, additional analysis by the
    Council’s Intelligence and Strategic Analysis Team of the same children measured
    in Year R and Year 6 identified that the majority of overweight children in year 6
    had been healthy weight in reception, whilst over a fifth had remained overweight
    and a further 8% had been obese. Over two-thirds (67%) of obese children had
    not been obese in reception, in fact the biggest proportion was for those who had
    been healthy weight (41%).
     Deprivation differences
26. Mirroring the national picture, in Southampton obesity prevalence increases as
    deprivation increases. As the charts below show, obesity prevalence is 1.8 times
    higher in the most deprived quintile in Southampton compared to the least
    deprived in Year 6, and the gap is increasing.
     Figure 4

                                       Percentage of children considered to be Obese in Year 6 by Local Deprivation
                                                   Quintile (IMD 2015): 2016/17 to 2018/19 (pooled)
                               30
      Obesity prevalence (%)

                               25
                                                                                                          R² = 0.9554
                               20

                               15

                               10

                                5
                                     26.81            24.74              21.90           20.32            14.93
                                0
                                    20% most       2nd quintile      3rd quintile      4th quintile      20% least
                                     deprived                                                             deprived
       Source: National Child Measurement Programme Pupil Enhanced Data Set, NHS Digital - Lifestyle Statistics

     Figure 5

                                                                     9
Summary of evidence
             •    In Southampton levels of obesity in Year R students over time have
                  changed little and track the national average, whereas rates in Year 6
                  children have increased overtime and have become relatively (statistically
                  significantly) worse than the national average. For year 6 children
                  Southampton is doing relatively badly compared to other areas in the UK.
             •    The ranking of the rate of overweight by wards is not consistent between
                  Year R compared with Year 6. For example, Freemantle ward has the
                  lowest rate in Year R but the second highest in Year 6.
             •    The rate of obesity is highest in the most deprived children and getting
                  worse relative to the least deprived in the city.
             •    These trends suggest that actions taken to date have not been effective in
                  reducing childhood overweight, and therefore more of the same will not
                  make a difference, without proper evaluation as to why programmes do or
                  do not work. We must learn the lessons from past efforts.
         The impact and consequences of childhood obesity
27. The World Health Organization identifies childhood obesity as “one of the most
    serious public health challenges of the 21st century." 3
28. As identified in ‘Time to Solve Childhood Obesity’, the Chief Medical Officers
    independent report in October 2019, children with overweight or obesity are more
    likely to experience a range of health problems in childhood.
29. In his presentation to the Panel Professor Mark Hanson showed the following
    image to highlight the impact of childhood obesity on children’s physical health
    during childhood and adolescence.

      Figure 6 - Source: Han JC, Lawlor DA, Kimm SY. Childhood obesity. The Lancet. 2010 ;375(9727):1737-48.

3
    World Health Organization.Childhood overweight and obesity. http://www.who.int/dietphysicalactivity/childhood/en/
                                                          10
30. Increasingly, links between overweight or obesity and mental health are being
recognised. Stigma and discrimination toward obese children is pervasive and
pose numerous consequences for their psychological and physical health.
Children with overweight or obesity experience lower self-esteem, may withdraw
socially and may be bullied as a result of their weight. 4
31. Children with obesity are five times more likely to have obesity as an adult. 5 Adult
obesity is associated with a wide range of problems including depression,
dementia, respiratory disease, musculoskeletal conditions, type 2 diabetes,
cancer, liver disease, cardio-vascular disease and infertility. 6
32. Obesity puts significant demands and costs on the NHS, other parts of society and
the economy. Overweight and obesity contribute to sickness absence, having a
negative impact on productivity and businesses.
33. McKinsey estimated that obesity costs the UK 3% of GDP, this was around £60
billion in 2018, with large costs (around £5 billion) being borne by business in
terms of sickness absence and reduced productivity. 7
The causes of childhood obesity
34. The factors that affect a child’s growth and development operate at a number of
levels, some factors are modifiable and some are not modifiable by environmental
influences, such as genes, gender and age. The most helpful way to describe this
is using the Socio-ecological model summarised by Dahlgreen and Whitehead
(1991). This model shows the interaction of factors that operate at the individual,
community and wider environmental context that interact and affect a child’s
growth. To understand what is causing childhood overweight, and therefore what
can be changed to reduce or prevent it, requires that all these levels of factors are
taken into account, particularly those factors that can be changed, and in the
context of Southampton City Council, what we have the possibility to change.
Figure 7 – The Dahlgren-Whitehead Rainbow
4
Time to Solve Childhood Obesity: An Independent Report by the Chief Medical Officer, 2019, Annex B p5
5
Simmonds M, Llewellyn A, Owen CG, Woolacott N. Predicting adult obesity from childhood obesity: a
systematic review and meta-analysis. Obes Rev. 2016;17(2):95-107. doi:10.1111/obr.12334
6
Time to Solve Childhood Obesity:An Independent Report by the Chief Medical Officer, 2019, Annex B, p7
7
McKinsey Global Institute. Overcoming obesity: An initial economic analysis. McKinsey & Co, 2014
1135. Body weight itself is a direct consequence of energy balance: calories in versus
calories used. However, this over simplifies the complex interplay between genes,
human psychology and behaviour, circumstances and the environments in which
people live that all have the ability to affect body weight.
36. Professor Hanson identified the role played by diet, physical activity, sleep/stress
and environmental toxicants in amplifying the risk of obesity in childhood and how
the priming of risk is from conception onwards.
Paternal and prenatal risk factors
37. A number of early life risk factors for overweight / obesity are prenatal and
postnatal. These include maternal pre-pregnancy obesity, maternal smoking in
pregnancy, low maternal vitamin D status in pregnancy, maternal excessive
gestational weight gain and not being breastfed or only for a short duration. 8
38. The importance of the prenatal and postnatal period to childhood obesity is
amplified by the findings from the Southampton Women’s Survey that identified
that maternal BMI is passed on to children and that inequalities in a mothers diet is
perpetuated in the child and that diet quality tracks through childhood. Babies with
poor diets tended to have poor diets at age 9.
Genes
39. The Chief Medical Officer’s Annual Report in 2016 9 included research evidence
which shows that many people carry some genes that will increase the likelihood
of gaining excess weight, although the effect of each of these changes on their
own is always very small. Professor Hanson, in his presentation to the Panel,
estimated that inherited genes accounts for under 10% of risk at population level.
Diet and physical activity
40. Time to Solve Childhood Obesity - The 2019 report by the Chief Medical Officer
states that:
“The scientific consensus is that the rise in obesity is mostly driven by changes in
food consumption rather than declines in physical activity…..Declines in physical
activity have been occurring for much of the last 100 years, whereas the rise in
obesity is much more recent……Moreover, in the UK, research shows that the
increases in the food supply, or food energy, are sufficient to account for nearly all
the increase observed in bodyweight amongst women and over half the increase
in body weight amongst men during the 1980s and 1990s.
Any approach to tackling obesity should include a strand focused on physical
activity, but increasing physical activity alone will be insufficient to prevent
childhood obesity. As a rule of thumb, in terms of preventing obesity, a greater
effort (e.g. 80%) should be placed on diet with less (e.g. 20%) on physical
activity.” 10
Why are more children obese today? – The role of the environment
41. As identified many factors combine together to affect the health of individuals and
communities. This is particularly the case for overweight and obesity. In the Chief
8
Gillman et al. Obesity. 2008;16:1651-6; Robinson et al. Am J Clin Nutr. 2015;101:368-75
9
CMO Report 2016, Chapter 7 Genomics and Obesity
10
Time to Solve Childhood Obesity: An Independent Report by the Chief Medical Officer, 2019, Annex D p3
12Medical Officers 2019 Independent Report the role of the environment has been
identified as fundamental to the increase in levels of obesity we see today:
“The dominant scientific opinion is that changes in the environment, and principally
changes in the availability and affordability of highly palatable calorie-dense foods,
have driven the rise in obesity throughout the western world for both adults and
children. The marked increases in obesity that occur when people migrate from a
country with a low prevalence of obesity to a country with a high prevalence of
obesity, underlines the importance of the environment in driving changes in
obesity prevalence. ……the environment shapes eating and physical activity
behaviours in many ways. Whilst each influence on its own may seem small,
cumulatively and over time they are very significant. Efforts to prevent childhood
obesity need to be on changing the environment to enable children to eat healthily
and be regularly active.” 11
42. This is succinctly echoed in a recent Public Health England (PHE) publication
designed to support local approaches to promoting a healthy weight:
“The causes of obesity exist in the places where we live, work and play, where the
food and built environment often makes it difficult to make healthier lifestyle
choices.” 12
National Policy – Childhood Obesity
43. Addressing the high prevalence of obesity in England is a government priority.
Since 2016 we have seen the publication of Childhood obesity: a plan for action,
chapter 1 and 2; the NHS Long Term Plan and the Prevention Green Paper -
Advancing our health: prevention in the 2020s – all of which have set out clear
commitments around obesity. Including commitments relating to:
• Preventing excess weight gain across the life course
• Identifying risk(s) earlier and supporting behaviour change to minimise
weight gain and support appropriate weight loss.
• Helping people maintain a healthier weight for longer
• Improving nutrient content of food and drinks
• Creating and planning a health promoting environment.
44. Childhood obesity: a plan for action, chapter 2 includes the national ambition to
halve childhood obesity and significantly reduce the gap in obesity between
children from the most and least deprived areas by 2030.
45. In 2019 PHE also published a 5 year strategy. Healthier Diet and Healthier Weight
is one of PHE’s 10 priority areas. The strategy places an emphasis on universal,
up-stream approaches and support on personalised and population targeted
approaches. The aim is to seek to support those people with the most to benefit;
and address inequalities and inequity associated with obesity and its causes.
11
Time to Solve Childhood Obesity: An Independent Report by the Chief Medical Officer, 2019, Annex D p2
12
Public Health England, Whole systems approach to obesity: a guide to support local approaches to
promoting a healthy weight, July 2019, p6
13Local Policy - Southampton
46. In recognition that, to complement national policy, local authorities have the
opportunity and powers to work with local communities to help tackle and prevent
the causes of obesity, Southampton City Council published a 5 year Children and
Young People’s Healthy Weight Plan in 2017.
47. The plan identified actions required at a national and local level to tackle childhood
obesity and sought to shift focus from blaming individuals to looking at the
environment. The following themes and priorities were identified:
Figure 8: Southampton’s Children and Young People’s Healthy Weight Plan - Themes
48. The plan contained a number of targets by which progress could be measured:
Table 1: Action Plan Measures
1449. There have been some promising improvements in action plan measures and
progress is being made in a number of areas. However, it is recognised that the
Healthy Weight Plan needs to be more challenging to address the magnitude of
the issues and the range of factors influencing obesity levels in Southampton.
15Tackling the causes of childhood obesity in Southampton – Where are we
now?
50. Using as a guide the themes within the evidence led Southampton Children and
Young People’s Healthy Weight Plan (Figure 7), the Inquiry Panel considered at
each meeting different elements that influence healthy weight outcomes for
children and young people in the city.
51. To develop understanding the Panel were provided with evidence to support the
link to childhood obesity levels; Southampton’s approach and examples of good
practice.
Place – The food environment
“A healthy food environment is one that looks like the food we should be eating,
with the onus on available, affordable, appealing and acceptable healthy food and
drink.” – Professor Corinna Hawkes, speaking to the Inquiry Panel on 26/11/2019
Takeaways
52. The food environment in most communities has fundamentally changed over a
period of time. A notable change has been the rise in the number of takeaways.
According to PHE figures a quarter of all eateries in England are now fast food
outlets 13 and there has been a 10% increase in takeaways over the past 5
years. 14
53. The proliferation in takeaways has been most notable in deprived communities
with a clear and strengthening correlation between the number of fast food outlets
in a location and the areas Index of Multiple Deprivation score.
Figure 9 – Relationship between density of fast food outlets and deprivation
13
https://publichealthmatters.blog.gov.uk/2019/08/08/health-matters-addressing-the-food-environment-
as-part-of-a-local-whole-systems-approach-to-obesity/
14
Food environment assessment tool (www.feat-tool.org.uk)
16Source: National Obesity Observatory 2015
54. PHE data identifies that the most affluent 10% of England is home to just 3% of
fast-food outlets and the poorest decile has 17%.
55. According to the National Diet and Nutrition survey just over 1 in 5 (20%) children
eat a takeaway meal at home at least once a week. 15 This may be an under-
estimate of total takeaway food consumption by children, as it does not include
takeaway food consumed outside the home.
56. Alongside the proliferation of takeaways, portion sizes have been increasing in the
out-of-home sector. For example, in Liverpool three quarters of takeaway meals
(excluding side orders and drinks) studied exceeded 1125 calories, with a quarter
exceeding the recommended daily intake for a boy aged 9-13 years (1800
calories). 16
57. Evidence presented to the House of Commons Health and Social Care Select
Committee’s Childhood Obesity Inquiry in April 2018 by CEDAR (The Centre for
Diet and Activity Research), and subsequently presented to the Inquiry Panel by
Dr Tom Burgoine, outlined the link between regular consumption of takeaway food
and obesity in children and young adults 17; and that access to takeaways has
been linked to obesity in adults and children from low income families. 18
15
Goffe, L., Rushton, S., White, M., Adamson, A. & Adams, J. Relationship between mean daily energy
intake and frequency of consumption of out-of-home meals in the UK National Diet and Nutrition Survey.
Int. J. Behav. Nutr. Phys. Act. 14, (2017).
16
Jaworowska, A. et al. Nutritional composition of takeaway food in the UK. Nutr. Food Sci. 44, 414–430
(2014).
17
https://www.cedar.iph.cam.ac.uk/wp-
content/uploads/2018/11/Health_Committee_Childhood_Obesity_April18_Takeaways_child_obesity.pdf
18
Burgoine, T., Forouhi, N. G., Griffin, S. J., Wareham, N. J. & Monsivais, P. Associations between
exposure to takeaway food outlets, takeaway food consumption, and body weight in Cambridgeshire, UK:
population based, cross sectional study. BMJ 348, g1464 (2014).
1758. The CEDAR submission identified that findings for children with respect to takeaways
near school have been mixed, 19 before referencing recent UK research that has
linked consumption of a healthy diet to attending a school where takeaway outlets are
relatively far away rather than close by, 20 or where the balance of food retailing near
the school is mixed, and not skewed towards fast food. 21
Food retailing - Supermarkets and non-takeaway food
59. Analysis of modern food store environments has shown that healthier diets cost
more than nutrient poor, energy dense diets. 22 To meet government
recommendations within the Eatwell Guide, those on the lowest incomes would
have to spend 50-60% of their disposable income on food alone. 23
60. Not only is unhealthy food cheaper but, as with takeaways, portion sizes of
unhealthy foods have increased significantly since the 1990s. Research by the
British Heart Foundation showed that the average portion size of crisps had risen
by 50% between 1990 and 2019. The figures for a number of other foods were
recorded - cottage pie (113% increase), bagels (29% increase) and pizza (53%
increase). 24
61. Research has also been undertaken on how healthy store environments are.
Healthier in-store environments could be characterised as those which promote
healthy food choices such as selling good quality healthy foods or placing them in
prominent locations to prompt purchasing. Findings revealed that discount and
small supermarkets, the type which are prevalent in deprived communities, have
the poorest in-store environments. 25
62. Mothers with low educational attainment show greater susceptibility to less healthy
in-store and spatial environments than mothers with higher educational
attainment. 26 This is particularly concerning given that, as referenced by Professor
Janis Baird and Dr Christina Vogel in their presentations to the Panel, women tend
to be the gatekeepers for food choices within the family and inequalities in a
mothers diet is perpetuated in the child.
63. Given all of the above it is inevitable that neighbourhoods, and the local food
environment, have the potential to shape people’s diets and body weight.
19
Turbutt, C., Richardson, J. & Pettinger, C. The impact of hot food takeaways near schools in the UK on
childhood obesity: a systematic review of the evidence. J. Public Health (Bangkok). (2018).
doi:10.1093/pubmed/fdy048
20
Smith, D., Cummins, S., Clark, C. & Stansfeld, S. Does the local food environment around schools
affect diet? Longitudinal associations in adolescents attending secondary schools in East London. BMC
Public Health 13, 70 (2013).
21
Barrett, M. et al. Greater access to healthy food outlets in the home and school environment is
associated with better dietary quality in young children. Public Health Nutr. 20, 3316–3325 (2017).
22
Rao M, Afshin A, Singh G, et al. BMJ Open 2013;3:e004277. doi:10.1136/bmjopen-2013-004277
23
Scarborough P, Kaur A, Cobiac L, Owens P, Parlesak A, Sweeney K, et al. Eatwell Guide: modelling
the dietary and cost implications of incorporating new sugar and fibre guidelines. BMJ Open. 2016;6:
e013182. doi:10.1136/bmjopen-2016-013182
24
Portion Distortion: How much are we really eating? British Heart Foundation, 2013, repeated in 2019
25
Black, C., Ntani, G., Inskip, H. et al. Measuring the healthfulness of food retail stores: variations by
store type and neighbourhood deprivation. Int J Behav Nutr Phys Act 11, 69 (2014).
https://doi.org/10.1186/1479-5868-11-69
26
Vogel, C., Ntani, G., Inskip H., Barker,M,. Cummins,S., Cooper,C., Moon,G., Baird,J. Education and
the Relationship Between Supermarket Environment and Diet. AJPN 2016
DOI:https://doi.org/10.1016/j.amepre.2016.02.030
1864. The changes to the food environment have made it harder for children and
families to eat healthily and they also partly help to explain the inequalities in
childhood obesity. Families on low incomes have fewer opportunities to access
healthy affordable foods, and the areas that children from deprived communities
live tend to have a higher density of fast food outlets.
The Southampton food environment
65. At the second meeting of the Inquiry the Panel were provided with research that
afforded an insight into the food environment in the city. Key information is
summarised below:
• According to CEDARs Food Environment Assessment Tool (www.feat-
tool.org.uk) there has been a 14% increase in takeaways in Southampton
over the past 5 years compared to a 10% increase nationally.
• A study of food outlets in Hampshire identified that most children aged 6
years have more than 10 fast food outlets around their home and school,
with some having in excess of 50. 27
• In a survey of dietary quality covering Southampton, Gosport, Havant,
Eastleigh, Fareham and Portsmouth only 1% of women with young children
were identified as having greater access to healthy, rather than unhealthy,
food outlets in their daily activities. Thereby indicating an overwhelming
presence of outlets selling predominantly unhealthy food. 28
• Southampton’s most deprived neighbourhoods have stores with:
o Poorer quality fruit and vegetables
o Fewer varieties of healthy foods. 29
Good practice – Improving the food environment
66. In the summary of her presentation to the Panel on the role of public policy in
healthy food environments, Professor Corinna Hawkes included 3 bullet points:
• A small number of national policies are needed for norms to change for
people and businesses
• Policies that work for people start with understanding the context – The
reality of people’s lives
• Local government can both complement and lead national policy by
building on assets with actions tailored to their populations. 30
67. Reflecting the above, the Inquiry Panel were provided with a number of initiatives
developed by local authorities that had sought to improve the local food
27
Barrett, M. et al. Greater access to healthy food outlets in the home and school environment is
associated with better dietary quality in young children. Public Health Nutr. 20, 3316–3325 (2017).
28
Vogel, C., Lewis, D., Ntani, G., Cummins, S., Cooper, C., Moon, G., & Baird, J. (2017). The relationship
between dietary quality and the local food environment differs according to level of educational
attainment: a cross-sectional study. PLoS ONE, 12(8), 1-16. [e0183700]. DOI:
10.1371/journal.pone.0183700
29
Black, C., Ntani, G., Inskip, H., Cooper, C., Cummins, S., Moon, G., & Baird, J. (2014). Measuring the
healthfulness of food retail stores: variations by store type and neighbourhood deprivation. International
Journal of Behavioral Nutrition and Physical Activity, 11(1), 69-[24pp]. DOI: 10.1186/1479-5868-11-69
30
http://www.southampton.gov.uk/modernGov/ieListDocuments.aspx?CId=727&MId=5252&Ver=4 Item 6
19environment. A number of these examples of good practice are highlighted in the
paragraphs below.
Bristol Eating Better Award
68. A priority within Bristol’s co-ordinated approach to tackle childhood obesity is
improving the food environment. The approaches are informed by detailed obesity
mapping and extensive community engagement to develop understanding of
community needs and to prioritise initiatives.
69. The Bristol Eating Better award is a free award that supports and rewards
businesses that take action to offer healthier food options and promote
sustainability. The award is about:
• Making small changes, for example in the ingredients used
or how food is prepared and what packaging food is served in
• Offering healthier alternatives such as fruit
• Encouraging customers to choose these alternatives, for
example by making the healthier options cheaper.
70. There are currently 200 food outlets holding an award. The aim is for over 50% of
fast food outlets in the city selling healthy alternatives by 2022 and 90% of food
outlets in Bristol to be involved in the award scheme by 2030.
71. Workng with Licensing, Trading Standards and Environmental Health on the
Eating Better Bristol awards has helped to engage food premises. In addition, a
number of councillors have gone out with Public Health officers and have spoken
directly with food retailers, explaining and encouraging them to sign up to the
awards scheme. This has been helpful, especially in diverse and deprived areas.
Healthier Catering Commitment
72. The Healthier Catering Commitment for London is a scheme run by the London
Boroughs with support from the Mayor of London and the Association of London
Environmental Health Mangers (ALEHM).
73. ALEHM developed the Healthier Catering Commitment scheme in autumn 2010 in
response to London Boroughs that wanted to help businesses to offer healthier
options. Participating food businesses receive personalised support to make the
small changes that will make a big difference to the health of their customers.
74. The scheme recognises businesses in London that demonstrate a commitment to
reducing the levels of saturated fat, salt and sugar in the food sold in their
premises, and to make smaller portions available on request.
75. The Healthier Catering Commitment is a flexible scheme which is delivered by
London boroughs by a variety of departments, including Environmental Health
departments, Public Health departments, third party contractors and health
practitioners.
Sustainable Food Places Award (Previously called Sustainable Food Cities)
76. The Sustainable Food Places Award is designed to recognise and celebrate the
success of those places taking a joined up, holistic approach to food and that are
achieving significant positive change on a range of key food issues. It provides a
framework to help set a direction to transform food in a place based on 6 themes:
20• Promoting healthy and sustainable food to the public
• Tackling food poverty, diet-related ill health and access to affordable
healthy food
• Building community food knowledge, skills, resources and projects
• Promoting a vibrant and diverse sustainable food economy
• Transforming catering and food procurement
• Reducing waste and the ecological footprint of the food system
77. Leeds has made headlines as the city that appears to have bucked the trend in
childhood obesity. Obesity levels (not overweight and obesity) have reduced for
Year R children, with the reduction particularly evident for children from deprived
communities.
78. The food environment activity for the city is delivered through signing up to the
sustainable food places award. The Leeds Food Partnership has been set up to
oversee work towards the 6 themes, and the Leeds Food Charter, outlined in
Figure 10, has been produced in support of Leeds’s goal to achieve Sustainable
Food Place status. Leeds have already achieved the Bronze Sustainable Food
Place award.
Figure 10: Leeds Food Charter
79. Bristol have achieved the Silver Sustainable Food Place award and are going for
Gold in 2020. In Bristol the approach is led by a citywide partnership and a key
strand is focussed on eating better.
80. When addressing the Inquiry Panel at the February 2020 meeting, Grace Davies,
Principal Public Health Specialist at Bristol City Council, identified this as a key
initiative for Bristol that enables healthy eating and improving the food
environment to become embedded within a number of key priorities and
21partnerships across the city, particularly those aimed at addressing food poverty
and sustainability.
Takeaway Planning Policies
81. The National Planning Policy Framework makes it clear that local authorities have
a responsibility to promote healthy communities:
“Planning decisions should aim to achieve healthy…places which…enable and
support healthy lifestyles…for example through the provision of…access to
healthier food” (91(c))
82. Over half of local authorities have a takeaway planning policy 31and it is a tool that
can be utilised to help restrict the proliferation of fast food outlets.
83. Tied to the perception that children are vulnerable, interventions mostly focus on
schools, including exclusion zones in a number of policies. For example, the
London Borough of Waltham Forest has a policy that bans new takeaways from
opening within 400 metres of schools.
84. Gateshead Council has used local planning policy to improve the opportunities its
residents have to make healthy food choices and to reduce levels of obesity.
Their supplementary planning document means that any application for a hot food
takeaway will be declined if it is in an area where more than 10% of children in
year 6 are obese; if it is within 400m of secondary schools and other community
amenities, or if the number of hot food takeaways in the area is equal to or greater
than the UK national average.
85. Southampton City Council does not currently have a planning policy that restricts
the increase in the number of new takeaways in the city. This reflects the views of
Debbie Chase, Interim Director of Public Health – SCC, who stated at the
inaugural meeting of the Inquiry:
“We see in our city the progress being made to encourage people to be more
active. There is less attention paid to the food environment and how collectively
we as a city could make a difference.”
31
Keeble, M., Burgoine, T., White, M., Summerbell, C., Cummins, S., Adams, J. (2019) How does local
government use the planning system to regulate hot food takeaway outlets? A census of current practice
in England using document review https://doi.org/10.1016/j.healthplace.2019.03.010
22Place – The active environment
“We need to make active living both an easy and an enjoyable option by creating
environments that support active living.” - Everybody Active, Every Day framework
for physical activity, PHE
86. Whilst diet is more important in weight management, physical activity has an
important role in helping people maintain a healthy weight. It can also mitigate
against some of the risks associated with excess weight and has important effects
on health, independent of any effect on body weight. 32
87. In children 0-5 years, lower levels of physical activity are linked to increased levels
of obesity. 33
88. Around one in ten 2-4 year old children (10% of boys and 9% of girls) meet the
Chief Medical Officer’s guidelines for physical activity of at least 180 minutes of
activity spread throughout the day 34. 46.8% of children and young people (5-16
year olds) are meeting the new Chief Medical Officer guidelines of taking part in
sport and physical activity for an average of 60 minutes or more every day.
Meanwhile 29% do less than an average of 30 minutes a day. The proportion of
children meeting the Chief Medical Officer’s physical activity recommendations is
lower in those from lower income households. 35
89. The Chief Medical Officer partly attributes the low physical activity levels to our
streets and towns having become increasingly dominated by motorised vehicles,
limiting children’s opportunities to safely explore, cycle, run and play. 36
90. Deprived areas tend to be more physically hazardous, in terms of crime and traffic,
which may limit opportunities for informal physical activity, such as walking, cycling
and play, 37another factor that helps to explain the inequalities in childhood obesity.
Supporting a healthy, active weight environment
91. In her presentation to the Inquiry Panel in December 2019, Angela Baker, Deputy
Director - Public Health England South East, explained that:
“A healthy-weight environment supports people in avoiding becoming overweight
or obese through the way in which a place is designed and the facilities it
provides. It promotes physical activity, provides opportunities for sustainable
transport which prioritise active travel, helping people build physical activity into
daily life. Additionally, it helps people access or choose healthier food options and
access support services.”
32
UK Chief Medical Officer’s Report: Physical Activity Guidelines
https://www.gov.uk/government/collections/physical-activity-guidelines
33
Monasta L. Batty GD, Cattaneo A, Lutje V, Ronfani L, van Lenthe FJ, et al. Early-life determinants of
overweight and obesity: A review of systematic reviews. Obes Rev. 2010: 11 (10): 695-708.
34
Health and Social Care Information Centre: Health Survey for England 2015
35
Sport England, Active Lives Children and Young People Survey 2018/19
36
Time to Solve Childhood Obesity: An Independent Report by the Chief Medical Officer, 2019, p8
37
Noonan RJ, Boddy LM, Knowles ZR, Fairclough SJ. Cross-sectional associations between high-
deprivation home and neighbourhood environments, and health-related variables among Liverpool
children. BMJ Open. 2016;6(1):e008693. doi:10.1136/bmjopen-2015-008693
2392. Local authorities are in a unique position to improve the quality of the environment
and through the planning system have a range of powers, including legislation,
policy and tools which can help create and support healthy weight environments.
93. The Town and Country Planning Association and PHE set out six elements to help
achieve healthy weight environments through the planning process in 2014. These
are; movement and access, open spaces, recreation and play, food environment,
neighbourhood spaces, building design and local economy. 38
94. Angela Baker stated that the key features of these elements are creating places
that:
• Prioritise walking, cycling and mass transit through simple changes such as
dedicated cycle lanes, well-placed bike racks and wide, well-lit pavements,
which encourage individuals to leave their cars at home;
• Provide communal spaces that support wellbeing and encourage active
behaviour in children and adults;
• Create buildings which are able to promote a healthy lifestyle, such as
building homes with kitchens big enough for people to store, prepare and
cook meals and eat together, or commercial building design that
encourages the use of stairs.
The Southampton active environment
95. To consider whether the key features for a healthy active weight environment are
in place in Southampton, or whether proposals exist to improve the situation, the
Panel invited representatives from 3 key council services to attend a meeting of
the inquiry to discuss the current position in the city.
Transport – Connecting Southampton
96. Neil Tuck, Sustainable City Team Leader at the Council provided an overview of
the developments in Southampton designed to encourage and enable people to
choose healthy and active travel options.
97. Connected Southampton, the Local Transport Strategy influenced by Public
Health, includes, under the strategic aim of ‘A Better Way to Travel’, the goals of
supporting people to change how they move around the city by widening their
healthy and clean travel choices, encouraging them to get around actively and
healthily, and helping Southampton become a zero emission city.
Cycling
98. To achieve these goals significant resources being invested in delivering a cycle
network (£8.3m worth of projects being completed during 2019). The Western
Corridor route (SCN1 in Figure 11) was completed in 2019 and has seen an uplift
of 20% in people cycling.
99. Alongside physical infrastructure improvements, an engagement and behaviour
change programme, targeting those who want to change and those whose change
will create the most impact, is being delivered. Focus is on new school starters,
building cycling confidence and competence, with priority given to schools near
38
TCPA & PHE 2014, Planning healthy weight environments – a TCPA reuniting health with planning
project https://www.london.gov.uk/sites/default/files/osd53_planning_healthy_weight_environments.pdf
24core corridors / areas of poor air quality. In 2018/19, 53 Southampton schools
engaged in the programme - an active travel rate of 88% was achieved in 13
selected schools.
Figure 11 – The planned Southampton Cycling Network
Child-friendly neighbourhoods and streets
100. Through Metamorphosis, an EU funded programme, the Council has been trialling
a number of initiatives with an ethos of child-friendly neighbourhoods and streets
conducive to walking and cycling, and reducing motor car use.
101. Community and school street closures are being piloted. Community Street
Openings typically involve temporary street closures, but with scope to re-occur on
a regular basis, e.g. holiday streets, play streets. Local traffic regulation orders
are invoked, usually accompanied by other public space interventions, including
street art, music and other activities that encourage social interactions.
102. The purpose is to build community cohesion, making streets and public spaces
safer, yet fun and accessible to all, while linking communities to local facilities or
areas of interest, including schools/shops, and encouraging active travel and
healthier lifestyles.
103. ‘School Streets’, timed street closures before and after the school starts and ends
have been trialled to discourage disproportionately short journeys, improve local
air quality, improve safety and promote active travel.
104. A trial street closure by St Marys Primary School, a school where obesity levels for
year 6 pupils are above the city average (one of the reasons for choosing this
site), had positive results. 82% agreed that it was child friendly; 72% of parents
who usually drive to school agreed it was more enjoyable; a massive 93%
supported more regular closures. Across the 4 events there were more than 2000
active journeys to school that day. The Council is now working to implement a
long-term School Street trial with the school.
25105. The Council is working with local communities to develop Active Travel Zones in
neighbourhoods so people can walk and cycle easily and safely. This includes
creating safe spaces, routes, changing roads, landscaping, cycle parking and links
to main corridors. Learning from best practice in Waltham Forest and elsewhere
is embedded within the approach and a Healthy Streets assessment tool to
integrate health outcomes into the assessment for evaluating projects is now
being utilised by the Council.
Figure 12 – Healthy Streets Assessment Tool (TfL)
Transforming Cities Fund
106. A joint bid between Southampton and Hampshire has been awarded significant
funding by the Department of Transport, via the Transforming Cities Fund. While
at the time of writing the final details are yet to be published, this represents a big
opportunity to improve sustainable and active travel in Southampton over next four
years; to progress child friendly neighbourhoods and streets schemes; and to
transform people’s journeys by bike and public transport in Southampton.
107. The Council is working with the University of Southampton to evaluate the
effectiveness of initiatives and to develop an evidence base. Modal shift away
from the motor car is happening in Southampton but changing travel habits and
culture is a long term, gradual process.
Parks and Green Spaces
108. Green space has been linked with reduced levels of obesity in children and young
people 39 and a positive correlation between distance to green space and
childhood obesity levels has been identified. 40
39
Liu GC, Wilson JS, Qi R, Ying J. Green neighborhoods, food retail and childhood overweight:
differences by population density. Am J Health Promot 2007; 21: 317–325.
40
Nielsen TS, Hansen KB. Do green areas affect health? Results from a Danish survey on the use of
green areas and health indicators. Health & Place. 2007;13:839–850.
26109. Living in areas with green spaces is associated with significantly less income-
related health inequality, weakening the effect of deprivation on health, such as
that identified with childhood obesity. 41
110. Lindsay McCulloch, Team Leader - Education and Ecology at the Council, outlined
the range of opportunities children and young people have to access parks and
open spaces in Southampton.
111. 21.14% of Southampton is green space. Residents of Southampton have access
to numerous free formal and informal facilities in the parks and open spaces, and
they are distributed across the city. Facilities include 50 parks, 100 play areas, 4
skate parks, 24 multi-use games areas, 8 greenways, informal football pitches and
cycle tracks.
Figure 13: Population density and distance to parks in Southampton
112. As identified in the map above, despite a fairly even distribution of green spaces in
the city a number of the most densely populated areas are more than 300m from a
2 hectare site, the smallest site required for a decent walk.
113. Numerous formal and informal sports, play and wildlife activities for children are
delivered in the parks and open spaces. In the last five years new larger play
areas have been provided in Hoglands Park, the Common, Mayfield Park and
Mansel Park and medium sized play areas at Veracity Park, Eddie’s Play Trail and
Puffin Close have been refurbished.
114. Despite these treasured assets the Council’s Community Engagement Officers
have noticed that there are fewer unaccompanied children playing on semi-natural
greenspaces in the city. It is believed that this may be a reflection of parental
sense of risk. This is particularly evident in children from Southampton’s council
41
Mitchell R, Popham F. Effect of exposure to natural environment on health inequalities: an
observational population study. The Lancet. 2008;372:1655–1660.
27estates and the lack of exposure from a young age is leading to lack of confidence
in green spaces.
115. The Parks and Open Spaces team are working to encourage residents to visit
their local wildlife in their free time and are considering tailored interventions which
increase the interest in green spaces for disadvantaged areas.
Planning
116. As mentioned the planning system has a range of powers and levers to implement
change at local levels. All local authorities are being encouraged to consider how
they can best use the planning system to improve their communities’ health and
reduce health inequalities, this includes helping to promote a healthy weight
environment.
117. Many local authorities are already incorporating healthy weight environment
aspects into local planning policy and practice. Indeed, the use of planning powers
to restrict the growth of hot-food takeaways has already been highlighted in this
report.
118. To discuss planning’s contribution to improve health outcomes, Paul Barton, the
Council’s Interim Head of Planning and Economic Development, outlined for the
Panel the opportunities presented by Southampton City Vision, the local plan that
is currently in development.
119. The City Vision local plan, due for adoption in 2022, will set out the strategic
priorities for the development of the city. This provides an opportunity for the
facilitation of a healthy city to be a priority in the city’s development.
120. The new plan could help to improve health in the city by influencing wider
determinants of health such as the quality of homes, transport, environment, jobs
and infrastructure. A number of these factors can help support levels of physical
activity among city residents and enhance the food environment.
121. A “healthy planning” specialist, funded by Public Health, is being recruited into the
Planning Policy Team to ensure that health is at the forefront of planning making
processes.
Figure 14 - City Vision Local Plan
28Energise Me
122. In addition to the presentations from Southampton City Council officers, a
presentation was provided by Energise Me, the Active Partnership whose
objective is to promote community participation in sport and healthy recreation for
the benefit of everyone living in Hampshire and the Isle of Wight.
123. A key aim within the Hampshire and Isle of Wight Physical Activity Strategy 2017-
2021 is to improve levels of physical activity among children and young people.
124. Energise Me is working together to support schools to build physical activity into
their school day through Active initiatives: Active Bursts, Active Learning, Active
Travel, Active Playtime and outside school through Active Home.
125. Despite this, levels of physical activity by children and young people in
Southampton are lower than the national average across a range of indicators: 42
• 2018/19 - % of Children and Young People doing an average of 60 mins a
day - Nationally 46.8%, Hampshire 43.4%, Southampton 40%
• 2018/19 - 30 minutes of Sport and Physical Activity at school all years 1-
11 - Nationally 40.4%, Hampshire 35.2%, Southampton 36.7%
• 2018-19 - 30 minutes of Sport and Physical Activity outside school all
years 1-11 - Nationally 57.2%, Hampshire 56.5%, Southampton 47.8%
Good practice – Improving the active environment
126. Whilst recognising that Southampton has many of the key features required for a
healthy and active weight environment, and positive developments are planned to
support an increase in active travel, there are examples of good practice that the
city needs to be aware of when considering opportunities to improve the active
environment.
Public Health England (PHE) Guidance
127. PHE has recently published guidance that aims to provide practical support for
local authorities that wish to use the planning system to achieve important public
health outcomes around diet, obesity and physical activity.
128. ‘Using the planning system to promote healthy weight environments’ provides a
framework and starting point for local authorities to clearly set out in local planning
guidance how best to achieve healthy weight environments based on local
evidence and needs, by focusing on environments that enable healthier eating
and help promote more physical activity as the default.
Community Hubs
129. According to the 2018/19 Sport England, Active Lives Children and Young People
Survey, only 36.7% of all years 1-11 in Southampton schools undertake an
average of 30 minutes a day of Sport and Physical Activity at school. The national
average is 40.4%.
130. In his presentation to the Panel, Luke Newman, Chief Executive of Testlands,
outlined the model used by Testlands to link primary schools, the local community
and the Testlands community hub (site of former Millbrook School - Green Lane).
42
Sport England, Active Lives Children and Young People Survey 2018/19
29You can also read