Our lifestyle section five - Risk and protective factors
←
→
Page content transcription
If your browser does not render page correctly, please read the page content below

section five

                   Our lifestyle
                      Risk and protective factors

Budd Photography              Report of the Chief Health Officer Queensland   71
Section five

     Our lifestyle
                                           Exposure to behavioural and environmental risk factors can
     Risk and protective factors           cause or contribute to disease development, can slow recovery
                                           or increase the health impacts in early stages of disease,
                                           or worsen long term chronic conditions. Prevention efforts
                                           are targeted to each phase of this continuum. For example,
     › Smoking                             in Queensland, restricting retail display, prohibiting smoking in
                                           indoor and outdoor public spaces and smoking cessation efforts
     › Weight                              have de-normalised tobacco use and significantly reduced
                                           smoking. Population-based cancer screening programs reduce
     › Diet                                the morbidity and mortality associated with breast, bowel and
                                           cervical cancers through early detection. Queenslanders on the
     › High blood pressure, glucose        orthopaedic surgery wait list with lifestyle-related risk factors can
                                           elect to participate in the “Way to Wellness” program delivered
       and cholesterol                     by trained telephone counsellors.

     › Alcohol consumption                 Engaging in unhealthy behaviours reduces health-related quality
                                           of life. For example, in 2020, adult daily smokers averaged 12.1
     › Illicit drug use                    unhealthy days and 4.5 days with limited usual activities in the
                                           past 30 days compared to 7.3 unhealthy days and 2.5 days
     › Physical activity                   with limited activities for non-smokers and non-daily smokers.94
                                           Obese Queenslanders experienced 6.1 physically unhealthy
                                           days, 6.5 mentally unhealthy days, and 3.9 days with limited
     › Sun safety                          activities in the past 30 days compared to 3.1, 4.5 and 2.1 days,
                                           respectively, for healthy weight adults. Similar relationships
     › Domestic violence and child abuse   were found for physical inactivity and risky levels of alcohol
                                           consumption.
     › Immunisation
                                           Improving modifiable risk factors, especially before disease
     › Cancer screening                    occurs, not only benefits the health and wellbeing of
                                           Queenslanders, it also plays a role in controlling health care
     › Rest and sleep                      costs. This is the economic rationale behind investing in
                                           prevention. Australia carries a relatively large disability burden
                                           compared to other high-income countries. Nationally, 38% of
     › Road safety                         the health burden was attributable to modifiable risk factors in
                                           2015.82 Of the total national health expenditure in 2013–14,275
     › Oral health risks                   only 1.3% was spent on prevention.

     › Environmental factors
                                                                                                            Budd photography

72   The health of Queenslanders 2020
Our lifestyle

A recent review showed that while substantial healthcare costs      Smoking
were associated with modifiable risk factors (ranging from
AUD $0.4 to $13.7 billion per year for individual risk factors in   Smoking remains the leading preventable cause of death and
2016–17), the largest cost components were due to productivity      disease despite a significant reduction in smoking rates over
loss.276 These cost estimates vary considerably based on            recent decades. The disease burden remains high because
included diseases, risk factors and cost components, and other      of the considerable lag period between smoking and illness.
methodological differences. Prevention efforts that support         Nationally, from 1960 to 2020, smoking is estimated to have
healthy lifestyles are important to help Australians lead healthy   caused the death of 1.28 million Australians.283
and productive lives longer as they age. This cannot be achieved
                                                                    The health impacts of smoking include lung cancer and 18
with improvements in treatment alone.
                                                                    other cancers and neoplasms, cardiovascular diseases such
There is growing evidence that public health interventions are      as coronary heart disease, type 2 diabetes, gastrointestinal
cost-effective with up to 75% of UK public health interventions     disorders, hearing and vision disorders, infectious diseases,
from 2005 to 2018 meeting this criterion.101 It was estimated       musculoskeletal conditions, neurological conditions, and
that a $1 investment in public health generated $14 in return,277   respiratory diseases such as COPD.82 Compared to adults who
in addition to the return of the original investment, back to the   had never smoked, Australian current smokers die on average
wider health and social economy.                                    10 years earlier and develop age-related diseases 10 years
                                                                    earlier.284,285
Data in this section are from several primary sources. National
surveys include the NHS,125 National Aboriginal and Torres Strait   Nationally, smoking accounted for 9.3% of the total health
Islander Health Survey (NATSIHS),71 the National Drug Strategy      burden (DALY) in 2015.82 This includes 14% of early deaths
Household Survey (NDSHS),278 the Australian Secondary School        (YLL, an estimated 4000 deaths in Queensland) and 5.0%
Alcohol and Drug (ASSAD) surveys279,280 and the 2015 ABDS.82,90     of the disability burden (YLD).
For most of the national surveys, data are collected every
three years.

Queensland conducts an annual adult and child preventive
health telephone survey which provides regional results for
                                                                         At a glance
HHSs and LGAs. Results of the surveys are available online from          Smoking
QSAS.233,281 Because the Queensland survey is collected more
often and includes more participants, it is used for trends              In Queensland:
and for reporting by most sociodemographic characteristics.
                                                                         410,000 (10%) adults smoked daily in 2020—of these,
The National Health and Medical Research Council (NHMRC)     282         230,000 (12%) were male and 180,000 (8.9%) were female
helps achieve the best health outcomes for Australians by
commissioning and disseminating evidence-based health                    56,000 (42%) Aboriginal and Torres Strait Islander adults
guidelines. The percentage of people adhering to these                   smoked daily in 2018–19
guidelines is used as key health measures throughout
this section.                                                            23,000 (6.9%) school children aged 12–17 years smoked
                                                                         at least one cigarette in the past seven days in 2017
In this section additional tables are provided in the Appendix,
indicated by an ‘A’ preceding the table number.
                                                                         Smoking is a leading contributor to health inequities based
                                                                         on socioeconomic status, geographical location and Aboriginal
                                                                         and Torres Strait Islander status

                                                                         In 2018–19, 490,000 (13%) Queensland adults had ever tried
                                                                         e-cigarettes
                                                                                                                                         Queensland Health Asset Library

                                                                                      Report of the Chief Health Officer Queensland      73
Section five
In 2015–16, the total cost of smoking in Australia was 7.0%).233 Never smoking was associated with socioeconomic
estimated at $137 billion which translates to $27.4 billion status—adults in the most advantaged areas were 33% more
based on Queensland’s share of the Australian population.286 likely than those in the most disadvantaged areas to have
Nationally, tangible costs of $19.2 billion include premature never smoked (65% compared with 49%).
death, hospitalisations, other medical and social care costs,
workplace absenteeism and tobacco spending. Intangible costs Remoteness: Daily smoking prevalence was higher outside
of $118 billion include the value of life lost, pain and suffering. major cities—ranging from 36% higher in inner regional areas
to 94% higher in remote/very remote areas in 2020.233
Population characteristics HHS differences: In 2019–20, daily smoking was higher than
In 2020, of adult Queenslanders : 233 the state average in five HHSs—ranging from 2.5 times higher
in Torres and Cape to 33% higher in Wide Bay.233
• 10% smoked daily (Figure 5.1, Table A1)
• 5.5% were current (not daily) smokers Aboriginal and Torres Strait Islanders: In 2018–19, the daily
smoking population prevalence for adult Aboriginal and Torres
• 27% were ex-smokers Strait Island people living in Queensland was 42% while 31%
• 57% never smoked had never smoked.71 The adult age-adjusted daily smoking
• 22% of households with children had a current smoker prevalence was similar to Aboriginal and Torres Strait Islander
living in the home. people living nationally (41% compared with 40%). Among other
Queenslanders, the daily smoking prevalence was 15%.28
Among Queensland secondary school students aged
12–17 years in 2017279: National comparisons: In 2017–18, the Queensland age-
adjusted adult daily smoking prevalence was similar to the
• 77% had never smoked a cigarette (lower than the 82% national average (15% compared to 14%) and Queensland
nationally) ranked third highest of the jurisdictions.125
• 10% had just had a few puffs
Smoking cessation: In 2020, 63% of adults who had ever
• 6.9% had smoked in the previous week (higher than the 5.0% been smokers had quit.233 Smoking cessation increased with
nationally). age ranging from 25% among 18–29 year-olds to 87% among
those aged 65 years and older. There were no differences
Sex: In 2020, the prevalence of adult daily smoking was 32%
in the proportion of smokers who had quit by sex, remoteness
higher for males than females (12% compared with 8.9%).233
or socioeconomic status in most areas.
Age: A higher percentage of young adults had never
smoked—67% of 18–29 year-olds compared to 52% of those
aged 45 years and older.233
Trends
The prevalence of daily smoking in Queensland continues to fall
Area socioeconomic status: There is a socioeconomic gap in and as of 2020 had declined by 47% since 2002.281
daily smoking in Queensland. In 2020, daily smoking prevalence
in the most disadvantaged areas was more than double Larger declines in daily smoking were seen in younger age
(2.3 times) that in advantaged areas (16% compared with groups and in the most advantaged areas. From 2002 to 2020,
Figure 5.1Adult daily smoking, Queensland, 2020233
40
30
Percentage
20
10
0
Persons 18+
Males 18+
Females 18+
18–29 years
30–44 years
45–64 years
65+ years
Disadvantaged
Quintile 2
Quintile 3
Quintile 4
Advantaged
Cairns and Hinterland
Central Queensland
Darling Downs
Metro North
Metro South
Torres and Cape
Townsville
West Moreton
Remote/very remote
Inner regional
Outer regional
Central West
Gold Coast
North West
South West
Sunshine Coast
Major city
Mackay
Wide Bay
Sex Age Socioeconomic status Remoteness Hospital and Health Services, 2019–20
(SEIFA) (Persons 18+)
See QSAS for more information
74 The health of Queenslanders 2020
Our lifestyle

prevalence of daily smoking declined, on average, by 55%              Electronic cigarette use
for 18–29 year-olds compared to 29% for those aged 65 years           Electronic cigarettes (e-cigarettes) heat liquid, which usually
and older.281 Among those in the most advantaged areas,               contains nicotine, into a fine vapour to inhale into the lungs.
daily smoking declined by 55% on average compared to 30%              Australian governments have taken an evidence-based and
in the most disadvantaged areas.                                      precautionary approach to e-cigarettes based on the risks
                                                                      they pose to tobacco control and population health in terms
Trends in adult smoking cessation show an increase of 8.7% in
                                                                      of smoking initiation, cessation, youth uptake, and dual use
quit rates from 2009 to 2020 (Table 5.1). There was no evidence
                                                                      with conventional tobacco products.287
that increases in cessation rates varied by sociodemographic
characteristics.                                                      In 2018–19, 13% of Queensland adults had ever tried an
                                                                      e-cigarette. Of all Queensland adults (Figure 5.2 and Table A2)233:
                                                                      • 2.3% currently used e-cigarettes, including daily use
           The proportion of adults                                     (Figure 5.2)
     smoking daily has halved since 2002,                             • 0.7% used them daily
               to 10% in 2020.                                        • 11% were daily smokers compared to 1.2% of those who
                                                                        were not, including those who had ever smoked.233

Most HHSs followed a similar pattern with significant reductions      Sex: Males were more likely to have ever tried e-cigarettes
in daily smoking and smaller increases in tobacco cessation           than females (15% compared to 11%) and to be using them
(Table 5.1).281 Importantly, cessation increased by similar           currently (3.2% compared to 1.4%).
amounts in all HHSs, however, was significant for West Moreton
HHS. HHS trends should be interpreted with caution because            Figure 5.2Adult current e-cigarette use, Queensland,
detecting regional change is more difficult, especially in areas      2018–19233
with small population size.                                                         20

These findings suggest that declines in smoking are driven by                       15
                                                                      Percentaage

reduced uptake, particularly among younger Queenslanders                            10
or those from more advantaged areas. Relative to the success
                                                                                    5
in reducing uptake, increasing cessation has proven more
challenging. While it is encouraging that cessation rates are                       0
similar for all population groups, populations with historically
                                                                                         Persons 18+

                                                                                                       Males 18+

                                                                                                                         Females 18+

                                                                                                                                       18–29 years

                                                                                                                                                     30–44 years

                                                                                                                                                                     45–64 years

                                                                                                                                                                                   65+ years

                                                                                                                                                                                                 Daily smoker

                                                                                                                                                                                                                Not a daily smoker
higher smoking prevalence will take longer to fully realise
the benefits of increasing smoking cessation trends.

                                                                                                                   Sex                                             Age                         Smoking status
Table 5.1Adult smoking trends, Queensland, 2009–2020281
                                 Average percentage change            In 2017, 16% of Queensland secondary school students aged
                            Daily smoking       Smoking cessation     12–17 years had ever used e-cigarettes (compared to 14%
                                         Total                Total   nationally), and of those about one-third had done so in the
                               Per    (2009–         Per   (2009–     previous month.279 Males students aged 12–17 years were
HHS                          year       2020)       year     2020)
                                                                      twice as likely as female students to have ever used e-cigarettes
Cairns and Hinterland         -2.8        -27        0.8        8.7   (20% compared to 11% in 2017).
Central Queensland            -2.1        -21        0.7        7.9
Central West                  -2.9        -28        0.6        7.1   Nationally, of school students who had never smoked
Darling Downs                 -4.7        -41        1.3      15.7    a tobacco cigarette before their first e-cigarette, 1 in 4 (25%)
Gold Coast                    -5.2        -45        0.4        5.0   later tried tobacco cigarettes.280 Australian female students
Mackay                        -2.9        -28        1.1      12.5    were more likely than male students to have smoked before
Metro North                   -4.1        -37        0.7        8.0   trying e-cigarettes (59% compared to 47%).
Metro South                   -3.9        -36        0.6        6.6
North West                    -2.1        -20        0.8        9.2
                                                                      With a strong regulatory approach to e-cigarettes and tobacco
                                                                      more broadly in Queensland and nationally, Australia has
South West                    -2.3        -23        0.7        8.2
                                                                      not experienced rapid increases in youth e-cigarette use.289
Sunshine Coast                -5.6        -47        1.1      12.3
                                                                      International evidence is mixed with countries such as the UK
Torres and Cape               -3.6        -33        0.0        0.4
                                                                      and New Zealand reporting little increase in youth e-cigarette
Townsville                    -3.5        -33        0.9      10.4
                                                                      use.288,289 Other countries, however, have seen large increases,
West Moreton                  -5.0        -43        1.9      23.4
                                                                      for example, past 30-day e-cigarette use was: 28% for US Grade
Wide Bay                      -2.0        -20        0.3        3.4
                                                                      9 to 12 students in 2019290 and 29% for Canadian Grade 10
Queensland1                   -3.9        -36        0.8        8.7
                                                                      to 12 students in 2018–19.291
Bold font indicates significant change over time
Positive numbers indicate increasing trends and declining trends
are negative numbers
1 State level trends from 2002 to 2020 showed a 47% decline

      See QSAS trends for more information

                                                                                                               Report of the Chief Health Officer Queensland                                                                         75
Section five

     National comparisons: In 2019, all jurisdictions were similar to    Looking forward
     the national prevalence for current and past use of e-cigarettes    Australia’s commitment to tobacco control has withstood
     among persons aged 14 years and older.278 Of the jurisdictions,     numerous challenges by the tobacco industry—most recently
     Queensland ranked second highest for current use (2.9%              in June 2020 with plain packaging laws being upheld by the
     compared to 2.5% nationally) and fourth highest for past use        World Trade Organization Appellate Body.292 Research evidence
     (2.1% compared to 2.0% nationally). An additional 7.2%              demonstrates that tobacco control policies reduce smoking-
     of Queenslanders had tried e-cigarettes once or twice.              related illness and contribute to declining smoking rates.293
                                                                         Among the jurisdictions, Queensland has remained a leader
                                                                         in tobacco control policies for smoke-free places and the
          More adults had never used tobacco                             regulation of e-cigarettes.
            and the proportion of smokers                                A risk of e-cigarettes is that nicotine use and potentially smoking
          who have quit continues to increase.                           becomes more socially acceptable. Since 2015, Queensland
                                                                         tobacco legislation has defined e-cigarettes as smoking
                                                                         products. Therefore, they are subject to the same restrictions
                                                                         as tobacco products and cannot be sold to persons under 18,
     Burden of disease                                                   advertised and displayed in shops or used in smoke-free
     For conventional tobacco smoking, the five conditions with          public places.
     the highest percentage of total burden (DALY) nationally
     in 2015 were82:                                                     In Queensland, dynamic simulation modelling showed that
                                                                         the greatest future reduction in smoking would be achieved
     • 78% of lung cancer                                                by a combination of increased smoking cessation campaigns
     • 75% of laryngeal cancer                                           and further restrictions to tobacco sales.294 Importantly,
     • 72% of COPD                                                       disinvestment in existing strategies was shown to lead to
                                                                         increased smoking.
     • 53% of lip and oral cavity cancer
     • 52% of oesophageal cancer.

     Table A3 includes the per cent of total burden attributable
     to tobacco use for all conditions as well as early death (YLL)
     and disability (YLD) burdens.82,106

     Hospital burden: Tobacco use accounted for the equivalent
     of 66,400 episodes of care and 226,700 patient days
     in Queensland in 2015–16.

     Of Queensland hospitalisations associated with tobacco use,
     the five leading conditions were COPD, lung cancer, coronary
     heart disease, lower respiratory infections,
     and other cardiovascular diseases.

     Trends in burden: Nationally from 2003 to 2015, the total
     burden attributable to tobacco use increased by 2%.90 This net
     increase was driven by increases associated with population
     growth and population aging and decreases in linked disease
     burden and exposure to tobacco use.

     When adjusted by age, burden due to conditions linked
     with tobacco use decreased by 24% from 2003 to 201590
     (from 21.6 DALYs to 16.4 DALYs per 1000). For males the DALY
     rate decreased by 31% and for females by 11%.

     Burden attributable to tobacco use is a combination of three
     different types of tobacco use (current tobacco use, past tobacco
     use and second‑hand smoke). Different tobacco use types are
     linked to different diseases because the time from exposure
     to developing the linked disease varies. Nationally, the total
     attributable burden from 2003 to 201590:
     • decreased by 20% (28,000 DALYs) for current tobacco use
     • increased by 15% (41,600 DALYs) for past tobacco use
     • decreased by 57% (4900 DALYs) for second‑hand smoke,
       largely driven by decreases in exposure to tobacco use.

76   The health of Queenslanders 2020
Our lifestyle

Weight                                                                 By measurement in 2017–18, for Queensland adults296:
                                                                       • fewer males were healthy weight than females
Overweight and obesity is a significant public health challenge
                                                                         (25% for males compared to 39% for females)
given the complexity of their causal pathways and the
subsequent difficulties in implementing population-based               • more males were overweight than females
interventions. They are the result of multiple interactions              (39% for males compared to 28% for females)
involving genes, social determinants of health, our social             • more males were overweight or obese than females
and physical environments, diet, physical activity and other             (73% for males compared to 59% for females).
diseases, disorders and disabilities. Obesity is an endocrine
disorder caused by factors underlying excess body-fat                  By measurement in 2017–18 for children, there was no
accumulation, the biological defence of excess fat mass,               difference between males and females for any weight
and challenges in weight loss maintenance.295 Effective                category.296 Self-reported overweight for adult males was higher
obesity prevention and treatment involves understanding and            than females (42% compared with 29%) while obesity was
addressing the molecular, genetic, epigenetic, developmental,          similar (Figure 2.3).233 By proxy-report for children, there was no
neurobiological, behavioural, and environmental factors                difference between males and females for any weight category
that influence energy balance.                                         (Table A5).

The health impacts of overweight and obesity include 17 cancers
and other neoplasms, cardiovascular diseases such as stroke
and hypertension, musculoskeletal conditions, type 2 diabetes,
chronic kidney disease, dementia, asthma, gallbladder and bile               At a glance
duct disease, and cataracts.82
                                                                             Weight
Nationally, overweight and obesity accounted for 8.4% of
                                                                             Based on measured body mass index in 2017–18,
the total health burden (DALY) in 2015.82 This includes 9.1%
                                                                             for Queensland in 2020:
of early deaths (YLL, an estimated 2700 deaths in Queensland)
and 7.7% of the disability burden (YLD). In Australia, the                   571,000 (66%) children and 1.28 million (32%) adults
estimated healthcare costs attributable to obesity ranged                    were healthy weight
 from $1.5 billion to $4.6 billion per year (in 2016–17 dollars).276
The corresponding annual costs from productivity loss due to
                                                                             140,000 (16%) children and 1.33 million (34%) adults
obesity ranged from $0.84 billion to $14.9 billion.
                                                                             were overweight

Population characteristics                                                   70,000 (8.3%) children and 1.29 million (32%) adults
In Queensland by measurement in 2017–18125,296:                              were obese
• 32% of adults and 66% of children were healthy weight
  (Table A4)                                                                 210,000 (25%) children and 2.62 million (66%) adults
                                                                             were overweight or obese
• 34% of adults and 16% of children were overweight
• 32% of adults and 8.3% of children were obese                              The combined prevalence of overweight and obesity in
• 66% of adults and 25% of children were overweight or obese                 Queensland adults and children was similar to the national
                                                                             prevalence in 2017–18
• 1.8% of adults and 9.9% of children were underweight.

In Queensland by proxy or self-report in 2020233:
• 37% of adults were healthy weight and 73% of children were
  healthy weight/underweight (Table A5)
• 35% of adults and 18% of children were overweight
• 25% of adults (Figure 5.3) and 8.6% of children were obese
• 60% of adults and 27% of children were overweight or obese
• 2.7% of adults were underweight.

Sex: A waist circumference of 94cm or more for adult males or
80cm or more for adult females indicates an increased risk of
developing chronic disease. In 2017–18 by waist measurement,
60% of Queensland adult males and 65% of adult females
were at an increased risk of chronic disease which was similar
to national results.125
                                                                                                                                              Breakingpic – Pexels

                                                                                          Report of the Chief Health Officer Queensland       77
Section five
Figure 5.3Adult self-reported obesity, Queensland, 2020233
40
30
Percentage
20
10
0
Persons 18+
Males 18+
Females 18+
18-29 years
30-44 years
45-64 years
65+ years
Disadvantaged
Quintile 2
Quintile 3
Quintile 4
Advantaged
Remote/very remote
Cairns and Hinterland
Central Queensland
Darling Downs
Metro North
Metro South
Torres and Cape
Townsville
West Moreton
Inner regional
Outer regional
Central West
Gold Coast
North West
South West
Sunshine Coast
Major city
Mackay
Wide Bay
Sex Age Socioeconomic status Remoteness Hospital and Health Services, 2019–20
(SEIFA) (Persons 18+)
See QSAS for more information
Age: By measurement in 2017–18, for Queensland adults296: Based on self-report in 2020,233 the prevalence of adult obesity
• more younger adults were a healthy weight than older adults outside major cities varied from 22% in outer regional areas
(50% for 18–24 year-olds compared to 24% for those aged to 50% higher in remote areas. Overweight prevalence did not
55–64 years) differ, while the combined category of overweight and obesity
was about 12% higher outside major cities.
• underweight was highest in younger adults (6.7% for 18–24
year-olds compared to 0.6% for those aged 35–44 years) Based on proxy-report in 2020,233 there was no difference
• fewer younger adults were overweight—25% for 18–24 in the prevalence of childhood overweight or obesity between
year-olds compared to 37% for those aged 35–44 years major cities and regional and remote areas, however, combined
overweight and obesity was 49% higher in remote areas than
• fewer younger adults were obese—17% for 18–24 year-olds major cities (38% compared to 25%).
compared to 43% for those aged 55–64 years
• fewer younger adults were overweight and obese—41%
for 18–24 year-olds compared to 76% for those aged The proportion of adults that
55–64 years.
were obese, based on measurement,
Area socioeconomic status: By measurement in 2017–18,296 remained the same from 2011–12
the proportion of Queensland adults who were obese increased
to 2017–18.
with relative disadvantage—38% of those living in the most
disadvantaged areas were obese compared to 28% in the
least disadvantaged areas. Queensland adults who were
HHS differences: Compared to the state average in 2019–20
overweight and obese or overweight only did not differ by areas
(by self-report)233:
of disadvantage.
• seven HHSs had a higher prevalence of adult obesity
Based on self/proxy report in 2020233: (ranging from 20% higher in Central Queensland to 51%
• adults in the most disadvantaged areas were 2.2 times more higher in North West) and 2 HHSs had a lower prevalence
likely to be obese than those in the most advantaged areas of adult obesity (19% lower in Sunshine Coast and 20% lower
(36% compared to 16%) in Gold Coast)
• children living in the most disadvantaged areas were 2.1 times • seven HHSs had a higher prevalence of adult overweight
more likely to be obese than children in more advantaged and obesity, varying from 11% higher in Mackay to 22%
areas (14% compared to 6.5% in quintile 4) higher in North West
• overweight prevalence did not differ for adults or children. • there were no differences across Queensland for adult
overweight.
Remoteness: Based on measurement in 2017–18,296 the
prevalence of overweight or obesity for Queensland adults For proxy-reported child overweight and obesity in 2019–20,233
in major cities did not differ from those living in regional the combined areas of North West/ Central West/South West
or remote areas. HHSs and Darling Downs/West Moreton HHSs had higher
prevalences than Queensland overall. This should be viewed
cautiously, however, due to small population sizes.
78 The health of Queenslanders 2020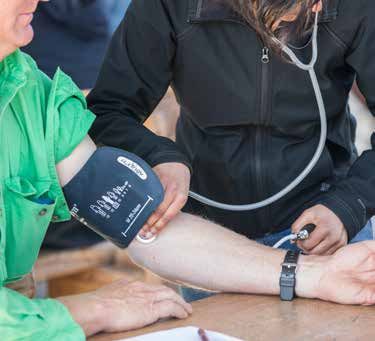
Our lifestyle

Aboriginal and Torres Strait Islanders: In Queensland in 2018–       increase. HHS trends should be interpreted with caution because
19,28 the age-adjusted measured prevalence of overweight and         detecting regional change is more difficult, especially in areas
obesity among Aboriginal and Torres Strait Islander adults was       with small population size.
77%, similar to the national average (77%). Queensland ranked
fifth highest of the jurisdictions. Sixty-six per cent of other      Table 5.2Trends in self-reported obesity in adults, Queensland,
Australians and 65% of other Queenslanders were overweight           2009–2020281
and obese.
                                                                                                      Average percentage change
For Queensland Aboriginal and Torres Strait Islander children                                                  Obesity
aged 2–17 years, the population prevalence of overweight and                                                                Total
                                                                     HHS                            Per year           (2009–2020)
obesity in 2018–19 was 38%, similar to the national average
(36%).71                                                             Cairns and Hinterland            0.4                     4
                                                                     Central Queensland               1.1                    12
National comparisons: In 2017–18,28 based on measurement             Central West                     1.5                    18
and adjusted by age, Queensland adults were similar to               Darling Downs                    3.0                    39
Australia overall for all weight categories. When ranked from        Gold Coast                       1.3                    15
highest to lowest, Queensland was second for healthy weight          Mackay                           1.4                    17
(tied with two jurisdictions), eighth for overweight, second for     Metro North                      1.4                    17
obesity (tied with one jurisdiction), and seventh for overweight     Metro South                      1.3                    15
and obesity.                                                         North West                       2.1                    25
                                                                     South West                       1.4                    17
In 2017–18,28 based on measurement and adjusted for age,
                                                                     Sunshine Coast                   1.3                    15
Queensland children were similar to Australia overall for all
                                                                     Torres and Cape                  2.9                    37
weight categories. Of the jurisdictions ranked from highest
                                                                     Townsville                       0.5                     6
to lowest, Queensland children ranked fifth for healthy weight,
                                                                     West Moreton                     3.5                    46
seventh for overweight, fourth for obesity (tied with one
                                                                     Wide Bay                         0.9                    10
jurisdiction), and seventh for overweight and obesity.
                                                                     Queensland1                      1.5                    17
                                                                     Bold font indicates significant change over time
Trends                                                               Positive numbers indicate increasing trends
Based on measured weight and accounting for age, adult obesity       1 State level trends from 2004 to 2020 showed an increase of 32%
prevalence in Queensland has not increased since 2011–12.296
                                                                           See QSAS trends for more information
Nationally, adult obesity prevalence was 24% in 2007–08,
27% in 2011–12, 28% in 2014–15 and 31% in 2017–18.125
Queensland was one of the three jurisdictions without an             Burden of overweight and obesity
increase in overweight and obesity in 2017–18.                       Nationally, the five conditions with the highest percentage of total
                                                                     burden (DALY) attributed to overweight and obesity in 2015 were82:
Adjusted for age, prevalence from 2007–08 to 2017–18 for
Queensland adults296:                                                • 54% of type 2 diabetes
• measured obesity increased by 20% (25% compared with               • 45% of uterine cancer
  30%) from 2007–08 to 2011–12, with no change to 2017–18            • 45% of hypertensive heart disease
• there were no changes for other individual weight categories.      • 44% of osteoarthritis
For Queensland children, the prevalence of any measured weight       • 40% of chronic kidney disease.
category did not change from 2007–08 to 2017–18.296
                                                                     Table A6 includes the per cent of total burden attributable to
By self-report from 2004 to 2020 adult obesity increased by          overweight and obesity for all conditions as well as early death
32%, while overweight and obesity increased by 15%.281               (YLL) and disability (YLD) burdens.
Differences by sociodemographic characteristics were:
                                                                     Hospital burden: Overweight and obesity accounted for the
• by age—for 18–29 year-olds, obesity increased by 68%               equivalent of 114,400 episodes of care and 305,000 patient days
  compared to 41% among those aged 65 years or older                 in Queensland in 2015–16.82,106 Of Queensland hospitalisations
• by socioeconomic status—obesity in the most disadvantaged          associated with overweight and obesity, the five leading conditions
  areas increased by 59% while no increase was seen for the          were chronic kidney disease, osteoarthritis, coronary heart
  most advantaged areas.                                             disease, type 2 diabetes, and gallbladder and bile duct disease.

By proxy report from 2011 to 2020,281 there was no change in         Trends in burden: Nationally from 2003 to 2015,90 the total burden
the prevalence of child overweight, obesity or overweight and        attributable to overweight and obesity increased by 27%. This was
obesity. There were differences in trends by socioeconomic           driven by increases associated with population growth, population
status with obesity among children from the most disadvantaged       ageing and changes in prevalence of overweight and obesity, and a
areas increasing by 31% while there was no evidence of an            decrease in linked disease burden. When adjusted by age, burden
increase for children in the most advantaged areas.                  due to conditions linked with overweight and obesity decreased
                                                                     by 4.6% from 2003 to 2015 (from 15.6 DALYs to 14.9 DALYs
From 2009 to 2020,281 four HHSs showed an increase in self-          per 1000). For males the DALY rate decreased by 7.8% and for
reported adult obesity (Table 5.2). Other HHSs showed increases      females by 1.0%.90
of a similar magnitude but did not meet criteria for a significant

                                                                                         Report of the Chief Health Officer Queensland        79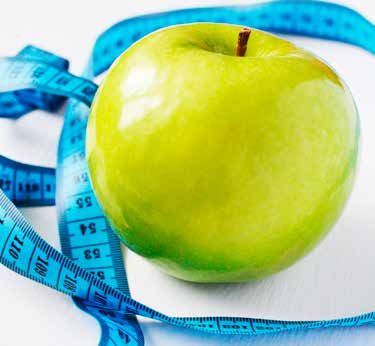
Section five

     Cardiovascular disease burden attributable to overweight            Diet
     and obesity decreased by 8% from 2003 to 2015 largely driven
     by decreases in linked disease burden. Burden for all other         The nutrients required to maintain the human body in good
     disease groups increased by90:                                      health are met by eating a wide variety of healthy foods.
                                                                         Generally, poor health cannot be attributed to a single food or
     • 26% for cancer and other neoplasms
                                                                         nutrient. Consuming foods that are high in nutrients and lower
     • 44% for endocrine disorders                                       in energy (kilojoules) is recommended, as is daily consumption
     • 43% for gastrointestinal disorders                                of foods from the five food groups (vegetables, fruit, grain, lean
                                                                         meat, dairy). This section reports primarily on fruit and vegetable
     • 60% for hearing and vision disorders                              consumption.
     • 88% for kidney and urinary diseases
                                                                         Diet-related health conditions are associated with
     • 68% for musculoskeletal conditions                                environmental, behavioural, biological, societal and genetic
     • 163% for neurological conditions                                  factors. In an optimal diet, the supply of required energy and
                                                                         nutrients is adequate for tissue maintenance, repair and growth.
     • 36% for respiratory diseases.
                                                                         Unfortunately, most Queenslanders do not eat an optimal
     Conditions contributing most to these increases were type 2         diet.299
     diabetes (44% increase), osteoarthritis (79% increase)
                                                                         Combined dietary risks accounted for 7.3% of the total burden
     and chronic kidney disease (88% increase).
                                                                         of disease (DALY in 2015).82 This includes 11% of early death
                                                                         burden (YLL, an estimated 3800 deaths in Queensland)
     Looking forward                                                     and 3.5% of disability burden (YLD) in Australia in 2015.
     Gaining excess body weight is influenced by a complex interplay     The combination of dietary risks were linked to 41 diseases
     of what we eat, our physical activity, mental and emotional         including coronary heart disease, stroke, type 2 diabetes,
     wellbeing, genetics, biology and environments. The design           bowel and lung cancer, and 21 other cancers and neoplasms.
     and structure of our environments, and the resources available
                                                                         In 2008, it was estimated that, nationally, inadequate fruit and
     to us, determine options for making healthier choices.
                                                                         vegetable consumption cost the health sector $206 million, with
     Our environments are inclusive of social, cultural, physical,
                                                                         another $63 million in production losses.300 This translates to
     political and economic conditions.
                                                                         a total of $54 million in Queensland, of which $41 million was
     Structural interventions to address the social and commercial       costs to the health sector, based on Queensland’s percentage
     determinants of overweight and obesity include, among others:       of the population. An estimated $595 million of federal
     housing and food security, support during the early years           government health expenditure and $384 million of state
     of life, community social participation, and improving built        and territory government health expenditure was attributed
     environments to enable physical activity.                           to the low consumption of vegetables in 2015–16.301 This
                                                                         could be reduced by $100 million in 2015–16 dollars with a
     The leadership and stewardship roles of government and              10% increase in average vegetable consumption. Comparable
     the health sector are critical to addressing obesity and this       information for fruit is not available.
     should be driven by inclusive community collaboration. The
     establishment of HWQld and the recent public consultation
     process to inform the development of a national obesity strategy
                                                                         Population characteristics
     are examples of initiatives that aim to address weight issues       In Queensland233:
     in new ways.297                                                     • 68% of children (2020) and 53% of adults (2019) met the
                                                                           recommendation for daily serves of fruit (Figure 5.4)
     Technical notes                                                     • 4.6% of children (2020) and 8.0% of adults (2019) met the
                                                                           recommendation for daily serves of vegetables (Table A7)
     Body mass index (BMI), calculated by dividing a person’s weight
     in kilograms by their height in metres squared, is used to assign   • 38% of adults (2019) consumed three or more serves
     underweight, healthy weight, overweight or obese categories.          of vegetables daily.
     For children, the calculation varies based on the child’s age
     in months.                                                          Sex: Compared to adult males in 2019, adult females were233:
                                                                         • 22% more likely to consume the recommended daily serves
     Measured weight and height are routinely collected in the             of fruit (58% compared to 47%)
     NHS125and NATSIHS71 surveys, most recently in 2017–18 and
                                                                         • more than twice as likely to consume the recommended daily
     2018–19, respectively. BMI based on measured height and
                                                                           serves of vegetables (11% compared to 4.7%)
     weight is more accurate than self-reported height and weight,
     however, it is costly and therefore collected less frequently       • more likely to consume three or more serves of vegetables
     and a third of adults and almost half of children decline to be       per day (46% compared with 31%).
     measured. Trends are based on self-reported weight status
     because it is collected more often and is therefore more useful     Among children in 2020,233 females were 15% more likely
     to assess relative changes over time. Proxy-reported child weight   than males to consume the recommended daily amount of
     status does not reliably distinguish between healthy weight         fruit (73% compared to 64%), with no difference in daily
     and under-weight so combined categories are reported.               recommended vegetable intake.

80   The health of Queenslanders 2020
Our lifestyle
Figure 5.4Adult (2019) and child (2020) recommended daily fruit intake, Queensland233
100
80
60
Percentage
40
20
0
Persons 18+
Males 18+
Females 18+
18–29 years
30–44 years
45–64 years
65+ years
Children 5–17
Boys 5–17
Girls 5–17
5–7 years
8–11 years
12–15 years
16–17 years
Sex Age Sex Age
Adults (2019) Children (2020)
See QSAS for more information
Age: Older adults (65 years and older) were 35% more likely
to meet the recommended serves of fruit than those aged
18–29 years in 2019.233
At a glance
Younger children (5–7 years) were 67% more likely to consume
the recommended daily serves of fruit than older children
Diet
16–17 years in 2020.233 In Queensland in 2020:
For children, there were no age differences in vegetable 2.1 million (53%) adults and 600,000 (68%) children
consumption in 2020. For adults, those aged 65 years or older were meeting recommendations for fruit consumption
were 68% more likely to consume the daily recommended
serves of vegetables than those aged 18–29 years in 2019 320,000 (8.0%) adults and 40,000 (4.6%) children were
(11% compared to 6.3%). There were no age differences for meeting recommendations for vegetable consumption
consumption of three or more vegetable serves daily.
Area socioeconomic status: For adults in 2019 and children
in 2020, the recommended daily consumption of fruit or
vegetables did not differ by socioeconomic status.233
Remoteness: The recommended daily consumption of fruit
or vegetables did not differ by remoteness for children in 2020
or adults in 2019.233
HHS differences: For adults in 2018–19, the prevalence of
recommended daily fruit consumption in North West HHS was
lower than the state average whilst all other HHSs were similar.
Compared to the state average, there were no HHS differences
in recommended daily vegetables consumption. About one-third
or more of adults consumed at least three serves of vegetables
daily across the HHSs in 2018–19.233
For children in 2019–20, the prevalence of recommended daily
fruit consumption in Central West HHS was lower than the state
average. Compared to the state average, there were no HHS
differences for recommended daily vegetable consumption.233
Budd photography
Aboriginal and Torres Strait Islanders: In Queensland in
2018–19,71 38% of Aboriginal and Torres Strait Islander
adults consumed the recommended serves of fruit and 2.7%
the recommended serves of vegetables, similar to Aboriginal
and Torres Strait Islander people nationally (39% and 4.2%
Report of the Chief Health Officer Queensland 81Section five
respectively). Among the jurisdictions, Aboriginal and Torres Burden of combined dietary risks
Strait Islander adults in Queensland ranked fourth highest for For all dietary risks combined, the five conditions with the
recommended daily fruit consumption and fifth highest for daily highest percentage of total burden (DALY) nationally in 2015
vegetable consumption. were82:
Nationally in 2018–19,71 65% of Aboriginal and Torres Strait • 62% of coronary heart disease
Islander children aged 2–17 years consumed the recommended • 41% of type 2 diabetes
serves of fruit and 6.1% the recommended serves of vegetables.
• 34% of stroke
Results for Queensland were not available at the time of writing.
• 22% of bowel cancer
National comparisons: Based on population prevalence,
• 9.6% of hypertensive heart disease.
Queensland adults were similar to Australia overall for
recommended fruit or vegetable consumption in 2017–18.125 Table A8 includes the per cent of total burden attributable to all
Among the jurisdictions, Queensland ranked third highest for dietary risks combined for all conditions as well as early death
recommended daily fruit consumption and joint sixth highest (YLL) and disability (YLD) burdens.
for recommended vegetable consumption.
Hospital burden: The combined impact of dietary risks
accounted for the equivalent of 60,600 hospitalisations and
Trends 197,600 patient days in Queensland in 2015–16.82,106 Of the
Child fruit and vegetable trends can only be calculated from hospitalisations associated with dietary risks, the five leading
2013 to 2020 due to changes in dietary guidelines. For adults, conditions were coronary heart disease, type 2 diabetes, stroke,
changes were more modest, and trends are reported from 2005 chronic kidney disease and bowel cancer.
but are based on five serves of vegetables for all ages.
Trends in burden: In Australia, the total burden attributable to
From 2005 to 2019,281 there was no evidence of change in the all dietary risks decreased by 11% from 2003 to 2015.90 When
prevalence of meeting recommended fruit consumption for adjusted for age, the rate of total burden due to all dietary risks
adults aged 18 years and older. There were, however, differences (from all linked diseases) decreased by 34% from 2003 to 2015
by age group with consumption increasing in younger age (from 19.2 DALYs to 12.8 DALYs per 1000). For males the DALY
groups (by 13% among 18–29 year-olds and 12% among rate decreased by 34% and for females, 35%.
30–44 year-olds) but declining in older age groups (by 8.8%
and 4.8% for 45–64 year-olds and those aged 65 and older Nationally, from 2003 to 2015, burden attributable to all dietary
respectively). risk decreased by 19% for cardiovascular disorders.90 For all
other associated disease groups, the burden increased by:
Adult prevalence of consuming five serves of vegetables daily
• 112% for neurological conditions
declined by 16% from 2005 to 2019.281 While it increased by
41% for 18–29 year-olds, it decreased by up to 35% for those • 101% for kidney and urinary diseases
aged 45 years and older. Consumption also declined by 38% • 46% for respiratory diseases
for those in the most disadvantaged areas while there was no
• 41% for musculoskeletal conditions
evidence of a decline for those in the most advantaged areas.
• 38% for hearing and vision disorders
For children, there was no evidence of change in the prevalence
• 36% for endocrine disorders
of recommended fruit consumption from 2013 to 2020.281
The percentage of children meeting recommended vegetable • 36% for gastrointestinal disorders
consumption, however, declined by 31% and the percentage • 9.4% for cancer and other neoplasms.
consuming three or more serves of vegetables declined by 24%.
Improving children’s diets
A person’s readiness to change is associated with successful
The proportion of children meeting behavioural change outcomes.302,303 One way to measure
recommended vegetable consumption readiness is to ask specific questions to categorise people
has declined by almost a third based on whether they are considering or preparing to make
since 2013. a change, have made short- or longer-term change, or have
no intentions to change for the foreseeable future. In 2019,304
parents participating in the Queensland preventive health
For adult fruit consumption, HHS trends were similar to survey were asked these types of questions about intentions
Queensland overall.281 Daily consumption of five serves of to make their child’s diet healthier. Overall, 39% of parents
vegetables declined in Central Queensland HHS and Darling were currently taking action to make their child’s diet healthier
Downs HHS from 2009 to 2019. Other HHSs showed decreases with 12% having made a recent change while 27% had made
of similar magnitudes but did not meet criteria for significant changes six or more months earlier.304 However, 61% of parents
declines. HHS trends should be interpreted with caution were not taking action with almost half (47%) not considering
because detecting regional change is more difficult, especially any action, 5% considering improvements and 9% preparing
in areas with small population size. to make improvements (Figure 5.5).
82 The health of Queenslanders 2020Our lifestyle
Figure 5.5Parent readiness to make their child’s diet healthier, The “A Better Choice” program promotes and makes available
Queensland, 2019304 healthier food and drink options in Queensland Health facilities
and workplaces, while schools are supported by the “Smart
tentions to change
No in Choices” strategy. State-wide campaigns and programs provide
tem nutritional tips, recipes, gardening ideas and motivational
Pre-con plation
strategies to improve food choices at home, including growing
47 attention on Aboriginal and Torres Strait Islander knowledge
and expertise with respect to the benefits of traditional foods
and methods of food preparation.
Con
e
e
anc
ring to make a chang
temp
Mainten
27
5 Technical notes
Have made a sho
lation
Children Collecting comprehensive nutrition information is challenging
5–17
due to factors such as the ability to accurately recall the types of
foods eaten even in the recent past, difficulty reporting portion
sizes, the variety of ingredients in foods prepared both inside
repa
and outside the home, and differences in the formulations
rt o
12 9 or p of industry-produced foods. Detailed food frequency
lon r
ng
tio
n
questionnaires and food diaries are complex to complete and
gt
ara
eri
Ac
er
tio p
sid
ch Pre n analyse and are typically used in designated nutritional studies.
m
n
an
ge Co
The Australian Health Survey 2011–12 was one such study
and Queensland results have been provided previously.299
This is also planned for the Intergenerational Health and Mental
Health survey that will commence in 2021.305 Studies of more
See the online visualisation for more information general nutrition behaviours typically monitor a select group of
food types. The Queensland preventive health survey focuses
on overall fruit and vegetable consumption and is the primary
There were several factors that increased the likelihood that source of information in this section. Prevalence data were
parents were planning or currently taking steps to make their based on adult self-report in 2019, and proxy report for children
child’s diet healthier.304 The odds of currently taking steps in 2020.
to improve their child’s diet were higher for parents who:
• were concerned about their child’s weight compared to
those who were not concerned (2.6 times higher)
• lived in the most disadvantaged areas compared to those
who lived in the most advantaged areas (62% higher).
The odds of planning to improve their child’s diet in the next
12 months were higher for parents who:
• were concerned about their child’s weight compared to
those who were not concerned (2.8 times higher)
• had children with three or four dietary risk factors (defined as
below recommended fruit or vegetable consumption, daily
soft drink consumption and weekly fast food consumption)
compared to children without these behaviours (2.7 and
2.4 times higher, respectively).
Looking forward
The food system, economic considerations, cultural preferences,
and individual-level factors all contribute to food choice and diet
quality, and these factors are interconnected. Ready access to
fad diets without scientific evidence of efficacy or effectiveness
promoted by celebrity culture increases the complexity.
There are many opportunities for improving our diets through
system reforms and greater access to healthier food and drinks
at government and health facilities, workplaces and schools.
Addressing economic barriers and food security are particularly
important, especially for those experiencing socioeconomic
disadvantage or the challenges of remoteness and
environmental extremes.
Report of the Chief Health Officer Queensland 83Section five
Blood pressure, glucose Population characteristics
and cholesterol In 2017–18,125 blood pressure was collected by physical
measurement. The prevalence of high cholesterol and high
sugar levels in blood and urine was collected by self-reported
High blood pressure is a leading risk factor for total disease
clinical diagnosis of the condition.
burden in people aged 65 years and older and is the leading
individual risk for cardiovascular disease. Although population After accounting for age, 21% of Queensland adults had high
health gains have been achieved through monitoring blood blood pressure in 2017–18.125 This excludes those who were
pressure and cholesterol, there is opportunity for further taking medication that effectively controlled the condition.
improvement considering the high proportion of undiagnosed The prevalence of high blood pressure in Queensland adults
risk in many adults or insufficient treatment to fully reduce risk. in 2017–18 was125:
Improved lifestyles have potential to minimise risk in many
cases, either in combination with medications or alone. • similar to the national age-adjusted prevalence (22%)
This may include reducing salt intake, increasing physical activity • ranked sixth highest compared to other jurisdictions.
and maintaining a healthy weight.
In 2017–18,125 about 5.4% of Queenslanders reported they
High blood pressure, often referred to as hypertension, had been told by a clinician they had high cholesterol and
is prolonged elevation of the blood pressure. High blood their condition was current and long-term. The prevalence
cholesterol, also called dyslipidaemia, is measured by of high cholesterol in Queenslanders in 2017–18 was125:
a blood test and can mean elevated levels of one or more • similar for males and females
blood factors. Thresholds can depend on age, ethnicity and
existing conditions. High blood glucose, clinically referred • increased with age
to as hyperglycaemia, is measured using a blood or urine test. • similar to the national prevalence (6.1%)
High blood pressure, blood cholesterol and blood glucose • ranked sixth highest compared to other jurisdictions.
levels are metabolic risk factors and are associated with the
In 2017–18,125 about 0.3% of Queenslanders reported they had
development of cardiovascular disease, diabetes and kidney
been told by a clinician they had high sugar levels in their blood
diseases.
or urine. The prevalence of high sugar levels in Queenslanders
The health impacts of high blood pressure include 10 in 2017–18 was:
cardiovascular diseases such as coronary heart disease and • similar for males and females
stroke, chronic kidney disease and dementia.82 High cholesterol • similar to the national prevalence (0.4%).
is linked to coronary heart disease and stroke.82 The health
impacts of high blood plasma glucose include type 1 diabetes,
type 2 diabetes and other diabetes, chronic kidney disease, Burden of disease
cardiovascular diseases such as coronary heart disease, For high blood pressure, the five conditions with the highest
dementia, seven cancers and other neoplasms, and hearing percentage of total burden (DALY) nationally in 2015 were82:
and vision disorders such as glaucoma.82
• 65% of hypertensive heart disease
Nationally, high blood pressure accounted for 5.8% of the total • 43% of coronary heart disease
health burden (DALY) in 2015.82 This includes 9.1% of early
• 41% of stroke
deaths (YLL), an estimated 3700 deaths in Queensland) and
2.4% of the disability burden (YLD). High cholesterol accounted • 38% of chronic kidney disease
for 3.0% of the total health burden (DALY) in 2015,82 comprising • 32% of atrial fibrillation and flutter.
4.9% of early deaths (YLL), an estimated 1600 deaths in
Queensland) and 1.1% of the disability burden (YLD). High Nationally, high blood plasma glucose accounted for 100%
blood plasma glucose accounted for 4.7% of the total health of the total burden (DALY) of all diabetes conditions and 60%
burden (% DALY) in 2015 which included 5.4% of early deaths of chronic kidney disease in 2015.82 High cholesterol accounted
(YLL), an estimated 1900 deaths in Queensland) and 4.0% for 37% of coronary heart disease burden and 15% of stroke
of the disability burden (YLD).82 burden in 2015.
Nationally, the estimated economic burden attributable Tables A9–A11 include the per cent of total burden attributable
to high cholesterol was $4.0 billion in 2017–18.306 to high blood pressure, blood plasma glucose and high
cholesterol for all linked conditions as well as early death (YLL)
and disability (YLD) burdens.
84 The health of Queenslanders 2020Our lifestyle
Hospital burden: The combined impact of high blood pressure Looking forward
accounted for the equivalent of 70,800 hospitalisations and As the data above show, substantial inroads are being made
208,900 patient days in Queensland in 2015–16. High blood into reducing the burden of disease attributable to hypertension,
plasma glucose accounted for 80,700 hospitalisations and high blood cholesterol and high blood glucose. Further reduction
168,400 patient days, and high cholesterol accounted for in the prevalence of these conditions will occur concurrently with
18,100 hospitalisations and 67,100 patient days over the population-based efforts to further reduce smoking, improve our
same period.82,106 diets, reduce overweight and obesity, increase physical activity
and improve mental health, particularly stress. Intergenerational
Of Queensland hospitalisations associated with high blood
change is required given pre-conception and antenatal
pressure, the five leading conditions were chronic kidney
exposures that increase the risk of an individual developing
disease, coronary heart disease, other cardiovascular diseases,
these conditions from birth.
stroke, and atrial fibrillation and flutter. The top five leading
conditions for hospitalisations associated with high blood As genomics and precision medicine develops there will be
plasma glucose were chronic kidney disease, type 2 diabetes, new frontiers in screening, diagnosis and management which
type 1 diabetes, coronary heart disease and bowel cancer and will contribute to reducing the downstream effects these
for high cholesterol were coronary heart disease and stroke. conditions have on long-term health and the burden of disease.
Trends in burden: Nationally, from 2003 to 2015, the total
burden attributable to high blood pressure decreased by 19%.90
This net decrease was driven by decreases in linked disease
burden and exposure to high blood pressure and increases in
population growth and population ageing. When adjusted by
age, burden due to conditions linked to high blood pressure
decreased by 41% from 2003 to 2015 (from 16.7 DALYs to
9.8 DALYs per 1000 population). For males the DALY rate
decreased by 41% and for females by 42%.90
Cardiovascular disease burden attributable to high blood
pressure decreased by 23% from 2003 to 2015 largely driven
by decreases in linked disease burden.90 Burden for neurological At a glance
conditions and kidney and urinary diseases increased (80% and
Blood pressure, glucose and cholesterol
54% respectively).
Based on 2017–18 data, in 2020 an estimated:
Nationally, the total burden attributable to high blood plasma
glucose decreased by 7.9% from 2011 to 2015.82 When 870,000 (21%) Queensland adults had measured
adjusted by age, burden due to conditions linked to high blood high blood pressure
plasma glucose decreased by 2.4% from 2011 to 2015 (from
8.4 DALYs to 8.2 DALYs per 1000 population). For males the 280,000 (5.4%) Queenslanders of all ages had been told
DALY rate decreased by 1.0% and for females by 5.1%. by a doctor they currently have high cholesterol
Cardiovascular disease burden attributable to high blood
plasma glucose decreased by 6.0% from 2011 to 2015.82 21,000 Queenslanders of all ages had been told they had
Burden for all other disease groups increased: high sugar levels in the blood or urine.
• 37% for kidney and urinary diseases
• 36% for neurological conditions
• 23% for hearing and vision disorders
• 12% for cancer and other neoplasms
• 3.0% for endocrine disorders.
In Australia, the total burden attributable to high cholesterol
decreased by 32% from 2003 to 2015.90 When adjusted by
age, burden due to conditions linked to high blood pressure
decreased by 49% from 2003 to 2015 (from 10.3 DALYs to 5.2
DALYs per 1000 population).90 For males the DALY rate decreased
by 48% and for females by 54%. Nationally, from 2003 to 2015,
the burden attributable to high cholesterol decreased by 32%
for coronary heart disease and 33% for stroke.90
Budd photography
Report of the Chief Health Officer Queensland 85You can also read