Population and Major Land Use in the Great Barrier Reef Catchment Area: Spatial and Temporal Trends - December 2001
←
→
Page content transcription
If your browser does not render page correctly, please read the page content below
Population and Major Land Use in the Great Barrier
              Reef Catchment Area:
           Spatial and Temporal Trends

                   December 2001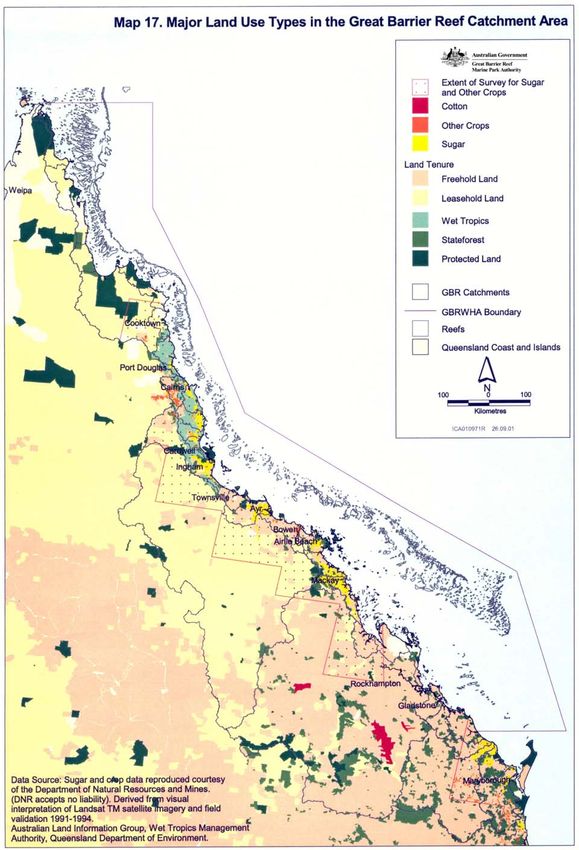
©Great Barrier Reef Marine Park Authority 2001

ISBN 1 876945 09 5 (CD)
ISBN 1 876945 10 9 (Web Version)

Published in December 2001 by the Great Barrier Reef Marine Park Authority
This work is copyright. Apart from any use as permitted under the Copyright Act 1968, no part may be reproduced by any
process without prior written permission from the Great Barrier Reef Marine Park Authority. Requests and inquiries
concerning reproduction and rights should be addressed to the Director, Communication and Education Coordination Group,
Great Barrier Reef Marine Park Authority, PO Box 1379, Townsville Qld 4810.

The opinions expressed in this document are not necessarily those of the Great Barrier Reef Marine Park Authority. Accuracy
in calculations, figures, tables, names, quotations, references, etc. is the complete responsibility of the authors.

National Library of Australia Cataloguing-in-Publication data:

Population and major land use in the Great Barrier Reef catchment area: spatial and temporal trends.

Bibliography.
ISBN 1 876945 09 5 (CD)

ISBN 1 876945 10 9 (Web Version)

1. Land use – Queensland – Great Barrier Reef. 2.
Agriculture – Queensland – Great Barrier Reef Region. 3.
Coastal ecology – Queensland – Great Barrier Reef Region.
4. Great Barrier Reef Region (Qld.) – Population –
Environmental aspects. 5. Great Barrier Reef Region (Qld.).
I. Gilbert, Maree. II. Great Barrier Reef Marine Park
Authority (Australia).

333.91709943

Photographic credits

Great Barrier Reef Marine Park Authority Library

Contributing authors

Maree Gilbert and Jon Brodie.

Great Barrier Reef Marine Park Authority
PO Box 1379
Townsville QLD 4810
Telephone: (07) 4750 0700
Facsimile: (07) 4772 6093
Web: www.gbrmpa.gov.au
E-mail: info@gbrmpa.gov.au
Executive Summary
The purpose of this report was to gather geographical and statistical information on the
Great Barrier Reef Catchment, the majority of which was compiled in 1998. This information
is intended to support future studies on predicting the impact of land-based activities on the
Great Barrier Reef.

The Great Barrier Reef extends over 2 000 km along the north-eastern coast of Australia. It is
the largest reef system in the world, providing habitat for a diversity of marine life. The Great
Barrier Reef Catchment Area lies adjacent to the Great Barrier Reef World Heritage Area and
comprises approximately 25 % of the land area of Queensland. Forty drainage basins comprise
the Great Barrier Reef Catchment Area which drain directly into the Great Barrier Reef lagoon.
Land modification associated with increased population, urban development and agricultural
expansion has transformed the Great Barrier Reef Catchment Area. Run-off from these land-
based activities has reduced the quality of water flowing into the Great Barrier Reef lagoon and
is of great concern to researchers and managers of the Great Barrier Reef Marine Park
Authority.

Climate within the Great Barrier Reef Catchment Area ranges from tropical to subtropical, with
rainfall distribution being highly variable throughout the area. Coastal areas receive
considerably higher rainfall than the uplands, hence more dense settlement and intensive
agricultural expansion has been concentrated in the coastal zone, particularly in those basins
receiving higher rainfall. The Great Barrier Reef Catchment Area has some of the most
topographically diverse terrain on the Australian continent.

Changes in land cover since European settlement (200 years ago), has extensively modified the
vegetation communities within the Great Barrier Reef Catchment Area. Native vegetation
clearance in Queensland has historically been high, and continues at levels far in excess of
other Australian States. The largest land-clearing event has occurred in the brigalow
biogeographic region within the Great Barrier Reef Catchment Area. Brigalow communities
were estimated to have covered 11 % and 30 % of the Burdekin and Fitzroy basin respectively,
but now only cover 2 % and 1 % of these basins. Tropical rainforest vegetation along the
accessible coastal river plains have also been cleared for settlement and agriculture.
Additionally, the expansion of agriculture and urbanisation has resulted in the loss of wetland
vegetation. The estimated area of freshwater wetlands that remain in the Great Barrier Reef
Catchment Area is 18 408 km2. Further threats to wetlands exist, with the rise in use of ponded
pastures for grazing, particularly in the central basins of the Great Barrier Reef Catchment
Area. The greatest source of sediment and nutrients is derived from the clearing and cultivation
associated with agricultural land uses.

Queensland supported a large proportion of Australia’s pre-settlement indigenous population.
Following settlement, the indigenous population in Queensland declined and European
population growth was rapid, with a quarter of a million persons in 1883 to 3 million persons in
1992. Queensland has 18.4 % of Australia’s total population. Queensland’s population is
urbanised and concentrated along the eastern coastal catchments. The concentration of
population and infrastructure within the coastal zone impacts on coastal and reef ecosystems.

                                                i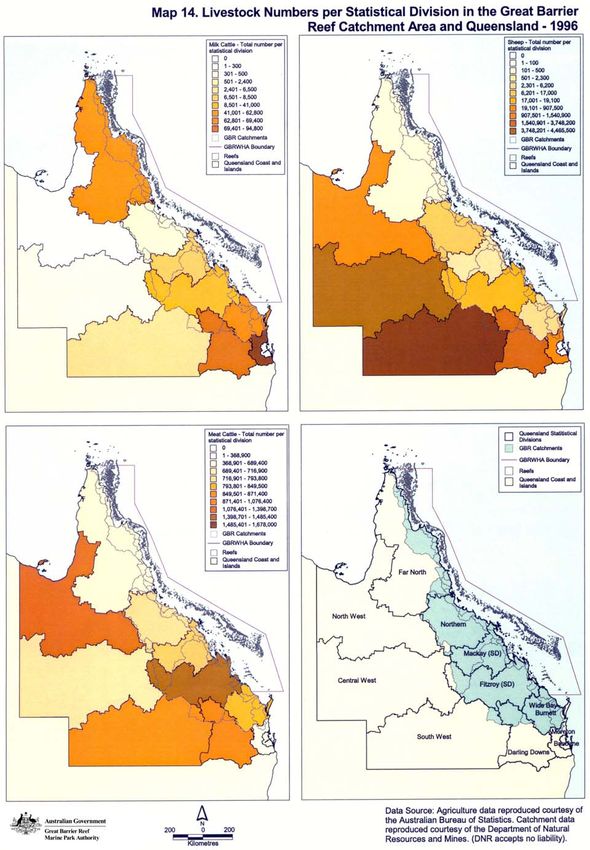
The soils of the catchment area are typically of low fertility and exhibit poor soil structure,
which has resulted in extensive application of fertiliser and conditioner to maintain agricultural
productivity. Since the 1960’s, there has been a dramatic increase in the application of
nitrogenous and phosphate fertiliser use in the Great Barrier Reef Catchment Area. Over half of
the total volume of nitrogen and phosphorus fertiliser used in agriculture within the Great
Barrier Reef Catchment Area is applied to sugarcane. The area of sugarcane in the Great
Barrier Reef Catchment Area since 1930 has increased substantially, and in 1995 was over 360
000 hectares.

Grazing occurs in all basins in the Great Barrier Reef Catchment Area to varying degrees.
Approximately 4 900 000 cattle are found in the Great Barrier Reef Catchment Area. The two
dominant basins in terms of area for grazing of cattle within the catchment are the Burdekin-
Haughton and Fitzroy.

Mineral production is the highest source of export revenue for Queensland. Coal production in
Queensland has increased rapidly since the 1960’s, from 2.5 million tonnes to just under 100
million tonnes per year. Five statistical divisions within the Great Barrier Reef Catchment have
produced 96 % of Queenslands black coal. Port development has been rapid within the Great
Barrier Reef Catchment Area and associated with the boom in mineral production. Some of the
major ports within the Great Barrier Reef Catchment Area have recorded over 500 vessel
arrivals. Major shipping traffic and heavy use by smaller commercial and recreational vessels
within the Great Barrier Reef lagoon threaten water quality through potential for shipping
accidents and oil spills. Between 1987 and 1997 approximately 186 maritime incidents were
reported within the Great Barrier Reef World Heritage Area.

In 1997 there were 123 official weirs and dams within the Great Barrier Reef Catchment in
total which have been constructed for the increases in population and agricultural expansion.
The dams have a capacity (7 million mega litres) which can potentially capture approximately
10 % of the annual run-off from the Great Barrier Reef catchment. The Burdekin Falls Dam is
currently the largest dam in the Great Barrier Reef Catchment Area.

The high variability of Queenslands rainfall and widespread implementation of water
regulation schemes has produced a number of irrigation areas for agriculture within the Great
Barrier Reef Catchment Area. The area of irrigated agriculture in 1990 was 832 km2 and total
water usage delivered to farms was 343 790 mega litres year. Though not all sugarcane was
irrigated it was the largest irrigated crop by area, particularly in the Wide-Bay-Burnett and
Northern (particularly in the Burdekin) Statistical Divisions.

There is potential for continuing land-use change of coastal environments and downstream
effects from catchment modification on the Great Barrier Reef lagoon. Increased areas of
cropping lands, particularly those using high fertiliser applications, may impact the Great
Barrier Reef through higher sediment and nutrient run-off levels. Such water quality
modification threatens the values of the Great Barrier Reef World Heritage Area.

                                                ii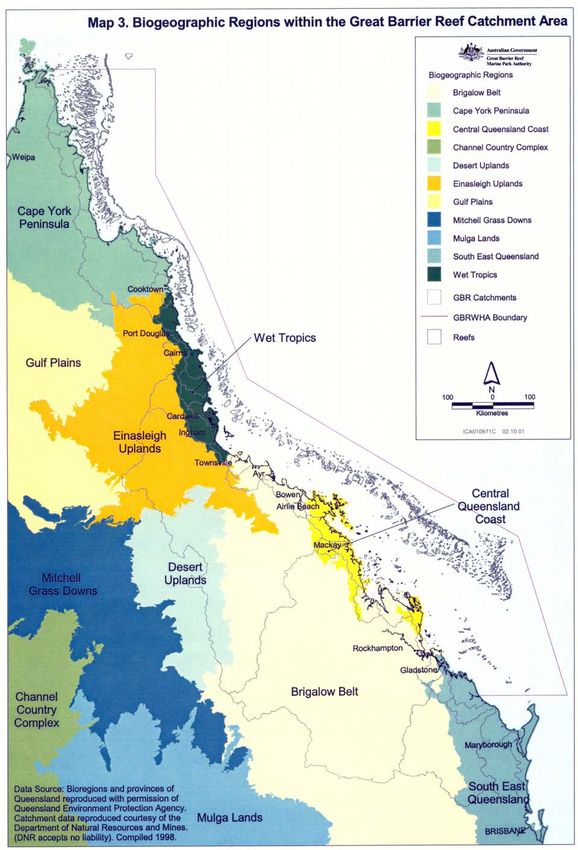
TABLE OF CONTENTS
EXECUTIVE SUMMARY ................................................................................................................................I/II
TABLE OF CONTENTS ...................................................................................................................................III
LIST OF FIGURES .............................................................................................................................................IV
LIST OF TABLES ...........................................................................................................................................IV/V
LIST OF MAPS..................................................................................................................................................... V
1. INTRODUCTION............................................................................................................................................. 1
1.1. GREAT BARRIER REEF .................................................................................................................................. 1
1.2. THE SCOPE OF THE REPORT ........................................................................................................................... 1
2. THE GREAT BARRIER REEF LAGOON AND WATER QUALITY ...................................................... 2
3. THE GREAT BARRIER REEF CATCHMENT AREA .............................................................................. 4
3.1 GEOMORPHOLOGY AND SOILS ....................................................................................................................... 4
3.2 CLIMATE AND RUNOFF .................................................................................................................................. 6
4. PRE EUROPEAN-SETTLEMENT VEGETATION .................................................................................. 10
4.1 LAND CLEARING WITHIN THE GREAT BARRIER REEF CATCHMENT AREA .................................................... 11
4.1.1. Vegetation Clearing and Land Tenure................................................................................................ 12
4.1.2. National Estate and State Forest ........................................................................................................ 15
4.2. HISTORY OF MAJOR VEGETATION DISTURBANCE ....................................................................................... 18
4.2.1. Brigalow Vegetation ........................................................................................................................... 18
4.2.2. Tropical Rainforest Vegetation........................................................................................................... 19
4.2.3. Wetland Vegetation ............................................................................................................................. 21
5. POPULATION OF THE GREAT BARRIER REEF CATCHMENT AREA .......................................... 22
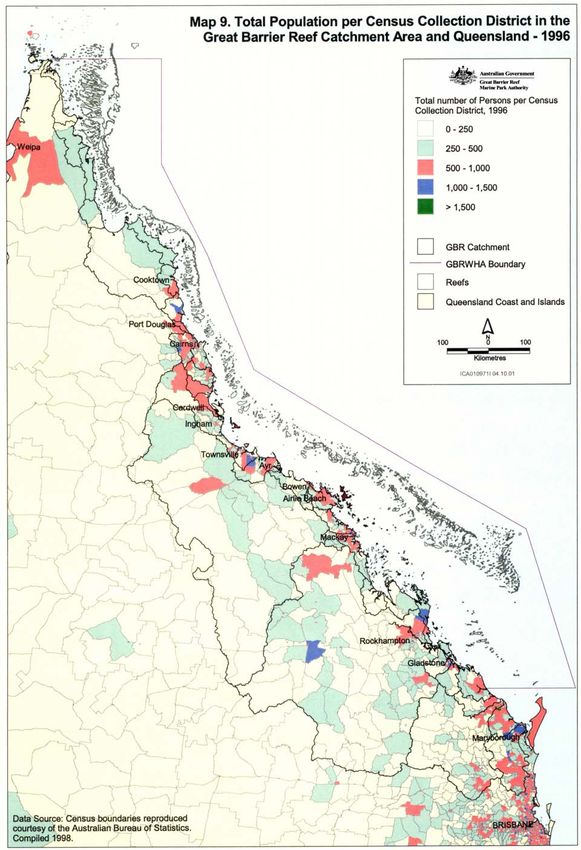
5.1. CENSUS DATA............................................................................................................................................. 22
5.2. HISTORIC POPULATION AND SETTLEMENT PATTERNS................................................................................. 23
5.3. POPULATION, GROWTH AND PROJECTIONS ................................................................................................. 25
5.4. ABORIGINAL AND TORRES STRAIT ISLANDER POPULATION ........................................................................ 27
5.5. SPATIAL DISTRIBUTION OF POPULATION .................................................................................................... 28
5.5.1. The Coastal Zone ................................................................................................................................. 28
5.5.2. Impacts of Population Growth in the Coastal Zone ............................................................................ 28
6. PORT DEVELOPMENT ............................................................................................................................... 29
7. AGRICULTURE............................................................................................................................................. 30
7.1. SOIL FERTILITY ........................................................................................................................................... 31
7.1.1. Acid Sulfate Soils ................................................................................................................................ 34
7.2. SUGAR INDUSTRY ....................................................................................................................................... 34
7.2.1. Green Cane Harvesting.................................................................................................................. 37
7.3. CATTLE INDUSTRY ...................................................................................................................................... 37
7.4. FORESTRY ................................................................................................................................................... 40
7.5. MINING ....................................................................................................................................................... 41
8. WATER RESOURCES .................................................................................................................................. 43
8.1. DAMS AND WEIRS....................................................................................................................................... 43
8.2 IRRIGATION .................................................................................................................................................. 45
9. DISCUSSION .................................................................................................................................................. 46
10. ACKNOWLEDGMENTS ............................................................................................................................. 48
11. REFERENCES.............................................................................................................................................. 48
iii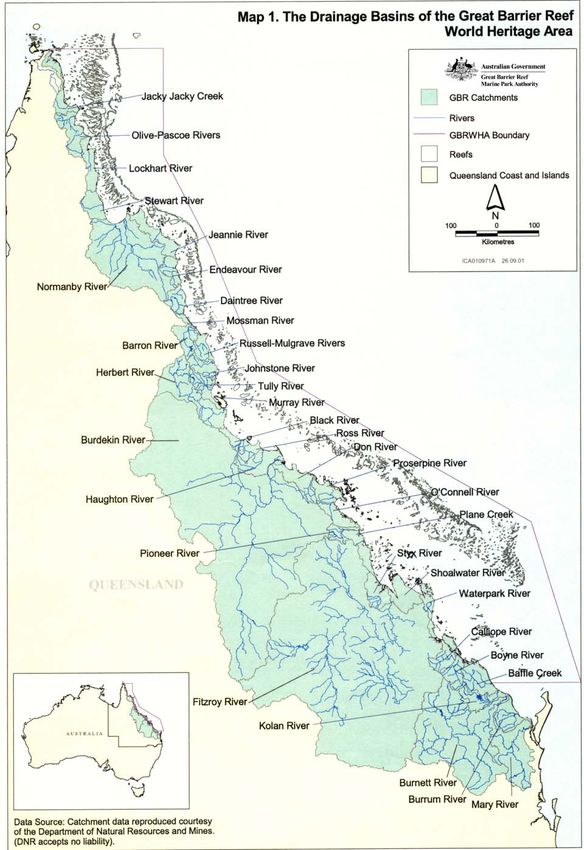
List of Figures
FIGURE 1. LEVELS OF NITROGEN EXPORTED FROM POINT AND DIFFUSE SOURCES IN THE GREAT BARRIER REEF
    CATCHMENT AREA. .......................................................................................................................................... 4
FIGURE 2. MEAN RAINFALL PER MONTH, ROCKHAMPTON AND CAIRNS 1958-1992.................................................. 7
FIGURE 3. ANNUAL AND SEASONAL RAINFALL, CAIRNS 1958-1992. ........................................................................ 8
FIGURE 4. ANNUAL AND SEASONAL RAINFALL, ROCKHAMPTON 1958-1992. ........................................................... 8
FIGURE 5. LAND COVER DISTURBANCE BY TENURE TYPES FOR THE INTENSIVE LAND USE ZONE (ILZ), AUSTRALIA.13
FIGURE 6. POTENTIAL FOR FUTURE DISTURBANCE BASED ON TENURE TYPE FOR THE MAJOR VEGETATION
    COMMUNITIES IN THE GREAT BARRIER REEF CATCHMENT AREA. .................................................................. 14
FIGURE 7. TOTAL POPULATION WITHIN THE GREAT BARRIER REEF CATCHMENT AREA 1901 TO 1991. ................ 24
FIGURE 8. TOTAL PHOSPHORUS FERTILISER APPLIED (AS TONNES P) ANNUALLY IN THE GREAT BARRIER REEF
    CATCHMENT AREA 1910-1990. ...................................................................................................................... 32
FIGURE 9. TOTAL NITROGEN FERTILISER (AS TONNES N) APPLIED ANNUALLY IN THE GREAT BARRIER REEF
    CATCHMENT AREA 1910-1990. ...................................................................................................................... 32
FIGURE 10. FERTILISER USAGE FOR MAJOR AGRICULTURE TYPES FOR THE STATISTICAL DIVISIONS OF THE GREAT
    BARRIER REEF CATCHMENT AREA 1990. ....................................................................................................... 33
FIGURE 11. SOIL CONDITIONER (IE. LIME, GYPSUM) USE PER STATISTICAL DIVISION 1996. .................................... 34
FIGURE 12. TOTAL AREA OF SUGARCANE IN THE GREAT BARRIER REEF CATCHMENT AREA SINCE 1930............... 35
FIGURE 13. GREEN CANE HARVEST BY AREA PER REGION IN QUEENSLAND. .......................................................... 37
FIGURE 14. TOTAL MEAT CATTLE IN THE GREAT BARRIER REEF CATCHMENT AREA AND QUEENSLAND............... 38
FIGURE 15. TOTAL LIVESTOCK IN THE FITZROY STATISTICAL DIVISION 1955 - 1996. ............................................ 40
FIGURE 16. HISTORICAL SAWN TIMBER HARVEST FOR QUEENSLAND. ................................................................... 41
FIGURE 17. HISTORIC GOLD AND COAL PRODUCTION FOR QUEENSLAND 1860-1995. ............................................ 42
FIGURE 18. DAMS AND WEIRS IN THE GREAT BARRIER REEF CATCHMENT AREA – TOTAL CUMULATIVE POTENTIAL
    CAPACITY OVER TIME...................................................................................................................................... 45
FIGURE 19. ANNUAL AVERAGE AREA IRRIGATED AND TOTAL WATER USAGE FOR THE MAJOR IRRIGATION AREAS
    WITHIN THE GREAT BARRIER REEF CATCHMENT AREA (1981/2 TO 1990/1). ................................................. 46
FIGURE 20. IRRIGATION WATER VOLUMES (MEGA LITRES) ON VARIOUS CROP TYPES PER STATISTICAL DIVISION
    1993/4. ........................................................................................................................................................... 46

List of Tables
TABLE 1. AREA OF DRAINAGE BASINS WITHIN THE GREAT BARRIER REEF CATCHMENT AREA. ............................... 5
TABLE 2. MEAN ANNUAL RAINFALL AND RUNOFF FOR IN THE GREAT BARRIER REEF CATCHMENT AREA. ............. 9
TABLE 3. BIOGEOGRAPHIC REGIONS – AREA WITHIN THE GREAT BARRIER REEF CATCHMENT AREA. .................. 10
TABLE 4. TOTAL AREA OF NATIONAL ESTATE (NE) PER BASIN WITHIN THE GREAT BARRIER REEF CATCHMENT
    AREA (KM2). ................................................................................................................................................... 16
TABLE 5. AREA OF STATE FOREST (SF) WITHIN THE BASINS OF THE GREAT BARRIER REEF CATCHMENT AREA... 17
TABLE 6. ESTIMATED AREA OF FRESHWATER WETLANDS IN THE GREAT BARRIER REEF CATCHMENT AREA. ....... 22
TABLE 7. CHANGE IN WETLAND VEGETATION AREA IN THE JOHNSTONE BASIN 1951-1993. .................................. 22
TABLE 8. MAIN SOURCES OF POPULATION GROWTH IN QUEENSLAND SINCE SETTLEMENT..................................... 25
TABLE 9. DOMESTIC VISITOR NIGHTS (A) TO REGIONS OF THE GREAT BARRIER REEF CATCHMENT AREA. ........... 25
TABLE 10. TOTAL ENUMERATED AND ESTIMATED RESIDENT POPULATION PER STATISTICAL DIVISION IN THE GREAT
    BARRIER REEF CATCHMENT AREA 1996. ....................................................................................................... 26
TABLE 11. POPULATION AND GROWTH IN GREAT BARRIER REEF STATISTICAL DIVISIONS 30 JUNE 1996. ............. 26
TABLE 12. POPULATION AND GROWTH IN STATISTICAL DISTRICTS, GREAT BARRIER REEF CATCHMENT AREA AT ...
    30 JUNE 1991, 1996........................................................................................................................................ 27
TABLE 13. ESTIMATED RESIDENT INDIGENOUS POPULATION PER ATSIC REGION AS AT 30 JUNE 1996. ................. 27
TABLE 14. ESTIMATED POPULATION IN COASTAL AREAS OF QUEENSLAND - 1997................................................. 28
TABLE 15. SHIPPING ARRIVALS AND PILOTED ARRIVALS BY PORTS IN THE GREAT BARRIER REEF WORLD HERITAGE
    AREA 1985/6 TO 1994/5. ................................................................................................................................ 30
TABLE 16. TOTAL NUMBER OF ESTABLISHMENTS GROWING CROPS PER STATISTICAL DIVISION IN THE GREAT
    BARRIER REEF CATCHMENT AREA 1996. ....................................................................................................... 31
TABLE 17. BASINS RECORDING THE HIGHEST PROPORTION OF PHOSPHORUS USAGE (TONNES) IN THE GREAT
    BARRIER REEF CATCHMENT AREA IN 1990. PROPORTION OF PHOSPHORUS APPLIED TO SELECTED AGRICULTURE
    TYPES (%). ...................................................................................................................................................... 33
TABLE 18. BASINS RECORDING THE HIGHEST PROPORTION OF NITROGEN USAGE (TONNES) IN THE GREAT BARRIER
    REEF CATCHMENT AREA IN 1990. PROPORTION OF NITROGEN APPLIED TO SOME AGRICULTURE TYPES (%). . 33
TABLE 19: NUMBER OF SUGAR MILLS IN AUSTRALIA AND QUEENSLAND, 1864-1915. ........................................... 36
TABLE 20: AVERAGE OUTPUT PER MILL (TONS OF SUGAR) IN QUEENSLAND FOR THE PERIOD 1870-1915. ............. 36

                                                                                   iv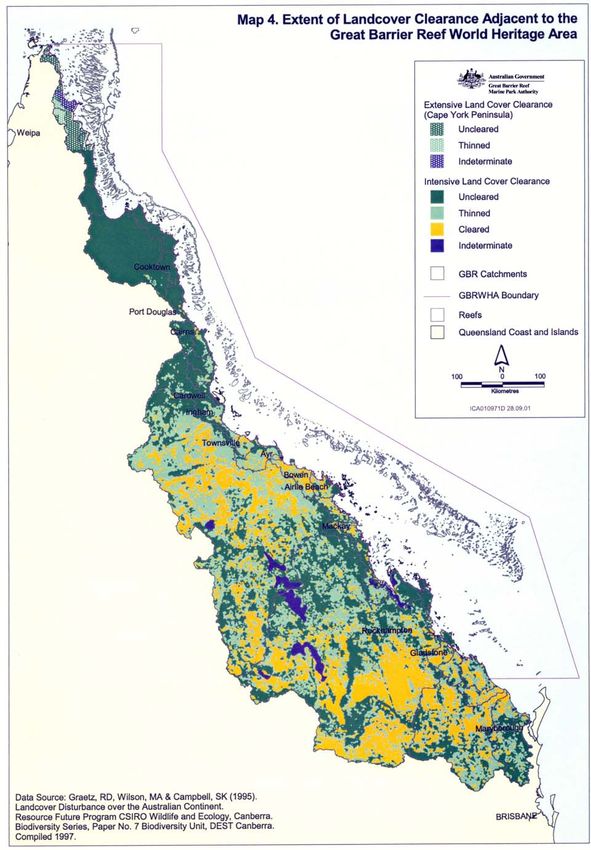
TABLE 21. AREA OF LAND UNDER GRAZING IN THE GREAT BARRIER REEF CATCHMENT AREA (JUNE 1991). ....... 39
TABLE 22. TIMBER INDUSTRY PRODUCTION FOR 1938-9. ..................................................................................... 41
TABLE 23. TOTAL CAPACITY OF DAMS AND WEIRS WITHIN EACH BASIN IN THE GREAT BARRIER REEF CATCHMENT
AREA. ............................................................................................................................................................. 44
TABLE 24. MAJOR DAMS IN THE GREAT BARRIER REEF CATCHMENT AREA – LOCATION BY STREAM AND BASIN,
AND TOTAL CAPACITY..................................................................................................................................... 44
List of Maps
MAP 1. THE DRAINAGE BASINS OF THE GREAT BARRIER REEF WORLD HERITAGE AREA.
MAP 2. GEOLOGY OF QUEENSLAND AND THE GREAT BARRIER REEF CATCHMENT AREA.
MAP 3. BIOGEOGRAPHIC REGIONS WITHIN THE GREAT BARRIER REEF CATCHMENT AREA.
MAP 4. EXTENT OF LANDCOVER CLEARANCE ADJACENT TO THE GREAT BARRIER REEF WORLD
HERITAGE AREA.
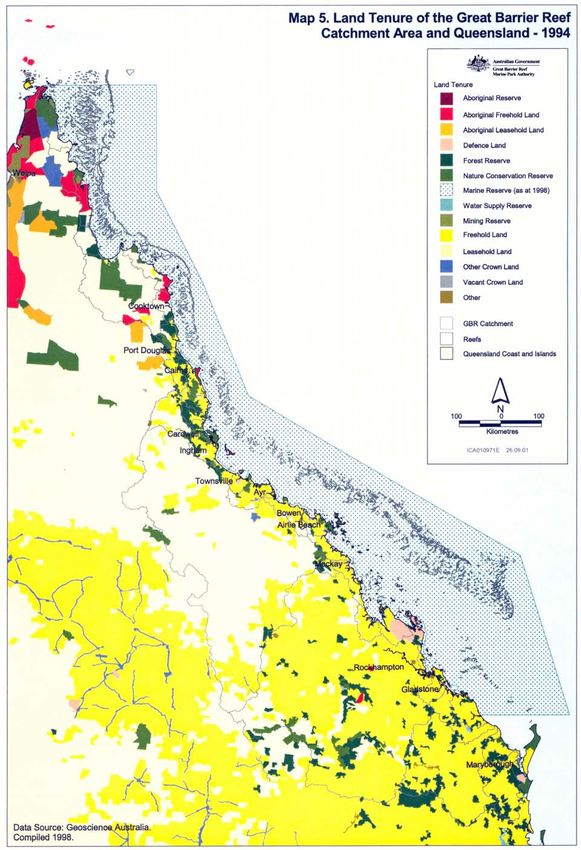
MAP 5. LAND TENURE OF THE GREAT BARRIER REEF CATCHMENT AREA AND QUEENSLAND –
1994.
MAP 6. NATIONAL ESTATE WITHIN THE GREAT BARRIER REEF CATCHMENT AREA AND
QUEENSLAND -1996.
MAP 7. STATE FORESTS AND TIMBER RESERVES OF THE GREAT BARRIER REEF CATCHMENT
AREA AND QUEENSLAND -1996.
MAP 8. QUEENSLAND GEOGRAPHIC AREAS.
MAP 9. TOTAL POPULATION PER CENSUS COLLECTION DISTRICT IN THE GREAT BARRIER REEF
CATCHMENT AREA AND QUEENSLAND -1996.
MAP 10. MAJOR URBAN CENTRES AND LOCALITIES IN THE GREAT BARRIER REEF CATCHMENT
AREA AND QUEENSLAND -1996.
MAP 11. MARITIME INCIDENTS REPORTED IN THE GREAT BARRIER REEF WORLD HERITAGE
AREA - 1987 TO 1997.
MAP 12. MAJOR PORTS, SHIPPING ROUTES AND ARRIVALS IN THE GREAT BARRIER REEF WORLD
HERITAGE AREA – 1994 TO1995.
MAP 13. MAJOR SUGAR LANDS IN THE GREAT BARRIER REEF CATCHMENT AREA 1991-1994.
MAP 14. LIVESTOCK NUMBERS PER STATISTICAL DIVISION IN THE GREAT BARRIER REEF
CATCHMENT AREA AND QUEENSLAND -1996.
MAP 15. DAMS AND WEIRS IN THE GREAT BARRIER REEF CATCHMENT AREA AND QUEENSLAND
- 1997.
MAP 16. MAJOR IRRIGATION AREAS OF THE GREAT BARRIER REEF CATCHMENT AREA.
MAP 17. MAJOR LAND USE OF THE GREAT BARRIER REEF CATCHMENT AREA.
References for Spatial Data ……………………………………………………………………54
v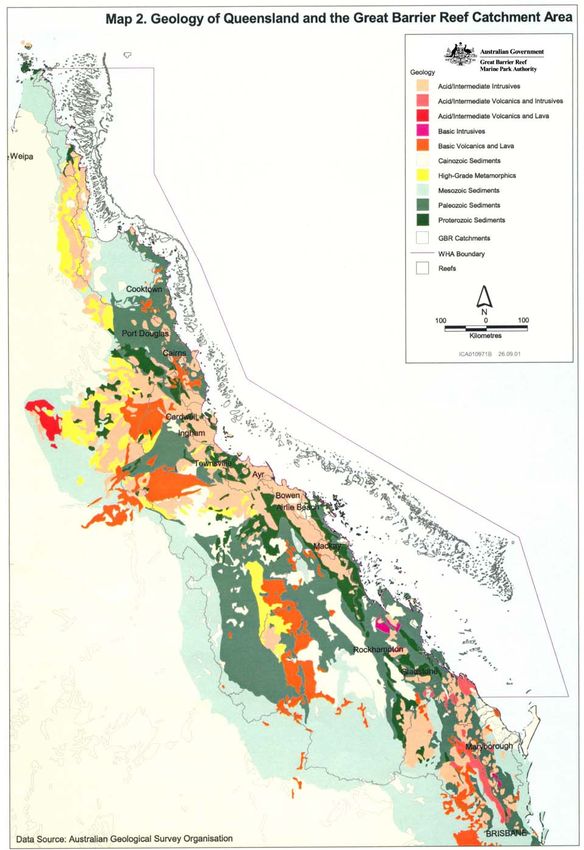
1. Introduction

1.1. Great Barrier Reef
The Great Barrier Reef is the largest coral reef ecosystem in the world, with over 2900 reefs
and 900 islands (including coral cays). It extends 2 000 km along the Queensland coast from
the tip of Cape York Peninsula (9˚00’S, 144˚00’E) to near Bundaberg (24˚30’S; 154˚00’E)
(MAP 1). The current reef morphology was initiated during the Holocene (8 000 – 10 000 years
before present) following post-glacial (Pleistocene) sea level rise (18 000 to 10 000 years
before present) (Hopley, 1982). During this evolution, the North East Australian Drainage
Division, (which discharges into the Great Barrier Reef lagoon), was utilised by indigenous
Australians under a fairly consistent resource extraction regime. Since the arrival of European
settlers (~200 years before present), the catchment area has experienced a significant
transformation as a result of increased human population and extensive modifications to land
use practices.

Globally, semi-enclosed large marine ecosystems (such as the Great Barrier Reef (GBR)
lagoon) are threatened by increases in anthropogenic impacts due to low flushing rates of
lagoon water (Sherman et al. 1993; Konovalov 1999). Deterioration of water quality within the
Great Barrier Reef lagoon, as a result of downstream effects of catchment modification, is of
concern to researchers and managers of the Great Barrier Reef World Heritage Area (Hunter et
al. 1996, Rayment and Neil, 1996; Wachenfeld et al. 1998; Zann, 1995). For several decades,
water quality research has focused on quantifying the rate and source of terrestrial pollutants
entering the waters of the GBR lagoon (Wasson, 1996).

1.2. The scope of the report
This report originated from an identified need to expand the information base available to water
quality researchers in terms of the spatial and temporal extent of anthropogenic disturbance
within the Great Barrier Reef Catchment Area. A Geographic Information System (GIS) of
existing historic and spatial datasets has been compiled to demonstrate trends in population and
major land use with a view to providing a framework for current water quality research and in
monitoring the Great Barrier Reef lagoon. Elsewhere, GIS has been used to analyse patterns of
urbanisation and land use change within the catchments of large semi-enclosed marine
ecosystems. The report provides a background to the history of modification of the Great
Barrier Reef Catchment based on existing available datasets. The report is structured to give an
initial description of the Great Barrier Reef lagoon and catchment area, followed by a
description of the main types of catchment modification since settlement.

It is beyond the scope of this report to extrapolate any identified catchment modifications to
changes in water quality within the Great Barrier Reef lagoon over space and time. Inherent
errors associated with time series data (due to shifts in statutory and census boundaries and data
collection methods in particular), have not been dealt with in detail, but these should not
significantly detract from the overall trends identified. In some cases, data for the Great Barrier
Reef Catchment Area could not be extracted, so time series data for the state of Queensland has
been included.

Note that the data that forms the basis of this report is continually being updated in the Great
Barrier Reef Marine Park Authority (GBRMPA) GIS library. The data is compiled from
government and non-government sources and has been independently verified. It is intended
that new data sets, information and analysis will be added to the GBRMPA databases on a
continual basis, to establish and maintain a summary of the geographical and statistical

                                                 1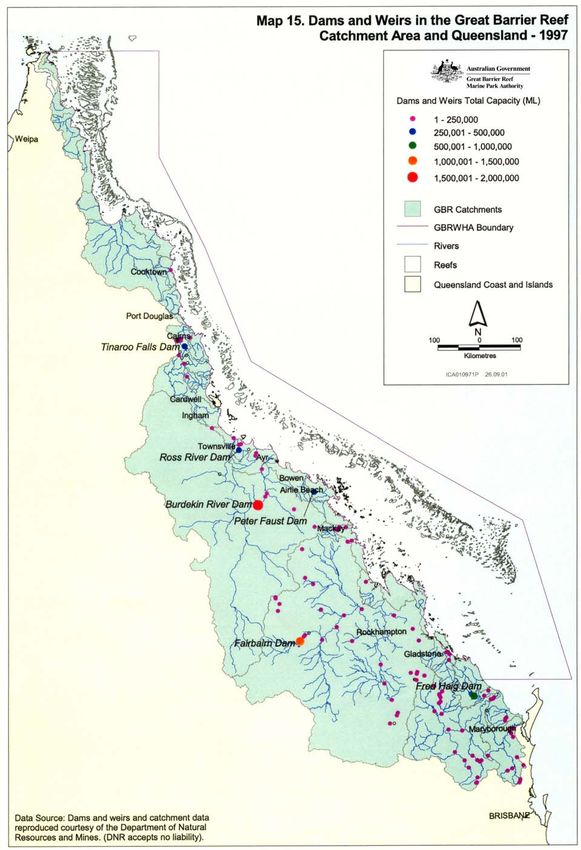
information on the Great Barrier Reef Catchment.
2. The Great Barrier Reef Lagoon and Water Quality
The degradation of the world’s marine ecosystems, as a result of the downstream effects of
increased population and catchment modification, is well documented (Mee, 1992; Turner and
Rabalais, 1991). The geomorphic characteristics of semi-enclosed marine ecosystems, such as
the Great Barrier Reef lagoon, result in them being particularly susceptible to water quality
declines due to low area-to water-volume ratios and slow rates of water exchange with
surrounding oceans (Konovalov, 1999). The Great Barrier Reef lagoon is a relatively shallow
body of water, defined by the 100 metre isobath of the submerged continental shelf along the
outer edge of the reef system (MAP 1). The total volume of water contained within the lagoon
is estimated to be 8 000 km3, covering an area of 225 000 km2. Reefs are predominantly
distributed along the inshore coastal fringe and the outer edge of the lagoon.

Two currents dominate water movement within the lagoon: a south to north wind-driven
inshore circulation along the Queensland coast and a north to south movement of water along
the seaward rim of the lagoon under the predominate influence of the East Australian Current
(Furnas and Mitchell, 1996). This movement of lagoon water is thought to largely confine
suspended terrigenous sediments to an inshore area 10-15 km wide along the length of the
coast (King, 1995; Belperio, 1983; Carter et al. 1993; Wolffe and Larcombe, 1998). Exceptions
occur during episodic extreme rainfall events, where turbid flood plumes extend from major
rivers to distances of up to 50 km from the Queensland coast (Brodie and Furnas, 1992; Steven
et al. 1996; Devlin et al. 2001). The overall dispersion pattern of dissolved contaminants is less
understood.

Factors affecting water quality within the lagoon, as a result of increased population and
catchment modification, include increased levels of inorganic sediments, organic and inorganic
nutrients, heavy metals, pesticides and petroleum-based contaminants, and alteration of the
natural hydrological regime (Wasson, 1996). Extensive areas of vegetation have been cleared
to support Queensland’s primary industry base, particularly sugarcane cultivation, pastoralism
and forestry since European settlement. Diffuse sources of pollution are closely linked to these
land uses and agricultural practices (Prove and Hicks, 1991; Moss et al. 1993; Gabric and Bell,
1993). Deforestation, grazing, tillage, the application of fertilisers and agricultural chemicals
have had a greater impact on the quality of water flowing into the river systems from the Great
Barrier Reef Catchment Area drainage basins than that from urban/industrial areas (Moss et al.
1993). Urban areas, particularly those in the coastal zone, are the greatest point sources of
pollution, with the highest inputs from sewage treatment plant discharges (Brodie, 1991).

Moss et al. (1993) found that for nitrogen exports from eastern Queensland, the diffuse sources
contributed far higher levels than those from point sources, with the exception of the
metropolitan area of Brisbane (Brisbane is not included in the Great Barrier Reef Catchment
Area within this study) (Figure 1). Generally, point sources of pollution (such as those
associated with urban/industrial sites) are easier to identify and mitigate than diffuse sources,
which tend to be cumulative and difficult to regulate. Diffuse sources of pollution are
essentially a catchment management issue (Brodie, 1995), requiring the identification of those
land uses that contribute excessive loads to the fluvial system and working to reduce exports
particularly through changes in land use practices (Creighton et al. 1995).

Given the level of clearing and modification of pre-settlement vegetation within the catchment,
rates of soil loss are thought to have increased substantially over the last 100 years. Moss et al.
(1993) have suggested that sediment exports from the Great Barrier Reef Catchment Area are
between 3-4 times greater than those of the pre-European settlement river loads. Total nitrogen
                                                 2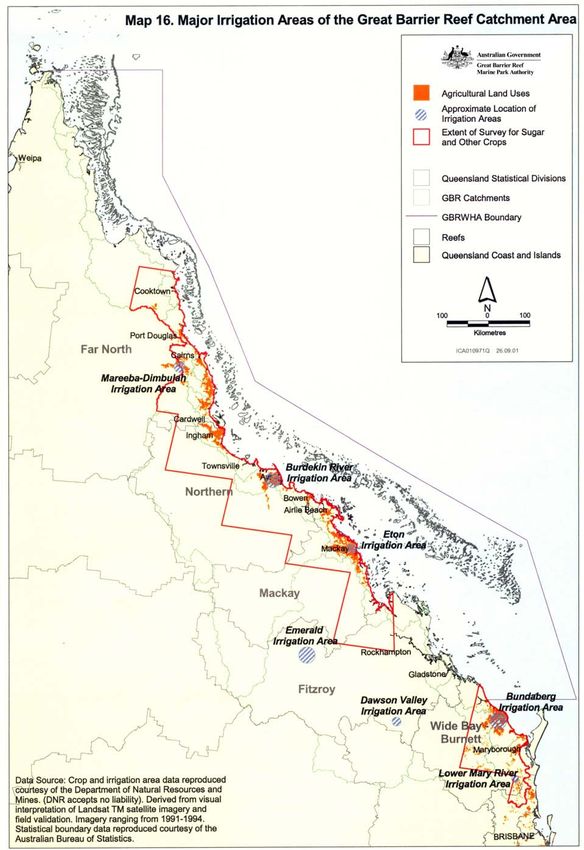
and phosphorus inputs to the Great Barrier Reef have increased by approximately 30 % (Furnas
and Brodie, 1996). Eutrophication of waterways due to the use of artificial fertiliser (ie.
phosphorus and nitrogen) for agriculture and pasture improvement, is also of concern. The
application of artificial fertilisers commenced early this century, and grew rapidly in response
to agricultural expansion and low soil fertility (Pulsford, 1993). Pulsford (1993) calculated that
a cumulative total of two million tonnes of nitrogen and 400 000 tonnes of phosphorus had
been applied to the Great Barrier Reef Catchment Area up to 1990. It is estimated that of the
80-85 000 tonnes of nitrogen currently applied to the Great Barrier Reef Catchment Area each
year at least 50 % is lost from the agricultural system and enters the environment
predominantly through the hydrological cycle (Pulsford, 1993). This process is accelerated by
the generally poor condition of the State’s riparian vegetation and freshwater wetlands
(Johnson, 1998; Moller, 1996; QDPI, 1993) which, when left intact, would provide a buffer
zone or sink for nutrients, reducing the level entering the waterways.

Some rivers of Great Barrier Reef Catchment Area have a long history of water regulation with
the first dam constructed in the1920s. Since settlement, the demand for water to support
agriculture and urban growth has steadily increased. In 1997 there were 123 official dams and
weirs within the Great Barrier Reef Catchment Area amounting to a total potential regulated
capacity of over 7 million mega litres. The construction of dams and weirs reduces river
discharge rates and modifies the hydrological environment of downstream wetland and marine
ecosystems and vegetation communities (Robertson et al. 1996). The extent of changes to the
flow of water from the catchment to the lagoon since settlement is difficult to assess. The fact
that river gauging stations were not intended to provide before-and-after dam water flow data
and the highly variable nature of stream flows in Queensland basins, makes it difficult to
demonstrate changes to flow (Moss et al. 1993). Elsewhere, the negative impact of river
regulation on downstream environments is being increasingly examined (eg. Murray Darling
basin). Further research is required to fully understand the implication of the downstream
effects of water regulation in the rivers of the Great Barrier Reef Catchment Area, and its effect
on water quality in the lagoon (Robertson et al. 1996).

                                                3
Gold Coast
Brisbane
Diffuse Loads
Sunshine Coast
Point Loads
Mary
Burnett-Kolan
Curtis Coast
Fitzroy
Shoalwater Bay-Sarina
Pioneer-o'Connell
Basin Proserpine
Name Don
Burdekin-Haughton
Ross-Black
Herbert
Tully-Murray
Johnstone
Mulgrave-Russell
Barron
Mossman-Daintree
North-east Cape York
0 3 6 9 12 15
Tonnes of N/Yr (Thousands)
Source: Moss et al ., 1993
Figure 1. Levels of nitrogen exported from point and diffuse sources in the Great Barrier Reef
Catchment Area.
Other issues of concern to water quality managers that will be considered within this report,
include pressures resulting from increases in population, urbanisation, tourism, and port
development, all of which are placing greater pressure on the environmental quality of the
coastal zone (Rayment and Neil, 1996; Tarte et al. 1995; Wachenfeld et al. 1998).
3. The Great Barrier Reef Catchment Area
3.1 Geomorphology and Soils
The Great Barrier Reef Catchment Area consists of 40 drainage basins covering a total area of
425 964 km2, which drains directly into the Great Barrier Reef lagoon and extends from
latitude 10º S in the north to 24.5º S in the south (MAP 1). The Great Barrier Reef Catchment
Area forms 95 % of the total area of Australia’s North East Coast Drainage Division and 25 %
of the total area of the State of Queensland (Table 1). The size of the non-island catchments
varies greatly from the smallest, the Mossman basin at 533 km2, to the largest, the Fitzroy
Basin at 142 460 km2. The two largest basins, the Fitzroy and the Burdekin, represent 64 %
(272 504 km2) of the total Great Barrier Reef Catchment Area (Table 1).
4Table 1. Area of drainage basins within the Great Barrier Reef Catchment Area.
Basin Name Total Area (km2) Basin Name Total Area (km2)
Jacky Jacky 2 825 Proserpine 2 499
Olive-Pascoe 4 197 Whitsunday Islands 54
Lockhart 2 848 Whitsunday Islands 102
Stewart 2 679 O'Connell 2 317
Jeannie 3 577 Pioneer 1 582
Normanby 24 624 Plane 2 437
Endeavour 2 065 Fitzroy 142 460
Daintree 1 893 Styx 3 003
Mossman 533 Shoalwater 3 574
Barron 2 135 Waterpark 1 629
Mulgrave-Russell 1 993 Curtis Island 507
Johnstone 2 250 Calliope 2 175
Herbert 9 742 Boyne 2 457
Tully 1 590 Baffle 3 970
Murray 1 042 Burnett 33 274
Burdekin 130 044 Kolan 2 904
Hinchinbrook
325 Fraser Island 1 630
Island
Black 1 046 Burrum 3 394
Ross 1 341 Mary 9 450
Haughton 4 353 Noosa 1 908
Don 3 538
GBRCA Total 425 964
Queensland 1 720 959
Source: DPI, 1993.
The most striking characteristic of the Great Barrier Reef Catchment Area is its lack of
homogeneity. The drainage area includes some of the most topographically diverse terrain on
the Australian continent, including desert uplands, high relief associated with coastal ranges
and tablelands, and a retreating escarpment with residual outliers on the coastal alluvial plains.
Depositional landforms found on the coastal plains include floodplains, alluvial terraces,
deltaic plains, saline alluvial plains, tidal flats and coastal dune systems.
The Great Barrier Reef Catchment Area is delineated to the west by the Great Dividing Range
and to the east by the coast immediately adjacent to the Great Barrier Reef World Heritage
Area. At its most northern extent (at the top of Cape York Peninsula), the watershed lies close
to the lagoon as a series of coastal mountain ranges. Further south, the Great Dividing Range is
located over 400 km inland from the coast and, as a relief feature, is barely visible over upland
plains. An almost unbroken (north to south) line of escarpments and ranges (known as the
Great Escarpment1) separates the drier uplands in the west of the Great Barrier Reef Catchment
Area from a relatively narrow strip of lowland alluvial plains along the length of the coast. The
1
The Great Escarpment formed as part of Cainozoic rift valley faulting processes. Except for sections of coastal ranges in the Mulgrave/Russell
basin, the associated faults are now offshore but can be seen in the linear chains of continental islands in the lagoon (eg. Whitsunday Islands)
(East in Wadley and King 1993). The retreating escarpment, which formed the coastal lowlands, extends for a distance of 2 800 km in
Queensland. It averages 200-700 m in height but with sections as high as 1130 m (East in Wadley and King 1993). The Great Escarpment is
often misinterpreted as defining the extent of the GBRCA.
5lowland coastal plains are comprised of 36 relatively smaller, high rainfall basins while just
four large basins (the Normanby, Burdekin, Fitzroy and Burnett basins) dominate the drier
Eastern Uplands, representing 77.5 % of the total catchment area.
Geologically, the Great Barrier Reef Catchment Area falls within the east Australian orogenic
province, an area with an extensive tectonic history. Repeated uplifting, folding, sedimentation
and metamorphism has been complicated by igneous intrusions and basalt flows produced by
Cainozoic volcanic activity (MAP 2). This orogenesis combined with geomorphic evolution
has contributed to the diverse pattern of soils seen today within the Great Barrier Reef
Catchment Area (Isbell, 1986). Generally, the soils of the coastal areas include often bleached,
shallow stony soils and deep sands. In the sub-coastal zone, duplex soils with obvious sandy
loam A-horizon over clay B-horizon are very common. Cracking clays with associated gilgai
development are found extensively in the central and southern inland areas of the Great Barrier
Reef Catchment Area. Large areas of massive sesquioxide soils (red earths and yellow earths)
are found throughout the north and east, with structured sesquioxides (euchrozems and
kraznozems) in smaller areas in the north and the south of the Great Barrier Reef Catchment
Area (Isbell, 1986). The soils of the catchment area are typically of low fertility (particularly
deficient in phosphorus and nitrogen) and exhibit poor soil structure.
The regional and local occurrence of vegetation communities such as rainforest is not always
strongly correlated with soil types per se. For example, the northern wet tropical rainforests can
be found growing on steep slopes over 3-7m deep kraznozem soils, while in other areas
rainforests can occur on poor granitic substrates, with soil permeability being the key pre-
requisite (Isbell, 1986). During settlement, the occurrence of rainforest vegetation was often
seen as an indication of the presence of fertile agricultural soils. The latter was not always true,
and in fact, the low fertility of soils has generally resulted in the extensive application of
fertiliser and conditioner to maintain agricultural productivity. Soil problems affecting lagoon
water quality resulting from post-settlement land use will be addressed later in this report under
agricultural soils.
3.2 Climate and Runoff
The climate within the Great Barrier Reef Catchment Area ranges from tropical to sub-tropical.
Rainfall is distinctly seasonal, particularly in the northern half of the Great Barrier Reef
Catchment Area where the monsoon influence during the summer months (September to
March) produces high rainfall, particularly when associated with the development of tropical
cyclones. The winter months are drier and dominated by sub-tropical high-pressure systems.
Interruptions to this seasonal barometric pattern may occur over periods of years as a result of
the Southern Oscillation. The eastern Queensland basins may experience extended years of
drought and decreased cyclonic activity during low-index years (El Niño), followed by periods
of exceptionally high rainfall during high-index years (La Nina) (Lough, 1991). During the El
Niño drought conditions, there is concern of soil compaction and structure decline on grazing
land, due to trampling by hard-hoofed grazing stock, such as sheep and cattle (Robertson et al.
1996). The drought is often followed by unusually high rainfall and runoff rates associated with
the La Nina cycle. Sheet-wash, rill and gully erosion over large areas of the tropical rangelands
contributes high sediment loads to the Great Barrier Reef Catchment Area river systems during
La Nina cycles (Robertson et al. 1996; QDPI, 1993).
Lough’s (1991) analysis of historic climatic data for Queensland has suggested that the years
following settlement from 1870-1899, were some of the wettest seasons recorded for central
and northern Queensland. The wettest 30-year period recorded was 1891-1920; the wettest 10-
6year period recorded was1970-1979, and the wettest year recorded was 1974. High summer
rainfall totals were also recorded in the 1950’s and 1970’s. The driest year recorded was in
1902, the driest 10-year period was 1940-1949 and driest 30-year period recorded was 1922-
1951 (Lough, 1991).
Spatially, rainfall distribution is highly variable within the Great Barrier Reef Catchment Area.
Cairns (17º S), in the northern section of the Great Barrier Reef Catchment Area (Barron
Basin), recorded a mean monthly rainfall of 400-500 mm for the summer months of January,
February and March for the years 1958-1992 (Lough, 1995). Further south (24ºS),
Rockhampton (Fitzroy Basin) recorded a mean monthly rainfall of 100-150 mm for the same
period. However, both centres recorded less than 50 mm for the driest months from June to
October (1958-1992) (Figure 2).
Mean Rainfall per Month
Rockhampton and Cairns 1958-1992
500
450
Rockhampton
400
Mean Rainfall (mm)
Cairns
350
300
250
200
150
100
50
0
nov
apr
aug
jan
jun
dec
jul
feb
sep
may
mar
oct
Month
Data Source: J.M. Lough, 1995
Figure 2. Mean rainfall per month, Rockhampton and Cairns 1958-1992.
The coastal basins receive considerably higher rainfall than the uplands, with a zone of greater
than 1 000 mm annual rainfall declining within 100 km of the coastline. The gradient becomes
less steep beyond the coastal ranges over the drier uplands to 500 mm in the western
extremities of the largest basin (the Fitzroy basin). Consequently, more dense settlement and
intensive agricultural expansion is concentrated in the coastal zone, particularly in those basins
receiving higher rainfall. Pastoralism is the dominant land use in the drier uplands but also
occurs in the wetter coastal basins (QDPI, 1993). Figure 3 and Figure 4 show the Annual and
Seasonal rainfall for Cairns and Rockhampton for the period 1958 to 1992. Far higher seasonal
rainfall fluctuations occur during the summer months than rainfall recorded during the winter
months (Lough, 1995).
7Average Seasonal Rainfall
Cairns 1958-1992
3500
annual
3000 summer
winter
Total Rainfall (mm)
2500
2000
1500
1000
500
0
Year
1959
1961
1963
1965
1967
1969
1971
1973
1975
1977
1979
1981
1983
1985
1987
1989
1991
Year
Source: J.M. Lough, 1995
Figure 3. Annual and seasonal rainfall, Cairns 1958-1992.
Annual Seasonal Rainfall
Rockhampton 1958-1992
1800
1600 annual
summer
Total Rainfall (mm)
1400
winter
1200
1000
800
600
400
200
0
Year
1959
1961
1963
1965
1967
1969
1971
1973
1975
1977
1979
1981
1983
1985
1987
1989
1991
Year
Source: J.M. Lough, 1995
Figure 4. Annual and seasonal rainfall, Rockhampton 1958-1992.
Several estimates of the total volume of runoff from the Great Barrier Reef Catchment Area to
the lagoon are identified in the literature. Mitchell and Furnas (1996) estimate the total average
annual freshwater volume to be 40 km3. The smaller coastal basins, (particularly the Mulgrave-
8Russell, Johnstone, Tully and Murray River basins), have the highest rainfall/runoff ratio
(Table 2). Peak river flows occur during the months of February and March with lowest flows
recorded during August /September (Lough, 1995). Inter-annual variation in these summer
flows is greatest in the larger, more arid basins, particularly the Fitzroy and the Burdekin
(Lough, 1995). Australian rivers generally display a higher variation in annual flows than rivers
of other continents; this phenomenon is particularly marked in the larger non-coastal basins
(Robertson et al. 1996). Consequently, water regulation through the construction of dams and
weirs has been prolific on most Australian river systems including the more arid basins within
the Great Barrier Reef Catchment Area (Robertson et al. 1996; Powell, 1991).
Table 2. Mean annual rainfall and runoff for in the Great Barrier Reef Catchment Area.
Mean Mean Annual Run- Proportion of
Annual Runoff off/Rainfall basin gauged
Basin Name
Rainfall (000 mega ratio (%)
(mm) litres) (%)
Daintree 2 576 3 560 65 5
Mossman 2 459 687 57 0
Barron 1 447 1 153 37 89
Mulgrave-Russell 3 233 4 193 64 45
Johnstone 3 405 4 698 59 57
Tully 2 907 3 683 74 87
Murray 2 485 1 628 57 14
Herbert 1 331 4 991 37 87
Black 1 510 509 31 33
Ross 1 071 372 19 50
Haughton 923 756 22 67
Burdekin 640 10 100 12 99
Don 1 022 689 17 33
Proserpine 1 562 1 431 37 14
O’Connell 1 705 1 668 40 30
Pioneer 1 418 994 47 93
Plane 1 499 1 370 34 16
Styx 1 157 825 23 0
Shoalwater 1 102 832 20 0
Waterpark 1 317 700 29 7
Fitzroy 702 7 127 7 95
Calliope 889 340 17 61
Boyne 1 031 401 15 99
Baffle 1 173 750 17 37
Kolan 1 162 464 13 80
Burnett 765 1 743 7 98
Burrum 1 104 718 20 52
Mary 1 158 2 309 21 81
Source: Pulsford 1993.
94. Pre European-Settlement Vegetation
Prior to settlement, anthropogenic land cover disturbance within the catchment area seems to
have been largely confined to Aboriginal burning of land, a practice that commenced before the
Holocene, and so therefore, will not be discussed as part of this report (Singh et al. 1981;
Singh, 1982). Furthermore, the presence of extensive areas of sclerophyll (floristic dominance
of two genera: Acacia and Eucalyptus) in the Great Barrier Reef Catchment Area is indicative
of a widespread natural fire regime occurring over the last 10 000 years under the relatively
stable Holocene climate (Kershaw, 1982). However, there can be no doubt that changes to land
cover in the last 200 years since European settlement has extensively modified the pre-
European settlement vegetation communities within the Great Barrier Reef Catchment Area.
Under the terrestrial biogeographic regions and provinces classification scheme (adopted by the
Queensland Department of Environment), generalised pre-European settlement vegetation
types can be inferred from the seven biogeographic regions falling within the Great Barrier
Reef Catchment Area (MAP 3). North to south, these include the Cape York Peninsula
bioregion, which is characterised by Eucalyptus sp. woodlands and open forest. Structurally,
the Cape York Peninsula open woodlands has an understorey of tall grasses, shrubs and small
trees with E. miniata and E. tetrodonta being the dominant tree species. Further south along the
Wet Tropical Coast, mixed closed rainforest communities (10-30 m high) predominate. To the
west of the wet tropics, the Eucalyptus sp. woodlands and open woodlands of the Einasleigh
Uplands dominate with patches of Acacia sp. open forests, which tend to dominate over
Eucalyptus sp. in lower rainfall areas. Further south and inland, Eucalyptus sp. woodlands and
open woodlands typically with a hummock grass understorey distinguish the Desert Uplands
bioregion.
The largest biogeographic region within the Great Barrier Reef Catchment Area is Acacia sp.
woodlands and open forests of the Brigalow Belt occupying 56 % of Great Barrier Reef
Catchment Area. The Brigalow Belt extends in a broad band from near Townsville to beyond
the southern limit of the Great Barrier Reef Catchment Area (Table 3). Typically, the Brigalow
Belt was dominated by Acacia harpophylla (‘Brigalow’) with mixed E. populnea (‘Poplar
Box’) and Casuarina cristata (‘Belah’). Sandwiched between the Brigalow and the coast is the
Central Queensland Coast bioregion of Eucalyptus sp. woodland and open woodland.
Similarly, Eucalyptus sp. woodland and open woodland dominate the southern-most bioregion
of south-east Queensland (Queensland Department of Environment and Heritage, 1995).
Table 3. Biogeographic regions – area within the Great Barrier Reef Catchment Area.
Total Area with the Percentage of
Biogeographic Region 2
GBRCA (km ) GBRCA (%)
Cape York Peninsula 38 958 9
Wet Tropics 18 284 4
Brigalow Belt 236 575 56
Einasleigh Uplands 52 353 12
Central Queensland Coast 14 021 3
Desert Uplands 27 091 6
Southeast Queensland 38 594 9
Source: Data provided by Queensland Environment Protection Agency, 1998.
10Wetland and littoral vegetation communities are found predominantly in relatively narrow
bands along the coastal lowlands and include Melaleuca and mangrove forests, sedge and heath
lands, samphire flats, and grasses associated with dune systems. Forests and woodlands ranging
structurally from closed to open and sparse with some grassland, dominated the Great Barrier
Reef Catchment Area prior to European settlement. The western area of the State (outside the
Great Barrier Reef Catchment Area) was dominated by semi-arid grasslands and shrublands.
4.1 Land clearing within the Great Barrier Reef Catchment Area
Native vegetation clearance2 in Australia, has historically been high. However, it has been
estimated that in the last 50 years just as much land has been cleared during the previous 150
years since settlement (DEST, 1995). Graetz et al. (1995) describes the history of alteration to
natural vegetation in Queensland as “one of intervention on a massive scale, a transformation
almost unthinkable in today’s world of conservation awareness and environmental impact
assessments”. Forests originally covered 21 % of the State, (an area of 355 540 km2) and
woodlands covered 28 % of the State (Government of Queensland, 1990), with a significant
proportion of these forests and woodlands located within the Great Barrier Reef Catchment
Area. By 1984, 110 000 –150 000 km2 of woodland forests were cleared for agriculture which
represents over half of the area of Queensland forests (Government of Queensland, 1990).
During the last 50 years, clearing for pastoral expansion has by far surpassed clearing for any
other landuse (Graetz et al. 1995). (For clearing histories for brigalow, rainforest and wetland
vegetation communities see later sections in this report).
Landcover disturbance for the Australian continent has been quantified by Graetz et al. (1995)
using Landsat MSS (satellite) data. Graetz et al. (1995) found that over 51.9 % (1 030 000 km2)
of the pre-settlement landcover on the Australian continent within the Intensive Landuse Zone
(ILZ) had been cleared or thinned3 over the 200 year period since settlement. Landcover
clearing and thinning was most extensive in the southern part of the continent extending along
the East Coast into the central Queensland catchments of Fitzroy and Burdekin (MAP 4). The
majority of the clearing in the central Queensland area is associated with the removal of
Brigalow vegetation for improved pastures (Graetz et al. 1995). Within the ILZ in Queensland
(a total area of 62 % of the state), 40.2 % of vegetation remained uncleared, 26.7 % was cleared
and 25.8 % was thinned (ie. a cleared and thinned total of 52.5 %) (Graetz et al. 1995).
Obtaining statistics on the rates of vegetation clearance over time is difficult, but trends which
have been identified indicate that clearance rates in Queensland were historically high (see
Brigalow, rainforest and wetland vegetation sections in this report) and continue at levels far in
excess of other Australian states. The 1994 National Greenhouse Gas Inventory Committee
Report estimated that in the 10-year period between 1988 and 1998, in excess of 50 000 km2 of
2
Native vegetation clearance in this study is defined as “the removal of a significant proportion of one or more of
the major vegetation strata in an ecosystem by mechanical or chemical means. It includes removal of woody
vegetation such as forests and woodland communities, the loss of grasslands, and drainage of wetland
ecosystems” DEST Biodiversity Series, Paper No. 6 p. 15 1995.
3
Three key classes were used in the interpretation of the Landsat data: Uncleared – where the spectral signature of
the canopy was intact, Cleared – where the spectral signature of the intact canopy was replaced by that of
understorey. Thinned –intermediate step between cleared and uncleared based on the spectral signature, and
Indeterminate – no assessment could be made. (Graetz et al. 1995)
11land was cleared in Australia, with an estimated 30 000 km2 of the clearing occurring in
Queensland. The 1975-1986 clearance rate of 5.6 % for the brigalow belt west of Mackay
increased to 9.1 % for the period 1986-1990 (Queensland Department of Environment and
Heritage, 1995). Most of the clearing in Queensland is now occurring on marginal agricultural
land, particularly in central Queensland, where soil fertility (such as phosphorus) is considered
to be inadequate for intended agricultural purposes (Ahern et al. 1994).
A large proportion of the tree clearing permits issued in central Great Barrier Reef Catchment
Area are for the clearing of regrowth on previously cleared land. From 1990 to 1995, 45 % of
the 8 462 km2 of tree clearing permits issued in the Shires of Bauhinia, Belyando, Emerald,
Jericho and Peak (located in the Desert Upland and Brigalow bioregions), was for the clearing
of regrowth (Queensland Department of Environment and Heritage, 1995). Permits issued in
Jericho and Belyando shires between 1987 and 1994 represented 25 % of the total land area of
these shires (Queensland Department of Environment and Heritage, 1995).
4.1.1. Vegetation Clearing and Land Tenure
Graetz et al. (1995) analysed vegetation clearing with respect to land tenure types for the
Australian continent. The results showed that the majority of landcover disturbance occurred
on freehold and pastoral leasehold land (58 %) (Figure 5). Within the Great Barrier Reef
Catchment Area, freehold land tenure is most extensive in the coastal lowlands north to the
Daintree basin and the southern inland Fitzroy and Burnett basins. Leasehold tenure shows
greatest representation in the Burdekin and remote basins of Cape York Peninsula (MAP 5).
Other land tenure types, such as Aboriginal land, unused land (Crown land), state forests and
conservation areas accounted for 42 % of the continent’s land cover disturbance. Within the
Great Barrier Reef Catchment Area, National Estate and State Forests account for 12.25 %
(52 000 km2) of land tenure by area, a similar figure to the national proportion of 13 %
identified by Graetz et al. (1995).
Graetz et al. (1995) also predicted future vulnerability of vegetation types under the six tenure
classes. Figure 6 represents the future vulnerability under tenure types with some of the major
vegetation communities represented within the Great Barrier Reef Catchment Area. General
trends can be identified for the Great Barrier Reef Catchment Area from this national scale
dataset. Closed forest communities (other than those dominated by Eucalyptus and Acacia sp.)
such as wet tropical rainforests and tall, medium and low Eucalypt forests are most threatened
under freehold and forestry tenure. Within the Great Barrier Reef Catchment Area, rainforests
were extensively cleared in the coastal lowlands for more dense settlement and agriculture,
particularly sugarcane. Timber exploitation has occurred in both rainforest and Eucalypt forests
within the Great Barrier Reef Catchment Area. The remaining rainforest (an estimated two-
thirds of the original cover), is found on steep mountain slopes and has been protected under
Wet Tropics World Heritage listing since 1988. The north Queensland rainforests under Wet
Tropics World Heritage management (9 000 km2) currently include 27 different types of land
tenure. National Estate and forestry covers large areas while freehold tenure covers 2 % and
leasehold 14 % (Wikers, 1997).
12You can also read