BARNEGAT BAY 2020 A Vision for the Future of Conservation - The Trust for Public Land
←
→
Page content transcription
If your browser does not render page correctly, please read the page content below
A Vision for the Future of Conservation

BARNEGAT BAY 2020
BARNEGAT BAY 2020
  A Vision for the Future of Conservation

                    A Report by
              The Trust for Public Land

                           July 2008

        © 2008 The Trust for Public Land. All rights reserved.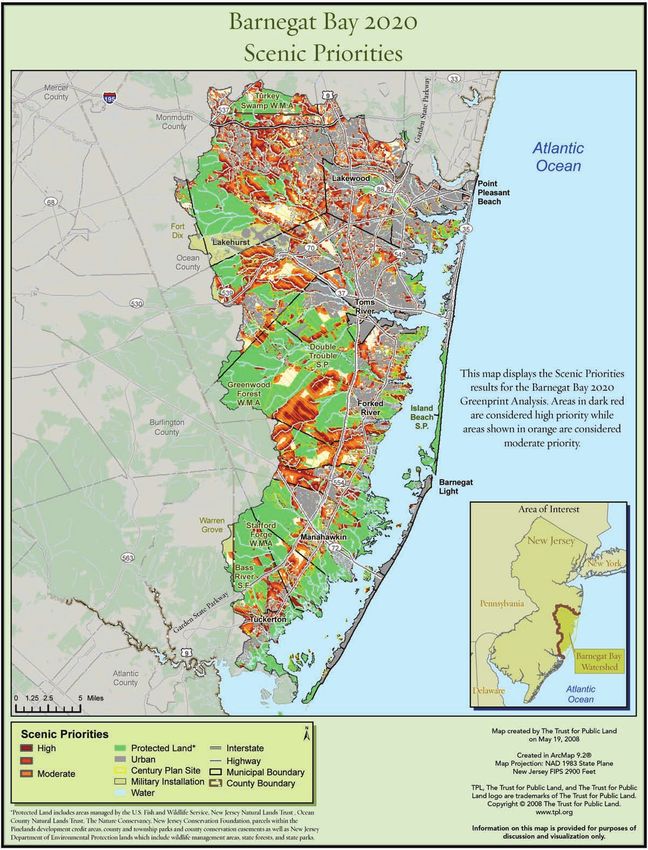
Contents
Preface										                   2

Introduction										              3

Current Conditions									         3

Priority Maps										             15–22

The Greenprinting Process								   25

Barnegat Bay 2020 Goals								     25

Next Steps										                28

Property Portraits									         30

Looking Forward									            34

Acknowledgements									           35

Appendix										                  37
Preface
    Perched on the highest spot at Ocean County               lost, and ecosystem functions, many that we take
    College, I can see Barnegat Bay off to the east.          for granted, may be compromised. If we don’t rec-
    The view from this vantage point provides a respite       ognize the point upon which we stand, we may lose
    from work and reminds me of other favorite coastal        the very qualities that attracted us here. Thus, it is
    perches—coastal cliffs in southern New England,           vital that we take immediate steps to protect the
    the bluffs of the Palisades along the Hudson River,       remaining open space throughout the watershed.
    and the coastal highway that winds along the craggy
    coast near Big Sur. Perhaps most importantly, the         In recognition of these cliffs, The Trust for Public
    view here reminds me that all of us in the Barnegat       Land (TPL) pulled together the regional stake-
    Bay watershed, like the inhabitants in those other        holders—local, state, and federal agencies, educa-
    coastal areas, are poised on the edge of other less       tional institutions, and other non-governmental
    welcoming cliffs—cliffs of our own making.                organizations—to identify the most important
                                                              remaining open space and to renew our commit-
    One such cliff comprises this country’s coastal           ment to its protection. Land acquisition is vital to
    counties, as they become home to an increasingly          protecting the fish and wildlife we cherish, main-
    greater percentage of the U. S. population every          taining essential yet widely unrecognized ecosys-
    year. Located between two of the largest metropoli-       tem services, and sustaining our quality of life. The
    tan areas in the United States, the Barnegat Bay          Barnegat Bay National Estuary Program and its
    watershed is home to roughly 600,000 people and           many partners have identified the acquisition and
    hosts nearly half a million additional vacationers        protection of open space within the watershed
    every summer. This population growth and tourism          as fundamental to efforts to protect and improve
    have brought many benefits, including educational         water quality throughout the bay watershed.
    and recreational opportunities and economic pros-
    perity, and have led to Ocean County being recog-         The current TPL effort, the Barnegat Bay 2020, builds
    nized as one of the best places in the country to live.   upon TPL’s 1995 Century Plan, which to date has led
                                                              to the acquisition of almost 24,000 acres through-
    Yet this growth has also brought a number of costs,       out the watershed. As Terry O’Leary, president
    many of which are not well recognized. In addition        of the Natural Resource Education Foundation
    to the overall loss of open space (much of it along       of New Jersey, noted at one planning meeting of
    the waterfront, which provides vital ecosystem            the many stakeholders that contributed to Barnegat
    services such as storm surge protection), popula-         Bay 2020, “the Century Plan guided land acquisition
    tion growth has fragmented habitats for fish and          and protection in Ocean County for more than a
    wildlife, altered the runoff of precipitation from        decade. It’s vital we continue this effort.”
    the land, and affected river flows and local erosion
    patterns. Many of these changes make people and           As I gaze out at Barnegat Bay from my cliff at
    property more vulnerable to coastal hazards. This         Ocean County College, I ask you to join me in
    growth has also lead to substantial decreases in          working with The Trust for Public Land and its
    water quality throughout the watershed. Coastal           many partners to make this effort successful by
    ecosystems are increasingly being recognized as           supporting the acquisition and protection of open
    sensitive to these disturbances and as suffering          space remaining in this vibrant watershed.
    disproportionate impacts from such activities.

    Another imposing cliff represents the natural lands
    that are vanishing from the Barnegat Bay water-
    shed. Roughly 30 percent of the watershed has been
    developed. As development proceeds beyond this            Stan Hales,
    tipping point, ecosystems begin to change in many         Director, Barnegat Bay National Estuary Program
    ways, often unpredictably. Sensitive species may be       July 2008

2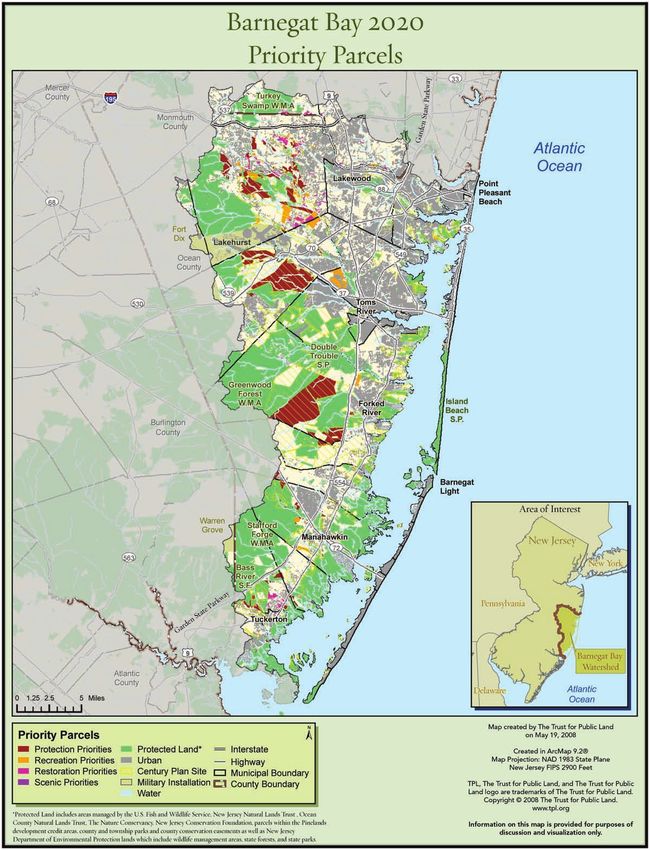
Introduction
For more than twenty years, The Trust for Public
Land (TPL) has worked with local partners in
New Jersey’s Barnegat Bay region to preserve this
nationally recognized refuge and recreational desti-
nation. TPL’s Century Plan (1995) identified 75,930
acres in the Pinelands, along the coastal shoreline,
and among bay islands that were considered, in
the words of that report, “of long-term impor-
tance to the Barnegat Bay as an ecosystem and a
treasured public resource.” While almost 24,000
identified acres have been protected, at least 4,5251
of the original Century Plan acres have been lost to
development. Much remains to be done—more
than 16,000 of the 1995 plan’s identified acres have
again been identified as priorities for acquisition
in this most recent study. TPL is strengthening its
commitment to the region with Barnegat Bay 2020.
This report is divided into two sections: (1) a look
at the current conditions in the bay watershed
based on recent scientific studies and (2) an expla-              The Watershed
nation of the land conservation goals drawn up by a               The 425,117-acre Barnegat Bay watershed is
steering committee convened by TPL.                               located almost entirely within Ocean County in
                                                                  east-central New Jersey. Like the county, the wa-
                                                                  tershed is shaped roughly like a wedge—widest in
The Barnegat Bay
                                                                  the north and narrowest in the south—and drains
Current Conditions                                                into the Barnegat Bay. The northern boundary
                                                                  extends just north of the Ocean County border
A rapidly growing population and the associated
                                                                  into Freehold and Howell townships in southern
development of agricultural and vacant lands have
                                                                  Monmouth County with the western boundary
brought a host of environmental problems to the
                                                                  well inside Ocean County except for a sliver of
Barnegat Bay watershed. However, land conserva-
                                                                  Bass River Township. The eastern boundary begins
tion campaigns, combined with a sophisticated
                                                                  in Point Pleasant Beach Borough and borders the
regulatory framework, are helping prevent fur-
                                                                  ocean south to the Beach Haven Inlet, less than
ther degradation by strategically protecting vital
                                                                  fifteen miles from Atlantic City. The Barnegat Bay
habitats and water supplies and in some instances
                                                                  estuary, a 42-mile-long brackish lagoon, has been
restoring natural functioning systems.
                                                                  extensively studied for its recreational and ecologi-
                                                                  cal value. In 1995 the U.S. Environmental Protec-
1
 This figure is the number of acres within Century Plan sites that are now classified as urban based on 2002 land-use/land-cover
data from the New Jersey Department of Environmental Protection. The remaining 71,000-plus acres still have natural land cover,
which includes altered and barren land. However, this figure is somewhat outdated and underrepresents the amount of land lost to
development because it is based on data from 2002.

                                                                                                                                   3
tion Agency declared the Barnegat Bay watershed                    around the periphery of the region in the Toms
    to be a threatened “estuary of national significance”              River subwatershed. Most of the development in
    and established the Barnegat Bay National Estuary                  the Barnegat Bay watershed consists of residential
    Program.                                                           homes built around the estuary.5
                                                                       		 Relatively few county residents work in indus-
    Population Change                                                  tries that can be directly tied to the natural re-
    and Land Development Patterns                                      sources of the watershed. More than three-fourths
    Ocean County2 is the most populated and fastest-                   of county workers are in retail trade or service
    growing county in New Jersey. It has experienced                   industries (Six Flags Theme Parks, Inc., and Saint
    exponential growth since at least the 1950s, shortly               Barnabus Health Care), or defense-related sec-
    after completion of the Garden State Parkway.                      tors (Lakehurst Naval Air Engineering Station).6
    From 1930 to 1960 the population rose from                         In 2000 only about 1 percent of Ocean County
    33,000 to 108,000. The U.S. Census estimated                       residents employed in the private sector were
    population for 2007 was 565,000, a 400 percent                     listed as working in the fishing, hunting, or general
    increase from 1960.3 During the summer, the                        agriculture industries. But this figure does not take
    population spikes to over one million with seasonal                into account the overall economic impact of the
    residents.4                                                        region’s natural resources. A recent state report,
    		 Viewed from west to east, the Barnegat Bay                      which analyzed the total value of the state’s natural
    watershed can be broken into three main re-                        goods (e.g., timber and fish) and services (e.g., food
    gions that roughly correlate with the extent and                   production and nutrient cycling by water bodies),
    type of development found in the county: (1) the                   found that estuarine and freshwater wetlands are
    Pinelands or headwaters region, (2) the coastal                    the most valuable ecosystems, producing as much
    region on the west side of the estuary, and (3) the                as $11,802/acre/year and $11,811/acre/year, respec-
    barrier island complex region on the east side of                  tively. 7 Furthermore, the state’s wildlife-related
    the estuary. While the coastal and barrier island                  tourism is estimated to create about $3 billion
    complex regions support the most development,                      annually in economic activity, which shows why it
    it decreases in intensity from north to south along                is vital to the economy to maintain public access to
    the western coast of the estuary. Owing to tight                   healthy natural lands and water bodies.8
    monitoring by the state’s Pinelands Commission                     		 The 2008 Ocean County Tax Board Report
    (which oversees implementation of the Pinelands                    on Land Parcels by Classification showed that
    Comprehensive Management Plan), development                        about 85 percent of all available land parcels (not
    in the Pinelands region is limited, although in re-                acres) are residential, the majority of which are
    cent years there has been significant development                  detached one-unit structures. The same report

    2
       The demographic data for this report are only for Ocean County. However, a small portion of southern Monmouth and eastern
    Burlington counties are technically within the boundaries of the Barnegat Bay watershed.
    3
      U. S. Census Bureau, “Ocean County Quickfacts,” 2008, quickfacts.census.gov/qfd/states/34/34029.html.
    4
      Correspondence with Ocean County Planning Director David McKeon, June 16, 2008.
     5
       Barnegat Bay National Estuary Program, Comprehensive Conservation Management Plan (Toms River, NJ: 2002), 18–19. The complete
    plan is available at www.bbnep.org/studies.html.
     6
       NJ Department of Labor, “Annual Private Sector Report for Employment and Wages in Ocean County,” 1990 through 2000,
    www.planning.co.ocean.nj.us.databooktoc.htm
    7
       NJ Department of Environmental Protection, “Valuing New Jersey’s Natural Capital: An Assessment of the Ecological Value of
    the State’s Natural Resources” (Trenton, 2007), 9–16.
    8
       Ibid. 2.

4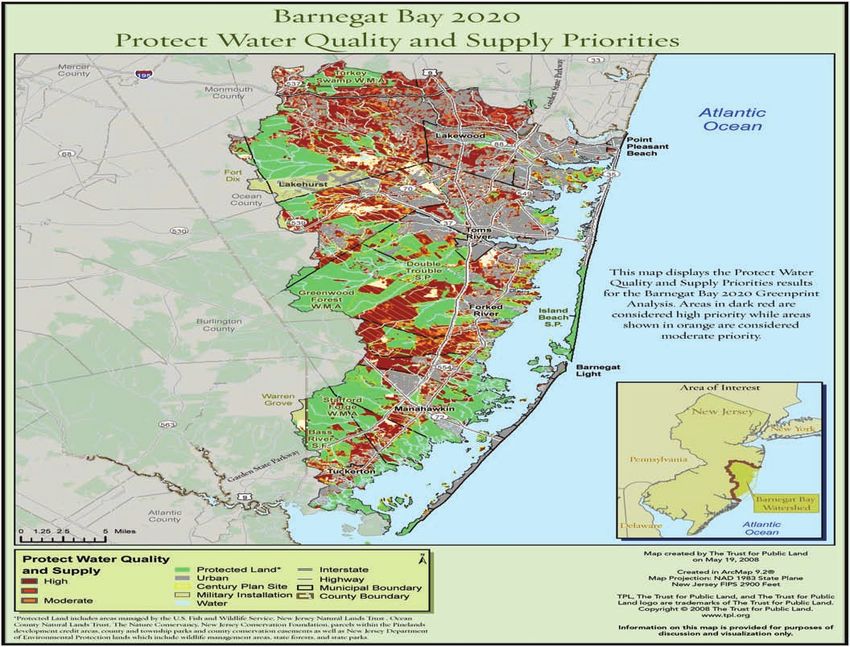
indicates that the amount of farm and industrial
land parcels has decreased over time.9 These and                                         “unconfined” aquifer
other indicators reveal a change in land use toward
                                                                              An “unconfined” aquifer is not constricted
a suburban landscape surrounding the Barnegat
                                                                              by a layer of soil or rock that would inhibit
Bay estuary. Most evidence suggests that sprawl-
                                                                              surface water from permeating the aquifer.
ing suburban development is far less sustainable
                                                                              This means that (1) contaminants in surface
than compact development that concentrates its
                                                                              water can percolate down into the aquifer and
environmental impact over smaller areas.10
                                                                              pollute the drinking water supply and (2) con-
                                                                              taminants in the groundwater also pollute the
The Barnegat Bay
                                                                              Barnegat Bay estuary. Drinking water contami-
Watershed and Estuary
                                                                              nation and contaminated water in Barnegat
Nearly all of the freshwater that enters the Barne-
                                                                              Bay are directly linked.
gat Bay estuary comes from the bay’s watershed

(with the exception of direct deposition from
rainfall and possible ground-water inflow from the
                                                                           Land Cover
                                                                           Much of the upstream woodlands falls within
Mullica River watershed).11 The geology and land
                                                                           the New Jersey Pinelands National Reserve and
cover of the watershed dictate how and to what
                                                                           comprises 37 percent of the total watershed area.13
extent the freshwater enters the bay. Maintaining
                                                                           Here, tracts of land dominated by pitch pine and
this complex ecosystem of land and water is a key
                                                                           several oak species are interspersed with “corri-
goal for the Barnegat Bay 2020 plan.
                                                                           dors” of hardwood and cedar swamps. This unique
                                                                           habitat supports a rare mixture of mammalian,
Geology
                                                                           reptilian, amphibian, and avian communities
The Barnegat Bay watershed is characterized by a
                                                                                                        partially dependent on
relatively flat topography with highly permeable,
                                                                                                        the unusually nutrient-
fine sand soils. The watershed is underlain by the
                                                                                                        poor and low-pH wa-
unconfined Kirkwood-Cohansey aquifer, which
                                                                                                        ters of the forest. Much
is the main source of drinking water in Ocean
                                                                                                        of the land within the
County, as well as the main source of freshwater in
                                                                                                        Pinelands Reserve is
the Barnegat Bay estuary. Thirty-two of the thirty-
                                                                                                        private, unprotected
three municipalities in Ocean County use ground-
                                                                                                        land.14
water wells for the public water supply.12
9
   Ocean County Board of Taxation, “Ocean County Abstract of Ratables, 2008,” www.tax.co.ocean.nj.us/2008LineItems.pdf.
10
    F. Kaid Benfield, Matthew D. Raimi, and Donald D. T. Chen, Once There Were Greenfields: How Urban Sprawl Is Undermining America’s
Environment, Economy and Social Fabric (New York: Natural Resources Defense Council, 1999); Dana Beach, Coastal Sprawl: The Effects of
Urban Design on Aquatic Ecosystems in the United States (Washington, DC: Pew Oceans Commission, 2002); Robert D. Bullard, Glenn
S. Johnson, and Angel O. Torres, “Atlanta Megasprawl,” Forum for Applied Research and Public Policy 4, no. 3 (Fall 1999): 17, 19; Environ-
mental Protection Agency, The Transportation and Environmental Impacts of Infill Versus Greenfield Development: A Comparative Case Study Analysis
(Washington, DC: Environmental Protection Agency, 1998).
11
   A. D. Gordon, “Hydrology of the Unconfined Kirkwood-Cohansey Aquifer System, Forked River and Cedar, Oyster, Mill,
Westecunk, and Tuckerton Creek Basins and Adjacent Basins in the Southern Ocean County Area, New Jersey, 1998–99,” U.S.
Geological Survey Water Resources Investigations Report 03-4337, 5 plates, 2004.
 12
    Workshop Report: Water Supply Issues and Uncertainties in New Jersey’s Atlantic Coastal Region (Jacques Cousteau National
Estuarine Research Reserve, 1999), 1.
marine.rutgers.edu./pt/coastal_training/resources/workshops/water_supply_workshop.pdf.
 13
    U.S. Department of the Interior, National Park Service, “Pinelands National Reserve,” www.nps.gov/pine.
 14
    Comprehensive Conservation Management Plan, 16.

                                                                                                                                                    5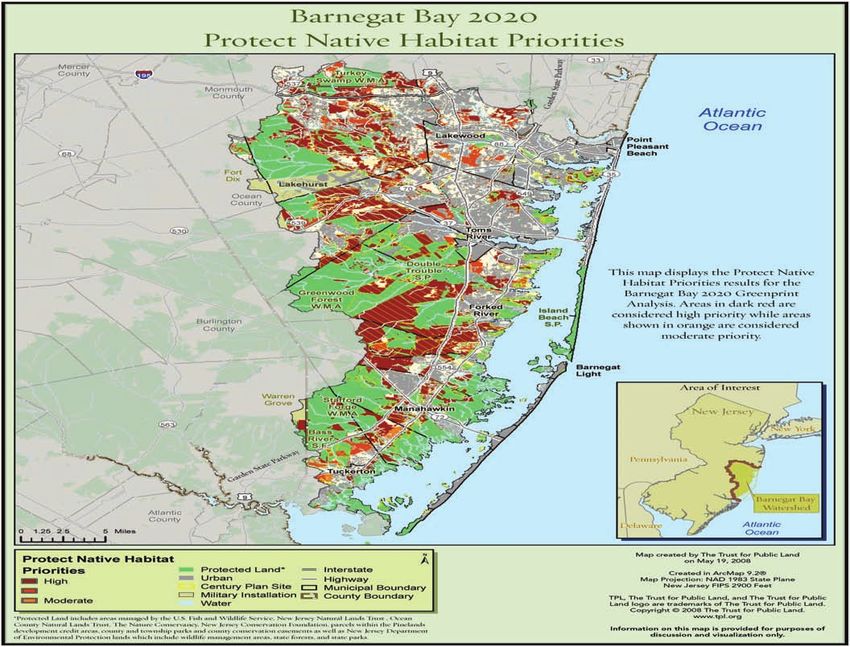
The lower (including tidal) sections of the wa-                      Barnegat Bay Estuary
    tershed are generally characterized by wetlands and                     The Barnegat Bay estuary has a 42-mile-long
    tidal areas that historically have provided a natural                   coastline. The width of the bay ranges from about
    buffer to rivers and the bay, sheltering inland areas                   1.2 miles to 3.7 miles and has an average tidal-
    against storms and high winds from the ocean.                           dependent depth of about five feet.17 The estuary
    Conversely, the wetlands also provide an efficient                      is composed of three microtidal bays (listed from
    filtration system for pollutants and sediment                           north to south): Barnegat Bay, Manahawkin Bay,
    washed downstream from further inland and can                           and Little Egg Harbor.18 The estuary is protected
    act as a giant sponge during flood events, mitigat-                     from the ocean by a nearly continuous strip of
    ing the potential damage of the floods by reducing                      barrier islands through which there are only three
    erosion.15 Further inland, freshwater wetlands,                         inlets for seawater to enter: the man-made Point
    which make up 25 percent of the total watershed,                        Pleasant Canal, Barnegat Inlet,19 and Little Egg
    feature two federally listed threatened plant spe-                      Inlet.20
    cies: swamp pink, and Knieskern’s beaked rush.
    		 Protecting the Barnegat Bay Estuary from
    the open ocean is the Barnegat Bay barrier island
    complex—the most substantially humanly altered
    portion of the Barnegat Bay region. The entire
    island complex has been developed to some extent
    with the exception of eight miles at Island Beach
    State Park and three miles at the Holgate Unit of
    the Edwin B. Forsythe National Wildlife Refuge.
    The barrier island and dune complex, plus the bay                       Species and Species’ Habitat
    itself, make up the remaining 38 percent of the                         The bay is bordered by numerous diverse and
    watershed.16                                                            productive habitats including barrier island, salt
                                                                            marsh, tidal marshes, shallow water, and swamps.

    15
         Ibid., 15.
    16
         Ibid., 16.
    17
      Barnegat Bay National Estuary Program, Barnegat Bay Estuary Program Characterization Report, (Toms River, 2001), chapter 2, www.
    bbep.org/char_rep.html.
    18
         Comprehensive Conservation Management Plan, 13.
    19
     Dutch settlers named the estuary “Barnedegat,” or “inlet of breakers,” for the rough water they encountered where the estuary
    meets the open ocean.
    20
         Barnegat Bay Estuary Program Characterization Report, chapter 4.

6
mallard, bafflehead, American black duck, red
                                                                           knot, dunlin, American oystercatcher, black-bellied
                                                                           plover, piping plover, sanderling, ruddy turnstone,
                                                                           semipalmated sandpiper, least sandpiper, and
                                                                           short-billed dowitcher. These birds are most com-
                                                                           monly found in the estuarine mudflats, intertidal
                                                                           beaches, and open waters of the estuary. Migratory
                                                                           raptors, such as hawks and ospreys, are more likely
                                                                           to be found around the barrier islands.22
                                                                           		 A recent study put the number of fish species
                                                                           in the estuary at about 110. According to the U.S.
                                                                           Fish and Wildlife report, the ten most common
                                                                           fish are bay anchovy, Atlantic silverside, fourspine
                                                                           stickleback, spot, winter flounder, inland silver-
                                                                           side, northern pipefish, mummichog, bluefish, and
                                                                           oyster toadfish. The bay anchovy is a primarily
                                                                           estuarine fish that tolerates a wide range of salini-
                                                                           ties and is found throughout the estuary.23
The unique habitats of the estuary attract threat-
ened and endangered species (and tourists). A
                                                                           Hydrology
1997 U.S. Fish and Wildlife Service study called the
                                                                           The bay’s highest salinity tends to be near the
Barnegat Bay watershed “one of the most impor-
                                                                           ocean inlets where the tide forces salty ocean wa-
tant migratory corridors in the hemisphere for
                                                                           ters into the estuary; salinity drops off toward the
shorebirds, passerines, waterfowl, and raptors.” The
                                                                           mainland where fresh waters flow from creeks and
same report listed 156 species of special interest,
                                                                           rivers. The two larger ocean inlets are in the south-
including 17 federal and state listed threatened or
                                                                           ern half of the barrier islands although the Point
endangered species and species of concern, mostly
                                                                           Pleasant Canal also allows saltwater into the north
migrating bird populations and estuarine fisheries
                                                                           of the bay. Freshwater discharge is greatest from
populations. Examples include the peregrine falcon
                                                                           the northern rivers. The highly developed Toms
and the roseate tern.21
                                                                           River watershed in the north of the bay provides
		 Existing wildlife preserves, such as the Forsythe
                                                                           about a quarter of the overall freshwater input to
refuge and the Great Bay Boulevard Wildlife Man-
                                                                           the estuary.24
agement Area, attract important concentrations of
                                                                           		 The small number of inlets that allow ocean
migratory shorebirds and waterfowl, including vari-
                                                                           water to the bay, and the bay’s extreme shallowness
ous species of diving ducks, Canada goose, brant,

21
 U.S. Fish and Wildlife Service, “Significant Habitats and Habitat Complexes of the New York Bight Watershed,” Atlantic
Coastal Plain, 6. Barnegat Bay Complex, 1997, training.fws.gov/library/pubs5/begin_newyork_bight.html.
22
     bid., 10.
23
  Ibid., 7; Comprehensive Conservation Management Plan, 15; Robert A. Zampella et al., The Barnegat Bay Watershed: A Report to the Pinelands
Commission on the Status of Selected Aquatic and Wetland Resources (Pinelands Commission: New Lisbon, NJ, 2006).
24
     “Significant Habitats and Habitat Complexes of the New York Bight Watershed,” 4.

                                                                                                                                               7
promotes stagnation of the bay’s waters. It can take                    90 percent of the total annual discharge from the
    as long as 70 days during the summer months for                         watershed.27 During droughts the ratio of ground-
    water to flush out of the bay. Slow flushing rates                      water discharge in the estuary increases relative
    accentuate the effects of excess nutrients such as                      to the amount of surface water runoff, leading to
    nitrates from fertilizer that have been washed from                     increased importance of sustained groundwater
    lawns, especially in summer when fertilizer use is                      availability.
    high. The bay is listed as a highly eutrophic (nu-                       		 Contaminated groundwater in the Barnegat
    trient-rich) estuary by the National Oceanic and                        Bay watershed does not stay underground but
    Atmospheric Administration.25                                           moves into streams, wells, and the bay. Although
    		 The average total amount of freshwater                               industrial pollution is largely controlled, household
    (surface water and groundwater) discharged into                         chemical spills, leaks from underground fuel tanks,
    the estuary is approximately 866 cubic feet per                         and other incidents pose a significant risk to the
    second. Higher discharges occur in the fall and                         health of the bay ecosystem.
    spring.26 Several large creeks and rivers drain the
                                                                            Land Use and Freshwater Quality
                                                                            Land-use patterns affect both surface and ground-
                                                                            water quality. Samplings by the U.S. Geologi-
                                                                            cal Survey and others show that volatile organic
                                                                            compounds and heavy metal concentrations are
                                                                            greatest in the Toms River and Metedeconk River
                                                                            basins, the two most heavily developed portions
                                                                            of the Barnegat Bay watershed.28 Toxic chemicals
                                                                            in surface water and groundwater, such as volatile
                                                                            organic compounds, heavy metals, and oil deriva-
                                                                            tives, are found in the highest concentrations near
                                                                            commercial/industrial areas such as gas stations,
                                                                            factories, and dry-cleaning operations. In general,
                                                                            land uses that can affect the quality of the water
                                                                            supply include (1) residential and commercial land
                                                                            maintenance, (2) land in-filling, (3) farming, (4)
                                                                            ditching to drain mosquito breeding areas, (5)
                                                                            stream channelization, and (6) stream impound-
    watershed into the Barnegat Bay estuary, but most                       ment (dams). Nitrate and phosphate concentra-
    of the water that supplies the streams is derived                       tions in groundwater wells and streams are greatest
    from groundwater. Annual discharge to the estu-                         near farms and highly fertilized lawns.
    ary from groundwater, base flow, is between 70 and

    25
      Michael J. Kennish et al., “Barnegat Bay-Little Egg Harbor Estuary: Case Study of a Highly Eutrophic Coastal Bay System,”
    Ecological Applications 17, no. 5, Supplement (2007): S3.
    26
         Comprehensive Conservation Management Plan, 14–15.
    27
      Christine M. Wieben, Assessment of a Shallow Ground-Water-Quality Indicator (Barnegat Bay National Estuary Program and U.S. Geo-
    logical Survey, 2007), 4–6.
    28
         Michael J. Kennish, “State of the Estuary and Watershed: An Overview,” Journal of Coastal Research, no. 32, 2001, 248–249.

8
Barnegat Bay’s Water Quality
The most visible side effect of development is the
harm caused by runoff of fertilizers from lawns and
farms, which is carried by streams and rivers into
Barnegat Bay (this runoff is an example of what is
known as non-point source pollution). High levels
of phosphorus and other nutrients from fertilizers
create an unnatural boom in plant and algal pro-
duction, which in turn produces abnormal levels of be directly related to the type and intensity of de-
oxygen in the water of streams and lakes as well as velopment within the Barnegat Bay watershed and
the bay. Conversely, when the plants and algae die, is worse in the highly developed northern section of
the decay process reduces the amount of oxygen. the bay around the Metedeconk River than near the
These wide variations in oxygen levels can cause southern, less developed section of the watershed.30
massive fish kills and make habitats unsuitable
for plant and animal life. Similarly, algal blooms The Trust for Public Land’s Role
caused by nutrient pollution, or eutrophication, can The Trust for Public Land (TPL) first became
prevent sunlight from reaching the benthic com- involved in the Barnegat Bay region in 1985.31 A
munities (bottom-dwelling plants and animals) decade later, TPL commissioned The Century Plan,
that rely on the sun’s energy. This is extremely dam- a comprehensive report on some of the natural
aging because benthic communities are the estuary’s resources within the watershed. It was both a citi-
“backbone,” forming a baseline energy source for zens’ guide to the extraordinary flora and fauna of
animals further up the food chain.
Algal blooms also harm the Barnegat Bay estu-
ary by blocking light to eelgrass and other plants.
These grasses are in steep decline and are being
replaced by invasive species. A host of finfish, shell-
fish, and waterfowl are dependent on eelgrass and
other plants that once thrived in the bay’s sunlight-
rich and brackish waters.
According to one report, about 29 percent of
the nutrient pollution in Barnegat Bay is from or-
ganic nitrogen found in residential and commercial
fertilizers. Approximately 71 percent of the non- the area and a regional conservation “greenprint,”
point source pollutants derive from runoff from which identified 100 undeveloped land parcels as
industrial and urban lands. Since 1980 all Ocean high priorities for public access and conservation of
County sewage has been discharged offshore, but the region’s unique resources. The report’s focus on
the exact effect this may have on nutrient pollution the aesthetic and ecological riches of the Barnegat
of the bay is unknown.29 Eutrophication appears to
29
Yuan Goa, Michael J. Kennish, and Amanda McGuirk Flynn, “Atmospheric Nitrogen Deposition to the New Jersey Coastal
Waters and Its Implications,” Ecological Applications 17, no. 5, Supplement (2007): S31.
30
Kennish et al., “Barnegat Bay-Little Egg Harbor Estuary: Case Study of a Highly Eutrophic Coastal Bay System,” S3.
31
Peter P. Blanchard III, The Century Plan: A Study of One Hundred Conservation Sites in the Barnegat Bay Watershed (New York: The Trust for
Public Land, 1995), 4.
9Bay watershed raised public awareness of how con- a Geographic Information Systems–based “gap
servation could play a significant role in improving analysis” of the watershed to identify land parcels
and protecting a healthy bay ecosystem. to set aside for conservation. Both the 1995 and
The Century Plan identified 75,930 acres for 1997 TPL reports identified potential conservation
conservation. Since then, 23,677 acres have been properties based on the ecological and aesthetic
protected, and 47,22632 original Century Plan acres significance of the land. The studies did not ad-
may remain undeveloped and unprotected. Of dress the connection between land use, the down-
that latter sum, 16,36033 acres are identified as high stream movement of pollutants, and the overall
priority on the new parcel map explained on page health of the ecosystem and safety of the drinking
27. This new map also identifies thousands of ad- water supply. Many scientific reports now directly
ditional acres that reflect good opportunities for tie developed land with elevated levels of pollut-
voluntary conservation to meet community goals. ants both near the developed areas and down-
In 1997 TPL published Beyond the Century stream from the development.34
Plan, which detailed results of an ecological inven-
tory performed by scientists in conjunction with
32
Again, because 2002 land cover data were used, this figure underrepresents the amount of land lost to development because it
does not reflect change in the last six-plus years. The actual number of Century Plan acres that remain undeveloped and unprotected
is lower than the number given here.
33
This figure is the number of acres of nonurban, unprotected Century Plan sites that were prioritized in at least one of the four
thematic goals developed by the steering committee.
34
Kennish, “State of the Estuary and Watershed: An Overview,” 243.
10The Regulatory Framework
State and Federal Regulations
Numerous governmental agencies and nongovernmental organizations are dedicated to protecting the
health of the Barnegat Bay watershed, resulting in a complicated web of acronym-heavy regulatory and
special-interest programs. Land-use regulation in the watershed falls under several regional programs
that are managed by the New Jersey Department of Environmental Protection (NJDEP) and the New
Jersey Pinelands Commission.
The NJDEP’s Surface Water Quality Standards program gives special pro-
tection to crucial headwaters and reservoirs under a three-level classification
system. Water bodies that have exceptional water quality significance—such as
those that serve as sources of drinking water, support habitat for species that
are endangered or threatened, or provide recreational or commercial uses—
may receive Category 1 status (C-1). In C-1 areas, there are restrictions govern-
ing new or proposed changes to activities that will potentially lower water qual-
ity. In the Barnegat Bay region, the entire Metedeconk River watershed, from
the headwaters in Freehold, Millstone, and Jackson down to Forge Pond along
State Highway 70 in Brick, has been designated a C-1 waterway owing to its
exceptional water supply significance. Portions of Toms River were designated
C-1 in June, 2008.35
The U.S. Congress established the 1.1-million-acre Pinelands National Reserve—the first such
designation—in 1978. State law designates most of the reserve as either natural resource preservation
areas, or as buffer zones where growth is controlled.
In the western Pinelands portion of the Barnegat Bay watershed, the state’s Pinelands Commis-
sion regulates land use to protect water quality and historical resources. For example, the Pinelands
Comprehensive Management Plan requires affected counties and municipalities to submit land-use
plans that adhere to strict zoning and smart-growth guidelines.36
The Coastal Area Facility Review Act (CAFRA) governs all of the land use east of the Pinelands
region in the watershed (roughly bordered by the Garden State Parkway). Regulations affecting
development increase with proximity to the coast as determined by distinct zones described in the
CAFRA legislation.37 In addition, a portion of this area falls within the Pinelands National Reserve,
and development applications are reviewed and commented on by the Pinelands
Commission.
Shoreline waterways are regulated by laws under the New Jersey Tidelands
Act. Wetlands are regulated by the state’s Wetlands Act of 1970. These laws re-
strict development within the tidal portion of the watershed, including land that
is no longer tidal, but that was tidal at one point, such as wetlands that have been
in-filled with dirt and other materials for development.
35
Round 5 Category 1 Proposal, New Jersey Department of Environmental Protection, May 21, 2007. See also NJDEP’s Water
Monitoring and Standards web page for information on the program and posted updates, www.state.nj.us/dep/wms/bwqsa/
swqshome.html.
36
Pinelands Commission Land Use and Planning, 2008, www.state.nj.us/pinelands/landuse/.
37
New Jersey Department of Environmental Protection, Division of Land Use and Regulation, Coastal Area Facility Review
Act, 2008, www.state.nj.us/dep/landuse/coast.html.
11The Regulatory Framework (cont.)
The Barnegat Bay National Estuary Program
In 1995, the same year that TPL released The Century Plan, the Barnegat Bay watershed was designated
the 28th National Estuary under the U.S. EPA’s National Estuary Program. By definition, these water
bodies are threatened “estuaries of national significance.” Barnegat Bay National Estuary Program
(BBNEP) staff were hired and charged with producing a science-based comprehensive plan to prevent
activities that harm (1) the public water supply, (2) shellfish, fish, and wildlife populations, and (3)
recreational opportunities. The BBNEP plan, released in 2001, does not set regulations but is advisory,
and it is to be used to help prioritize funding decisions. The BBNEP is responsible for developing
“action plans” to identify and fund organizations that promote the agenda of the comprehensive plan.38
There are four main areas of focus: (1) water quality and water supply, (2) habitat and living resources,
(3) human activities and competing uses, and (4) public participation and education. Generally, the
BBNEP intends to use these categories to fund programs run by nonprofit organizations, governmen-
tal groups, and others that can provide tangible, quantifiable results that are complimentary to the
broad goals of the comprehensive plan.
Local Laws
Amid this complex regulatory fabric of management plans, local governments have enacted ordinances
to protect the bay’s water quality. These ordinances vary in approach but collectively represent a strong
commitment to guarding water resources and recognition that no single approach is adequate.
Local regulatory mechanisms generally include some of the following:
Zoning overlays for water bodies with special development restrictions (e.g., wellhead
protection overlay zones; special protection of water bodies is also afforded through the
NJDEP Surface Water Quality Standards)
Mandates for soil erosion control programs for construction sites (see also the New Jersey Soil
Erosion and Sediment Control Act)
Development restrictions within floodplains
New, stricter New Jersey stormwater requirements for quality and retention39
Bans on illicit discharges and connections to the storm sewer system, where applicable
New Jersey’s Office of Smart Growth offers municipalities the opportunity to receive State Planning
Commission endorsement of their master plans for compliance with appropriate state regulatory
programs. Grants and funding programs are incentives to participate in the process, which can assure
appropriate designation of preservation areas.
38
Comprehensive Conservation Management Plan, 3–9.
39
See, for example, Stafford Township Municipal Code, Stormwater Control s.130-76 (D)(7)(a): “Stormwater manage-
ment measures shall be designed to reduce the post-construction load of total suspended solids (TSS) in stormwater runoff
generated from the water quality design storm by 80 percent of the anticipated load from the developed site, expressed as an
annual average…. The water quality design storm is 1.25 inches of rainfall in two hours.” Stafford has also set limits for total
impervious surface in each building zone in the township and requires a permit for installation of postdevelopment impervi-
ous surfaces (Ordinance No. 2007-33 and Ordinance No. 2007-34).
12Barnegat Bay
Visual Analyses
The following eight pages contain maps of the Barnegat
Bay watershed, described in detail in the Barnegat Bay 2020
Goals section beginning on page 25.
These maps and other information are also available on
The Trust for Public Land’s website: tpl.org/barnegatbayMap 1
15Map 2 16
Map 3

        17
Map 4 18
Map 5

        19
20
21
22
Voluntary Mechanisms                                               Recent GIS Analysis
Besides utilizing regulatory tools, local governments              Reveals the Need to Act Now
can buy parcels from landowners for conservation                   Using Geographic Information Systems (GIS),
purposes. This approach has a variety of benefits.                 a Rutgers University team in 1999 published a
First, it gives governments, citizens, and concerned               report on the nature of land-use change within the
groups a way to meet regional plan goals while also                Barnegat Bay watershed. The analysis showed how
responding to concerns about regulation and prop-                  development has affected the watershed over time
erty values. Second, regulations can be changed,                   and where best to focus on protecting land. A habi-
amended, dropped, or adapted as political climates                 tat map was constructed that broke the watershed
change, but land protection, if done properly, lasts               into 36 habitat subcategories and clearly located
into perpetuity. Third, to be effective, regulations               vital habitats as well as habitats that are threatened
must be enforced, yet enforcement varies tremen-                   by development.
dously from place to place.
                                                                   The report, and a recent update by the same au-
		 Ocean County credits TPL’s Century Plan with
                                                                   thors, make these points:42
providing the initial motivation to develop an
open space plan by raising public awareness of the                    As of 2006, 33 percent of the watershed was
economic and ecological value of the remaining                        developed, up from 28 percent in 1995 and
                                                                      18 percent in 1972. Most of the development
natural lands within the watershed. In 1997 dedi-
                                                                      is focused in the northeast and barrier island
cated Ocean County residents voted to increase                        portions of the watershed. At the same time,
their property taxes by 1.2 cents per $100 of total                   the GIS analysis clearly connects the subwa-
real estate valuation. This revenue funds the Ocean                   tersheds of the Toms and Metedeconk rivers,
County Natural Lands Trust Fund Program, which                        the two highest-discharging rivers in the bay
                                                                      watershed, with the most developed areas.
purchases land to “1) maintain the rural character
of the county; 2) protect critical environmental re-                  As much as 20 percent, or 33,853 acres, of the
sources; 3) maintain active agriculture; and 4) buffer                upland Pine Barrens forest and as much as 6
                                                                      percent, or 4,633 acres, of wetlands were lost
areas that are not compatible with development.”40                    between 1972 and 1995.
As of the beginning of 2008, the Ocean County
Natural Lands Trust Program had acquired 6,830                        About 20 percent of all riparian corridors are
                                                                      “altered.” Riparian corridors are defined as
acres, of which at least 1,750 acres TPL was involved                 the space 295 feet on each side of streams of a
in helping to purchase.41 NJDEP’s Green Acres                         certain size. The analysis shows that riparian
Program—a state program that gives competitive                        corridors are more altered in the developed
grants to counties and municipalities to help facili-                 northeast region of the watershed than else-
                                                                      where. Because riparian corridors are vital for
tate land acquisition—has been an important source
                                                                      filtering surface water and groundwater, the
of matching funds for many of these transactions.                     loss of riparian corridors in developed areas
                                                                      can mean that pollutants will more easily enter
                                                                      the groundwater and streams.

40
  Ocean County Natural Lands Trust Fund Advisory Committee, Ocean County Open Space and Recreation Inventory (Ocean County
Board of Chosen Freeholders, 2001), 1-4.
41
     Correspondence with McKeon.
42
   Kirk Moore, “Watershed Development Jeopardizes Bay Life,” Asbury Park Press, November 28, 2007; Richard G. Lathrop, Jr. et
al., “Data Synthesis Effort for the Barnegat Bay Estuary Program: Habitat Loss and Alteration in the Barnegat Bay Region,” 1999,
www.crssa.rutgers.edu/projects/runj/habalt1.html. Information for this section was taken directly from the web site with little
adaptation.

                                                                                                                                   23
About 71 percent of the Barnegat Bay shoreline Conclusion
is developed or “altered,” bulkheading being
Because land use and the overall health of the
a significant problem. Shoreline buffers are
defined in this study as areas that would fall watershed are intricately linked, scientists believe
along the intertidal and mudflat portions of the that population increases and the resulting high
estuary, areas that are vital to the estuary’s birds percentage of developed land use are the pri-
and other animals.
mary cause of environmental problems facing the
Development has eliminated over 28 percent Barnegat Bay watershed. The rapid transition from
of the bay’s salt marshes. Much of the bay’s agricultural and undeveloped land to primarily
salt marsh system was destroyed by mosquito
suburban land in large sections of the watershed
control ditching and development built on
wetlands that were filled and then dredged has led to the destruction of wetlands, natural
to form waterfront lots on mazes of lagoons shoreline, the modification of inland areas,43 and
before 1970. the loss of natural habitat for many native species.
The extent of submerged aquatic vegetation in Pollution from nitrates and pathogens has degrad-
the estuary may have decreased as much as 20 ed the supply and quality of freshwater; the loss of
percent between 1979 and 1998. This could natural spongelike riparian corridors and wetlands
be a direct indication that nutrient pollution is has made it harder for the ecosystem to naturally
harming this vital habitat.
filter pollutants before they enter the water supply.
As of 1999, there were still key resources not Similarly, the compaction of soils and related in-
yet in some form of public conservation owner- crease of impervious land cover has made streams
ship: 10 percent of Barnegat Bay’s salt marshes,
30 percent of the remaining undeveloped more prone to flooding and reduced the ability of
shoreline, 55 percent of interior forest habitat, soils to buffer nutrients and pollutants before they
and 50 percent of Barnegat Bay’s islands. enter the groundwater and estuary. Eutrophication
may be responsible for the alteration and destruc-
GIS tion of vital submerged aquatic vegetation habitat,
GIS (Geographic Information Systems) analysis which could have a profound effect on the overall
uses satellite photos, aerial photos, and ground- health of the estuarine ecosystem.
truthing (on-the-ground verification) to inter- Though these facts would seem to justify
pret the geography of a place. Most important, pessimism about the future of the Barnegat Bay
GIS analysis can (1) quantitatively determine the watershed, there is also reason for hope, based on
extent of change over time by comparing historic
the conservation successes of the past decades, the
satellite images and aerial photos with present-
growing science of ecological restoration, and the
day images (2) quantitatively pinpoint key areas
for land conservation, and (3) present a visually knowledge that there is still valuable land available
cohesive narrative of spatial trends. Combined, for conservation. The goals and recommendations
these factors both make the case for land con- of TPL’s Barnegat Bay 2020 plan, detailed in the next
servation and make it possible to locate crucial section of this report, represent our pledge to work
properties. However, it is important to recognize with all concerned individuals and groups deter-
that GIS analysis is limited by the quality and
mined to save this special place.
sophistication of the data.
43
Comprehensive Conservation Management Plan, 5.
24TPL, with help from the Technical Advisory
The Greenprinting Process
Team, conducted an analysis at the resource level,
In October 2007 TPL formed a steering com-
meaning that the GIS model looks across the land-
mittee of more than 50 individuals to represent
scape (regardless of property boundaries) for areas
the diverse range of stakeholders who live in the
having features that met the criteria identified for
watershed or work on issues pertaining to Barnegat
each goal in this study area. The team members
Bay. Individuals invited to join the committee were
assisted in refining the criteria for each goal identi-
from various constituent groups throughout the
fied by the steering committee and locating the
region and together reflected the breadth of land
data needed to test the criteria.44 In some cases cri-
conservation, recreation, and other goals incorpo-
teria were further refined owing to the limitations
rated in this report. Between November 2007 and
of available data. The technical team ultimately
April 2008 the committee met three times.
developed one map for each goal. These maps are
At the initial meeting, TPL asked the steering
featured on pages 19 - 21. Areas that best meet the
committee to describe its objectives. The group
criteria appear in dark red on each goal map.
developed six principal goals for land conservation
At the second and third steering committee
in the Barnegat Bay watershed:
meetings, participants reviewed maps, made final
1. To protect water quality and supply decisions about clustering of goals, and agreed that
2. To improve water quality four goal maps represent interests in land conser-
3. To protect native habitat vation in this study area. (see pages 15 - 19.)
4. To restore habitat
5. To improve recreational access Barnegat Bay 2020 Goals
6. To protect scenic quality Through a consensus process, steering committee
participants decided that the land conservation
The committee also considered what criteria goals for Barnegat Bay 2020 are the following (in no
must exist to achieve these outcomes. For example, particular order):
to improve recreation opportunities, lands that
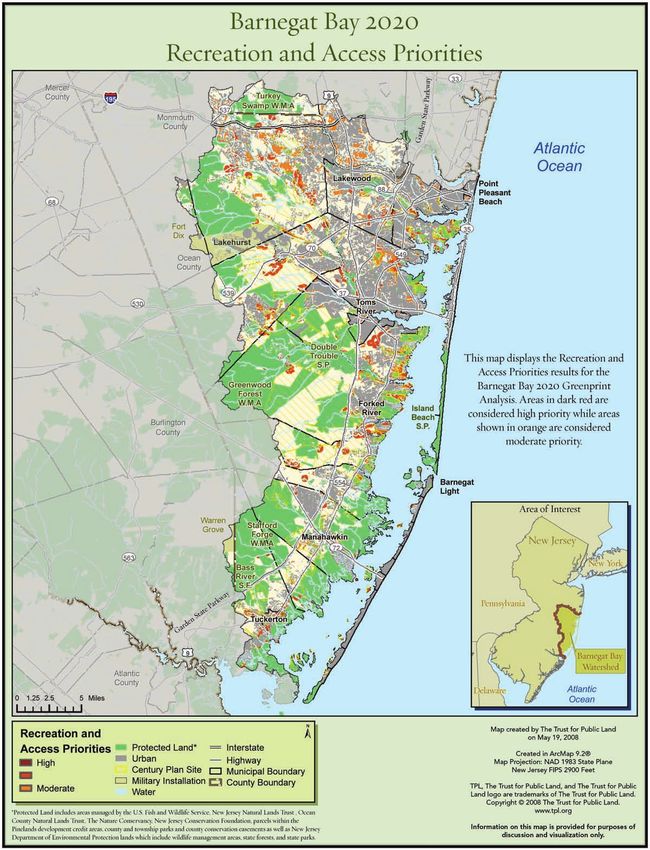
offer access for boating, for pedestrians, or to the Recreation and Access Priorities —This map
beach should be conserved. Active recreational (see Map 1, p. 15—Recreation and Access Priori-
facilities such as ballfields, playgrounds, and so on ties) indicates which areas provide the best op-
may be appropriate in some areas. portunity for improving recreational access in the
Next, TPL formed a subcommittee of local Barnegat Bay watershed. Areas appearing in dark
advisors—called the Technical Advisory Team—to red and orange are locations that would provide
assist with development of a Geographic Informa- excellent new water access or new sites for parks in
tion Systems (GIS) model design, content, and urban areas. A variety of criteria were considered,
outcomes. The six-person team had expertise in such as the best boating access (as determined by
natural resource protection, water quality and sup- the water’s depth, shoreline, roads, aquatic veg-
ply, habitat protection, storm water management, etation, sensitive habitat, existing land cover, and
cultural assets, parks and recreation, land-use plan- existing boat ramps), low-impact pedestrian access,
ning, and GIS data. beach access, and new conservation areas located
44
Visit www.tpl.org/barnegatbay for a list of the criteria, rationale, and data sources used in the GIS model.
25close to the bulk of the residential population. As use of the bay for decades to come.
one can see by looking at the map, while there are
many opportunities in proximity to the bay, there Water and Habitat Restoration Priorities—
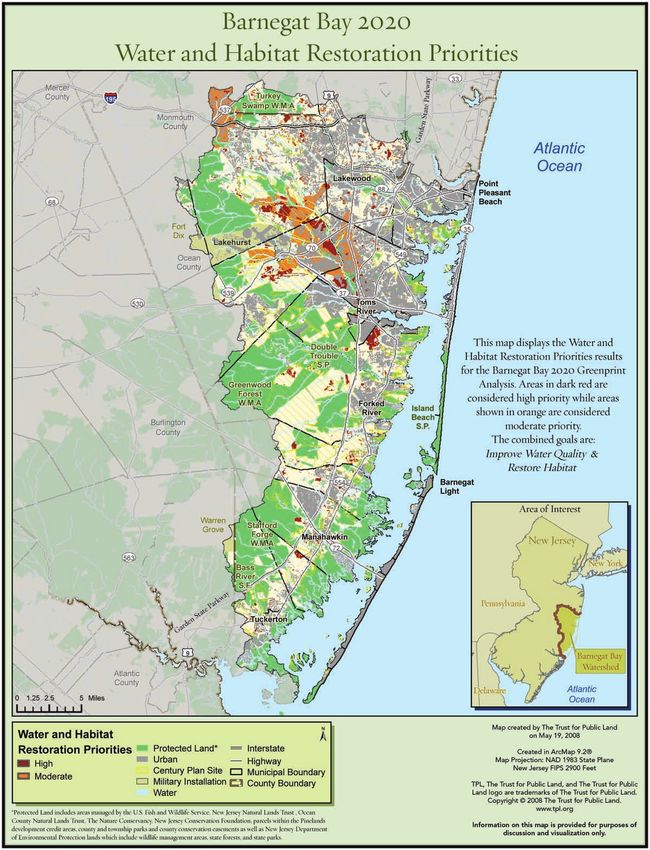
are also many inland opportunities. This map (see Map 3, p. 17—Water and Habitat
This map identifies more than 70,000 acres of Restoration Priorities) shows in dark red the areas
the study area45 as potential high-priority recreation that ought to be restored in the interests of water
land. The analysis always identifies high-priority quality and supply as well as native habitat sustain-
lands regardless of what land is already protected. ability, and also represents a combination of two
In this way we were able to profile remaining of the original six principal goals described above.
unprotected priority areas versus those areas that Underpinning this goal is the need to rehabilitate
already provide public access. About 45 percent of degraded surface water, restore riparian areas,
that land is already protected, which means that 55 and improve undeveloped shorelines adjacent to
percent (about 39,000 acres) still provides high- bulk headings, nonvegetated riparian zones and
priority conservation opportunities for this Barnegat transitional uplands, and phragmites areas. Some
Bay 2020 goal. properties show up as high priority because they
are located in a subwatershed that is having water
Water and Habitat Protection Priorities— quality problems, and the idea is to protect and
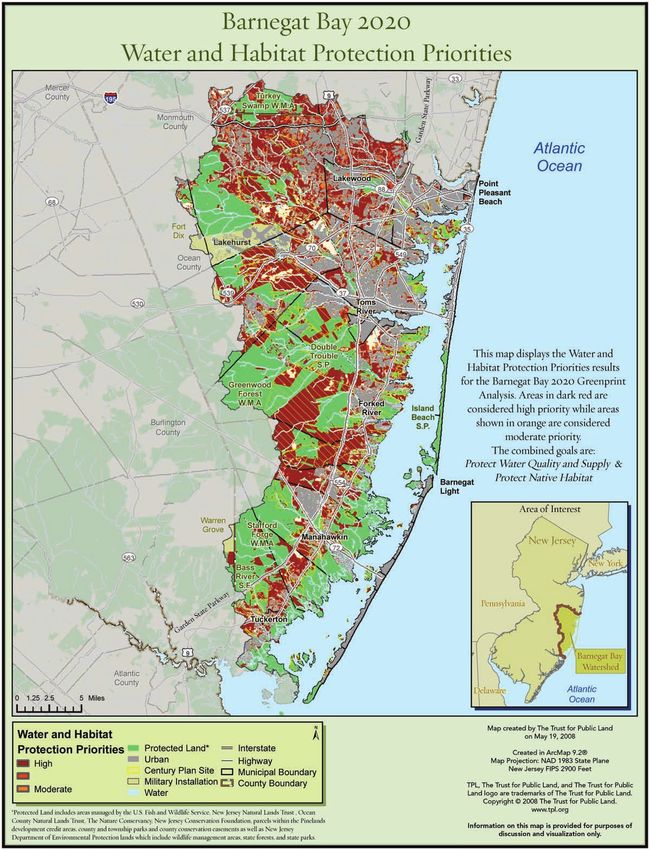
This map (see Map 2, p. 16—Water and Habitat properly manage the property to keep it from
Protection Priorities) illustrates in dark red which further degrading the water quality of the nearby
lands could be conserved in order to protect water stream or river.
quality and special natural habitats in the study area, Only about 40,000 acres are identified as high
representing a combination of two of the original priority (about 10 percent of the study area) for
six principal goals described above. To protect water this Barnegat Bay 2020 goal. Very little of this land has
quality and supply, the maps suggest targeting lands already been conserved; in fact, almost 90 percent,
that contain undisturbed upland permeable soils, or 36,000 acres, is still unprotected.
headwaters, wetlands, vegetated riparian corridors,
recharge areas, marsh migration zones, and lands Scenic Priorities—This map (see Map 4, p.
directly upstream of drinking water intakes. Some 18—Protect Priorities) identifies in dark red land
of the same criteria are identified for protecting as high priority for protection if it is adjacent to
native habitats. state-designated scenic roads or habitat areas that
Almost 60 percent, or 174,000 of the 290,000 are visible from roads and waterways. For example,
acres in this category, has not yet been protected. forested land along the Garden State Parkway ap-
The total land identified as high priority for water pears as high priority. Given the number of roads
and habitat protection is quite a bit more land and waterways that weave through the study area,
than appears on the recreation and access oppor- it is not surprising that much of the study area
tunity map, but it is important to note that some is a good opportunity for meeting scenic priori-
of the land conserved to benefit water quality or to ties. Roughly 65 percent of the study area (about
preserve habitats will also be appropriate for certain 280,000 acres) is identified as high priority, and
types of recreation. In addition, protecting the bay’s 60 percent, or 168,000 acres of that, is at risk of
water quality will help ensure healthy recreational being developed.
For each of these four goals we also looked at
45
The study area encompasses 425,117 acres, including the bay, which itself takes up about 68,000 acres. For purposes of calculat-
ing percentages in this report, the bay is included as part of the study area.
26where these high-priority lands are located on the mittee identified the following criteria to score each
basis of political boundaries. Please see the Ap- remaining high-priority parcel: whether the parcel
pendix for a list of high-priority land within the is threatened by development, whether the parcel
top-ten largest towns in the study area for each is adjacent to already protected land, whether the
goal.46 In sum, Jackson has the most acreage identi- parcel is a Natural Heritage Site (as determined by
fied for conservation opportunities for all goals the New Jersey Department of Environmental Pro-
except restoration (Manchester township leads in tection), or whether acquiring the parcel is a goal of
this category). For all goals, Point Pleasant has the a partner.49 The model scores each parcel based on
least amount of land identified as an opportunity the responses to those questions.
for conservation. These numbers are to be expected There are about 900 parcels, (see Map 5, p.
since Jackson has the most land area within the 19—Priority Parcel) together encompassing ap-
watershed and Point Pleasant has the least. proximately 25,000 acres. Many opportunities are
To factor out size, it is useful to compare in the headwaters of the study area. Many parcels
percentages of land area identified as high priority. on this map meet multiple goals–in other words, a
Note that only the portion of the municipalities parcel may have features that make it desirable for
within the study area was analyzed. Almost all (98 conservation in order to protect water quality and
percent) of the portion of Howell Township that also to provide scenic viewsheds and recreational
is in the watershed is identified as high priority for opportunities. But for simplicity of viewing, on
protection, and nearly all of it is currently unpro- this map every high-priority parcel is color coded
tected; about 30 percent of Toms River scored high to represent only one goal. The actual number of
for restoration (90 percent of that is currently parcels and acreage identified to satisfy each goal is
unprotected); about 30 percent of Brick Township as follows:
was identified for recreation (about 40 percent of
Water and Habitat Protection
that is already protected); and 80 percent of Lacey Priorities: 192 parcels, 18,697 acres
is important for scenic quality (but more than 60
Recreation and Access Priorities: 447
percent of that is already protected).47
parcels, 11,093 acres
TPL also convened a committee with represen-
tatives from groups in the study area that already Water and Habitat Restoration
Priorities: 513 parcels, 4,792 acres
work on land conservation with willing sellers. This
committee assisted in developing a second-tier Scenic Priorities: 48 parcels, 1,845 acres
analysis, moving from the resource to the parcel
level and applying additional criteria to further nar-
row the list of highly desirable parcels. For example,
the committee decided to consider only properties
without current permanent protection.48 The com-
46
These comparisons were based on 2000 U.S. Census Bureau data, regardless of whether some of the city or town may be out-
side the study area, which is determined by watershed boundaries as opposed to political boundaries.
47
This analysis considers only the portion of the municipality’s land area within the study area.
48
In addition, for parcels less than five acres, only vacant properties were considered, and for parcels greater than five acres, only
properties that have greater than 75 percent natural cover were considered.
49
These goals are identified in township open space plans, Pinelands Target Acquisition areas, Beyond the Century Plan and TPL’s
Metedeconk Stewardships Study. They also include Edwin B. Forsythe National Wildlife Refuge’s proposed expansion areas, New
Jersey Conservation Foundation’s “hubs’ (undeveloped land with important natural resources) and military installation buffers, as
well as lands likely to meet the requirements of federal programs such as the Coastal and Estuarine Land Conservation Program.
27The map is included for purposes of discussion and that form the Barnegat Bay region. Therefore, the
visualization only. With the underlying GIS-based steering committee recommended that between
tool, queries will reveal which parcels have the most 2008 and 2020 TPL, local governments, and the
high-priority land according to the resource-level many partners working in the watershed take the
analysis, who owns the parcel, and will apply the following steps:
parcel prioritization criteria just described. This
will help in the identification of landowners for 1. Increase public awareness
outreach to assess their interest in conservation. What: Improve knowledge and public awareness
Although the mapping does identify which proper- about the threats facing Barnegat Bay and the op-
ties are most valuable for meeting the goals, in some portunity to use Barnegat Bay 2020 land conservation
cases the landowners who own those parcels may goals to help address these threats.
not be interested in selling, so the list of opportuni- Who: Reach out to elected officials and staff of
ties will broaden and encompass more of the high Ocean and Monmouth counties, elected offi-
priorities identified on the resource-based maps. cials and staff of municipalities, members of local
environmental commissions, staff at the New
Jersey Department of Environmental Protection,
members of the media, educators, schoolchildren,
residents, developers, senior groups, garden clubs,
and the public at large.
How:
Produce a brochure and a report
describing Barnegat Bay 2020.
Request that the Asbury Park Press
newspaper publish a special supplement
pull-out profiling Barnegat Bay 2020.
Mail a Barnegat Bay 2020 postcard with
water bills to township residents who re-
ceive their water from the bay watershed.
Develop a seminar or training model
for local elected officials and environmen-
Next Steps tal commissions (e.g., Mayors’ Association,
As discussed earlier, land use, landowner behavior, Association of New Jersey Environmental
and government policies can and do have profound Commissions, Jacques Cousteau National
effects on the overall health of the Barnegat Bay Estuarine Research Reserve).
watershed. While land acquisition is very impor- Design a traveling show and tool kit for
tant, protected lands can still be degraded if “up- the public, and teach volunteers to operate
stream” or nearby actions are not informed by envi- it (it could be offered at the BBNEP Fes-
ronmentally sound knowledge. Ideally, the health of tival, TPL booths, town council meeting
the watershed will be something that is promoted presentations).
vigorously at every level of the many communities Announce on partners’ web sites.
28You can also read