Field-based estimation and modelling of distributed groundwater recharge in a Mediterranean karst catchment, Wadi Natuf, West Bank ...
←
→
Page content transcription
If your browser does not render page correctly, please read the page content below
Hydrol. Earth Syst. Sci., 24, 887–917, 2020
https://doi.org/10.5194/hess-24-887-2020
© Author(s) 2020. This work is distributed under
the Creative Commons Attribution 4.0 License.

Field-based estimation and modelling of distributed groundwater
recharge in a Mediterranean karst catchment, Wadi Natuf,
West Bank
Clemens Messerschmid1,2 , Martin Sauter2 , and Jens Lange1
1 Hydrology,   Faculty of Environment and Natural Resources, University of Freiburg, Freiburg, Germany
2 Chair   of Applied Geology, Geoscience Center, University of Göttingen, Göttingen, Germany

Correspondence: Clemens Messerschmid (clemensmesserschmid@yahoo.de)

Received: 17 June 2018 – Discussion started: 25 June 2018
Revised: 14 November 2019 – Accepted: 2 December 2019 – Published: 26 February 2020

Abstract. While groundwater recharge is one of the most            eight soil moisture stations, chosen at six different geological
prominently covered subjects in hydrogeology, the spatial          formations with typical soil and LU/LC representations. The
distribution of recharge has been given relatively little atten-   main result of the model was the determination of formation-
tion, especially in semi-arid, karstic aquifers. Under condi-      specific recharge coefficients, spatially ranging between 0 %
tions of highly diverse geology, relief, vegetation and land       and almost 60 % of annual rainfall or up to 300 mm a−1 in
use, the complexity and variability of spatially distributed       Wadi Natuf’s climate. The karstified main aquifers showed
hydrological processes remains a challenge in many regions         recharge coefficients (RC) above 40 % and even the less
around the world. This is particularly true for hitherto un-       prominent slightly aquitardal local aquifers reached RC val-
gauged basins, such as Wadi Natuf, a 103 km2 large karstic         ues above 30 %. The model was separately tested on two
Eastern Mediterranean watershed in the Palestinian upstream        conceptual levels: on the level of basin form (soil moisture)
mountain and recharge area of the Western Aquifer Basin            and basin response (signatures of peak recharge and local
(WAB), which is shared with Israel in the coastal plain. In        spring discharge events) under well-controlled conditions in
this first in a series of two papers, distributed recharge is      isolated sub-catchments. In principle, our approach is appli-
estimated and represented, based on 7 years of extensive           cable in many of the scarcely gauged karstic groundwater
field observations and measurements and based conceptually         basins around the world with a highly diverse landscape and
on observable physical landscape features such as geology,         geology.
land use and land cover (LU/LC) and especially soil condi-
tions. For the first time in the WAB, a forward calculated soil
moisture and percolation model (SMSP) was set up with pa-
rameters directly gained from field observations. The model
was parameterised in a strictly parsimonious manner, as a          1   Introduction
one-dimensional model (a.k.a. “tank”, bucket or box model).
This is based on dominant hydrological processes, in par-          Knowledge about distributed recharge is important for the
ticular saturation excess in the soil column, and identifying      exploration, sustainable management, protection and equi-
patterns of linkage between different landscape features. Av-      table allocation of water resources. Acquiring recharge infor-
erage soil thickness was encountered at the range of decime-       mation remains complex and challenging for hydrogeologi-
tres, rarely above one metre. Both soil thickness and LU/LC        cal research, especially in the many ungauged basins around
features, such as terraced olive groves or forests as well as      the world and particularly in karstified aquifers, which sup-
grassland or barren rock outcrops, were found to be highly         ply about one quarter of the world’s population (Ford and
formation specific. This linkage allowed us to further sim-        Williams, 2007). One key issue of water negotiations in
plify the model and its requirements in a realistic manner for     shared groundwater basins is the spatial distribution of water

Published by Copernicus Publications on behalf of the European Geosciences Union.
888                  C. Messerschmid et al.: Field-based estimation and modelling of distributed groundwater recharge

resources in the different zones, such as the recharge zones      to make use of the more readily accessible and measurably
of an aquifer.                                                    physical basin form (Savenije, 2010) and then to differenti-
                                                                  ate landscape units according to a hydrologically meaningful
1.1   Global and specific problems in distributed                 landscape classification metric to translate form into func-
      recharge assessment                                         tion (subject of the follow-up paper by Messerschmid et al.,
                                                                  2020). For the link between physical features and basin re-
A general problem in recharge studies worldwide is that           sponse, Eder et al. (2003) and Hartmann et al. (2013) sug-
most basins remain poorly gauged or ungauged, particu-            gested the use of so-called hydrological system signatures
larly with respect to basin function, i.e. the description and    to describe emergent properties of a system – both quantita-
drivers of hydrological processes that are usually variable,      tively or qualitatively – such as flow duration curves or spring
both spatially and temporally. Such a lack of empirical and       hydrographs.
local knowledge from the field cannot readily be circum-             Most of the PUB literature, such as Sivakumar et al. (2013)
vented by evermore sophisticated modelling approaches and         and Hrachowitz et al. (2013), stressed the need for parsimony
mathematical methods. A second general problem is encoun-         in hydrological modelling, especially under the presence of
tered in karstified aquifer formations with their non-Darcian,    equifinality in calibrated parameters. For more information,
anisotropic flow fields, where data from the discharge area       see also Grayson and Blöschl (2000); Woods (2002); Siva-
cannot be readily used to infer process or parameter informa-     palan et al. (2003a); McDonnell and Woods (2004); Sivaku-
tion for the upstream recharge areas (Hartmann et al., 2012a,     mar (2004, 2008); Wagener et al. (2007); Young and Ratto
b; Dafny, 2009; Dafny et al., 2010).                              (2009) and Olden et al. (2012). Such parsimonious mod-
    The study of groundwater recharge and its spatial variabil-   els stick to the description of simple local processes and
ity in karst regions ranging from semi-arid to sub-humid can      the identification of a few realistic and observable physi-
be approached through three research venues: observations         cal parameters and hydrological drivers governing these pro-
of surface water (where available), of the saturated and of       cess (Franchini and Pacciani, 1991; Zomlot et al., 2015).
the unsaturated zone (Scanlon et al., 2002, 2006). In addition,   Sivapalan et al. (2003b) pointed out that despite the hetero-
Dörhöfer and Jesopait (1997) subdivided the field into direct     geneity of local parameters and processes, the response at
and indirect research approaches or methods (Lerner et al.,       the catchment scale is often characterised by surprising pro-
1990) – not to be confused with direct and indirect recharge      cess simplicity. Hence a small number of field observations
(see also Bredenkamp et al., 1995; Simmers, 1988; De Vries        may describe the main characteristics of a process (Seibert
et al., 2002). While direct approaches determine recharge-        and Beven, 2009), even in ungauged basins and with short
governing parameters near the surface by observing runoff,        time series data only (Juston et al., 2009; Seibert and Beven,
interflow and soil moisture, indirect approaches model the        2009; Blume et al., 2008; Nash, 1957; Dooge, 1959; Lam-
basin behaviour balancing integral measurements of the dis-       bert, 1969).
charge of springs or rivers at the catchment scale with ab-          So far, most studies have focused on runoff rather than on
straction rates and aquifer storage based on groundwater          recharge (Sivapalan et al., 2003b; Batelaan and de Smedt,
level measurements. In specific, for the Western Aquifer          2001, 2007), but there have been some notable exceptions:
Basin (WAB; see Sect. 1.3 below), such indirect approaches        for example, Aish et al. (2010) determined recharge distribu-
cannot be employed in the recharge area, where any ground-        tion in the Gaza Strip; however, here, local data on ground-
water access and thus observations in the saturated zone, like    water depth were available for the recharge zone. The bulk
drilling monitoring boreholes, are prevented due to the po-       of recharge models worldwide have been using lumped or
litical circumstances of a long-standing water conflict and       only partially distributed approaches because they do not re-
occupation. In addition, most WAB catchments carry no sur-        quire detailed spatial information, but they rather transfer in-
face water, except for occasional storm runoff events, par-       put into output by a set of equations on a basin-wide scale
ticularly in the recharge zone, such as Wadi Natuf (Messer-       (Jeannin and Sauter, 1998; Hartmann et al., 2013; Abusaada,
schmid et al., 2018). The research is left only with direct ap-   2011). This also applies to the Western Aquifer Basin.
proaches to determine deep percolation from the soil into the
bedrock, which is equated with recharge in this study (see        1.3   Existing recharge studies in the Western Aquifer
also Schmidt et al., 2014).                                             Basin (WAB)

1.2   Dealing with spatial variability                            The Western Aquifer Basin (Aujah-Tamaseeh in Arabic and
                                                                  Yarkon-Tanninim in Hebrew) is the largest, freshest and most
Hartmann et al. (2013) emphasised the need to focus on            productive groundwater basin in all of Historical Palestine,
process-based approaches; this is especially true for hydro-      spanning from the sub-humid Mt Carmel in the north into the
logical predictions in ungauged basins (PUB). In the ab-          Sinai in the south and from the West Bank mountains to the
sence of field data describing the dominant hydrological pro-     Mediterranean Sea with an area of 14 148 km2 (SUSMAQ,
cesses and functioning of a basin, it was often recommended       2003; ESCWA-BGR, 2013; see Fig. 1). The WAB is a clas-

Hydrol. Earth Syst. Sci., 24, 887–917, 2020                                      www.hydrol-earth-syst-sci.net/24/887/2020/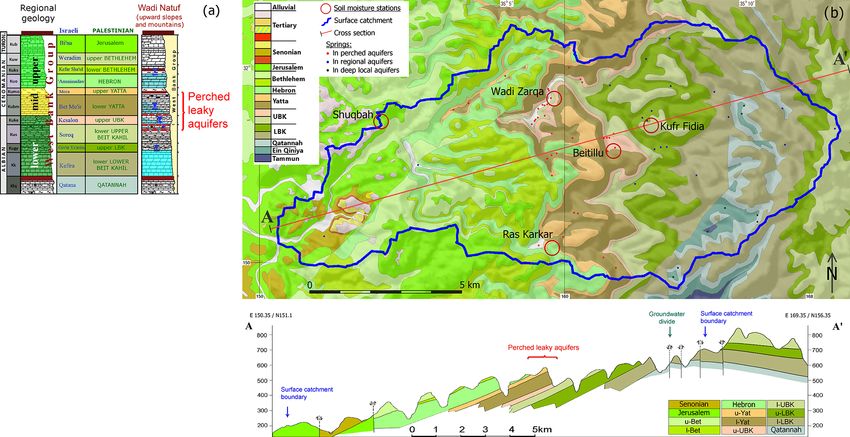
C. Messerschmid et al.: Field-based estimation and modelling of distributed groundwater recharge                             889

sical transboundary water basin, subject to negotiations over     get approaches of course contribute little to the understand-
equitable allocations under international water law (UN-GA,       ing of the spatial variability of distributed recharge, partic-
1997). The intensive use of the basin dates back to the early     ularly on a local scale, where the hydrostratigraphy is more
1960s starting with deep well drilling in the coastal plain       complex (as explained in Sect. 2). Abusaada (2011) in his
and in the adjacent foothills area. The basin rapidly became      three-dimensional integrated flow model of both plains and
one of the single largest sources of Israeli water and also has   slopes called for refined data input on land use, soil, geology
the potential to become one of the largest future sources of      and structural characteristics in the WAB (see also Martínez-
Palestinian water in the West Bank. On the other hand, the        Santos and Andreu, 2010).
WAB’s recharge and accumulation areas, which are located
in the mountains, slopes and foothills of the West Bank, re-      1.4   PUB paradox and recommendations
main relatively untouched, ungauged and unexplored, due in
large part to the continued restrictions imposed on Pales-        These findings point to the so-called PUB paradox, according
tinian water sector and infrastructure development (World         to which data-rich catchments are needed to test methods for
Bank, 2009). Within this recharge zone lies Wadi Natuf, a         data-poor environments as Seibert and Beven (2009) noted.
103 km2 large surface watershed stretching from the crest of      Their “hydrologically intelligent choice”, focused on the cor-
the West Bank mountains, which is north of Ramallah, down         rect interpretation of the dominant process features and on
to the Green Line (that separates Israel from the Palestinian     keeping observations at the necessary minimum, for reasons
West Bank under Israeli military occupation; see Sect. 2).        of practicality (e.g. measurement costs and field accessibil-
   Also in the Western Aquifer Basin, the preferred choice        ity). Such an intelligent design remains a learning process
of most of the existing studies were fully lumped mod-            starting with insufficient data and adding data as required by
els. This was done primarily to avoid problems with spa-          the application (Binley and Beven, 2003; Seibert and Beven,
tial differentiation and over-parameterisation (Goldschmidt       2009). In order to improve the conceptual realism, Pomeroy
and Jacobs, 1958; Guttman et al., 1988; Guttman and Zuker-        (2011) summarised three principle aims: to demonstrate the
man, 1995; Guttman, 2000; Berger, 1999; Abusaada, 2011;           value of observations, to reduce the reliance on calibration
and Abusaada and Sauter, 2017). Some researchers cre-             and to enhance the capability to predict based on process un-
ated partially distributed models. Sheffer (2009) and Shef-       derstanding. In addition, Beven and Kirkby (1979) suggested
fer et al. (2010) for example applied a distributed basin-wide    a three way compromise between (a) the advantages of model
recharge model to the WAB, which however only distin-             simplicity, (b) the complex spatial variability of basin hydro-
guished coarsely between two units: permeable carbonatic          logical response and (c) the economic limitations on field pa-
formations and less permeable, chalky or marly rock outcrop.      rameter measurements.
In addition, crucial model parameters, such as soil character-       To summarise, firstly, only one of the three general venues
istics, were taken from the literature (Dingman, 1994), not       to estimate recharge (Scanlon et al., 2002) are applicable to
gained from in situ findings in the field (see also Dvory et      Wadi Natuf: the saturated zone is inaccessible for field mea-
al., 2016; Weiss and Gvirtzman, 2007; Schmidt et al., 2014).      surements and observations, and surface water bodies are ab-
Truly spatially distributed and field-based approaches so far     sent (see Sect. 2). Secondly, the severe lack of primary em-
are restricted to studies on the local scale of less than 1 km2   pirical field data cannot be circumvented by evermore so-
(Frumkin et al., 1994; Lange et al., 2003, 2010; Arbel et         phisticated advances in modelling. Therefore, thirdly, new
al., 2010; Steinmann, 2010; Grodek et al., 2011). However         surface- and process-based direct methods are called for that
these studies mainly focussed on runoff rather than recharge.     are firmly based in field observation and measurements of
Sprinkler tests on a plot scale (10 m × 18 m) by Lange et         observable features and that find ways to conceptualise, de-
al. (2003) pointed to the importance of soil saturation excess    scribe, classify and measure the spatially variable and com-
for surface runoff and recharge. Similar observations were        plex recharge processes while simultaneously adhering to the
published by Ries et al. (2015, 2017) in the neighbouring         goal of parsimony and avoiding exhaustive calibration asso-
Eastern Aquifer Basin (EAB) that drains towards the Jordan        ciated with the problems of equifinality.
Rift Valley and the Dead Sea.
   The so-called “object-oriented” recharge model of the          1.5   Aims, motivation and approach
WAB by Hughes and Mansour (2005) and Hughes et
al. (2008) separated runoff, spring flow, soil infiltration and   The objective of this study is to investigate spatially dis-
deep percolation (recharge) into individually calculated com-     tributed recharge in a largely ungauged karst aquifer catch-
partments. At first, each compartment had a high spatial res-     ment in order to develop formation-specific recharge coeffi-
olution but then was lumped into an integrated basin-wide         cients (RC) in the central WAB for the first time. The under-
model. Moreover the entire model input was based on a pri-        standing of the process and physical model parameters were
ori estimated parameters, not local field knowledge, which        based on specifically targeted measurements (McDonnell et
has been found to often result in little consistency (Ka-         al., 2007) and firmly grounded on fundamental physical laws
pangaziwiri et al., 2012). Such simplified, lumped water bud-     and theories, as well as local knowledge of the observable

www.hydrol-earth-syst-sci.net/24/887/2020/                                       Hydrol. Earth Syst. Sci., 24, 887–917, 2020
890 C. Messerschmid et al.: Field-based estimation and modelling of distributed groundwater recharge
landscape and climate controls of hydrological processes as
stressed by Sivapalan (2003) and Hrachowitz et al. (2013).
A parsimonious soil and epikarst reservoir or tank model for
laterally disconnected one-column elements (Schmidt et al.,
2014; Hrachowitz and Clark, 2017) was performed in daily
steps and based on observable physical features and empir-
ical field measurements for core parameters of the soil wa-
ter budget, thus avoiding the need for retrofitting. The model
was examined and tested in a novel combination of both
quantitative and semi-qualitative basin observations. On the
one hand, at the level of basin form (physical soil parameters)
the modelled soil moisture content was compared to the field
measurements. On the other hand, on the level of basin re-
sponse, the signatures of measured spring flow events (peak
discharge periods) were compared to the modelled periods
of deep percolation (DP). Finally, the model results of spa-
tially distributed annual recharge coefficients were compared
to literature results from former recharge studies in the WAB.
2 Study area
Wadi Natuf is a 103 km2 catchment stretching from the
mountain plateau at the crest of the West Bank at
816 m above sea level (a.s.l.) down to its foothills at
138 m a.s.l. (Fig. 1). In the eastern mountain region, the to-
pography is characterised by rocky mountain crests and high
plains with steep terraced slopes towards the central Wadi
Natuf further west. Here, in the midstream catchment, un- Figure 1. Western Aquifer Basin (WAB) overview and Natuf loca-
dulating hills with deeply incised ephemeral rivers (wadis) tion map. Wadi Natuf (in yellow) lies in the uphill recharge zone
dominate, descending further down to the gentle slopes and (shaded green) of the groundwater of the Western Aquifer Basin,
plains in the lower Natuf region near the outlet of the main whereas the easternmost part of its surface catchment belongs to the
Western Aquifer Basin. Isohyets indicate a climate in Wadi Natuf
wadi bordering the coastal plain. Within the Natuf catch-
ranging from semi-arid to sub-humid. The two former principle
ment, all sub-aquifer formations of the WAB and some of the
spring outlets of the WAB have all but dried up, due to excessive
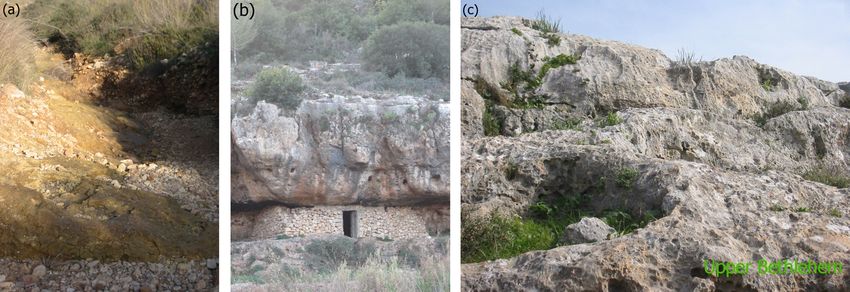
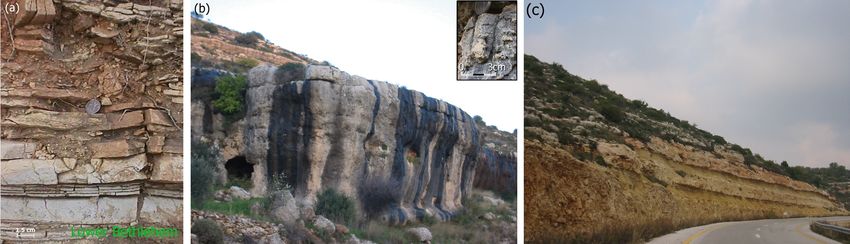
overlying cover series crop out (Fig. 2a, b) and are therefore pumpage in Israel. Four evapotranspiration (ET) stations around
exposed to direct infiltration. The climate is typically East- Wadi Natuf were complemented by two automatic weather stations
ern Mediterranean with precipitation occurring from Novem- in this study. Sources: modified after Sheffer et al. (2010), SUS-
ber to April, monotonously rising from the semi-arid western MAQ (2001), Abusaada (2011) and ESCWA-BGR (2013).
foothills (500–600 mm a−1 ) to sub-humid conditions in the
eastern mountains (above 600 mm a−1 ). Wadi Natuf drains
westwards towards the Mediterranean Sea and has a remark- are divided by some 100 to 150 m thick marly, chalky and
ably low overall runoff coefficient of approximately 0.11 %, carbonatic series of the so-called “Middle Aquitard” (Bar-
mainly due to high percolation rates into the bedrock un- tov, 1981; SUSMAQ, 2002; ESCWA-BGR, 2013). However,
der shallow soils and due to considerable transmission losses closer scrutiny reveals that both the regional aquifers can
(Messerschmid et al., 2018) into the karstified carbonate ma- be further subdivided into more permeable and more im-
terials underlying the wadis. permeable sections (Fig. A3a, A3c). Also the regional Mid-
Conventionally and on a regional scale, the WAB is subdi- dle Aquitard can be subdivided into an aquitard or even
vided into two main regional aquifer units of mostly karsti- aquiclude section of yellow soft marl (upper Yatta formation
fied carbonates. The “Lower Aquifer” is of Lower Albian age or u-Yat) and a more carbonatic, partly karstified intermedi-
(ca. 113–106 million years), and the “Upper Aquifer” is of ate perched aquifer horizon (lower Yatta formation or l-Yat;
Upper Cenomanian–Turonian age (ca. 95–89 million years). see Fig. 2a) (Messerschmid et al., 2003a, b). Lower Yatta
Together they make up around two thirds (64.4 %) of the is underlain by another perched aquifer (upper Upper Beit
outcrops in Wadi Natuf (Fig. 2b). The remaining third of Kahil formation or u-UBK), which consists of a cliff-forming
the catchment consists of aquitards from marl and chalk. very permeable reefal limestone series (Fig. A3b). The third
According to this conventional view, the regional aquifers perched aquifer on a local scale is formed by the top of lower
Hydrol. Earth Syst. Sci., 24, 887–917, 2020 www.hydrol-earth-syst-sci.net/24/887/2020/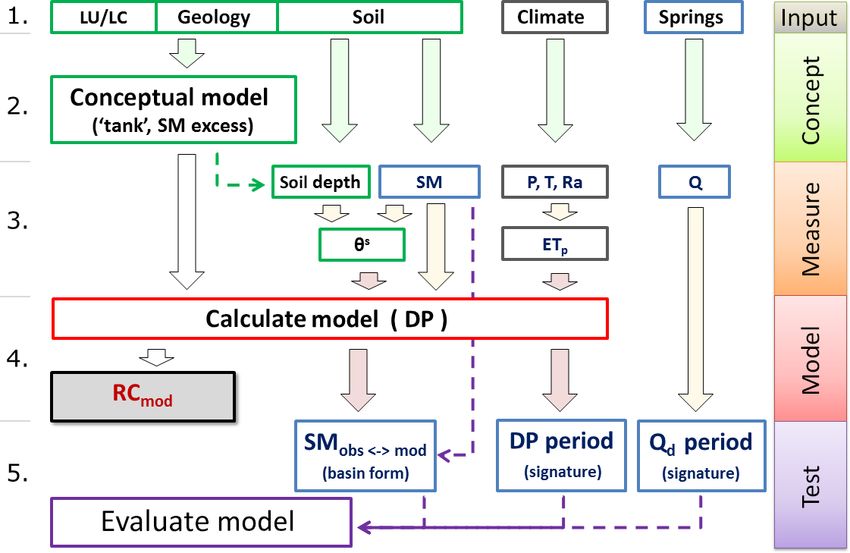
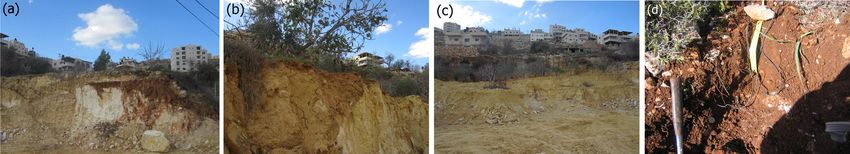
C. Messerschmid et al.: Field-based estimation and modelling of distributed groundwater recharge                                          891

Figure 2. Stratigraphic column (a) and geological relief map with cross section (b). (a) The stratigraphic column shows the regional hydros-
tratigraphy of the lower, middle and upper West Bank group (known in Israel as the Judea group) with only two aquifers (left side), such as
the Lower Aquifer (“lower” group) and the Upper Aquifer (“upper” group), separated by the yellow “mid” group (left side). On the local
scale, they can be differentiated into several sub-units of aquiferal and aquitardal series with three separate perched aquifers in the middle,
e.g. the lower Yatta formation, upper UBK formation and the top of lower UBK formation (abbreviated to l-Yat, u-UBK and top of l-UBK).
The middle columns show the Israeli and Palestinian formation names. (b) The geological relief map indicates a selection of the many small
local springs, mostly fed by the perched aquifers in central Wadi Natuf (red dots), partly also locally from within the regional aquifers (blue
dots) or from the deep local aquifers (green dots). Red circles inside the map indicate the five areas of the eight soil moisture stations. The
cross section indicates the surface catchment of Wadi Natuf and, further to the west, the groundwater divide that separates the Western and
Eastern Aquifer Basins at a stratigraphically low position where the Lower Aquifer is fully eroded and the deep aquifers crop out. Sources:
stratigraphic column, modified after Dafny (2009); geological map, modified after GSI (2000, 2008); cross section: this study.

Upper Beit Kahil formation (l-UBK), a more chalky and                     tial pathways for infiltration during the early half of the win-
marly limestone series that is underlain by an impermeable                ter season (as also found by Gimbel, 2015). Soil thickness
twin marl band (Fig. A3c). The three perched local aquifers               > 1 m was only found at small agricultural plains overlying
can be found in central Wadi Natuf where they give rise to                the aquitard series such as the upper Yatta formation (u-Yat;
over 100 small local contact springs (Fetter, 1994), as shown             see Fig. A1, Table 1).
in Fig. 2b. Together, their outcrops account for about 13 %                  An important and recurring observation during the field
of the catchment area. On a regional scale, the two perched               work was a pattern where soil thickness is associated to cer-
aquifer series within Upper Beit Kahil formations are con-                tain types of both underlying bedrock lithology of formations
sidered part of the Lower Aquifer. By contrast to the perched             and to the type of land use and land cover (LU/LC); carbon-
aquifers, most other parts of the regional Lower Aquifer as               ates show thin soils, while over argillaceous rock, thicker soil
well as the entire Upper Aquifer within Wadi Natuf are void               covers develop. Equally, soil cover over grassland and ter-
of springs.                                                               races were found thin, whereas agricultural cultivated fields
   The soil cover in Wadi Natuf consists of terra rossa,                  and garden plots were located over thick soil stratum (see
mostly with thicknesses in the decimetre range (Fig. A2, Ap-              Fig. A2 and Table 1). In other words, typical land forms
pendix A). Although regional maps (Dan et al., 1975) indi-                and soil depths can be identified for the different geologi-
cate small portions of rendzina in the central part (near Ras             cal formations in Wadi Natuf, such as the perched aquifers
Karkar, Fig. 2b), no such types of soils were found during                (l-Yat, u-UBK and top l-UBK) and the Hebron (Heb) and
intensive field reconnaissance and measurement campaigns.                 Jerusalem formations (Jerus) of the Upper Cenomanian–
The soils were found to have high silt and clay contents. In              Turonian main regional aquifer (see also Appendix D). This
the dry season, the soils disintegrate into fist-size crumbs and          association of soil depths with other land features will be sub-
form desiccation cracks. These cracks can act as preferen-

www.hydrol-earth-syst-sci.net/24/887/2020/                                                 Hydrol. Earth Syst. Sci., 24, 887–917, 2020
892                   C. Messerschmid et al.: Field-based estimation and modelling of distributed groundwater recharge

ject to a follow-up paper on regionalisation, Messerschmid et      approach was developed and applied for similar semi-arid
al. (2020).                                                        conditions (e.g. Ryu et al., 2008) and in comparable areas,
   A prevailing feature in Wadi Natuf, as in most of the           such as the adjacent EAB (Schmidt et al., 2014). ETp is cal-
Mountain Aquifer (Schmidt et al., 2014), was the finding of        culated by Eq. (1).
a thick unsaturated zone in the karstified aquifers up to hun-
dreds of metres thick underlying thin soil cover; hence, all       ETp = 0.0023·Ra·(Tmean +17.8)·(Tmax −Tmin )0.5 ·λ−1 , (1)
percolation from the soil into the underlying bedrock was          where Ra is the daily sum of extra-terrestrial solar radiation
considered as deep percolation.                                    (MJ d−1 ), Tmean is the daily mean air temperature (calculated
                                                                   as average of daily minimum and maximum temperature in
                                                                   ◦ C), T
                                                                           max − Tmin is the daily temperature range, and λ is the
3     Methodology                                                  latent heat of vaporisation in order to obtain ETp in mm d−1 .

This study presents a distributed groundwater recharge             3.2   Hydrological measurements: soil moisture and
model for a karst catchment based on extensive hydrological              springs
field measurements of three types, namely climatic drivers
(like precipitation, radiation and temperature), hydrological      Soil moisture (SM) content was monitored at eight different
processes (such as soil moisture saturation and spring flow)       stations over a period of 7 years (see Table 1). Due to bud-
and physical features (soil characteristics, geology and land      get limitations and reduced field accessibility (particularly
use/land cover), as shown in Fig. 3. The forward-calculating       during the height of the Second Intifada), the measurements
model is parsimonious, i.e. based only on daily precipita-         were kept at a minimum (as recommended by Beven, 2002,
tion and evapotranspiration (ET; as well as temporally sta-        and by Seibert and Beven, 2009; see Sect. 1.2, 1.4). It was
ble location-specific soil parameters) in order to translate       therefore decided to increase the number of different SM lo-
soil moisture saturation into deep percolation, which here         cations and to decrease the duration of measurements at each
is equated with recharge (Schmidt et al., 2014). The one-          station (ranging between 1 and 4 years, see Table 1). All in
dimensional soil water balance model was designed as a soil        all, 13 years of soil moisture measurements were carried out
tank with an upper boundary towards the atmosphere and a           at the eight locations. The locations were chosen at places
lower boundary towards the underlying karstified bedrock.          with minimum slope and without lateral water input from
                                                                   upslope overland runoff.
3.1    Climatic drivers: rainfall and evapotranspiration              The target of the soil moisture measurements was daily
                                                                   time series data of the overall available water content (θ ).
The measurement period for precipitation and evaporation           SM was measured at different depths by each sensor and
spanned over nine seasons, from 2003–2004 until 2011–              then normalised to total water content of the respective soil
2012. A complete set of weighted area rainfall data for            column. Initially two sets of frequency domain reflectometry
the five sub-catchments (Fig. 4) was obtained from Messer-         soil moisture sensors (ML2-Theta probes, Delta-T Devices
schmid et al. (2018), originally measured in 5 min steps at 10     Ltd.) were used. Due to malfunction and vandalism they were
stations distributed evenly in upper, central and lower Wadi       replaced by two ECH2O loggers (EM50, Decagon Devices
Natuf. The automated rain gauges (tipping buckets) with Ei-        Inc.), each connected to two or three sensors (5TM, Decagon
jkelkamp loggers were run in event mode. The model in this         Devices, Inc.) that measured volumetric water content (as
study used the weighted area rainfall precipitation at the five    a percentage) based on the difference of dielectric permit-
sub-catchments in daily steps (see Table 2 and Fig. 4).            tivity between water and soil matrix. The loggers recorded
   Daily minimum and maximum temperature and solar ra-             in 30 min intervals. The readings were averaged into daily
diation data were collected at two automatic weather stations      values for the purpose of the model. The sensor installation
(AWSs) for the calculation of potential evaporation (Fig. 4).      depth varied between a minimum of 5 cm and a maximum of
The readings were taken with two automatic weather stations        75 cm at the thickest soils (Table 1). Technical problems with
from Campbell Scientific with a CR10X data logger and an           the equipment are discussed in Appendix B (Tables B1–B3).
HMP45D (Y3520067) sensor. One station was installed up-               In order to better relate the spatially discrete SM stations
stream at Birzeit University at the mountain crest; the down-      to the overall catchment area, soil samples (150–550 g) were
stream station at Shibteen well no. 4 was located at the transi-   collected randomly at different depths and different times;
tion between the foothills and coastal plain to the west. Miss-    the absolute water content of the samples was determined by
ing records were filled up with corrected temperature data         oven weighing at the Birzeit laboratory. These results also
from Jerusalem (IMS, 2017), which represented intermedi-           served to reconfirm and calibrate the sensor readings.
ate values between the relatively cool conditions in Birzeit          Each of the sensor readings of volumetric water content
and the relatively warm conditions downstream in Shibteen.         (as a percentage) from different soil depths was multiplied
   Potential evapotranspiration (ETp ) was calculated by the       with the thickness of the individual soil sections (in metres)
formula of Hargreaves and Samani (1985). The Hargreaves            and then combined to an overall water content of the soil

Hydrol. Earth Syst. Sci., 24, 887–917, 2020                                       www.hydrol-earth-syst-sci.net/24/887/2020/
C. Messerschmid et al.: Field-based estimation and modelling of distributed groundwater recharge 893
Figure 3. Conceptual flow chart of the work steps for the model. First row: measured and observed input such as climate, spring flow,
land use and land cover (LU/LC), etc. Second row: conceptualisation of the one-reservoir tank model. Third row: actual measurements of
daily values for soil moisture (SM), precipitation (P ), temperature (T ), solar radiation (Ra), spring flow (Q), etc.. Fourth row: modelling of
deep percolation (DP) and transformation into annual recharge coefficients for each of the modelled formations (RCmod ). Last row: model
evaluation by different tests such as quantitative comparison between observed and modelled soil moisture contents (SMobs and SMmod ) and
semi-qualitative comparison between periods of percolation events and peak discharge at the daily measured springs.
column (as millimetres of the water column within the soil).
The continuous soil moisture hydrographs were then anal-
ysed separately for each location, resulting in a typical and
annually returning minimum (SMmin ) and maximum water
content (SMmax ) as temporally stable but spatially distributed
parameters. The representativeness of each SM station was
further confirmed by the many hand-collected SM samples
from the same formations but at other locations. The maxi-
mum soil water storage capacity or storage capacity at satu-
ration (θ s ) was then calculated for each SM station and ac-
cording to Eq. (2).
θ s = (((SMmax, 1 − SMmin, 1 ) · b1 ) + ((SMmax, 2 − SMmin, 2 )
· b2 ) + ((SMmax, 3 − SMmin, 3 ) · b3 ))) · b6 ,
Figure 4. Drainage and measurement stations. Main branches of
(2)
the northern and southern branches of Wadi Natuf. Soil moisture
(SM) stations at Shuqbah (Shu), Wadi Zarqa (WZ), Beitillu (Bet), whereby SMmax and SMmin were used as the measured wa-
Kufr Fidiah (KF) and Ras Karkar (RK). Daily measured springs ter content per soil segment volume (m3 m−3 ), SMmax, 1 indi-
at Beitillu and Wadi Zarqa. Automatic weather stations (AWSs)
cates the maximum water content at the first near-surface soil
at Shibteen (west) and Birzeit (east). Sub-catchments (in grey) at
section and deeper sections are indicated by successive num-
Ne’alin (west), Shibteen-1 (midstream; north), Shibteen-2 (mid-
stream; south), Ein Ayoub (southeast) and Wadi Zarqa (northeast). bers (2 and 3), and b indicates the soil thickness (in metres)
of the respective soil sections (1, 2 and 3) or the overall soil
thickness (b6 ). θ s represents the normalised effective maxi-
mum storage content in metres (or millimetres) of the whole
soil column (see Sheffer, 2009; Sheffer et al., 2010). It should
www.hydrol-earth-syst-sci.net/24/887/2020/ Hydrol. Earth Syst. Sci., 24, 887–917, 2020894 C. Messerschmid et al.: Field-based estimation and modelling of distributed groundwater recharge
be noted that θ s was derived directly from the field-measured
values of SMmax and SMmin , the range of which indicates the
maximum amounts of soil water available for evapotranspi-
ration before percolation sets in (see also Sects. 3.4 and 5.1
and Fig. 5).
The sensor readings included brief periods of water stor-
age beyond field capacity, such as water in desiccation cracks
(especially in heavy storm events during late autumn and
early winter); these peak levels can be noticed as brief spikes
of SM readings (here indicated as SMpeak ) above the oth-
erwise stable levels of annually recurring SMmax . It should
however be emphasised here that the model in its daily bud-
gets fully accounts for these additional water amounts (see
Sect. 4.1 and Appendix B).
Daily spring flow measurements were used as a model
Figure 5. Parsimonious SMSP model of “one-reservoir saturation
check. This high-resolution spring flow record, the first for
excess” (modified after Sheffer et al., 2010). Parameters and drivers
the WAB mountains, enabled the detection of signatures, i.e.
(top) were field measured for every station and model. The avail-
the temporal patterns of low and peak discharge for com- able water content, shown as θ (between SMmax and SMmin ), is
parison with simulated recharge by the soil moisture satura- seasonally variable but location specific. Discounting runoff, soil
tion and percolation (SMSP) model. From the large number water removal is accounted for in two ways: as SM saturation (red
of over 100 springs discharging from the perched aquifers, line) increases (above SMmin ), evapotranspiration (ET) is triggered
five springs from two spring groups (Fig. 4) were selected first; when θ s reaches SMmax , deep percolation (DP) is initiated.
that can be considered representative for the total spring Precipitation (P ) was measured; potential evapotranspiration was
group discharge, due to their position and proximity to the calculated from weather station data and transformed into actual
soil moisture stations. At these springs, daily flow measure- ET values (Sect. 3.2).
ments were carried out continuously by metering (by hand)
throughout almost the entire period (spring data coverage;
see Appendix C, Table C1). Three of these springs belong to a soil thickness matrix for different LU/LC types and lithos-
the so-called “Beitillu spring group”; the two other springs tratigraphic units (see also Appendix D and Table D1).
belong to the “Wadi Zarqa spring group” (near the Wadi
3.4 Parsimonious soil moisture saturation and
Zarqa SM station, see Figs. 2b, 4). Their representativeness
percolation modelling: design and processes
is discussed in Appendix F.
The SMSP model implies a classical soil moisture balance
3.3 Model parameterisation (soil thickness) approach; soils dry up to minimum water content during
summer and then accumulate and store water with succes-
sive rainfall during autumn and winter. SM content above
The soils in Wadi Natuf were found to consist only of one SMmin is subject to direct evaporation and plant transpiration
prevailing soil type, terra rossa (see Sect. 2); field investiga- and has to be deducted in daily steps from the SM content
tions, sampling and granulometric lab tests showed that the accumulated successively by precipitation. When soil con-
soil was mostly silty clayey, with some samples also show- ditions reach saturation (full effective storage capacity; θ s ),
ing higher clay contents (Messerschmid et al., 2018). This deep percolation into the bedrock is triggered, here equated
allowed for an important simplification for the soil moisture with groundwater recharge (Fig. 5). ETa is limited down-
saturation and percolation model to only account for one uni- wards by available water content (θi ) and upwards by ETp .
form soil type throughout the study area. By contrast, soil
thickness (b) plays an important role as a quantifiable param-
ETpi+1 if (θi + Pi+1 ) ≥ ETpi+1
eter in the SMSP model. Therefore it was necessary to deter- ETai+1 = (3)
θi + Pi+1 if (θi + Pi+1 ) < ETpi+1 ,
mine the typical soil thicknesses at the different geological
formations and LU/LC types and to ensure that the selected where θi is available soil moisture (in millimetres), P is daily
soil moisture measurement plots were representative for the rainfall (in millimetres), ETa is the daily actual evapotranspi-
typical conditions of a given formation. The spatial distribu- ration (in millimetres) and ETp is the daily potential evapo-
tion of soil thickness was established by digging up the soil transpiration (in millimetres).
down to the soil–rock interface. The soil thickness differed All additional rainfall infiltrating from the surface and be-
between sampling locations, which led to variable sampling yond the daily evapotranspiration losses can either be added
depths down to the respective horizon, where in situ lithology to the available water storage or, when limits of θ s are ex-
prevailed. The results of the soil depth survey are shown in ceeded, considered to percolate into the bedrock and repre-
Hydrol. Earth Syst. Sci., 24, 887–917, 2020 www.hydrol-earth-syst-sci.net/24/887/2020/C. Messerschmid et al.: Field-based estimation and modelling of distributed groundwater recharge 895
sent recharge.
0 if (θi + Pi+1 − ETai+1 ) ≤ θmax
DPi+1 = θi + Pi+1 − ETai+1 − θmax , (4)
if (θi + Pi+1 − ETai+1 ) > θmax
2007–2008 to 2008–2009
θi+1 = θi + Pi+1 − ETai+1 − DPi+1 , (5)
where θmax is the effective maximum soil water storage and
Uncultivated
DP is daily deep percolation, i.e. groundwater recharges (in
Ras Karkar, terraces
100/200
millimetres). The testing of the model was reached in two
RK-E
4.2 %
112.5
16.8
and lowest recurring soil water contents measured in the field at different sensor depths (summed up in millimetres over the entire soil column or averaged as a percentage of the volumetric share
400
129
127
independent ways, by a quantitative comparison of modelled
2
Heb
and observed SM values and by a semi-qualitative compari-
2005–2006 to 2008–2009
son of recharge periods (DP events) with times of observed
spring discharge peaks. In other words, one examination was
done on the reliability of the model to produce the observed
θpeak is a brief, episodically occurring available water storage above saturation storage capacity (θ s ). The soil moisture (SM) values SMmax and SMmax represent the highest
physical feature of SM, and the other was done by using the
50/140/320
hydrologic response signature of spring flow responding to
RK-W
Rocky
recharge.
4.2 %
112.5
16.8
400
129
119
4
3.5 Annual and mean recharge coefficients
Abandoned
2006–2007
50/75/175
First, the annual DP rates (mm a−1 ) are divided by annual sta-
0.5 %
232.5
KF-E
tion rainfall delivered annual recharge coefficients (as a per-
940
237
234
4.7
1
centage) for each modelled SM station. Secondly, DP rates Kufr Fidiah, field
2005–2006 to 2006–2007
from the model for the different stations representing differ-
ent formations (Table 1) were referred to the outcrop sizes
Top of l-UBK
of the respective formations in Wadi Natuf to obtain annual
recharge amounts (R; in m3 a−1 ). Then, thirdly, at each sta-
130/180/390
tion (or for each formation) the seven different annual RC
Cultivated
10.5 %
values were transformed into an average recharge coefficient
KF-W
68.25
650
253
185
232
(RCavg ). This simplified approach assumes that our 7-year 2
rain observation period fairly represented the long-term av-
Upper terrace Greenhouse
2004–2005
erages and inter-annual distribution patterns of precipitation
170/360
WZ-gh
(see Sect. 3.1 and Appendix E). In order to verify the repre-
16.1 %
Wadi Zarqa, fields
64.4
67.5
400
132
sentativeness of our 7-year observation period for long-term
93
1
Table 1. Soil moisture measurement data by location (in mm and %).
conditions (> 30 years) and since no long-term precipitation
420/660/750
record for Wadi Natuf was available, the temporal precipita-
2005–2006
WZ-upT
u-UBK
50.05
6.5 %
121.5
tion patterns were compared on the level of the entire WAB
770
172
175
1
and based on long-term records from HSI (2016). The com-
parison and its results are documented in Appendix E (Ta-
ble E1 and Fig. E1).
110/110/430
2003–2004
Beitillu,
gardens
l-Yat
4 Results
500
179
8%
139
149
Bet
40
1
4.1 Seasonal soil moisture patterns
2003–2004
grassland
110/190
Shuqbah,
Jerus
10 %
Shu
320
60
20
40
44
1
Table 1 presents the eight locations of soil measurements,
used for the percolation models, with their respective
bedrock formations and soil depths as well as the recurring
Hydr. seasons measured
No. of years measured
maximum and minimum soil moisture levels, from which the
of the total soil volume).
Sensor depth (mm)
maximum water storage capacity (θ s ) of each location was
Soil depth (mm)
SMmax (mm)
derived.
SMmin (mm)
SMmin (%)
θpeak (mm)
Formation
The thin soils in Wadi Natuf showed a low water retention
Land use
θ s (mm)
Symbol
capacity (Sect. 4.2, Fig. 6); in summer, soil usually dried up
rapidly to an SM content between 5 % and 10 %. Table 1 also
www.hydrol-earth-syst-sci.net/24/887/2020/ Hydrol. Earth Syst. Sci., 24, 887–917, 2020896 C. Messerschmid et al.: Field-based estimation and modelling of distributed groundwater recharge shows two exceptions: in one case, the plot near the green- 2 months after the last major rainfall event of a given sea- houses in Wadi Zarqa (WZ-gh), some summer irrigation of son (effectively ending evapotranspiration during summer; crops cannot be excluded. However, it was assured that no see Fig. 6). irrigation took place during the crucial winter modelling pe- riod. In the second case, the extremely low moisture content 4.2 Quantitative examination of the model (by physical (SMmin of 0.5 %) at Kufr Fidiah (KF-E), was a result of van- parameters) dalism (a dug-up measurement pit with artificially reduced soil moisture at the then-exposed deeper sections of the soil Figure 6, which presents modelled and observed soil mois- cover). In any case, such low soil moisture is not representa- ture contents, indicates the performance of the soil moisture tive and the data of this station had to be taken with caution. percolation model. It should be stressed here that no calibra- In addition, the soil depth of almost 1 m encountered at KF-E, tion of the model was performed. an abandoned agricultural plot, overgrown with bushes, is a Some of the readings show a mismatch between observed rare exception, and according to our soil depth survey it is not and modelled SM values; these periods are indicated as a representative for usual conditions at the top of l-UBK for- dashed green line, where recorded soil moisture exceeded mation (compare soil depth matrix, Appendix D, Table D1). modelled SM values. In some cases, recorded moisture lev- In contrast to minimum recorded SM values, maximum els even surpassed accumulated seasonal rain (which clearly moisture levels showed a more consistent pattern, which is hinted to equipment failure of the SM sensors). Both issues important because soil saturation is crucial for the SMSP are further discussed in Sect. 5 and Appendix B. However, model. In line with our saturation excess model (Sect. 3.4), it a comparison between observed and modelled soil moisture should be noted that once this maximum soil moisture level (Fig. 6) showed similar performance, with an average Nash– was reached, it remained stable for days and weeks and did Sutcliffe efficiency (NSE) coefficient of 0.73 for all stations, not rise any further. Throughout the measured period and at except RK-E (which had a negative coefficient of −0.35 and almost all stations, it was found that maximum soil moisture was excluded from further analysis). In Shuqbah and Beit- is spatially highly variable and can be associated with the lo- illu, NSE was found between 0.8 and 0.87; in Wadi Zarqa it cal soil depth, as apparent from Table 1 and discussed below. was 0.63; at KF-W and KF-E it was between 0.79 and 0.96; Another special case however is the occurrence of brief pe- and at the RK-W station it was at 0.7 (Appendix B, Table B3; riods with extreme moisture above saturation storage capac- note that the stations names ending with “-W” and “-E” are ity. They only occurred during extreme storms or during the the western and eastern regions of the area). early winter months, when desiccation cracks enabled pref- erential flow and rapid infiltration into deeper soil layers (see 4.3 Semi-qualitative examination of the model (by also Appendix B) and lasted usually less than 1 d. spring flow signatures) Spatially, the distribution of seasonal soil saturation can be differentiated as follows: at locations with thinner soil For an additional check, we compared periods of deep perco- cover, such Ras Karkar (RK), Wadi Zarqa greenhouses and lation with the signature periods of peak spring discharge, as especially in Shuqbah (Shu), full saturation (θ s ) was usually shown in Fig. 7. In most stations, recharge occurred during a reached by mid or late November. In the thicker soils, such as period between 11 and 21 d per year. During very wet win- in Kufr Fidiah and the Wadi Zarqa upper terrace (WZ-upT), ters it occurred at a maximum of up to 31 d per year (e.g. in saturation was usually reached later, by mid-December. In WZ-gh); during very dry winters a minimum of only 5 d per most years, full saturation conditions prevailed during Jan- year (e.g. KF-E) were recorded. Precipitation thresholds that uary and February, on rare occasions until April. The sea- triggered DP varied between different years and SM stations, son 2005–2006 experienced the most intensive rain event of e.g. from 74 mm of accumulated seasonal precipitation as a the entire measurement period, occurring very late in win- minimum (in Shu) to 470 mm as the highest threshold (in ter, between 1 and 5 April 2006 (Messerschmid et al., 2018). KF-E). For the different years, the gaps between average Figure 6 gives an example for the time series of observed station thresholds ranged between 206 mm (in 2004–2005) and modelled soil moisture (station RK-W). As can be seen, and 396 mm (in 2008–2009), with a multi-annual mean of recharge (deep percolation) only occurred when full satura- 290 mm. tion was reached and in the form of relatively distinct events Figure 7 shows a very close match of temporal patterns. of a few days per year, depending on the high-resolution tem- Observed spring flow in the local perched aquifers responded poral rain distribution of a given season. with almost no delay, usually within 1 d after the first mod- In each year the level of calculated soil moisture was the elled recharge event. This demonstrates both the karstic na- result of a unique set of different climatic drivers and of ture of the aquifers with rapid flow connections and the very location-specific parameters and physical features (and thus a local recharge conditions on the isolated hillsides. result of different overlapping processes). Yet, it could be ob- The two most productive springs of the respective groups served that the levels of available soil moisture (i.e. the water were Salem (Wadi Zarqa spring group) and Al-Qos (Beitillu content above SMmin ), usually dropped to zero within 1 or spring group). Average spring flow was between 1.3 (Bibi) Hydrol. Earth Syst. Sci., 24, 887–917, 2020 www.hydrol-earth-syst-sci.net/24/887/2020/
C. Messerschmid et al.: Field-based estimation and modelling of distributed groundwater recharge                                   897

                                                                       4.4    Summary of model results on annual levels

                                                                       The annual percolation rate did not only depend on the an-
                                                                       nual precipitation, but it also depended on its seasonal dis-
                                                                       tribution. For most years, a rise in annual recharge coincided
                                                                       with a rise in total annual rainfall, as shown in Fig. 8. The
                                                                       wettest winter (2004–2005 with a rainfall of 742 mm a−1 )
                                                                       showed the highest recharge in each of the stations. How-
                                                                       ever, the driest year (2007–2008 with 496 mm a−1 ) did not
                                                                       generate the lowest recharge, due to the seasonal distribution
                                                                       of very strong precipitation events that triggered high rates
                                                                       of percolation. This disconnection demonstrated the neces-
                                                                       sity to first calculate and model recharge in daily time steps
                                                                       in order to account for the event character of temporal rainfall
                                                                       distribution (Sheffer et al., 2010; Cheng et al., 2017) before
                                                                       these results can then be used for annual recharge calcula-
                                                                       tions. It is also important to note the strictly reciprocal rela-
Figure 6. Comparison of observed and modelled available soil           tionship between soil thicknesses and recharge coefficients.
moisture at Ras Karkar West (RK-W) from 2005–2006 to 2008–             At all stations except for one (WZ-upT), the thinnest soils
2009. Maximum water storage capacity (θ s ; at 112.5 mm) of the        showed the highest recharge, and the thickest soils showed
modelled moisture level (red) matched well with the observed max-      the lowest recharge (see Fig. 8). This general pattern con-
imum moisture (green). Brief periods of dashed green lines show        firmed our conceptual approach that closely linked soil depth
questionable and erroneous soil moisture readings (see also Sect. 5    with recharge.
and Appendix B). Deep percolation (triggered above θ s ) is indi-         Figure 8 plots different measurement stations with ascend-
cated as a dark-blue column (bottom of the graph); daily rainfall is
                                                                       ing soil depths on the x axis against annual recharge rates
indicated as blue columns (at the top).
                                                                       on the y axis with a marked and almost consistent linkage
                                                                       between the two (except for WZ-upT). This pattern of as-
and 12.4 (Qos) m3 d−1 . The smallest spring (Bibi) had a max-          sociation forms the basis of our extrapolation and attribution
imum discharge of 9 m3 d−1 , while the largest (Al-Qos) had            approach for entire formations and their recharge coefficients
one of 78 m3 d−1 . Both values were approximately 6 times              (for the representativeness of the soil depths at our SM sta-
larger than annual averages. Every slight rise of the observed         tions, see Appendix D, Table D1).
daily spring flow (by as low as 8 % of the amount of av-
erage discharge) was connected to simulated deep percola-
tion or recharge (Fig. 7). Comparing the dates of peak spring          5     Discussion
flow with that of DP events, a complete congruence of the
respective dates was apparent. This analysis was performed             5.1    General approach of process representation
for the period until September 2009, during which all springs
had been measured reliably (see Appendix C, Table C1). All             Our results demonstrate that even in ungauged basins a re-
days with more than 1 m3 d−1 of increase in discharge at the           alistic model of distributed groundwater recharge can be ob-
Al-Qos spring were found to show simulated percolation; at             tained through limited field observations of key parameters
Salem spring, the strongest spring in the Wadi Zarqa spring            of the complex percolation process. Unlike previous studies
group, this was true for all days with more than a 0.7 m3 d−1          in the WAB, the direct and location-specific assessment of
rise and at the ’Akkari spring for all days with an increase           water storage capacity from long-term soil moisture readings
larger than 0.66 m3 d−1 .                                              was generated as robust and realistic “local knowledge” to
   Finally, annual recharge coefficients were calculated and           determine recharge because the rate of modelled percolation
compared to literature values (see also Appendix H, Ta-                (recharge) was a direct function of SM storage, which was
ble H1). Table 2 shows annual DP rates, annual recharge                highly location specific. Since distinct land forms of LU/LC
coefficients and the average of these annual RC values (be-            and typical soil depths could be related to each geological
tween 30 % and 57 %) for the entire period, according to the           formation (Table D1), the SM plots and their RC values were
soil thickness at each station, ranging between 30 and 90 cm.          formation specific. Existing literature often only provides
                                                                       values for permanent wilting points (pwp) and field capac-
                                                                       ities (Fc), which are similar but not identical with our mea-
                                                                       sured maximum and minimum SM values. The θ s value is a
                                                                       direct measure of the mobile, available water inside the soil
                                                                       column, subject to accumulation, evapotranspiration, satura-

www.hydrol-earth-syst-sci.net/24/887/2020/                                                Hydrol. Earth Syst. Sci., 24, 887–917, 2020
898 C. Messerschmid et al.: Field-based estimation and modelling of distributed groundwater recharge
Figure 7. Signatures of peak spring flow and DP events. Yellow-shaded box: temporary increase in spring discharge caused by the cleaning
of plant roots from the access pipe at the Al-Qos spring (July 2007). Daily measured spring flow at the Beitillu spring group is shown in
red, olive and green (b). At the Wadi Zarqa group in blue and purple, daily deep percolation is shown as grey columns (upper half), and
precipitation is shown as blue columns (a).
Table 2. Annual precipitation and recharge rates (DP) modelled at representative SM locations.
Deep percolation (DP) Precipitation (P )
Year Shuqbah Bet WZ-gh WZ-upT KF-W KF-E RK-W RK-E W Centre NE SE
2003–2004 291 217 289 235 188 140 238 238 547 532 524 507
2004–2005 475 448 519 465 452 405 442 442 811 755 724 674
2005–2006 319 206 293 223 192 145 218 218 666 628 609 585
2006–2007 319 259 331 277 241 194 278 278 663 636 629 596
2007–2008 287 221 293 239 196 149 240 240 522 501 493 466
2008–2009 258 180 251 197 165 118 204 204 594 570 561 528
2009–2010 286 228 299 245 208 160 247 247 614 586 578 543
Average DP 319 251 325 269 235 187 266 266 – – – –
Average P (2003–2004 to 2009–2010) 557 601 601 601 631 631 588 588 631 601 588 557
Soil depth (mm) 320 500 400 770 650 940 400 400 – – – –
RC (DPavg /Pavg ) 57 % 42 % 54 % 45 % 37 % 30 % 45 % 45 % – – – –
The table shows area precipitation of the respective sub-catchments of the SM stations (from Messerschmid et al., 2018). West (W) uses the average rain of the Ne’alin and
Shibteen-1 sub-catchments. Centre refers to the average between Shibteen-1 and Wadi Zarqa. Northeast (NE) is the precipitation in Wadi Zarqa. Southeast (SE) represents
the average of the Shibteen-2 and Ein Ayoub catchments (Fig. 4). The daily rates of deep percolation were modelled with these area precipitation values. Minimum and
maximum values of DP are bold (WZ-gh in 2004–2005; KF-E in 2008–2009). All units are in mm a−1 , except for the soil depth (mm) and recharge coefficients (expressed as
DPavg /Pavg as a percentage).
tion and deep percolation (recharge). In reality, the processes with the generally known and expected dominant processes
of soil moisture accumulation, deficit and saturation are com- of accumulation, storage, and loss through evaporation and
plex and depth dependent. Indeed our sensors installed at transpiration from roots. It should be noted here that most
different depths indicated slightly different temporal SM dy- of our soils were only about half a metre thick or less and
namics. Deeper soil segments reacted later in the season but that even the lowermost soil segments were within the reach
arrived at a relatively stable maximum plateau value at about of most plants (Mediterranean trees, bushes and shrubs), re-
the same times as the shallower sensors. On the other hand, sulting in a low retention capacity. Our calculation method
they dried up at a slower pace in summer. This was in line of adding up the measured water contents of all sections ac-
Hydrol. Earth Syst. Sci., 24, 887–917, 2020 www.hydrol-earth-syst-sci.net/24/887/2020/You can also read