AGRICULTURE 2016 MARKET INTELLIGENCE REPORT - GREENCAPE
←
→
Page content transcription
If your browser does not render page correctly, please read the page content below
Agriculture
–
2016
Market Intelligence Report
–
2 Agriculture: Market Intelligence Report 2016
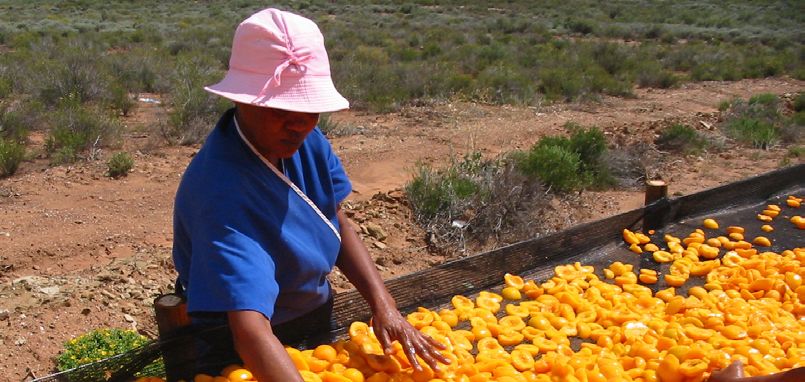
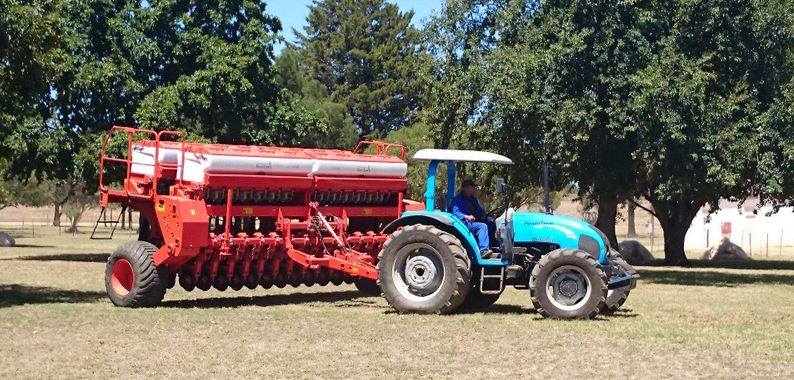
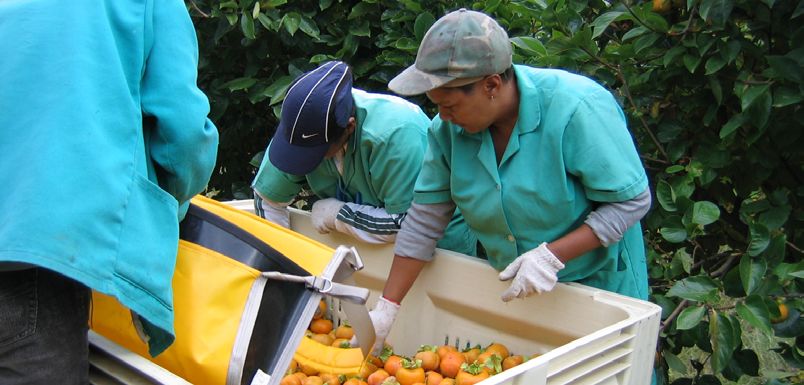
GreenCape
GreenCape is a non-profit organisation that supports and
promotes the green economy - low carbon, resource efficient and
socially inclusive - in the Western Cape, South Africa. We assist
businesses and investors focusing on green technologies and
services to remove barriers to their establishment and growth.

Acknowledgements
We thank Inge Kuschke and Jannie Geyer for the time and effort
that went into compiling this Market Intelligence Report.

Disclaimer
While every attempt was made to ensure that the information
published in this report is accurate, no responsibility is accepted
for any loss or damage that may arise out of the reliance of any
person or entity upon any of the information this report contains.

Copyright © GreenCape 2016

This document may be downloaded at no charge
from www.greencape.co.za. All rights reserved.

Subscribe to receive e-mail alerts or GreenCape news,
events and publications by registering as a member on
our website: www.greencape.co.za

18 Roeland Street, Cape Town, 8001, South Africa

Editorial and review:              Cathy Pineo, Leann Cloete-Beets, Maloba Tshehla and Pieter Janse van Vuuren
Images: 			                        GreenCape, Western Cape Department of Agriculture
Cover:			                          Western Cape Department of Agriculture
Layout and design: 		              Deep Design

Agriculture: Market Intelligence Report 2016                                                                     3
Contents
Acronyms									5
List of figures									6
List of tables									7
Executive summary								8
1.         Introduction and purpose							10
2.         Sector overview								12
2.1.       Physical geography							12
2.2.       Economic overview							15
2.2.1. South African agriculture							15
2.2.2. Agriculture commodities in South Africa					                       16
2.2.3. Production trends in South African agriculture				                 17
2.2.4. Western Cape agriculture							19
2.3.       Key players								20
2.4.       Drivers of green technologies and approaches in agriculture			 21
2.4.1. Climate change and water scarcity						21
2.4.2. Environmental degradation						22
2.4.3. Market pressure and limited resources					                         22
2.4.4. Electricity cost and supply							23
3.         Policies and regulations							25
3.1.       Agriculture								25
3.2.       Water									26
3.3.       Land reform								26
3.4.       Carbon tax								26
4.         Opportunities and barriers							27
4.1.       Energy efficiency in the Western Cape’s agricultural sector			 27
4.2.       Solar PV in the Western Cape’s agricultural sector				         30
4.3.       Conservation agriculture							34
4.4.       Precision agriculture							36
4.4.1. Water efficiency								36
4.4.2. The growing market for drone technology in agriculture			          39
4.5.       Biological control								40
4.6.       Bioenergy Biogas from agricultural waste					                  42
5.         Funding and incentives							43
5.1.       Manufacturing incentives							46
6.         The Western Cape: Africa’s growing greentech hub				           47
7.         GreenCape’s support to businesses and investors				            49
Appendix A: Key role players							51
References									54

4                                                  Agriculture: Market Intelligence Report 2016
List of acronyms
AD		                 Anaerobic Digestion
ARC		                Agriculture Research Council
CA		                 Conservation Agriculture
CAGR		               Compound Annual Growth Rate
CCA 		               Customs-controlled area
CSIR		               Council for Scientific and Industrial Research
DAFF		               Department of Agriculture, Forestry and Fisheries
DFI 		               Development Finance Institutions
DWA		                Department of Water Affairs
EE		                 Energy Efficiency
EEPACS		             Energy Efficient Packhouse and Cold Stores
EIA		                Environmental Impact Assessment
ETI		                Employment Tax Incentive
FAO		                Food and Agriculture Organisation of the United Nations
GDP		                Gross Domestic Product
GHG		                Greenhouse Gas
GIZ		                Deutsche Gesellschaft für Internationale Zusammenarbeit
GW		                 Gigawatt
GWh		                Gigawatt-hour
Ha		                 Hectares
IDC		                Industrial Development Corporation
IGDP		               Integrated Growth and Development Path
IPM		                Integrated Pest Management
kW		                 Kilowatt
kWh		                Kilowatt-hour
kWp		                Kilowatt peak
LED		                Light-emitting diode
MW		                 Megawatt
MWe		                Megawatt electric
MWp		                Megawatt peak
NBI		                National Business Initiative
NDP		                National Development Plan
NDVI		               Normalized Difference Vegetation Index
NERSA		              National Energy Regulator South Africa
NGP		                National Growth Path
NWA		                National Water Act
NWRS2		              National Water Resource Strategy 2nd Edition
PA		                 Precision Agriculture
PQRS		               Power Quality and Renewable Services
PSEE		               Private Sector Energy Efficiency
PV		                 Photovoltaic
R&D		                Research and Development
RE		                 Renewable Energy
REIPPP		             Renewable Energy Independent Power Producer Procurement
RHFA		               Relatively Homogeneous Farming Areas
ROC		                Remote Operating Certificate
RPA		                Remotely Piloted Aircraft

Agriculture: Market Intelligence Report 2016                                   5
RPAS		       Remotely Piloted Aircraft System
RPL		        Remotely Piloted Licence
SSEG		       Small Scale Embedded Generation
SA		         South Africa
SANAS		      South African National Accreditation System
SARS		       South African Revenue Service
SEBAL		      Surface Energy Balance Algorithm for Land
SPDAFF		     Strategic Plan for the Department of Agriculture, Forestry and Fisheries
Stats SA		   Statistics South Africa
TAI		        Tax Allowance Incentive
TWh		        Terawatt-hour
UAV		        Unmanned Aerial Vehicles
USA		        United States of America
USD		        United States Dollar
WC		         Western Cape
WCDoA		      Western Cape Department of Agriculture
WCDEA&DP     Western Cape Department of Environmental Affairs & Development Planning
WSA		        Water Services Act
WWF		        World Wide Fund for Nature
ZAR		        South African Rand

                   List of figures
Figure 1
Agricultural production value chain							10
Figure 2
South Africa biomes								12
Figure 3
Broad Relatively Homogenous Farming Areas in the Western Cape			   13
Figure 4
Top ten South African commodities in tonnes produced (2012)				    16
Figure 5
Top ten South African commodities in production value (2012)				   17
Figure 6
Gross value of agriculture production for select commodities				   18
Figure 7
Expenditure on certain intermediate products					                  18
Figure 8
Range of commodities in the Western Cape						                     19
Figure 9
Increases in the real-term cost of electricity in South Africa				 23
Figure 10
Electricity breakdown on the average fruit and vegetable farm				  28

6                                                     Agriculture: Market Intelligence Report 2016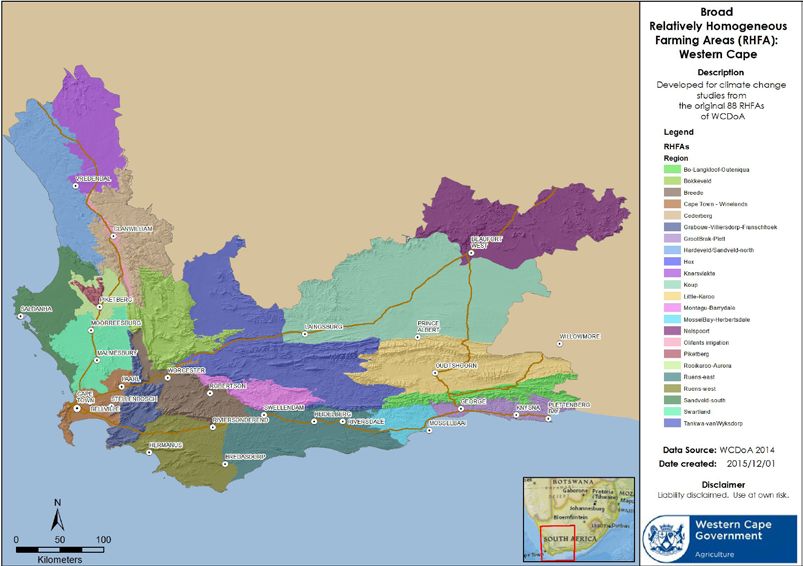
Figure 11
Electricity use in cold stores, cooling and drying of fruit				      29
Figure 12
The cost of PV over time								31
Figure 13
Percentage of arable land under CA 2011						                        35
Figure 14
Proportion water use per main economic sector					                   36
Figure 15
Value of expenditure on dips and sprays over time in South Africa			 41
Figure 16
Major market opportunities in the Western Cape (2015 – 2020)				     47
Figure 17
GreenCape’s focus areas								50

                              List of tables
Table 1
Summary of crop / livestock commodities for each agro-climatic zone in the Western Cape 14
Table 2
Number of farms and farm turnover 2007						                                            16
Table 3
Western Cape exports by sector							20
Table 4
Key role players in agriculture							21
Table 5
Arable land cover in South Africa							23
Table 6
Selected acts and plans relevant to the agricultural sector				                         25
Table 7
Number of agri sector facilities in the Western Cape					                               30
Table 8
Municipalities (WC) that have PV rules, regulations and tariffs				                     32
Table 9
Small scale embedded generation (SSEG) residential tariffs				                          33
Table 10
Potential value of adopting PA							37
Table 11
Possible cost saving and investment feasibility					                                    38
Table 12
Global market for pesticides 							40
Table 13
List of funding solutions								43
Table 14
Key role players									51

Agriculture: Market Intelligence Report 2016                                                 7
Executive summary
        This agriculture sector market intelligence report
        focuses on opportunities for greening primary agriculture
        production. It is written for investors, businesses and
        farmers and focuses on conservation agriculture, water and
        energy efficiency, renewable energy, biological control and
                            precision agriculture.

The biggest drivers for the uptake of green           Pollution and soil degradation affect farmers’
technologies and practices in South African           profits over time and reduce their resilience
agriculture are rising input costs, limited natural   to external risks such as droughts and climate
resources (particularly arable land and water)        change.
and increasing consumer demand for more
sustainable products.                                 A third driver for green technology and
                                                      sustainable agricultural practices relates to
Rising input costs involve conventional               consumer demand. Even though South Africa’s
products like fertilisers, pesticides, energy         demand for pesticide-free products is relatively
(mostly diesel and electricity) and water. The        low, pressure from international markets affect
demand for these inputs (and the associated           South African exports. In order to participate
cost) are rising in order to increase, or at least    globally, growth in green technology and
sustain, yields. Also, the prices of conventional     sustainable agricultural practices will need to
products typically exclude the additional cost        increase.
of the harmful effects on the environment.
This drives the economic and environmental            These challenges, coupled with declining costs
necessity for green technology and sustainable        of new technologies, tax and other incentives,
agricultural practices.                               make it economically feasible for farmers to
                                                      adopt certain green technologies, especially
Another green driver concerns arable land and         those that improve resource efficiencies. This,
water availability. In the Western Cape, both         in turn, creates opportunities for investors and
of these are affected by the climate and the          businesses in the green agriculture space.
way land is farmed. Conventional agriculture
often adds to the existing strain on limited
natural resources and results in a decline in
the availability of arable land. Low average
(and irregular) rainfall, exacerbated by climate
change, makes water the biggest limiting factor
to production.

8                                                                Agriculture: Market Intelligence Report 2016
During the course of our engagement with General barriers to the uptake of green
stakeholders in the agriculture and other green technologies and sustainability measures in
economy sectors, a number of opportunities in South African agriculture include:
energy, water and the use of chemical inputs
have been identified. These include: ■■ A lack of awareness about the importance
and benefits of sustainable production and
■■ Alternative energy sources and energy how to go about realising it.
efficiency technologies are becoming more ■■ Regulatory hurdles, for instance, on
affordable and more necessary due to rising timeliness of Environmental Impact
energy costs. Opportunities for farming Assessments (EIAs) and registration of new
operations include solar PV and biogas. products.
■■ Water use efficiency technologies in ■■ Insufficient support for farmers to access
irrigation to address water scarcity and save information and advice on best practice.
electricity used to pump water. ■■ Weak exchange rate and low profit margins
■■ Precision agriculture techniques which make importing technologies too expensive
reduce agricultural inputs – including water for farmers.
and fertiliser – resulting in lower costs and ■■ Lack of funding for R&D – the performance
fewer environmental impacts. of R&D expenditure is also much higher for
■■ Environmentally-friendly alternatives to businesses than for government.
chemical inputs to increase soil health and
biodiversity and to reduce pollution. This
should include attention to opportunities
arising from greater consumer awareness
of harmful effects of chemical inputs and
from stringent environmental regulations by
export markets. Investment opportunities lie
in the research and development (R&D) of
such products.
© GreenCape
Agriculture: Market Intelligence Report 2016 91–
Introduction and
purpose
This market intelligence report (MIR) was compiled by
GreenCape’s agriculture sector desk. It is written for
investors, businesses and farmers and focuses on conservation
agriculture, water and energy efficiency, renewable energy,
biological control and precision agriculture.
Agriculture is a new focus area for GreenCape fewer inputs, while simultaneously benefitting
and this report is the result contains some of the environment by conserving resources and
our key insights from 2015 and early 2016. reducing negative impacts such as pollution.
It provides an overview of the agriculture
sector in South Africa and the Western Cape Agricultural production is a highly integrated
Province and our initial insights on barriers and system as can be seen in the typical agriculture-
opportunities in the green agriculture1 space. production value chain in Figure 1 (Boye &
The report focuses on primary agriculture Areand 2012). While investment opportunities
production and highlights opportunities related can be found throughout the value chain, this
to technologies and practices that increase MIR will focus mostly on primary agriculture
production efficiency - producing more with production.
SUPPLY of materials, resources and energy (e.g. chemicals, water, diesel, electricty)
1. Raw Materials 2. Food Processing 3. Distribution 4. Use
Production
Packaging materials
Fertilizer, herbicides
and pesticides Primary Secondary Wholesale
manufacturing Processing Processing
eg. sugar refining, eg. yoghurt, Refrigeration
milling, breakfast cereals, Freezing
Crop slaughtering soft drinks Retail
Cooking
Cattle production,
farming fruits and
vegetables
Consumer
farming
Packaging Packaging
Animal feed
WASTE MANAGEMENT (eg. wastewater, organic residues, packaging residues)
Figure 1: Agricultural-production value chain
1
Green agriculture refers to farm practises and technologies that form part of sustainable agriculture, by ensuring sustainable ecosystem services,
reducing negative externalities and rebuilding ecological resources.
10 Agriculture: Market Intelligence Report 2016The industry overview in Section 2, below, The section concludes with specific
outlines the South African and Western Cape opportunities and barriers for the greening of
agricultural context by presenting the physical agriculture, namely opportunities in energy
geography and consequently the commodities efficiency, solar PV, conservation agriculture,
that are produced per geographical area. precision agriculture, and biological control, to
We also provide a provincial and national biogas from agricultural waste.
economic overview of agriculture with a focus
on the macro-economic trends and value of The final sections of the report outline funding
commodities in the sector. Key players in the solutions and investment incentives (Section
agriculture sector are considered, followed by 5), present the case for the Western Cape as a
an overview of policies and regulations (Section potential greentech hub for Africa (Section 6)
3) that guide and affect the agriculture sector. and explain in more detail GreenCape’s work
within the green economy (Section 7).
The aim of Section 4 is to present opportunities
and barriers for the greening of agriculture.
It starts by outlining factors that give impetus
to the greening of agriculture. These include
climate change, unsustainable farming
practices, and other aspects that affect land
and water availability in the country and
province.
© Western Cape Department of Agriculture
Agriculture: Market Intelligence Report 2016 112–
Sector overview
This section focuses on the South African
and Western Cape agricultural context.
It provides an overview of the physical 2.1. Physical geography
geography, commodities produced per area, South Africa is a semi-arid country. This
macro-economic trends and the value of enables the production of a wide range of
commodities. We discuss key players, followed agricultural commodities. In terms of its
by drivers of green technology and approaches physical geography, the country has a range of
in agriculture that give impetus to investment in geomorphological settings resulting in a great
the green agriculture space. variety of soil and climate conditions. Climatic
regions in South Africa include mediterranean,
subtropical and semi-desert.
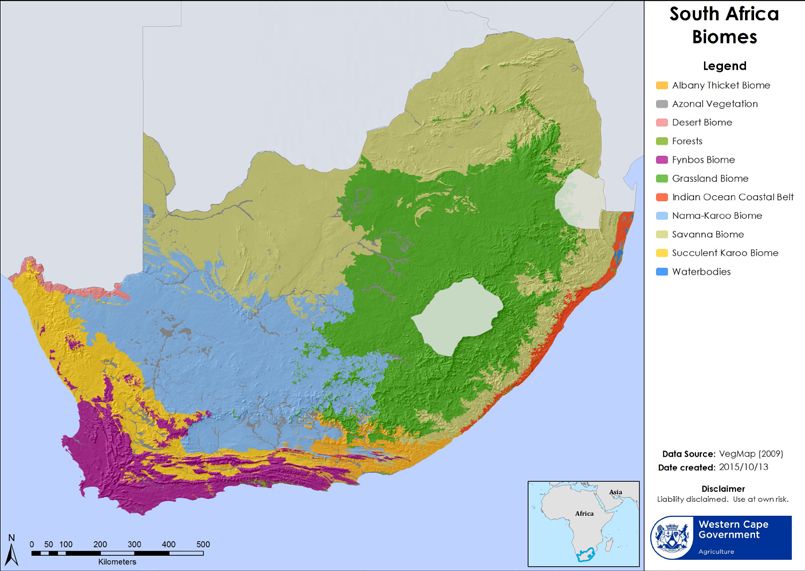
Figure 2: South African biomes
12 Agriculture: Market Intelligence Report 2016Figure 2 (Basson 2015) illustrates the diversity As the Western Cape is a winter rainfall region,
in biomes – the result of the physical landscape its agriculture sector is unique in South Africa.
and variety in rainfall distribution across SA. The province is also known for its production
As a result, the country has a very diverse stability, supported by well-developed
agriculture sector, with a clear regional infrastructure.
distribution of commodities. For instance,
approximately 70% of South Africa’s cereals Figure 3 (Wallace 2015) illustrates the diversity
and 90% of its commercially grown maize is of agro-climatic zones in the Western Cape
mainly rain-fed on the Highveld2 (Blignaut et al which allows for a variety of agricultural
2014). By land surface area, livestock is by far commodities. Table 1 (WCDoA & WCDEA&DP
the largest agricultural sector in South Africa as 2015) provides an overview of crop and
69% of the land surface is suitable for grazing livestock commodities for each agro-climatic
(WWF 2010). Cattle production is practiced zone.
mostly in the eastern areas of the country
where higher rainfall is recorded.
Figure 3: Broad relatively homogenous farming areas in the Western Cape
2
The interior of South Africa is on a high-lying plateau, known as the Highveld. The area has grassland as its predominant vegetation.
Agriculture: Market Intelligence Report 2016 13Table 1: Summary of crop/livestock commodities for each agro-climatic zone
in the Western Cape
Name Main crops Livestock
Bokkeveld Pome fruit, wheat, stone fruit, Cattle
onions, potatoes
Bo-Langkloof-Outeniqua Pome fruit, hops, wheat, stone Cattle, sheep, goats
fruit, flowers, honeybush
Breede Wine and table grapes, wheat, Broilers, egglaying
stone fruit, pome fruit, olives, chickens
citrus, vegetables, flowers
Cape Town winelands Wine and table grapes, wheat, Broilers, egglaying
stone fruit, vegetables, olives, chickens, pigs
canola, citrus, flowers, berries
Cederberg Rooibos, wheat, citrus, wine Cattle
grapes, stone fruit, vegetables,
potatoes, flowers
Grabouw-Villiersdorp-Franschhoek Pome fruit, wine grapes,
wheat, barley, stone fruit,
flowers, berries
GrootBrak-Plett Wheat, barley, vegetables, Cattle, dairy, egg-laying
nuts, berries, flowers, chickens
honeybush
Hardeveld/Sandveld-north Wheat, wine grapes, rooibos, Cattle, sheep
potatoes, vegetables
Hex Table grapes, citrus
Knersvlakte Wheat, wine and table grapes, Cattle, goats, sheep
rooibos
Koup Olives, vegetables and Cattle, game, goats, sheep
vegetable seed, stone fruit
Little-Karoo Wheat, vegetables, wine Cattle, dairy, goats,
grapes, stone fruit, olives, nuts ostriches, pigs, sheep
Montagu-Barrydale Stone fruit, wheat, barley, wine Sheep
grapes, pome fruit, citrus,
olives, flowers, nuts
MosselBay-Herbertsdale Wheat, barley, canola, flowers Cattle, dairy, ostriches,
pigs, sheep
Nelspoort Olives Cattle, goats, ostriches,
sheep
Olifants irrigation Citrus, wheat, wine & table
grapes, rooibos, tomatoes,
potatoes
Piketberg Pears, fynbos flowers, stone Cattle, sheep
fruit, wheat, citrus, herbs/
essential oils, wine grapes,
Cape rush, rooibos
14 Agriculture: Market Intelligence Report 2016Rooikaroo-Aurora Wheat, canola, rooibos, table Cattle, sheep
& wine grapes, potatoes,
olives, flowers
Rûens-east Wheat, barley, canola, citrus, Cattle, dairy, ostriches,
olives, herbs/essential oils, pigs, sheep
Cape rush, berries, honeybush
Rûens-west Wheat, barley, canola, wine Cattle, dairy, sheep
grapes, pome fruit, flowers,
vegetables, olives, citrus,
herbs/essential oils, berries
Sandveld-south Wheat, potatoes, rooibos, Cattle, sheep
canola, citrus, flowers
Swartland Wheat, wine and table Cattle, dairy, pigs, sheep
grapes, canola, olives, citrus,
vegetables, stone fruit, berries,
flowers
Tankwa-Vanwyksdorp Wheat, stone fruit, wine & Cattle, dairy, game, goats,
table grapes, vegetables, ostriches, pigs, sheep
olives, nuts
2.2. Economic overview production, small holders and subsistence
This section provides an overview of the farmers make further economic contributions,
agricultural economy in South Africa and the although these are harder to quantify.
Western Cape, with a focus on the sector’s
economic contribution, value of commodities Although the production area for maize, wheat
and production trends. and dairy has decreased over the last 20 years,
production remains relatively constant (Stats
SA 2007). This is mainly due to increased
2.2.1. South African agriculture use of fuel, irrigation and fertiliser, which is
South Africa’s primary agriculture sector economically unsustainable (due to rising costs
contributes significantly to the country’s and limited availability) and environmentally
economy - approximately R58.2 billion ($6.8 unsustainable (mainly due to depleted soil
billion3) or 2% to Gross Domestic Product (GDP) health). Added to these strains is a highly
in 2012. The sector plays a critical role as an competitive global market. For example,
employer and accounted for approximately wheat can be imported at lower cost than local
7% of formal employment in 2013, of which a producers can supply. South African farmers
significant share is unskilled labour (Department do not benefit from subsidies, and therefore
of Agriculture, Forestry and Fisheries (DAFF) struggle to compete with heavily subsidised
2013b). Elementary workers make up 77% of farmers in other countries. However, there are
the agricultural workforce; of those 22% are numerous tax benefits and incentives for farmers
considered unskilled. The agricultural sector wishing to improve the sustainability of their
is also important for ensuring the country’s operations (these are presented in Section 5).
food security. In addition to commercial-scale
3
USD value calculated by using the average annual exchange rate for 2012 of 8.553:1 (ZAR:USD)
Agriculture: Market Intelligence Report 2016 15According to the Census of Commercial Table 2: Number of farms and
Agriculture published by Statistics South Africa farm turnover (2007)
(Stats SA) , the number of commercial farms in
South Africa fell by more than 13% from 45 800 Number of farms Annual turnover
in 2002 to 39 900 in 2007 (Table 2 below).
This is a decline of about 30% from an 22 500 < R500 000
estimated 58 000 commercial farms 20 years 12 300 R500 000 - R3 million
ago (Stats SA n.d.). While farm numbers have
2 200 R3 million - R5 million
dropped, average farm size has increased -
farmers have increased production to reach 2 900 >R5 million
better economies of scale. Overall production
increases can largely be attributed to increased
irrigation and synthetic fertiliser use. 2.2.2. Agriculture commodities in
South Africa
– South Africa’s top ten agriculture commodities
Overall production increases
are shown below in Figure 4 in million tonnes
can l argely be attributed to produced (FAO 2012) and Figure 5 (by value)
increased irrigation and (FAO 2012). While maize and sugar cane are
synthetic fertiliser use. the commodities most produced by tonnage,
grapes and meat products are of higher value.
As the only province suited for wine production,
the Western Cape makes an important econom-
ic contribution given the higher value of grapes
on international markets.
Top 10 SA commodities (million tonnes)
Sugar cane (17.3) Maize (11.8)
Milk, whole fresh cow (3.4) Potatoes (2.3)
Wheat (1.9) Grapes (1.8)
Oranges (1.6) Meat indigenous, chicken (1.5)
Apples (0.8) Meat indigenous, cattle (0.8)
Figure 4: Top ten South African commodities in tonnes produced (2012)
16 Agriculture: Market Intelligence Report 2016Top 10 SA commodities (US$ million)
Meat indigenous, cattle (2.1) Meat indigenous, chicken (2.1)
Maize (1.1) Grapes (1.1)
Milk, whole fresh cow (0.9) Sugar cane (0.6)
Eggs, hen, in shell (0.4) Meat indigenous, sheep (0.4)
Apples (0.3) Potatoes (0.3)
Figure 5: Top ten South African commodities in production value (2012)
2.2.3. Production trends in South African ■■ Burning fuel (in primary agriculture diesel)
agriculture emits carbon dioxide which pollutes the
atmosphere and contributes to climate
Figure 6 (DAFF 2013a) illustrates the recent and change.
rapid increase in the inflation-adjusted monetary ■■ Synthetic fertiliser can easily leach, pollute
value of selected South African agricultural and eutrophicate the soil. Nitrogen rich
commodities. This increase has largely been the synthetic fertilisers can cause soil acidity
result of: and kill beneficial organisms that aid plant
growth.
■■ Growth of the middle class with concomitant ■■ Over-irrigation increases the salt content of
rise in demand for meat products. surface soil and reduces soil fertility.
■■ Population growth and associated rise in ■■ Chemical pesticides reduce soil health,
food demand. pollute water sources, and are hazardous to
■■ Increase in demand for certain food types, human health. These are discussed in greater
particularly animal products in South Africa detail in Section 4.
and certain horticultural products in Africa.
■■ Price increases of input products, especially Many agricultural practices and technologies
fuel. reduce dependence on harmful inputs, with
associated financial and environmental benefits.
Figure 7 (DAFF 2013a) illustrates that the However, there are barriers to the uptake of
rise in production has been accompanied by these technologies. For example, a shortage
an associated rise in expenditure on inputs. of technical skills in the country means that
Increased yields are correlated with increased most technologies, machinery and implements
use of fuel, fertiliser, irrigation and pesticides, used in farming are imported. With the weak
given that farmers need to keep yields constant exchange rate, procurement of such equipment
to stay profitable. The extensive use of these is expensive especially where market forces
inputs is unsustainable for a number of reasons: have not driven prices down yet.
Agriculture: Market Intelligence Report 2016 17180000
160000
140000
120000
100000
R million
Total
80000 Field Crops
Horticulture
60000
Animal products
40000
20000
0
1970 1975 1980 1985 1990 1995 2000 2005 2010
Year
Figure 6: Gross value of agriculture production for select commodities
30000
25000
20000
R million
15000 Total
Fuel
Fertilizer
10000
Dips & Sprays
5000
0
1970 1975 1980 1985 1990 1995 2000 2005 2010
Year
Figure 7: Expenditure on certain intermediate products
18 Agriculture: Market Intelligence Report 2016It follows that efficient use of resources is In addition to the contribution of primary
essential to the future of the industry in South agriculture, agro-processing (which has been
Africa – on the one hand, for sustainability due identified as a key growth sector for the
to land and water issues and, on the other Western Cape Province) adds further value. If
hand, for profitability due to limited economies the entire agricultural value chain is taken into
of scale. account, the total contribution to GDP is almost
12% (DAFF 2013).
2.2.4.Western Cape agriculture
Agriculture contributes 2% to the national GDP –
in 2013, of which the Western Cape agricultural If the entire agricultural
sector contributed 22.6% (Basson 2013). The
Western Cape is a key contributor because it value chain is taken
produces high-value export crops such as wine into account , the total
grapes. Figure 8 (Provincial Treasury 2013) contribution to GDP is
illustrates the range of commodities in the
Western Cape. almost 12% (DAFF 2013).
Table 3 (Wesgro 2014) highlights that (1) The drop in the number of farms and increase
agriculture is a very important part of the in farm size mentioned earlier is particularly
Western Cape economy, and (2) the province evident in the Western Cape’s fruit sub-sector,
dominates much of SA’s agricultural export where 30% of the farmers produce as much as
production – especially wine and fruit. These 80% of the fruit (Hortgro 2015). Small-scale and
export markets are a key driver of sustainable emerging farmers are struggling to compete
agricultural practices. and developing an inclusive rural economy is
highly challenging.
5.8%
Gross value added: R14.7 billion (2011) 5.8%
8.7%
Other
(mainly) 11.7%
forestry
& fishing)
Field 1.0%
crops 28.2%
6.9%
Horticulture
Animals 50.5%
39.89%
41.6%
Horticulture
Apples, pears & peaches Wine
Table grapes Potatoes & onions
Citrus Other veggies
Figure 8: Range of commodities in the Western Cape
4
Agro-processing can be defined as processing the raw material or transforming products that originate from agriculture.
Agriculture: Market Intelligence Report 2016 19Table 3: Western Cape exports by sector
Rank Top 10 exports Value % Growth % Share
2013 2012-2013 SA exports
(ZARbn) 2013
1 Oils petroleum, bituminous, distillates, except crude 8.39 -5.32 59.00
2 Grape wines (including fortified), alcoholic grape 7.80 33.26 98.27
3 Citrus fruit, fresh or dried 6.58 22.70 70.54
4 Apples, pears and quinces, fresh 5.59 53.52 94.34
5 Grapes, fresh or dried 4.02 22.27 80.76
6 Hot-rolled products, iron/steel 3.11 7.47 79.00
7 Liquid, gas centrifuges, filtering, purifying machines 2.01 -6.23 10.75
8 Maize (corn) 1.83 44801.31 29.51
9 Fruit, nut, edible plant parts (not elsewhere 1.60 16.90 90.25
specified), prepared/preserved
10 Liqueur, spirits and undenatured ethyl alcohol 1.28 66.28 90.34
Total export 74.87 16.06 9.49
2.3. Key players ■■ Input suppliers research and produce inputs
Key players in the agriculture sector can be such as fertiliser, seeds, pesticides and
divided into four broad categories: producers, machinery. Suppliers of green technology,
research/academia, input suppliers and like conservation agriculture equipment and
industry associations . solar PV manufacturers also fall into this
category.
Table 4 shows a simplified value chain with key ■■ Industry associations, involved in all
role players involved. aspects of the value chain, support farmers
and provide them with reliable and relevant
■■ Producers/farmers produce commodities information regarding regulations, logistics,
and in most cases do their own harvesting, cultivar development, etc.
storage and transport.
■■ Research institutions like universities The South African Government’s DAFF governs
investigate all aspects of the value chain. the whole industry.
A detailed list of role players can be found in
Appendix A.
20 Agriculture: Market Intelligence Report 2016Table 4: Key role players in agriculture
R&D Inputs Production Harvesting Storage Transport Processing Wholesale, Waste
retail &
exports
Government
Producer
Research institutions
Input suppliers
Industry associations
2.4. Drivers of green technologies and Africa’s other sectors (such as the energy sector
approaches in agriculture and industrial processes) (Partdrige et al. 2014),
it is the sector most directly affected by climate
change impacts.
A range of factors provide impetus for
a transition to sustainable production in –
South African agriculture. These include Agriculture’s contribution to
water scarcity and climate change,
climate change is rel atively small,
decreasing soil health, the high cost of
energy and other inputs and increasing but it is the sector most directly
food demand. These are coupled with affected by climate change
consumer awareness about pesticide impacts, such as water scarcity
residues, ecosystem degradation,
pollution and declining nutritional value In the case of the Western Cape, climate
in food. models predict a slow-onset drying trend,
with declines and more variability in rainfall
(UCT 2014). The Swartland area provides
2.4.1. Climate change and water scarcity evidence of this trend. As one of the largest
Climate change and associated water scarcity grain producing areas in the country, the
is a significant driver of greening of agriculture area has experienced year-on-year declines
as it forces the sector to adopt practices and in rainfall and has just experienced one of
technologies that conserve water and improve the driest winters in the past 75 years. Such
soil health for better water retention and climatic effects affect the productivity of local
improved yields. farms and the surrounding rural economy,
exerting pressure on farmers to operate more
Low average (and irregular) rainfall, exacerbated sustainably.
by climate change, result in water shortage,
which is the biggest limiting factor to In addition to climate change impacts, water
production. The Council for Scientific and will become even more scarce because
Industrial Research (CSIR) estimates that by of population growth, urbanisation and
2025 there will be a water deficit in South Africa industrialisation. It is estimated that the
(Talk Radio 2015). While agriculture production Western Cape will experience water-related
in South Africa contributes a relatively small constraints to development as early as 2019
percentage (5%) to the country’s greenhouse (Department of Water Affairs (DWA) 2011).
gas emissions (GHGs) compared to South
Agriculture: Market Intelligence Report 2016 212.4.2. Environmental degradation Table 5 illustrates the shortage of arable land5
Conventional farming methods are for agriculture in South Africa. Notably, 69%
unsustainable, mostly due to their negative of all arable land is suitable for grazing, while
impacts on natural resources and the only 12% is suitable for rain-fed agriculture.
environment: These constraints can be further understood by
comparing South Africa’s arable surface area, in
■■ Chemicals in pesticides reduce biodiversity hectare per person, to other countries’. South
above and below ground (for instance, up Africa has 0.25 hectares of arable land per
to 75% (FOA n.d.) of crop genetic diversity person compared to Russia (0.85), Argentina
has already been lost). Heavy reliance on (0.93) and Australia (2) (World Bank 2013).
chemicals in conventional farming also These countries, therefore, have a competitive
pollutes water, negatively affects other natural edge over South Africa as some commodities,
resources and can be harmful to human such as livestock, wheat and maize production,
health. Studies from the 40s to the 90s overlap.
indicate that widespread increased exposure
to synthetic pesticides greatly reduce trace For agriculture to be sustainable it needs
elements in vegetables. to meet the needs of present and future
■■ Tillage, which is a conventional farming generations, while conserving resources and
method, is the leading cause of soil ensuring profitability. These pressures are
degradation (WWF 2010). According to particularly problematic in light of the need to
the United Nation’s Food and Agriculture double food production by 2050 from 2009
Organisation (FAO) one third of global levels (UN 2009). Consequently, South Africa’s
farmland is degraded (2014). farmers have little choice but to revert to
■■ Fossil fuel burning, as in coal-fired electricity innovative and sustainable farming practices, if
generation and diesel, emits carbon dioxide they are going to remain competitive nationally
that contributes to climate change and and globally, conserve the environment and
pollutes the air. contribute to food security.
2.4.3. Market pressure and limited –
resources South Africa has 0.25
A number of other pressures and hectares of arable l and per
constraints contribute to the necessity for
sustainable agriculture. These include: person compared to Russia
(0.85), Argentina (0.93) and
■■ rising costs and demand for Australia (2)
agricultural inputs: fertiliser, pesticides,
energy (mostly diesel and electricity)
and water
■■ energy shortages
■■ population growth
■■ availability of arable land
■■ consumer demand for sustainably-
produced products.
5
Arable land (in hectares) includes land defined by the FAO as land under temporary crops (double-cropped areas are counted once), temporary
meadows for mowing or for pasture, land under market or kitchen gardens, and land temporarily fallow. Land abandoned as a result of shifting
cultivation is excluded.
22 Agriculture: Market Intelligence Report 2016Table 5: Arable land cover in South Africa
Suitable for High potential Irrigated crops Suitable for Total
rain-fed crops grazing
Ha (million) 14.4 3.6 1.3 82.8 120
% of total 12 3 1 69 85
2.4.4. Electricity cost and supply Figure 9 (Chehore 2014) below shows the
The South African agriculture sector consumes real-term rise in the cost of electricity between
approximately 3% of the total electricity 2006/7 and 2013/14. According to the
produced in the country (NERSA 2006). In Department of Energy the rural electricity
the context of rising electricity costs and the tariffs approved by NERSA increased
supply crisis, energy efficiency has become by 12.69% during 2015/16 (2015a). The
increasingly important for all sectors, including business case for investment into energy
agriculture. efficiency is strong and there are considerable
opportunities for suppliers of greentech and
services in this space.
–
The South African agriculture
sector consumes approximately
3% of the total electricity
produced in the country
Real electricity cost, 2006/7 - 2013/14 (June 2013 Rands)
R700,00
R600,00
R500,00
R400,00
R300,00
R200,00
R100,00
R0,00
2006/7 2007/8 2008/9 2009/10 2010/11 2011/12 2012/13 2013/14
Low (150 kWh) R71, 28 R70, 28 R71, 45 R74, 03 R76, 95 R77, 53 R77, 88 R80, 91
Medium (350 kWh) R178, 19 R175, 69 R178, 62 R185, 08 R216, 91 R230, 54 R239, 71 R247, 22
High (450 kWh) R320, 74 R316, 25 R369, 81 R478, 23 R555, 92 R608, 47 R628, 66 R634, 47
Low (150 kWh) Medium (350 kWh) High (450 kWh)
Figure 9: Increases in the real-term cost of electricity in South Africa
Agriculture: Market Intelligence Report 2016 23For instance, for some farmers, recent load ■■ Cold-chain management: With many
shedding has represented a major challenge. foods going to export markets, cold-chain
Diesel generators have represented a short- management is key to producing quality
term solution, at a cost. Most farms are products. In peak production, processing is
equipped with backup generators, but in recent typically operating full time. Load shedding,
years farmers have been buying bigger units and inconsistencies in load shedding
for more frequent and sustained use. While schedules are particularly disruptive as prior
attempts have been made to manage load to predicted load shedding, equipment
shedding, the uncertainty of schedules can needs to be switched off and the process
harm the industry. For example: halted. This results in losses within the
process, particularly as machines need to be
■■ Dairy industry: The dairy industry needs a cleaned before process can continue.
constant feed of electricity throughout the
year for the heating and cooling processes
of milk. Specific temperatures need to be
maintained for certain periods in order to
ensure milk quality and safety (Mavuso 2015).
© Western Cape Department of Agriculture
24 Agriculture: Market Intelligence Report 20163–
Policies and
regulations
With a complex agricultural sector and many commodities
produced in the Western Cape, there is a range of policies
and regul ations that directly and indirectly rel ate to
agriculture.
Many of these have specific relevance to the 3.1. Agriculture
sustainability of the sector as they aim to The DAFF is primarily responsible for legislation
protect natural resources such as land and related to the sector. A number of acts and
water. These are therefore also relevant to policy documents (Table 6) speak to the
suppliers of greentech or green services within conservation of agricultural resources while
the agriculture sector. promoting economic and social development.
Table 6: Selected acts and plans relevant to the agricultural sector
Name Selected objectives/purpose
The Conservation of Agricultural ■■ Controlling use of natural agricultural resources
Resources Act 43 of 1983 ■■ Conservation of soil
■■ Conservation of water sources
■■ Combating weeds and invader plants
The National Development Plan ■■ Elimination of poverty
2030 (NDP 2012) ■■ Reduction of inequality
■■ Highlighting the importance of initiatives that link
agriculture to the green economy
The Agriculture Integrated Growth ■■ Equitable, productive, competitive, profitable and
and Development Plan (IGDP 2012) sustainable agriculture, forestry and fisheries sectors
■■ Emphasises that the sector needs to benefit all
South Africans
The Agriculture Policy Action ■■ A programmatic response to key policy documents
Plan (APAP 2014) including the National Development Plan (NDP) and
the New Growth Path (NGP)
Strategic Plan for the Department ■■ Providing an effective framework to address various
of Agriculture, Forestry and Fisheries challenges facing the sectors
(SPDAFF 2013) ■■ Setting targets for the departmental programmes
from 2012 to 2017
■■ Building a leading, dynamic, united, prosperous and
people-centred sector
Agriculture: Market Intelligence Report 2016 253.2. Water This has had some implications for investors,
The following acts regulate the water sector particularly regarding uncertainty in the sector
(DWA 2013): over land rights and fears of unconstitutional
land expropriation.
■■ National Water Act (NWA, Act 36 of 1998)
redefines water rights in South Africa to There are broader implications, such as
stimulate inclusive growth. losses in the sector if arable production land
■■ Water Services Act (WSA, Act 108 of 1997) is given to inexperienced farmers without
defines the role of the Department of Water training. Lengthy distribution processes affect
Affairs as a regulator; the role of water land productivity – original owners may stop
boards as bulk providers, and the role of investing in the land during the process and the
municipalities as service providers. land can become too degraded to be restored.
■■ The National Water Resource Strategy New farmers require adequate support and
2nd Edition (NWRS2 2013) assists in development, not just in cultivation but also
the implementation of the NWA whilst in post-settlement (like market access) which
protecting, developing and controlling water is currently lacking, resulting in unsustainable
resources in a sustainable and equitable farming practices.
manner.
3.4. Carbon tax
More information on water governance issues The South African Government has committed
and investment opportunities in the water to reducing GHG emissions by 34% by 2020
sector can be found in GreenCape’s Water and 42% by 2025. Part of the strategy to drive
Sector Market Intelligence report, which can be this includes a carbon tax. The implementation
downloaded from www.greencape.co.za. of the first phase of the tax (focusing on scope
1 GHG emissions) has been delayed from 2015
3.3. Land reform – 2020 to 2016 – 2021. Primary agriculture will
The White Paper on South African Land mostly be exempted from the carbon tax, but
Policy (1997) addresses the injustices and will still be affected by it indirectly as it filters
land inequalities that came about during through to input costs.
pre-colonial and colonial rule and apartheid.
© Western Cape Department of Agriculture
26 Agriculture: Market Intelligence Report 20164–
Opportunities
and barriers
This section focuses on opportunities identified this year
during the course of engagement with stakeholders in the
agriculture and other green economy sectors.
There are opportunities in energy, water and ■■ Lack of support for farmers to help them
the use of chemical inputs: access relevant information and advice on
best practice.
■■ Alternative energy sources and energy ■■ Weak exchange rate and low profit
efficiency technologies are becoming margins mean that importing technologies is
more affordable and more necessary due to too expensive for farmers.
increasing energy costs. Opportunities for ■■ A lack of funding for R&D is another barrier
farming operations covered in this report to the growth of green agriculture. As an
include solar photovoltaic (PV) and biogas. international benchmark, R&D expenditure
■■ Water use efficiency technologies in as a percentage of GDP should be 1% and
irrigation address water scarcity and save is currently– Along with irrigation pumps, packhouses
The business case for and cold stores are also significant electricity
consumers on farms. In the Western Cape,
investment into energy the fruit subsector relies particularly heavily
efficiency is strong and there on electricity for these facilities. While these
are considerable opportunities facilities do require continuous supplies of
electricity, demand peaks during the fruit
for suppliers of greentech and season, which occurs in the summer months.
services in this space
The main energy saving opportunities within a
In primary agriculture, most electricity is packhouse are related to:
consumed through water pumped for irrigation
as shown in Figure 10 (Stotko 2015) below. ■■ shortening the distance that the fruit must
This is particularly relevant for farms using move within in the facility
irrigation. For example, dairy farms consume ■■ the use of conveyers rather than water to
most electricity during the milking process to move fruit
maintain the correct temperature of the milk. ■■ energy efficient lighting such as LEDs
Houses on an average farm tend to consume
the least amount of electricity and therefore By comparison, electronic inspection and
do not represent the main focus area for many sorting use relatively small amounts of
farmers when it comes to energy efficiency. electricity.
Admittedly, each farm is unique and each case
should be assessed as such.
Electricity breakdown kWh
9
3
8
4
14
62
Office, Workshop, Other Manager House
Pumps Irrigation Labourers Cottages
Pumps Lifting Hostels
Figure 10: Electricity breakdown for the average fruit and vegetable farm
28 Agriculture: Market Intelligence Report 2016Electricity consumptions
1
15
3
2
5
49
25
Compressors Condenser Fans
Extractor Fans Evaporator Fans
Lightning Other
Condenser Pumps
Figure 11: Electricity use in cold stores, cooling and drying of fruit
In cold stores, cooling and drying of fruit The design of a new building is therefore an
represents the major energy demand. important consideration because windows
Compressors, extractor fans and evaporator and doors that seal properly contribute
fans are significant electricity consumers as significantly to energy efficiency. For this
shown in Figure 11 (EEPACS 2012). reason, GreenCape compiled a green building
materials catalogue to assist business owners
Apart from spending electricity on produce, with a list of building materials that are energy
many facilities have additional heating and efficient. This catalogue is available on the
ventilation equipment to provide a suitable GreenCape website.
environment for workers. Traditional equipment
that consists of heaters and fans consume a In the Western Cape there are numerous
significant amount of electricity, usage within agricultural facilities that use electricity
packhouses and cold stores can be reduced (Table 7, Basson 2015). Some have already
by almost 50% by using natural ventilation, implemented certain energy efficiency
enabled and supported by good building and measures, but there is significant potential for
roofing designs (Koos Bouwer Consulting 2014). growth in the rate of uptake within the sector.
Recognising the benefits, most farmers are
already actively looking for expert advice to
improve energy efficiency.
Agriculture: Market Intelligence Report 2016 29Table 7: Number of agri sector facilities in the Western Cape
Type Number
Abattoirs (red meat) 55
Abattoirs (white meat) 25
Agro processing plants 261
Chicken batteries 57
Chicken broilers 170
Chicken layers 140
Chicken hatcheries 2
Cool chain facilities 21
Dairies 760
Fruit packers 44
Fruit cool chains 29
Homestead 5565
Homestead-labour 13860
Pack houses 613
Piggeries 75
Silos (commercial) 44
Tunnels 853
Total 22574
4.2. Solar PV in the Western Cape’s The increase in solar PV installations across
agricultural sector all sectors has been partly the result of falling
Rising energy costs, uncertainty of supply costs, as illustrated in Figure 12 (Tshehla 2015).
and the impact of load shedding have acted In 2013 the cost of solar panels without battery
as drivers for the agriculture sector to adopt storage was just under R40 000 for a system
renewable energy solutions, especially once of 10kw and smaller. At the current rate of
all energy efficiency opportunities have been installations, the projection shows the cost will
realised. In addition to the South African almost be cut in half by 2018.
Government’s Renewable Energy Independent
Power Producer Procurement (REIPPP)
programme, the agricultural sector has seen
–
an increase in the uptake of renewable energy The agricultural sector
(RE). Some farmers have benefited financially has seen an increase in the
by partnering on land rental agreements with
Independent Power Producers (IPPs) on this
uptake of renewable energy.
programme. Some farmers have benefited
financially by partnering
on land rental agreements
with Independent Power
Producers on this programme
30 Agriculture: Market Intelligence Report 2016The cost of PV over time
R45 000
R40 000
R35 000
R30 000
R25 000
R20 000
R15 000
R10 000
R5 000
R0
2012 2013 2014 2015 2016 2017 2018 2019
Rooftop Solar PV system
R37 000 R30 000 R25 000 R22 000 R20 000 R17 750
without battery storage (R/kW)
Rooftop Solar PV system
with battery storage (R/kW) R42 500 R34 500 R29 000 R25 000 R23 250 R20 000
Rooftop Solar PV system without battery storage (R/kW)
Rooftop Solar PV system with battery storage (R/kW)
Figure 12: The cost of solar photovoltaic systems over time
Initially, farmers could not feed electricity In some cases the municipality will compensate
back into the grid due to regulatory hurdles. the farmer for the energy fed back to the
Today, farmers who are connected directly to grid at the same price the farmer paid for the
the medium or high voltage Eskom networks electricity (1 for 1) – this is known as “nett
(as opposed to municipalities) are able to metering”. In other words the farmer is selling
sell excess electricity back into the grid in electricity back to the municipality at the price
accordance with Eskom’s Ruraflex or Megaflex the farmer paid for it, which is higher than what
schemes (Eskom 2015). Even so, low voltage the municipality pays Eskom for it.
Eskom networks are still not allowed to feed
electricity back into the national power grid. Farmers who are directly connected to Eskom
will only be able to feed in if they have a
Agricultural customers that receive their medium or high voltage network connection
electricity from the municipality are governed through the Ruraflex or Megaflex schemes,
by specific municipal by-laws and regulations which uses a feed-in tariff and not “nett
regarding small-scale embedded generation. metering”. An example of this structure
In the Western Cape, 10 municipalities allow (although not directly relevant to agriculture)
embedded generation to feed electricity back is the Black River Park complex in the City of
onto their grid. Within these municipalities Cape Town. This is the first system to feed
there are four experimental feed-in tariffs and electricity into the distribution network. It
one NERSA approved tariff (Radmore 2015). is a 1.2 MW system (split into two separate
The municipalities where this is the case are systems to ensure that each is below the City's
highlighted in Table 8. This opens a new door 1 MW size limit) and feeds excess-generated
for renewable energy expansion. electricity into the city’s electricity grid.
Agriculture: Market Intelligence Report 2016 31Table 8: Municipalities (WC) that have PV rules, regulations and tariffs
Municipality District Seat Allow PV to feed Approved
into the grid PV tariffs
Beaufort West Local Central Karoo Beaufort West Yes Experimental
Municipality tariff
Bergrivier Local West Coast Piketberg Yes No
Municipality
Bitou Local Municipality Eden Plettenberg Bay Unknown Unknown
Breede Valley Local Cape Winelands Worcester Unknown Unknown
Municipality
Cape Agulhas Local Overberg Bredasdorp Unknown Unknown
Municipality
Cederberg Local West Coast Clanwilliam Unknown Unknown
Municipality
City of Cape Town Cape Town Yes Yes
Metropolitan
Drakenstein Local Cape Winelands Paarl Yes Experimental
Municipality tariff
George Local Eden George Yes Experimental
Municipality tariff
Hessequa Local Eden Riversdale No No
Municipality
Kannaland Local Eden Ladismith Unknown Unknown
Municipality
Knysna Local Eden Knysna Unknown Unknown
Municipality
Laingsburg Local Central Karoo Laingsburg No rules No
Municipality
Langeberg Local Cape Winelands Ashton Yes No
Municipality
Matzikama Local West Coast Vredendal No rules In progress
Municipality
Mossel Bay Local Eden Mossel Bay No No
Municipality
Oudtshoorn Local Eden Oudtshoorn Yes In progress
Municipality
Overstrand Local Overberg Hermanus No No
Municipality
Prince Albert Local Central Karoo Prince Albert No rules No
Municipality
Saldanha Bay Local West Coast Vredenburg Yes In progress
Municipality
32 Agriculture: Market Intelligence Report 2016Stellenbosch Local Cape Winelands Stellenbosch Yes No
Municipality
Swartland Local West Coast Malmesbury Yes Experimental
Municipality tariff
Swellendam Local Overberg Swellendam Unknown Unknown
Municipality
Theewaterskloof Local Overberg Caledon No In progress
Municipality
Witzenberg Local Cape Winelands Ceres No rules No
Municipality
Table 9: Small scale embedded generation residential tariffs
SSEG Residential Tariffs 2015/16 Units Tariff excl VAT Tariff incl VAT
Service charge R/day 11,43 13,03
Energy charge - Consumption c/kWh 95,76 109,17
0 - 600 kWh
Energy charge - Consumption c/kWh 187,63 213,19
600.1 + kWh
Energy charge - Generation c/kWh 56,99 N/A
The City of Cape Town’s small-scale embeddd –
generation (SSEG) conditions are that: In South Africa, more than
■■ the user must be a net-consumer over a year
10% of sol ar PV install ations
■■ embedded generation capacity must be are in the agriculture sector.
< 1MVA
■■ tariffs will be revised every 12 months by the Installations vary from 0.5kW to 500kW and
municipality include various subsectors like poultry, game,
mixed farming, fruit and wine. One of the
The agricultural sector has seen an increase biggest contributors is the installation of
in investment in renewable energy globally, borehole solar pumps. According to the Power
with solar PV leading the way. In South Africa, Quality and Renewable Services (PQRS 2015)
more than 10% of solar PV installations are in roughly 45 000 systems have been installed
the agriculture sector. The rise in large-scale in South Africa to date. If all the systems were
solar installations on farms in the Western Cape combined it would have a project size of
recently indicates that they make business 22 500kW.
sense for farmers.
Agriculture: Market Intelligence Report 2016 33In particular, the fruit and wine sub sectors of Nedbank also worked with farmers in the
the Western Cape have seen significant uptake industry to try and understand farmers’
of solar PV. Average savings of 27% can be challenges with moving to more sustainable
realised on packhouse or cold store electricity practices. A full report compiled by Nedbank,
bills through installing solar PV (Yell 2014). WWF and the Western Cape Department of
Agriculture will be available later this year.
Furthermore, GreenCape is developing a brief
– overview of the business case for solar PV for
Average savings of 27% can fruit packhouses which will be publicly available
be realised on packhouse or from March 2016.
cold store electricity bills
through installing sol ar PV 4.3. Conservation agriculture
Maintaining soil health is crucial for sustainable
agriculture production. However, conventional
To date, the five largest installations in the tillage is the leading cause of depletion of
Western Cape agri sector have been: soil health. Conventional farming includes a
■■ Ceres Fruit Growers: installed a 1 MWp sequence of soil tillage, such as ploughing and
PV system generating approximately harrowing, mainly for seedbed preparation
1,690 MWh/year, covering 6% of their and weed control. Residue is burned or tilled
annual electricity usage (ESI Africa 2013). back into the soil and either crop rotations or
■■ Rooibos Ltd: installed a 511 kWp solar monoculture is practiced. This is unsustainable,
system generating around 875 MWh/year. because in the long term tillage destroys soil
This will produce 40% of the company’s structure and contributes to a reduction in
electricity with a system lifespan of 25 years fertility and organic matter levels. This results
(Rooibos Limited n.d.). in a need for higher levels of chemical fertiliser
■■ Lourensford Wine Estate: installed a 500 and energy use, with associated financial and
kWp system generating about 750 MWh/ environmental costs.
year, with all electricity used by the estate
(Lourensford 2014). Increasingly, South African farmers are
■■ Arbeidsvreugd Fruit Packers: installed a recognising that as an alternative to
450 kWp system generating 3000 kWh/ conventional agriculture, the long-term benefits
day in summer months, saving 55% on their of Conservation Agriculture (CA) can be
electricity bill in the summer months with a realised through:
payback period of 6 years (Yell 2014).
■■ Stellenpak Fruit Packers: installed a ■■ Minimum mechanical soil disturbance:
420 kWp system which generates 600 MWh/ Achieved by practicing no-till, zero-till or
year. All the electricity is used by the facility; direct seeding. The degree of tillage is
saving of 15% on their electricity bill (Jooste determined by the technology available,
2014). soil characteristics and type of crops being
produced. The benefits include reduced
In 2015 Nedbank introduced a funding model fuel inputs and increased organic matter
to help farmers invest in renewable energy retention and water holding capacity.
technologies and energy efficiency projects. ■■ Diverse rotation: Successively planting
The goal is to match repayment terms to different crops, recognising that there is no
savings in electricity costs over the medium- single crop rotation system suitable for all
term. This allows the farmer to have a shorter production regions. Benefits include fewer
payback period. The loan also offers a 7% diseases, a lower weed burden and greater
rebate to farmers that qualify (Hancock 2015). soil fertility.
■■ Permanent organic soil cover: Protects the
soil from erosion and feeds soil biota.
34 Agriculture: Market Intelligence Report 2016You can also read