World Air Cargo Forecast 2014-2015
←
→
Page content transcription
If your browser does not render page correctly, please read the page content below
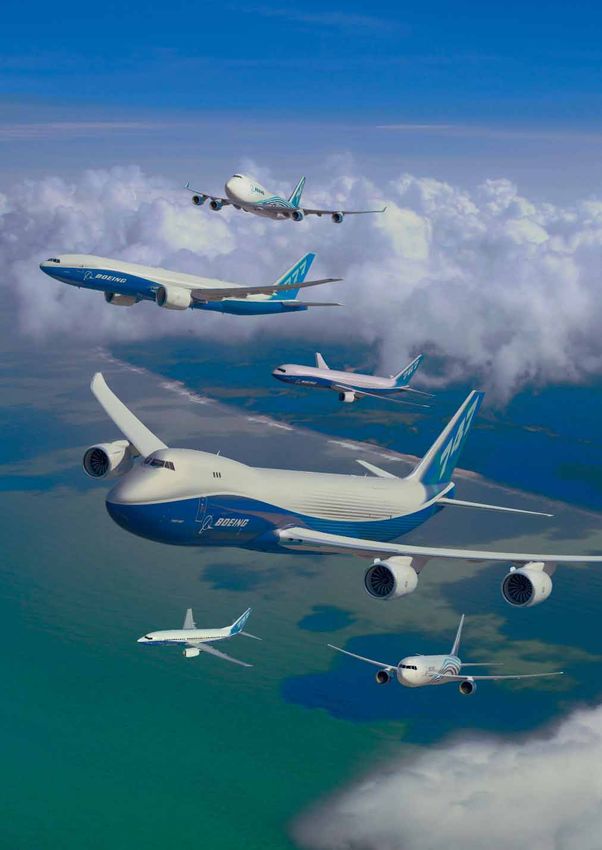
World
Air Cargo
Forecast
2014–2015

Foreword

Foreword
The Boeing Company issues the biennial World Air Cargo            The next update to the WACF will appear in fourth
Forecast (WACF) to provide a comprehensive up-to-                 quarter 2016. The authors welcome any questions or
date overview of the air cargo industry. The forecast             comments that readers may have. Direct any queries or
summarizes the world’s major air trade markets, identifies         suggestions to
major trends, and presents forecasts for the future
                                                                  Boeing World Air Cargo Forecast Team
performance and development of markets as well as
for the world freighter airplane fleet.                            Boeing Commercial Airplanes
                                                                  P.O. Box 3707, MC 21-33
After rebounding more than 19% in 2010 over the
                                                                  Seattle, Washington 98124-2207 USA
depressed levels of 2009, world air cargo traffic stagnated
from mid-2011 to early 2013. This prolonged period of
                                                                  Fax number
weak growth can be attributed to two factors: a weak
                                                                  1-206-766-1030
world economy and slack trade growth. Since the onset
of the global economic crisis in 2008, world air cargo
                                                                  Web
traffic has averaged only 1.7% growth per year through
                                                                  www.boeing.com/commercial/cargo
2013. On a positive note, world air cargo traffic began to
grow again in second quarter 2013. By July 2014, traffic           Tom Crabtree
had grown 4.4% compared with the first seven months                1-206-766-2576
of 2013. Forecasts for even better economic and trade             thomas.crabtree@boeing.com
growth should lead to sustained air cargo traffic growth
in 2015 and 2016.                                                 Tom Hoang
                                                                  1-206-766-2568
Data represented as historical in this document were              thomas.l.hoang@boeing.com
compiled from many sources, including Air Cargo
Management Group (ACMG), Airports Council International           Jim Edgar
(ACI), Airlines for America (A4A), Association of Asia-           1-206-766-2643
Pacific Airlines, Association of European Airlines, Boeing         james.r.edgar@boeing.com
Foreign Trade Database, Eurostat, IHS Economics, United           Russell Tom
Nations Council on Trade and Development (UNCTAD),                1-206-766-1711
Clarkson Research Services Limited (CRSL), Drewry                 russell.n.tom@boeing.com
Maritime Research, International Air Transport Association
(IATA), International Civil Aviation Organization (ICAO), Civil
Aviation Administration of China (CAAC), China Statistical
Bulletin, CAPA Centre for Aviation, Transport Canada,
and US Department of Transportation (DOT). Historical
information is updated each year as individual sources
revise their respective publications.
This document would not be possible without the efforts
of a number of contributors. The Boeing WACF 2014/2015
production team included the Creative and Information
Services design, production, web, writing, and editing
teams and our colleagues in the Airline Market Analysis
group. Special thanks are due to Mr. Steve Murphy and
Mr. David Franson for their thorough and diligent efforts on
the world freighter fleet forecast. Many thanks are due to
Mr. Kensuke Sakaki for his data research and authorship
of the intra-Europe and Africa sections. Mr. Bradley Hart
researched and authored the sections on the Middle East
and South Asia air cargo markets and built a database
on air cargo traffic that included nearly 750 airlines.
Mr. Matthew Kosmal provided valuable insight into the
Europe–Latin America air cargo market.

                                                                                   World Air Cargo Forecast 2014—2015     i
Table of Contents

Executive Summary                    1
World Overview                       5
North America                        15
Latin America and North America      18
Latin America and Europe             21
Europe and North America             24
Intra-Europe                         27
Middle East                          30
Africa                               33
Asia and North America               37
Europe and Asia                      40
Intra-Asia                           42
South Asia                           45
Commonwealth of Independent States   47
Domestic China                       51
World Freighter Fleet                54
Glossary                             59
Appendix                             62

                                          World Air Cargo Forecast 2014—2015   ii
Executive Summary

Air cargo traffic rebounds in 2014 after three years
of stagnation                                                   2013 air cargo growth by major market
After two years of either flat or slightly negative traffic
growth, demand for air cargo transport began to grow
slowly and steadily during the second quarter of 2013.          Region                                                 Percentage
                                                                World                                                      0.9
The uptick in traffic continued into the second half of 2013
to end the year 0.9% above the 2012 traffic total. Growth        Asia–North America                                        –2.2
has continued to gather strength in 2014, nearly recovering     Europe-Asia                                                1.4
the long-term trend rate. World air cargo traffic is forecast    Intra-Asia                                                –0.2
to grow an average 4.7% per year over the next 20 years         Europe–North America                                      –1.2
to reach a total of more than twice the number of revenue       Intra–North America                                        1.1
tonne-kilometers (RTK) logged in 2013. The number of            Domestic China                                             6.5
airplanes in the freighter fleet will increase by more than      Latin America–Europe                                       3.7
half by the end of the forecast period.                         Latin America–North America                                0.6
The traffic growth rates of 12 major air cargo markets in        Africa-Europe                                             –3.9
2013 reveals a few crucial developments for the industry.       South Asia–Europe                                          2.5
Domestic and intraregional markets were surprisingly            Middle East–Europe                                       13.6
resilient in the face of weak economic and trade growth,        Intra-Europe                                               1.5
helping to spur demand for standard-body freighter
airplanes. Traffic on international trade lanes connected
to developing world markets generally rose compared             Asia–North America, Europe-Asia, and
with 2012 traffic levels. However, air trade contracted in       Europe–North America are the leading
both directions on nearly all the east-west trade lanes         east-west air cargo markets
(those that connect Asia with Europe, Asia with North
America, and Europe with North America).                        2013
                                                                  World air cargo markets              Long-haul air cargo markets
Nearly 80% of long-haul air cargo traffic (routes longer                208 billion RTK                        131 billion RTK
than 4,500 kilometers) flows on these east-west trade                                      21%
                                                                                                               13%
                                                                37%
lanes. Most of the cargo carried on these routes is                                                                              34%

transported on large widebody freighters. Air cargo traffic
on these vital routes slackened during the global economic                                              22%

downturn, causing the yields of most large-freighter
operators to fall. In response to flagging demand and                                         20%

declining yields, operators curtailed large-freighter flights,
                                                                          8%                                  31%
in some cases parking their widebody airplanes. There                               14%

were as many as 70 parked 747-400 and MD-11 freighters
during the slowest period. In the third quarter of 2014,
however, operators began to return these two models             • Domestic and regional • Europe-Asia     • Europe–North America
to service as traffic volumes picked up.                         • Asia–North America    • Other long haul

Weak economic activity and slack trade curbed
air cargo traffic growth                                         World economic growth                                          Source:
                                                                                                                          IHS Economics,
Two principal causes are responsible for the weak               strengthening from 2014 to 2016                          September 2014

air cargo growth between 2011 and 2013: an under-
performing world economy and lackluster growth in trade,        GDP growth
particularly trade in the commodities that are traditionally    real year over year, by percentage
carried as air cargo.
                                                                      6
                                                                                                          Forecast
World economic activity, as measured by gross domestic
product (GDP), grew only 2.1% per year between 2008                   4          Long-term
and 2013. Even since rebounding in 2010 from the global                           average

economic slowdown of 2008 and 2009, world economic                    2
growth has lagged behind its historical trend of 3.2%
annual growth. Weakness in consumer demand and in                     0
business investment in Europe, North America, and Japan
                                                                   –2
accounts for much of the slowdown. Growth in China,                       2007     2009         2011   2013     2015    2017
India, Brazil, and other developing economies has also
slowed to varying degrees.

                                                                                      World Air Cargo Forecast 2014—2015                   1
Executive Summary

World economic activity began to pick up in late 2013,
particularly in the United States and China, and continued      Trade is improving as the                                              Source:
                                                                                                                      CBP Netherlands Bureau for
to build momentum during 2014. World GDP growth is              economy strengthens                                     Economic Policy Analysis

forecast to accelerate to the long-term average rate of
3.2% annual growth in 2015 and then to exceed the long-
                                                                Volume index
term average for several years before settling down to the      s.a. 2005 = 100; indicator of world merchandise trade
historic trend for the remainder of the forecast period.
                                                                    175
World merchandise trade, a component of world GDP,
is an important measure of economic performance
and a significant indicator of long-term air cargo traffic            125
trends. This component tends to exaggerate changes in
the broader GDP. World merchandise trade mirrors the
                                                                     75
prolonged postrecession stagnation of world air cargo
traffic as well as its recent strengthening. When economic
recovery became discernible in the second half of 2013,              25
trade volumes began to accelerate, particularly in Asia.              1992       1996          2000        2004     2008        2012
After faltering during the first quarter of 2014, trade growth
picked up again during the second quarter. The forecast
that world merchandise trade growth will hover around
historic rates supports the long-term outlook for continued
world air cargo traffic growth.                                  Air cargo demand is improving                                          Source:
                                                                                                                                        IATA, A4A

World air cargo traffic began to grow again during the           with trade growth
second quarter of 2013. By July 2014, traffic had grown
4.4% compared with the first seven months of 2013, which         Change in air cargo traffic over prior year
is generally in line with the trends of world economic and      Quarterly, by percentage
trade activity. Persistence of this trend through the end of     6
2014 would mark the first full year since 2010 in which air                                                                       55%
cargo traffic has grown more than 1%.                             4

World air cargo traffic growth detail                             2
International air freight will drive overall world air cargo
growth through 2033.                                             0

Over the next 20 years, world air cargo traffic will grow        –2
4.7% per year. Air freight, including express traffic, will
average 4.8% annual growth, measured in RTKs. Airmail           –4
traffic will grow much more slowly, averaging 1.0% annual             2012                           2013                        2014
growth through 2033. Overall, world air cargo traffic will
increase from 207.8 billion RTKs in 2013 to 521.8 billion
in 2033.
Asia will continue to lead the world in average annual          World air cargo traffic will more than double
air cargo growth, with domestic China and intra-Asia            over the next 20 years
markets expanding 6.7% and 6.5% per year, respectively.
The Asia–North America and Europe-Asia markets will             RTKs
grow slightly faster than the world average growth rate.        in billions

                                                                800
                                                                                    History         Forecast

                                                                600

                                                                400
                                                                       2.6% growth per year
                                                                200

                                                                    0
                                                                    2003       2008           2013      2018      2023      2028         2033
                                                                Average annual growth, 2013–2033
                                                                • High, 5.5%                    •
                                                                                               Base, 4.7%                      • Low, 4.0%

                                                                                     World Air Cargo Forecast 2014—2015                             2
Executive Summary

Latin America markets with North America and with
Europe will grow at approximately the world average            Historical and forecast air cargo growth rates
growth rate, as will Middle East markets with Europe.
Established markets grow more slowly than developing
markets, so North America and Europe air cargo growth          Region                                  History                   Forecast
rates are below the world average rate.                                                                2003–2013                 2013–2033
                                                                                                       by percentage             by percentage
Freighter fleet development
The number of airplanes in the worldwide freighter fleet        World                                        2.6                       4.7
will increase by more than half during the next 20 years       Asia–North America                           2.3                       5.4
as demand for air cargo services more than doubles.            Europe-Asia                                  4.8                       5.3
                                                               Intra-Asia                                   3.0                       6.5
The challenging market environment of the past three           Europe–North America                         0.6                       3.1
years have left traffic levels relatively flat, resulting in     Intra–North America                         –1.6                       2.1
                                                               Domestic China                               9.9                       6.7
persistent overcapacity and weak yields. Cargo capacity        Latin America–Europe                         5.0                       4.8
on passenger flights has been expanding as airlines             Latin America–North America                  2.5                       5.2
deploy new widebody jetliners, such as the 777-300ER           Africa-Europe                                1.0                       4.3
                                                               South Asia–Europe                            5.1                       4.7
and 787, that have large lower-hold cargo capacities,          Middle East–Europe                           4.1                       4.0
even with a full load of passenger luggage.                    Intra-Europe                                 1.6                       2.0

Dedicated freighter services nonetheless offer significant
advantages, including more predictable and reliable
volumes and schedules, greater control over timing             150 transpacific passenger flights provide                                      Source:
                                                                                                                                            Diio/Innovata,

and routing, and a variety of services for outsize cargo,      the equivalent of only 10 freighter flights                                      DOT T-100

hazardous materials, and other types of cargo that cannot
be accommodated in passenger airplanes. In addition,
                                                               Analysis of average daily flights from Asia to North America, 2013
range restrictions on fully loaded passenger flights and
the limited number of passenger frequencies serving
high-demand cargo markets make freighters essential                    150
where both long-range and frequent service are required.        passenger flights
For example, the Asia-to–North America market requires
about 70 daily freighter flights. It would take about
150 daily passenger flights to provide service equivalent
to 10 daily of those freighter flights.                                                       150 lower holds                     60
The demand for freighter capacity in long-haul markets is
not confined to the Asia–North America market. Freighters
                                                                                                    =
                                                                                               10 freighters*
                                                                                                                          freighter flights            60

are essential to all the east-west markets. Freighters carry                                                                                          10
about 72% of all air cargo carried between Europe and
Asia, as well as 43% of all cargo carried between Europe       *Conversion takes into account destination, range, and load factor.

and North America.

                                                               Freighters play a key role in major
                                                               east-west markets

                                                               Total air cargo traffic carried by freighters
                                                               by percentage

                                                                                72%
                                                                                                           80%                              43%

                                                                                       World Air Cargo Forecast 2014—2015                                    3
Executive Summary

Freighters are therefore projected to carry more than half
of the world’s air cargo for the next 20 years, even as          Freighters carry more than half of air cargo traffic
lower-hold cargo capacity expands faster than freighter
capacity. It should be noted, however, that the faster
growth and economical pricing of passenger lower-hold
                                                                 World RTKs carried on freighters
capacity makes the freighter share of the cargo market           by percentage
volatile when air cargo traffic growth is constrained.
                                                                 65
With air cargo traffic more than doubling by 2033, the
world freighter fleet will grow by more than half, from the
current 1,690 airplanes to 2,730 airplanes by the end of         60
the forecast period. The imperative for efficiency favors
large production freighters and will drive their share of the
fleet to grow from 21% to 30% during the forecast period.         55
Growing demand for regional express services in fast-
developing economies will drive the standard-body
share of the fleet to increase from 35% today to 40%
                                                                 50
in 20 years. All new deliveries of standard-body freighters           2000   2001   2002   2003   2004   2005   2006   2007   2008   2009   2010   2011    2012   2013   2033*

will be converted passenger airplanes.                           *Forecast.

Of the 2,170 projected freighter deliveries, 1,130 will
replace retiring airplanes, with the remainder expanding
the fleet to meet projected traffic growth. More than 60%          Fleet grows by more than half, shifts to large
                                                                 production and standard-body converted freighters
of deliveries will be freighter conversions, nearly 85% of
which will be standard-body passenger airplanes.
A projected 840 new production freighters, valued at             2013                                                            2033
$240 billion, will be delivered, of which more than 70%          1,200                                                           1,100
will be in the large-freighter category.
                                                                                                                                     40%
More than 40% of all freighter deliveries during the 20-year      900                                                                                              800
forecast period will be to carriers in the Asia Pacific region.                                                                                                     30%
                                                                               590
Asia Pacific-based carriers will continue to receive a high        600
                                                                                                                                             440
proportion of large production freighters to serve their                       35%
                                                                                           340
                                                                                                    400
                                                                                                                360                                       390

long-haul, intercontinental routes. North America                 300                               24%
                                                                                                                                             16%
                                                                                                                                                          14%
                                                                                           20%                  21%
will receive 30% of freighter deliveries over the next
20 years. Most of those deliveries will be to express                  0
carriers. Historically, up to three-quarters of medium                               1,690 freighters                                       2,730 freighters

widebodies, production and conversion, have supported
express operations, in which relatively low airplane             • Standard-body conversions                                               • Widebody conversions
utilization makes converted freighters economically
                                                                 • Medium-widebody production                                                  • Large production
attractive. Standard-bodies will continue to support
the needs of emerging regions, niche segments, and
express operations.

                                                                                                 World Air Cargo Forecast 2014—2015                                              4
World Overview

Air cargo traffic began growing again in 2013
From mid-2011 to early 2013, world air cargo traffic           World air cargo traffic has slowed over
stagnated. This period of flat growth followed the decline     the past decade
in traffic associated with the global economic downturn of
2008 and 2009 and its strong recovery in 2010. Beginning      RTKs
in second quarter 2013, however, traffic began slowly and      in billions
steadily to grow again, expanding 0.9% over 2012 levels
for the full year. Growth continued to accelerate in 2014.    250

World air cargo traffic has averaged 5.2% growth per           200
year since 1983. The growth rate actually exceeded
                                                              150
6% in several years throughout the 1980s, 1990s, and                   6.8% growth per year                          2.6% growth per year
early 2000s. Growth slowed as fuel prices began to rise       100
in 2005 and some shippers began to divert freight to                                          6.3% growth per year
                                                               50
less expensive modes of transport.
                                                                 0
The global economic downturn, the worst economic
contraction since the Great Depression, dragged down                 1983     1988       1993       1998       2003       2008       2013
all modes of freight transport. World air cargo traffic
dropped 13% over the two years ending in 2009. Traffic
jumped 19.4% in 2010 and gained a further 0.8% in 2011
as global businesses replenished their inventories. The net
result of these developments is a world air cargo traffic      2013 air cargo market share by airline domicile
growth rate of only 2.6% for the span of years between
2003 and 2013. The growth rate since 2008 is only 1.7%.
Containership traffic slowed to a similar pace during this
timeframe.                                                                                           207.8 billion RTKs
                                                              • Asia
                                                                                                                1%
The second quarter of 2013 brought a positive note as                                                  3% 3%
world air cargo traffic began growing again. Global air
                                                              • North America                    11%
trade continued to gather momentum in 2014, and by            • Europe                                                         36%
July 2014, traffic had grown 4.4% compared with the first       • Middle East
seven months of 2013. Even stronger growth is anticipated     • CIS
for the remainder of 2014 and all of 2015 as the world                                        21%
                                                              • Latin America
economy and trade recover to long-term growth trends.
                                                              • Africa
Air cargo growth varies by airline domicile
and service type                                                                                               25%
The market share of airlines based in Asia and the Middle
East has grown relative to that of airlines based in other
regions. Scheduled air freight continues to claim the
largest share of the air cargo market relative to charter
and mail services.
Regional air cargo market shares have changed
significantly during the past two decades. Airlines based
in Asia, Europe, and North America have accounted for
more than 80% of the world’s air cargo traffic for that
entire span of years. Airlines based in North America led
all other world regions with a 35% share of the world’s air
cargo traffic in 1992. This changed during the 1990s and
early 2000s as the share flown by airlines based in Asia,
including those based in China, grew from 28% in 1992
to 39% in 2010, reflecting the rapid expansion of Asian
export markets.
Since 2000, however, carriers based in the Middle East
have leveraged their geographic position at the crossroads
between Africa, Asia, and Europe. Middle East carriers
have quickly expanded their widebody passenger and
freighter fleets, allowing them to increase their share of
world air cargo traffic from 4% in 2003 to 11% in 2013.
                                                                                   World Air Cargo Forecast 2014—2015                       5
World Overview

That same year, airlines based in Asia, Europe, North
America, and the Middle East accounted for 91% of the             World scheduled air freight grew 0.5% in 2013
air cargo traffic in the entire world.
World air cargo comprises three main service sectors:
scheduled freight, charter freight, and mail. Scheduled           RTKs
                                                                  in billions
freight is the largest component, accounting for 88% of all
world air cargo traffic. Scheduled freight includes general        200
and express (sometimes referred to as “integrator”) freight.
The scheduled freight market share has remained more              150
or less stable since 1992. Most shippers use regularly
scheduled cargo services whenever possible because it is          100
generally the least expensive way to ship by air. Scheduled
freight grew 0.5% in 2013 compared with 2012.                      50
Charter air freight (sometimes referred to as nonscheduled
freight) accounts for 8% of world air cargo traffic. The              0
                                                                         1992           1997        2002          2007            2012
charter sector captures traffic with urgent and/or special
handling requirements. Nearly all urgent or special-              • Africa  •      •
                                                                                Asia      Commonwealth of Independent States    • Europe
handling cargo is carried on freighter airplanes, rather          • Latin America • Middle East • North America
than in the lower hold of passenger airplanes. The charter
freight market share generally rises during periods of
strong world air cargo growth and, conversely, falls during       World charter air freight grew 2.9% in 2013
times of slow or negative traffic growth. The charter
segment grew 2.9% in 2013, particularly during the fourth
quarter of that year as demand for several new-technology         RTKs
products exceeded manufacturer expectations.                      in billions
                                                                  20
Large widebody freighter ACMI services
Large widebody ACMI traffic volumes have fallen since
                                                                  15
the global economic downturn but still comprise 5% of
world air cargo traffic.
                                                                  10
Aircraft, crew, maintenance, and insurance (ACMI)
providers, sometimes called “wet lease providers,” offer           5
cargo operators the flexibility to obtain lift on a trial basis,
to augment existing markets and to provide service in              0
markets that are highly seasonal—all with no capital                     1992           1997        2002          2007            2012
equipment investment required. Large freighters in long-          • Africa  •      •
                                                                                Asia      Commonwealth of Independent States     • Europe
haul markets account for the most significant segment              • Latin America • Middle East • North America
of the air cargo ACMI business. The ACMI business is
sensitive to changes in the air cargo business, but it has
become an established industry subsector since the early          About 5% of world air cargo traffic is transported
1990s. ACMI providers have maintained approximately               by ACMI providers
a 5% to 7% share of total world air cargo traffic for the
past decade.
                                                                  RTKs
ACMI large freighter traffic has grown an average 11.3%            in billions
per year over the 24 years since 1990. Annual growth              16
has been uneven, however, since 2000. ACMI traffic                                                             11.3% average annual growth
contracted 8.9% in 2008 and another 4.6% in 2009 as
                                                                  12
the effects of the global economic downturn took their
toll. As demand for dedicated freighter airplane capacity
rebounded in late 2009 and 2010, this segment benefited             8
greatly from the limited availability of long-haul freighters
in operator fleets. World air cargo traffic stagnated from           4
mid-2011 to early 2013, driving ACMI traffic to decline 5%
in 2012 and 9.7% in 2013. The drop in demand forced                0
several ACMI providers to exit the business in 2012                    1990            1995       2000         2005            2010
and 2013, but airlines with newer large freighters were
generally able to survive this period of slow traffic growth.

                                                                                        World Air Cargo Forecast 2014—2015                  6
World Overview
International express
International express traffic continued to grow faster than International express market share reached
the average world air cargo growth rate, expanding 8.9% 17% in 2013
in 2012 and 5.8% in 2013.
The distinction between express and general air cargo RTKs
in billions
continues to blur. Traditional providers are expanding
their time-definite offerings, and express carriers, freight 200
airlines, and postal authorities are consolidating. Ultimately,
the air cargo customer benefits from increased service 150
options and lower prices as market pressure brings
competing products into the market. 100
International express traffic grew at nearly triple the
50
rate of total worldwide air cargo traffic, averaging more
than 22% annually from 1992 to 2000, as measured in
revenue tonne-kilometers (RTK). However, growth slowed 0
1993 1998 2003 2008 2013
considerably, to about 6.8%, between 2000 and 2008.
This pattern of rapid growth followed by more modest • International express • International freight and mail
growth parallels the double-digit growth of the domestic
US express industry during the 1970s and 1980s, which
was followed by slower growth. However, international
express traffic growth was interrupted in 2009, falling
12.6% as a result of the global economic downturn. The
recovery was robust, with express traffic increasing 24.8%
in 2010 and 11.6% in 2011. The upward trend continued in
2012 and 2013 with 8.9% and 5.8% growth, respectively.
Higher-than-average annual growth boosted the express
share of international air cargo traffic from 4.1% in 1992 to
13.4% in 2008. The international express share remained
at about 13% of total international traffic during the global
economic downturn from 2008 through 2010. In 2011, the
international express market share increased to 14.7% and
then, continuing to outpace the growth of international
freight and mail, increased its share to 16.2% in 2012
and 17.0% in 2013.
The average international express shipment size has
also continued to grow. Average shipment weight is
estimated to have increased from 2.7 kilograms in 1992
to 6.6 kilograms in 2013, which indicates continuing
inroads of express services into the traditional province
of general air cargo. As businesses continue to expand
beyond domestic and nearby regional markets, the
international express sector will continue to grow, albeit
at more sustainable, long-term rates.
World air cargo and maritime traffic
With improving global economic conditions, world trade
and containership traffic are growing slowly after struggling
through the global economic downturn.
Air cargo is only one part of the global goods distribution
network. Shippers demand that shipments arrive at their
destination on time, undamaged, and at a reasonable price,
regardless of transportation mode. Different transport
modes—road, rail, maritime, and air—can often move the
same commodities. But shippers usually have only two
choices for intercontinental freight: air and maritime. Maritime
transport offers the primary benefit of low cost; air transport
offers the benefits of speed and reliability.
World Air Cargo Forecast 2014—2015 7World Overview
World trade commodities shipped by sea
The maritime transportation industry is much larger than World trade focused on bulk commodities
the air cargo industry, measured in tonnes of goods
transported. In 2013, the world maritime industry carried
an estimated 9.5 billion tonnes, compared with 42 million Commodity group classifications
tonnes for the air cargo industry. By weight, more than
80% of world trade is in raw materials and other bulk
items, such as oil, metal ores, and grains. Because most Air commodities
of these commodities are low value and are not time
Air
items 1%
sensitive, they are shipped by sea in specialized tankers Chemicals,
or bulk carriers. Movement of these bulk commodities textiles, fruits,
14% Containership
vegetables, wood
constitutes the major part of world trade and maritime products, other items
commodities
traffic, which cannot be directly compared with transport Iron, stone, steel,
of the high-value commodities generally shipped by air. rocks, wheat, cement, corn,
other bulk items
22% Other bulk
Although air cargo constitutes only an estimated 1% of
world trade calculated by tonnage, air cargo represents
about 35% of world trade calculated by the value of Crude petroleum,
natural gas, iron ore, coal 63% Heavy bulk
goods shipped.
Containership transportation
Containerized cargo, a segment of maritime dry cargo,
is one of the fastest growing forms of freight transport.
Although the major portion of maritime cargo consists
of low-value bulk commodities, containerships also
carry some commodities that are typically carried by air,
providing a low-cost transportation alternative for goods
that do not require the speed and reliability of air shipment.
Since the late 1980s, globalization and regional
specialization of industry, particularly in Asia, have driven
rapid growth in containership freight flows. Containership
tonnage is estimated at 1.53 billion tonnes in 2013,
representing about 40% of world maritime dry cargo.
Containership tonnage has been growing faster than other
maritime transportation segments. Containerized cargo
tonnage grew an average 7.4% per year between 2000
and 2013, while tanker cargo averaged 2.3%; main bulk
commodities, 6.0%; and noncontainerized dry cargo, 1.4%.
Many of the world’s trade lanes are not balanced
directionally. Finished products fill the available capacity
in one direction, but there are fewer goods to take up the
capacity in the opposite direction. Capacity on return trips
is therefore available at a low price. Taking advantage of
this directional capacity surplus, shippers are transporting
many bulk and low-cost goods as containerized cargo,
instead of as maritime bulk cargo. For example, in 2013,
soybeans, motor vehicles, waste and scrap metals, and
cotton were the top commodities by weight shipped
on containerships from the United States to China. The
growth in containership traffic has been primarily transport
of these types of products, not of the high-value goods
commonly shipped by air.
World Air Cargo Forecast 2014—2015 8World Overview
Comparison of containership and air cargo
transport traffic Container trade has grown by taking market Source:
Containership cargo traffic in 2013 is estimated at share from other maritime segments UNCTAD,
Fearnleys, CRSL
11.2 trillion RTKs, while world air cargo traffic is
208 billion RTKs. The largest containership markets, as Tonnes loaded
measured in RTKs, mirror the largest air cargo markets. in billions
In 2013, Europe-Asia was the largest containership
10
market, with 2.9 trillion RTKs, followed by Asia–North
America with 2.0 trillion RTKs and Europe–North America 8
with 0.3 trillion RTKs.
6
Until the global economic downturn, the containership
industry had grown steadily every year since its inception. 4
Between 1980 and 2011, containership tonnage averaged
8.9% growth per year. Both air and maritime cargo had 2
major declines during the global economic downturn.
0
World air cargo traffic fell by 9.4%, and containership 1990 1993 1998 2003 2008 2013
freight dropped 7.2% in 2009. Deteriorating economic
conditions and the consequent drop in demand for
• Containerized cargo • Main bulk Tanker
commodities
• Noncontainerized dry cargo • cargo
shipping services brought overcapacity, declining yields,
and financial losses to the container shipping industry.
Operators responded with measures including “slow Container trade has grown faster than air cargo
steaming,” trimming ports of call, reducing frequencies, through diversion of low-value bulk commodities
and taking ships out of service.
The global economy appeared to be recovering in 2010. World air cargo traffic World maritime cargo traffic
Containership capacity was restored, and new ships RTKs in billions in containers
were ordered. When the economic recovery slowed in RTKs in billions
2011, the containership industry had a severe excess of 250 12,000
capacity as the demand for shipping services declined.
As a result, containership yields dropped to very low 200 9,600
levels as operators struggled to maintain loads. At the 150 7,200
same time, rising fuel prices led to increased operating
costs. Growth of containership traffic dropped after the 100 4,800
initial recovery from the global economic downturn, as 50 2,400
did air cargo traffic. Average annual containership growth
in RTKs fell to 3.9% from 2008 to 2013 after growing at 0 0
an average annual rate of 10.6% the previous five years. 2003 2008 2013
While containership growth continued to exceed air cargo • Air cargo: 2003–2013, 2.6%; • Cargo in containers: 2003–2013, 7.2%;
2008–2013, 1.7% 2008–2013, 3.9%
growth, the growth resulted from the increased transport
of bulk goods, not from the transport of goods normally
shipped by air. It is estimated that the top 20 container
lines had combined losses of US$6.5 billion from Air cargo has maintained its market share Source:
US DOC
in the key transpacific cargo market foreign trade data
2008 to 2012. Containership companies are currently
trying to stabilize and increase yields to hold down
continuing losses. Tonnes Air cargo market share
in millions by percentage
Air cargo continues its role in world trade Top 20 air cargo commodities for the Asia–North America market
Throughout the economic turmoil and resulting world 80 1.7%
trade distress during the past few years, air cargo has 2.0%
2.1% 2.0%
proved to be resilient and has maintained its market 2.0% 2.0% 2.5% 2.2%
60 2.2%
share of the commodities historically shipped by air. 2.0% 2.3%
2.0%
For example, in the transpacific market, about 2% 2.0% 1.8%
40
by weight of nonbulk, high-value commodities have
been transported by air since 2000. Demand for these
commodities has fluctuated, but the share shipped by 20
air has remained steady. The speed and reliability
provided solely by air cargo continue to play a vital 0
role in world trade. 2001 2003 2005 2007 2009 2011 2013
• Maritime tonnes • Air cargo tonnes
World Air Cargo Forecast 2014—2015 9World Overview
Forecasting methods
Several approaches can be used to handle the range and Demand pulls air cargo traffic
complexity of forecasting challenges. Each approach is
carefully matched to the specific issue and application.
Four approaches—econometric modeling, evaluation
based on judgment, trend analysis, and potential analysis—
provide useful forecasts. Econometric modeling helps
determine the overall importance of underlying economic Air, sea, and land
costs
factors (e.g., GDP) and provides forecasts that are linked Products
to expectations of those factors. This method is useful for Economic
medium- and long-range forecasts in regional markets. Exchange
rates
The demand for air freight depends on the economic activity
activity in the importing region or country, conditioned by
Relative
transportation costs, exchange rates, and relative prices. prices
Econometric modeling may be used to predict demand,
Exporter Importer
assuming that adequate capacity will be in place to meet
the demand and that factors not included in the model
will exert the same influence as in the past. Modifications
based on judgment often account for expected changes
in noneconometric growth factors. For example,
estimating the effect of air service agreements, trade
quotas, restrictions on airport night operations, and
changes in trade patterns could be vital to an airline’s
strategic plan. Incorporation of anticipated increases in
capacity, route restructuring, and market programs can
contribute to more reasonable forecasts.
A simple trend analysis often is used to evaluate changes
in economic factors. This approach is useful in evaluating
general changes in the marketplace that can be attributed
to the combined effects of a number of factors. Such
trends can be extrapolated into the future. However,
extrapolation from a small base with large growth can
produce unrealistic results.
Potential analysis is particularly useful for forecasting
markets in their early stages of development. For example,
commodities transported by air tend to be valued at more
than $16 per kilogram. It is therefore possible to project
a potential air cargo market based on the percentage
of traded goods (regardless of transport mode) that
are valued above $16 per kilogram.
Market environment
Although economic activity is the primary influence
on world air cargo development, other factors must
be considered.
Factors beyond the control of airlines include inventory
management techniques, modal competition,
environmental regulations, globalization, market
liberalization, national development programs, and
the introduction of new air-eligible commodities. All of
these factors play significant roles in air cargo growth.
Constraints on economic growth, primarily those
originating outside the airline industry, can dramatically
hinder air transport industry growth. A variety of air
transport industry constituencies and policymakers
address these interrelated growth concerns.
World Air Cargo Forecast 2014—2015 10World Overview
Fuel prices have been a persistent problem for air cargo.
As fuel prices roughly tripled between 2004 and 2012, Factors and constraints for air cargo growth
freight forwarders and the greater shipping community
diverted a larger portion of general cargo to less expensive
modes of transport. As of third quarter 2014, jet fuel prices Industry relocation
clung to the elevated 2012 levels but remained below the
historic highs of 2008. Fuel is forecast to remain relatively Trade quotas New Directional
and restrictions commodities imbalances
stable at current prices for the next few years. Export
Widebody
promotion
freighters and
Competition with other modes of transportation could Currency New trade
lower holds
Surface
relationships Airline market
present a challenge for air cargo. Changes in the revaluations
research
competition
containership industry have enticed shippers to move National
development World and Airline market
their freight away from air cargo when schedules and time Environmental programs regional and shipper Airport
regulations GDP growth education curfews
commitments to customers permit. Containership pricing “Open skies” and
new air services
is generally 10 times less expensive per unit weight than Lack of
agreements Shipper Terrorism and
airport access utilization armed conflict
air cargo but at the expense of longer and less reliable Deregulation
Proliferation
transit times. The goods that are shipped by air are high Express of points served
market Just in time
value, time sensitive, and perishable and require speedy Air and surface
labor stoppages concepts
Oil and fuel price
and availability
and reliable transport. To continue to compete effectively
with containerships, the air cargo industry must ensure
that the service benefits of air transportation are not
eroded. For example, track-and-trace tools, once the International air freight yields fell in 2012 and 2013
sole provenance of the air express industry, are now
commonplace at surface transport providers.
Changes in the behavior of shippers have also Index
affected the air cargo market. E-mail and the electronic 1993 = 1.0
transmission of documents have reduced the need to 1.2
ship many types of small parcels and documents that are
1.0
the life blood of express and courier companies. Better
information and improved supply chain visibility allow 0.8
shippers to plan and manage their supply chains with a 0.6
higher degree of confidence, encroaching on one of the 0.4
primary advantages of air cargo. Air cargo has traditionally
0.2
offered shippers a unique means to recover from
unforeseen events and emergencies. Anecdotal evidence 0.0
suggests that improved supply chain visibility has reduced 1993 1998 2003 2008 2013
the occurrence of situations that demand the speed and • 1993–2013:
Passenger yield • 1993–2013:
Freight yield
–2.0% –2.3%
reliability of air transport. 2003–2013: +3.1% 2003–2013: +0.9%
Yield trends
Freight yields have declined at an average rate of 2.3%
per year over the past 20 years.
Cargo revenue represents approximately 14% of total
air traffic revenue on average. Some airlines earn nearly
35% of their revenue from cargo. Continuing industrywide
declines in yield for cargo and passenger services reflect
productivity gains, technical improvements, and intense
competition. Although declining yield creates pricing
pressure on all industry segments, from service providers
to airplane manufacturers, it also helps stimulate growth
for the industry by enabling lower transportation cost for
the consumer.
Within the past decade, the downward yield trend has
reversed, with yield increasing on an inflation-adjusted
basis. Freight yield increased 0.9%, and passenger yield
increased 3.1% per year since 2003.
World Air Cargo Forecast 2014—2015 11World Overview
From 2003 through 2008, freight yield increased
approximately 4.7% per year. Much of the increase is Historical and forecast world economic
owing to fuel and security surcharges that were first growth by region
imposed in 2003. Significant fuel surcharges imposed in
2008 in response to the fuel crisis helped yields increase Annual change
17.2% compared with 2007. The global economic downturn by percentage
drove freight yields down 22.4% in 2009. In 2010, when History Forecast
cargo traffic rebounded and demand growth outpaced 8
capacity, freight yield increased 26.1%. In 2011, freight yield 6
increased 6.3%, with air freight traffic growing 0.8%. The 4
yield gain can be attributed to strong cargo traffic growth
2
in the first four months of 2011.
0
From 2012 through 2013, as total cargo capacity increased –2
and demand stayed nearly flat, the pressure on freight yield
resulted in an annual yield decline of 8.4%. –4
–6
Over the past two decades, freight yield has declined 2.3% 1993 1998 2003 2008 2013 2018 2023 2028 2033
per year. The second decade saw yield increase 0.9% per • Asia • North America • Asia • World
year compared with a 5.4% per year decline in the previous
decade. Increased cost of shipping by air and the downturn
in the world economy held world air cargo traffic growth
to only 2.6% during the past 10 years, which is below the Forecast average regional GDP growth rates
historical trend. Industrywide declines in freight yields are
expected to continue in the future as more efficient airplanes
enter the market, helping to stimulate market growth. Growth
average annual percentage change for 2013–2033
World economic growth outlook
The world’s economy is forecast to grow at an average China 6.3%
annual rate of 3.2%. Africa 4.6%
Persistent weak growth characterized the past two years, Asia* 4.6%
continuing a painfully slow and uneven recovery since Latin America 3.8%
the global economic downturn. More recently, however, Middle East 3.8%
developed economies, especially that of the United States, North America 2.5%
seem to be leading the way toward gradual acceleration, Europe 1.9%
albeit dampened by poor weather, financial market
Japan 1.0%
turbulence, regional political instability, and military
conflicts in early 2014. World GDP growth of 3.5% to 3.6% 0 1 2 3 4 5 6 7
is predicted over the next several years, reflecting increased *Includes China and Japan.
globalization and broader diffusion of modern technology.
These near-term growth rates exceed the forecast long-
term rate, which averages 3.2% annual growth through
2033. Business sentiment is mostly consistent with an
improving outlook.
An increasingly integrated world economy is forecast to
expand at an average 3.2% annually through 2033. The
long-term growth rate for North America is expected to
average 2.5% per year over the same period. Similarly,
Europe’s GDP is projected to grow about 1.9% per year
during the next 20 years.
Asia will continue to lead the world’s major economies with
projected growth of 4.6% per year between 2013 and 2033.
China, in turn, leads individual country long-term growth
with a 6.3% average annual increase, in contrast to Japan
at 1.0% per year. Asia’s share of world GDP is projected to
rise from 31% in 2013 to nearly 40% by 2033. The world
GDP share held by North America and Europe, which
together currently account for more than half of economic
activity, will drop to less than 42% by 2033.
World Air Cargo Forecast 2014—2015 12World Overview
World air cargo traffic forecast
World air cargo is the sum of freight and mail. World air World air freight will grow 4.8% per year
freight traffic is strongly related to GDP and average yield. through 2033
The world airmail component, however, depends less on
yield and therefore correlates most strongly with GDP.
RTKs
in billions
Low, baseline, and high annual growth of 4.1%, 4.8%,
and 5.6%, respectively, are forecast for world air freight 800
History Forecast
traffic. High and low scenarios correspond to GDP growth
of 0.5% above long-term projections and 0.5% below, 600
respectively. Worldwide air freight is expected to more
than double over the next 20 years, increasing from 400
200 billion RTKs in 2013 to 512.3 billion RTKs by 2033. 2.7% growth per year
200
World airmail is forecast to grow at a consistent 1.0% per
year. Risks that could affect future airmail growth include 0
inroads by express operators into package mail, increasing 2003 2008 2013 2018 2023 2028 2033
reliance on Internet communication, entry of traditional
Average annual growth, 2013–2033
postal services into express air freight operations, and
more stringent security requirements.
• High, 5.6% • Base, 4.8% • Low, 4.1%
The baseline forecast for total world air cargo predicts
that traffic will more than double between 2013 and 2033. World airmail will grow 1.0% per year through 2033
Worldwide traffic will grow from 207.8 billion RTKs in
2013 to more than 521.8 billion RTKs by the end of the
forecast period. Sustained economic growth, along with
RTKs
decreasing yields, contributes significantly to the growth in billions
of the air cargo industry.
12
History Forecast
9
1.2% growth per year
6
3
0
2003 2008 2013 2018 2023 2028 2033
Average annual growth, 2013–2033
• High, 1.2% • Base, 1.0% • Low, 0.9%
World air cargo (freight and mail) will grow
4.7% per year through 2033
RTKs
in billions
800
History Forecast
600
400
2.6% growth per year
200
0
2003 2008 2013 2018 2023 2028 2033
Average annual growth, 2013–2033
• High, 5.5% • Base, 4.7% • Low, 4.0%
World Air Cargo Forecast 2014—2015 13World Overview
Regional air cargo markets
Air cargo markets linked to Asia, especially to the Pacific Asia markets will continue to lead industry growth
Rim countries, will lead all other international markets in
average annual growth between 2013 and 2033.
RTKs Annual growth
Nearly all trade lanes connecting to Asia over the past two in billions by percentage
years saw virtually no growth as a result of the slowdown
Asia–North America 5.4%
in the US and Europe economies. Demand for air cargo
Europe-Asia 5.3%
traffic started to grow during the second quarter of 2013 Intra-Asia 6.5%
as the world economy improved. Cargo demand continues Europe–North America 3.1%
to grow in 2014 with Hong Kong International Airport and North America 2.1%
Shanghai Pudong International Airport Cargo Terminal Domestic China 6.7%
Company reporting air cargo traffic growth of 6.8% Latin America–Europe 4.8%
Latin America–North America
and 16.0%, respectively, through August 2014. Growth 5.2%
Africa-Europe 4.3%
continues to strengthen and is now starting to return to
South Asia–Europe 4.7%
the long-term trend. Middle East–Europe 4.0%
Intra-Europe 2.0%
Intra-Asia traffic is forecast to grow faster than any other
0 30 60 90 120 150
international world market, averaging 6.5% growth
per year. The Asia–North America and Europe-Asia • 2013 RTKs • 2014–2033 RTKs
markets will grow at an average 5.4% and 5.3% per year,
respectively. Domestic China will be the fastest growing
contiguous market in the world, averaging 6.7% annual
growth for the forecast period.
The mature markets of North America and intra-Europe will
grow more slowly, at 2.1% and 2.0% per year over the next
20 years. Also projected to lag behind the world average
growth rate are the markets of Europe–North America at
3.1%, Middle East–Europe at 4.0%, and Africa-Europe at
4.3% growth.
The South Asia–Europe market is forecast to grow at
the world average rate of 4.7% per year. Air cargo growth
in the Latin America–Europe and Latin America–North
America flows is forecast to exceed the world average at
4.8% and 5.2%, respectively. Market shares will continue
to change as a result of varying regional growth rates.
Intra-Asia is currently the fifth largest air cargo market,
but because it is forecast to grow 6.5% per year over the
next 20 years, it will be the third largest air cargo market
by 2033. The share of world air cargo traffic associated
with Asia, including the domestic markets of China and
Japan and all international markets connected to Asia,
will increase from 51.3% in 2013 to 61.1% in 2033.
World Air Cargo Forecast 2014—2015 14Regional Markets
North America
For the purposes of this forecast, North America is defined as the United States
and Canada.
Express service dominates the US air cargo market
Air cargo traffic grew in 2013
Air cargo moving to, from, and within the United States
and Canada accounts for 9.1% of the world’s air cargo RTKs
in billions
traffic in terms of tonne-kilometers and 14.1% in terms
of tonnage alone. 30
The North American air cargo market grew modestly
in 2012 and 2013, reflecting the slow recovery from the 20
global economic downturn. North American air cargo
traffic grew 1.9% in 2012 and 1.1% in 2013. US domestic
air cargo, which accounts for 95.9% of the North 10
American market, grew 1.9% in 2012 and 1.0% in 2013.
Canadian domestic air cargo, which is 2.2 % of the total 0
North American market, grew 2.2% in 2012 and 2.7% in 1979 1984 1989 1994 1999 2004 2009 2013
2013. Transborder traffic from the United States to Canada
accounts for 1.6% of the 2013 North American market, • Express carriers • Mail • Charter freight • Scheduled freight
while transborder traffic from Canada to the United States
accounts for 0.3% of the North American market.
US domestic air cargo market
The US domestic market grew 3.0% during 2012 and 2013.
The US domestic market is mature and has remained
relatively flat in recent years, except during the global
economic downturn, which resulted in a drop of 12.4% in
2009. Traffic continued a slow recovery in 2012 and 2013,
growing 1.9% and 1.0%, respectively. US domestic traffic
grew to 18.0 billion revenue tonne-kilometers (RTK) in 2012
and 18.2 billion RTKs in 2013. Annual revenue for the US
domestic air cargo industry was flat at $27.9 billion in 2012
and in 2013. Revenues are still 15% below the industry
peak of $32.9 billion, which was set in 2007.
The express carrier share of the total North America air
cargo market declined slightly to 62.6% in 2012 and to
62.3% in 2013. Express carrier traffic was 11.3 billion
RTKs in 2012, a decrease of 1.0% from 11.4 billion
RTKs in 2011. Traffic increased 0.6% in 2013 returning to
11.4 billion RTKs. After increasing consistently during the
1980s and 1990s, the shipment volume of the express
carriers flattened between 2001 and 2007 as the market
matured. Volumes have remained flat since the global
economic downturn of 2008 and 2009. Express carrier
volume was 5.4 million shipments per day in 2011 and
2012, growing to 5.5 million shipments per day in 2013.
Scheduled freight traffic in the domestic US market grew
11.4% in 2012 and remained flat at 2.8 billion RTKs in
2013. The market share of scheduled US domestic freight
carriers increased from 14.2% in 2011 to 15.5% in 2012,
then declined to 15.3% in 2013.
Scheduled mail accounted for 17.6% of the US market in
2013 with 3.2 billion RTKs. Mail traffic decreased by 0.6%
in 2012 and increased 5.9% in 2013. Chartered operations
accounted for 4.7% of the US market with 0.9 billion RTKs
in 2013. The market share of charter operations has been
volatile. After increasing 15.2% in 2011 and 25.5% in 2012,
charter operations decreased 7.1% in 2013.
World Air Cargo Forecast 2014—2015 15North America
Canada domestic air cargo market
Canada’s share of the region’s air cargo market has Canada GDP and domestic Canada
remained steady. air cargo growth
The Canadian domestic market accounted for 2.2% of the
total North American air cargo market in 2013. Typical of Growth
percentage
a mature market, domestic Canada traffic grew slowly at
2.2% in 2012 and 2.7% in 2013 to log 411 million RTKs. 20
Canada’s economy grew 2.0% in 2013.
10
Economic recovery continued in 2012 and 2013 with GDP
growth of 1.7% and 2.0%, respectively.
0
US-Canada transborder air cargo increased in 2013
The transborder air cargo market was 351,000 tonnes in –10
2011 and 2012. In 2013, transborder air cargo traffic grew
3.2% to 362,000 tonnes. Traffic from the United States to
–20
Canada rose 2.3% in 2012 and 3.8% in 2013. Traffic from 1990 1994 1998 2002 2006 2010 2013
Canada to the United States was down 11.4% in 2012 and
0.7% in 2013 as the economic recovery slowed in • Domestic Canada air cargo growth • Canada GDP growth
the United States.
Canada’s largest trading partner is the United States.
In 2012 and 2013, air cargo represented 4.5% of Canada’s Transborder tonnage northbound continues
to exceed that southbound
total trade with the United States in terms of value.
Northbound tonnage continued to exceed the south-
bound tonnage, as it has since the mid 1980s. Tonnes
in thousands
Commodities shipped from the United States to Canada
400
included small packages, industrial machinery, electrical
machinery, and ferrous products. Commodities shipped
from Canada to the United States included industrial 300
machinery, electrical machinery, specialized equipment,
and small packages. 200
Cargo carriers increase use of trucks 100
Reductions in the size of the passenger fleet, the
predominance of narrowbody airplanes on domestic
0
routes, and the demise of scheduled domestic air freight
1985 1989 1993 1997 2001 2005 2009 2013
airlines has reduced North American domestic air cargo
capacity, measured in available tonne-kilometers. • US to Canada • Canada to US
Continuing the trend of past years, combination carriers
continue to rely on trucks to offset the loss of domestic air Trucking and air cargo volumes Sources:
capacity that has resulted from reduced fleet size and the are slowly recovering IATA, ACMG, and ATA
shift of widebody airplanes from domestic to international
markets. Truck flights allow combination carriers to offer
service comparable to that of pure cargo carriers. Rising US domestic trucking
and air cargo volume
fuel costs have magnified the inherent cost advantages tonnage, indexed to 1990
of ground transport over air transport. 2.0
The economic recession dramatically decreased domestic
1.5
shipping demand after years of fairly steady growth.
In 2008 and 2009, both air and truck tonnage declined
significantly. The slow economic recovery that began 1.0
in 2010 is reflected in slow growth in both truck and air
tonnage through 2013. 0.5
0.0
1990 1994 1998 2002 2006 2010 2013
• (includes
US domestic trucking
for-hire and private carriage)
• US domestic air cargo
World Air Cargo Forecast 2014—2015 16North America
North America economic forecast
The US economy grew 2.8% and the Canadian economy US-Canada transborder air cargo traffic will grow
grew 1.7% in 2012. In 2013, the US and Canadian 4.4% per year
economies grew 1.9% and 2.0%, respectively.
In 2008 and 2009, the world and North American RTKs
economies suffered the most severe downturn since in billions
the Great Depression. As the economies continued to 2.0
recover slowly, the US GDP grew 2.8% in 2012 and History Forecast
1.7% in 2013, and the Canadian GDP grew 1.9% in 2012 1.5
and 2.0% in 2013. In the long term, the US GDP is forecast
to average 2.5% growth per year between 2013 and 2033, 1.0
while Canada’s GDP averages 2.4% annual growth during 0.3% growth per year
the same period. 0.5
North America air cargo forecast 0.0
Air cargo traffic in North America grew 1.9% in 2012 and 2003 2008 2013 2018 2023 2028 2033
1.1% in 2013, reflecting slow recovery from the economic Average annual growth, 2013–2033
recession. North America air traffic is projected to average
2.2% growth over the next 10 years and 2.1% over the full
• High, 5.3% •
Base, 4.4% • Low, 3.5%
20-year forecast period.
Transborder air cargo traffic is expected to exceed US domestic market will grow 2.1% per year
the growth rate of both the GDPs and the domestic
air cargo markets of the two countries. Liberalization
of air transportation agreements will foster increased
RTKs
use of relatively uncongested and accessible Canadian in billions
airports by US shippers for transport to Europe and Asia.
Expansion of passenger airline networks across North 40
America would increase transborder air cargo capacity History Forecast
and traffic. Transborder air trade between Canada and 30
1.6% growth per year
the United States is projected to grow 4.6% annually
over the next 10 years and grow at an average rate of 20
4.4% for the entire forecast period through 2033.
10
The US domestic market will maintain the dominant
share of the total North American market, with about 0
95.3% of the total RTKs. The US domestic market is 2003 2008 2013 2018 2023 2028 2033
forecast to grow at an average annual rate of 2.2% over Average annual growth, 2013–2033
the 10-year period from 2013 to 2023 and 2.1% over • High, 2.4% •
Base, 2.1% • Low, 1.8%
the full 20-year period from 2013 to 2033.
The Canadian domestic market is forecast to grow at
an average annual rate of 2.5% over the 10-year period Domestic Canada air cargo market will grow
from 2013 to 2023 and 2.3% over the full 20-year period 2.3% per year
from 2013 to 2033, roughly matching Canada’s GDP
growth. Overall, growth in both North American domestic RTKs
air cargo markets could be limited by continued expansion in billions
of trucking services in the time-definite sector.
2.0
History Forecast
1.5
1.0
–1.2% growth per year
0.5
0.0
2003 2008 2013 2018 2023 2028 2033
Average annual growth, 2013–2033
• High, 3.0% •
Base, 2.3% • Low, 1.6%
World Air Cargo Forecast 2014—2015 17You can also read